


1. Introduction
Rayleigh–Taylor (RT) instability can occur when a layer of heavier fluid is placed on top of a layer of lighter fluid in a gravitational field. The evolution of RT instability would result in the so-called RT turbulence, in which the kinetic energy of the mixed fluid layer increases at the expense of the potential energy and the spectra of velocity fluctuations cover a broad range of scales. The process is relevant in a wide variety of fields in nature and engineering, such as filamentary structures in the heating of the solar corona (Isobe et al. Reference Isobe, Miyagoshi, Shibata and Yokoyama2005), buoyancy-driven mixing in the atmosphere and oceans and in cloud formation, thermonuclear flames in type Ia supernovae (Zingale et al. Reference Zingale, Woosley, Rendleman, Day and Bell2005; Cabot & Cook Reference Cabot and Cook2006), and fuel–pusher mixing in inertial confinement fusion (Taleyarkhan et al. Reference Taleyarkhan, West, Cho, Lahey, Nigmatulin and Block2002). In addition, this system provides a fascinating fluid-mechanical framework for the study of non-stationary turbulent flows.
Despite the great importance and the long history of RT turbulence, there are still some open issues (Dimonte et al. Reference Dimonte, Youngs, Dimits, Weber, Marinak, Wunsch, Garasi, Robinson, Andrews and Ramaprabhu2004; Abarzhi Reference Abarzhi2010b ). One important issue in the field is to determine the dynamics that drive the cascades of turbulent fluctuations at small scales inside the mixing layer. This has been extensively studied in the past in both two-dimensional (2D) and three-dimensional (3D) RT systems (Dalziel, Linden & Youngs Reference Dalziel, Linden and Youngs1999; Zhou Reference Zhou2001; Wilson & Andrews Reference Wilson and Andrews2002; Chertkov Reference Chertkov2003; Celani, Mazzino & Vozella Reference Celani, Mazzino and Vozella2006; Matsumoto Reference Matsumoto2009; Boffetta et al. Reference Boffetta, Mazzino, Musacchio and Vozella2009, Reference Boffetta, Mazzino, Musacchio and Vozella2010, Reference Boffetta, de Lillo, Mazzino and Musacchio2012; Vladimirova & Chertkov Reference Vladimirova and Chertkov2009; Abarzhi Reference Abarzhi2010a ; Biferale et al. Reference Biferale, Mantovani, Sbragaglia, Scagliarini, Toschi and Tripiccione2010; Chung & Pullin Reference Chung and Pullin2010; Soulard Reference Soulard2012; Soulard & Griffond Reference Soulard and Griffond2012; Zhou Reference Zhou2013; Qiu, Liu & Zhou Reference Qiu, Liu and Zhou2014).
Specifically, in two dimensions, Chertkov (Reference Chertkov2003) argued that the traditional inverse kinetic energy and direct enstrophy cascades, long proposed for 2D Navier–Stokes turbulence (Clercx & van Heijst Reference Clercx and van Heijst2009; Boffetta & Ecke Reference Boffetta and Ecke2012), are both not realizable in 2D RT turbulence. Instead, Chertkov (Reference Chertkov2003) adopted the Bolgiano–Obukhov (BO59) scenario to resolve the small-scale spatial temporal correlations of the velocity and temperature fields. In the BO59 scenario, the buoyancy force is assumed to balance the inertial force at all scales smaller than the energy-containing scale. Taking this together with the thermal balance between the thermal transfer and dissipation rates, one obtains the BO59 scaling, i.e.
 $$\begin{eqnarray}S_{p}(r,t)\equiv \langle u_{r}(t)^{p}\rangle \sim r^{3p/5}t^{-p/5}\quad \text{and}\quad R_{p}(r,t)\equiv \langle {\it\theta}_{r}(t)^{p}\rangle \sim r^{p/5}t^{-2p/5},\end{eqnarray}$$
for
 $p\text{th}$
-order velocity and temperature structure functions,
$p\text{th}$
-order velocity and temperature structure functions,
 $S_{p}(r,t)$
and
$S_{p}(r,t)$
and
 $R_{p}(r,t)$
. Here,
$R_{p}(r,t)$
. Here,
 $u_{r}$
and
$u_{r}$
and
 ${\it\theta}_{r}$
are, respectively, the velocity and temperature increments over a separation
${\it\theta}_{r}$
are, respectively, the velocity and temperature increments over a separation
 $r$
and
$r$
and
 $\langle \cdot \rangle$
indicates a volume average inside the mixing layer. This spatiotemporal scaling (1.1) was numerically verified first by Celani et al. (Reference Celani, Mazzino and Vozella2006) and then by a scale-by-scale study of Biferale et al. (Reference Biferale, Mantovani, Sbragaglia, Scagliarini, Toschi and Tripiccione2010). Later, Zhou (Reference Zhou2013) tested quantitatively the force balance relation and revealed that the buoyancy force balances the inertial force at all scales below the integral length scale. The numerical work of Zhou (Reference Zhou2013) thus validates the basic force balance assumption of the BO59 scenario in 2D RT turbulence.
$\langle \cdot \rangle$
indicates a volume average inside the mixing layer. This spatiotemporal scaling (1.1) was numerically verified first by Celani et al. (Reference Celani, Mazzino and Vozella2006) and then by a scale-by-scale study of Biferale et al. (Reference Biferale, Mantovani, Sbragaglia, Scagliarini, Toschi and Tripiccione2010). Later, Zhou (Reference Zhou2013) tested quantitatively the force balance relation and revealed that the buoyancy force balances the inertial force at all scales below the integral length scale. The numerical work of Zhou (Reference Zhou2013) thus validates the basic force balance assumption of the BO59 scenario in 2D RT turbulence.
Besides the scaling behaviour (1.1), the scale-to-scale transport is of fundamental importance in turbulence phenomenology, especially for 2D turbulence (Boffetta & Ecke Reference Boffetta and Ecke2012). Celani et al. (Reference Celani, Mazzino and Vozella2006) first pointed out that within the so-called inertial range of 2D RT turbulence, the kinetic energy is driven by a backward transfer due to buoyancy forces while the temperature variance obeys a classical forward cascade. This was later retrieved from the Monin–Yaglom relation by the theoretical work of Soulard (Reference Soulard2012). The direction of the kinetic energy cascade was numerically investigated by Boffetta et al. (Reference Boffetta, de Lillo, Mazzino and Musacchio2012). In a 3D RT system of high aspect ratio, in which one transverse side is much smaller than the others, Boffetta et al. (Reference Boffetta, de Lillo, Mazzino and Musacchio2012) observed a transition from 3D to 2D turbulent behaviour with the increasing scale, when the height of the mixing layer becomes larger than the scale of confinement. In particular, they revealed that for scales sufficiently large the third-order velocity structure function becomes positive, signalling an upscale kinetic energy transfer at these scales.
In this paper, we want to deepen the previous understanding by focusing on the scale-to-scale energy and enstrophy transport in 2D RT turbulence. As stated above, temperature becomes a fully active scalar in 2D RT turbulence, leading to the emergence of a BO59 scaling. This is dramatically different from the 3D situation, where temperature behaves as a passive scalar and hence the Kolmogorov-like (K41) phenomenology was predicted (Chertkov Reference Chertkov2003; Soulard Reference Soulard2012) and observed (Matsumoto Reference Matsumoto2009; Boffetta et al. Reference Boffetta, Mazzino, Musacchio and Vozella2010; Boffetta & Musacchio Reference Boffetta and Musacchio2010). It is thus of great interest to investigate the spectral transfer process in such a non-K41 system, and this is why we focus on the 2D geometry in the present work.
Three considerations prompted us to perform the present investigation. First, although the direct cascade of temperature variance is theoretically expected for incompressible velocities, independently of the active/passive character of the temperature field, it has not been examined in 2D RT turbulence, to the best of our knowledge. In addition, the thermal balance plays an important role in BO59 phenomenology (Chertkov Reference Chertkov2003) and thus needs to be directly validated. Second, the enstrophy cascade has not been studied in the framework of RT turbulence, and clarifying its direction is of fundamental interest and importance. Finally, how to connect the spatiotemporal details of the spectral transfer process with coherent structures is an important yet unknown question, which cannot be approached using the traditional structure function method, as they are spatially averaged quantities.
Here, we apply the filter-space technique (FST) (Germano Reference Germano1992; Liu, Meneveau & Katz Reference Liu, Meneveau and Katz1994; Eyink Reference Eyink1995; Borue & Orszag Reference Borue and Orszag1998; Rivera et al. Reference Rivera, Daniel, Chen and Ecke2003) to our numerical data set of 2D RT turbulence. Recently, FST has received much attention in revealing the spectral transfer properties of the double cascade in 2D turbulence (Rivera et al. Reference Rivera, Daniel, Chen and Ecke2003; Chen et al. Reference Chen, Ecke, Eyink, Wang and Xiao2003, Reference Chen, Ecke, Eyink, Rivera, Wan and Xiao2006; Boffetta Reference Boffetta2007; Xiao et al. Reference Xiao, Wan, Chen and Eyink2009; Boffetta & Musacchio Reference Boffetta and Musacchio2010; Wan et al. Reference Wan, Xiao, Meneveau, Eyink and Chen2010; Kelley & Ouellette Reference Kelley and Ouellette2011; Liao & Ouellette Reference Liao and Ouellette2013, Reference Liao and Ouellette2014) and it has been further proved to be a very efficient technique even for the poorly resolved velocity field (Ni, Voth & Ouellette Reference Ni, Voth and Ouellette2014). The basic idea of FST is not difficult to understand: when small-scale components are removed from nonlinear equations by a low-pass spatial filter, some new terms arise to describe the coupling and interaction between the filtered small scales and the retained large scales. Therefore, these new terms can be used to characterize the transfer of a given quantity between scales in turbulence.
Using FST, we will show that even though a new type of phenomenology, i.e. the BO59 scenario, was theoretically predicted and indeed numerically confirmed in 2D RT turbulence, the kinetic energy is still transferred to large scales by an inverse cascade, as already reported by Boffetta et al. (Reference Boffetta, de Lillo, Mazzino and Musacchio2012), while both the thermal energy and enstrophy are driven by forward cascades. Moreover, we will reveal the local features of the three instantaneous fluxes, including their asymmetrical distributions and strong correlations at small scales. These local small-scale features correspond to the mixing and dissipation near the interfaces between hot and cold plumes.
The remainder of this paper is organized as follows. In § 2, we give a brief description of our numerical methods and filtering techniques. The results are presented and analysed in § 3, and we summarize our findings and conclude in § 4.
2. Methods
2.1. Governing equations and numerical model
We consider the spatial temporal evolution of a single component fluid in two dimensions. At the beginning (
 $t=0$
), the colder uniform fluid is placed above the hotter uniform fluid with an initial temperature jump
$t=0$
), the colder uniform fluid is placed above the hotter uniform fluid with an initial temperature jump
 ${\it\Theta}_{0}$
, and the velocity is zero everywhere. The system is then governed by the Oberbeck–Boussinesq equations
${\it\Theta}_{0}$
, and the velocity is zero everywhere. The system is then governed by the Oberbeck–Boussinesq equations
 $$\begin{eqnarray}\frac{\partial u_{j}}{\partial t}+u_{i}\frac{\partial u_{j}}{\partial x_{i}}=-\frac{\partial p}{\partial x_{j}}+{\it\nu}\frac{\partial ^{2}u_{j}}{\partial x_{i}^{2}}+{\it\beta}g{\it\delta}_{j2}{\it\theta},\end{eqnarray}$$
 $$\begin{eqnarray}\frac{\partial {\it\theta}}{\partial t}+u_{i}\frac{\partial {\it\theta}}{\partial x_{i}}={\it\kappa}\frac{\partial ^{2}{\it\theta}}{\partial x_{i}^{2}},\end{eqnarray}$$
 $$\begin{eqnarray}\frac{\partial u_{i}}{\partial x_{i}}=0,\end{eqnarray}$$
for the velocity field
 $\boldsymbol{u}(\boldsymbol{x},t)$
, the kinematic pressure field
$\boldsymbol{u}(\boldsymbol{x},t)$
, the kinematic pressure field
 $p(\boldsymbol{x},t)$
, and the temperature field
$p(\boldsymbol{x},t)$
, and the temperature field
 ${\it\theta}(\boldsymbol{x},t)$
. Here, summation is implied over double indices,
${\it\theta}(\boldsymbol{x},t)$
. Here, summation is implied over double indices,
 ${\it\delta}_{ij}$
is the Kronecker symbol,
${\it\delta}_{ij}$
is the Kronecker symbol,
 $g$
is the acceleration of gravity, and
$g$
is the acceleration of gravity, and
 ${\it\beta}$
,
${\it\beta}$
,
 ${\it\nu}$
and
${\it\nu}$
and
 ${\it\kappa}$
are, respectively, the thermal expansion coefficient, kinematic viscosity and thermal diffusivity of the working fluid. In the horizontal direction, periodic boundary conditions are used for both the velocity and temperature fields. No-slip velocity and no-flux temperature boundary conditions are adopted for the top and bottom walls.
${\it\kappa}$
are, respectively, the thermal expansion coefficient, kinematic viscosity and thermal diffusivity of the working fluid. In the horizontal direction, periodic boundary conditions are used for both the velocity and temperature fields. No-slip velocity and no-flux temperature boundary conditions are adopted for the top and bottom walls.
To reveal the properties of scale-to-scale energy and enstrophy transport, the time evolution of the velocity
 $\boldsymbol{u}$
, temperature
$\boldsymbol{u}$
, temperature
 ${\it\theta}$
, and vorticity
${\it\theta}$
, and vorticity
 ${\it\omega}$
 $(=\boldsymbol{{\rm\nabla}}\times \boldsymbol{u})$
fields is investigated by means of direct numerical simulations. The numerical method has been described in detail in Zhou (Reference Zhou2013) and Huang & Zhou (Reference Huang and Zhou2013), hence we give only its main features here. The Oberbeck–Boussinesq equations (2.1)–(2.3) are solved in their vorticity–stream function formulation on a 2D domain of height
$(=\boldsymbol{{\rm\nabla}}\times \boldsymbol{u})$
fields is investigated by means of direct numerical simulations. The numerical method has been described in detail in Zhou (Reference Zhou2013) and Huang & Zhou (Reference Huang and Zhou2013), hence we give only its main features here. The Oberbeck–Boussinesq equations (2.1)–(2.3) are solved in their vorticity–stream function formulation on a 2D domain of height
 $L_{z}$
with uniform grid spacing using a finite-difference scheme (Liu, Wang & Johnston Reference Liu, Wang and Johnston2003). An essentially compact fourth-order scheme (Weinan & Liu Reference Weinan and Liu1996) is employed to discretize the momentum equation, with the gravity term treated explicitly. The temperature transport equation (2.2) is solved using fourth-order long-stencil difference operators. The classical third-order Runge–Kutta method is applied to integrate both the momentum and temperature equations in time, and the time step is chosen to fulfil the Courant–Friedrichs–Lewy conditions.
$L_{z}$
with uniform grid spacing using a finite-difference scheme (Liu, Wang & Johnston Reference Liu, Wang and Johnston2003). An essentially compact fourth-order scheme (Weinan & Liu Reference Weinan and Liu1996) is employed to discretize the momentum equation, with the gravity term treated explicitly. The temperature transport equation (2.2) is solved using fourth-order long-stencil difference operators. The classical third-order Runge–Kutta method is applied to integrate both the momentum and temperature equations in time, and the time step is chosen to fulfil the Courant–Friedrichs–Lewy conditions.
In the present study, a spatial resolution of
 $4096\times 8193$
grid points is used to adequately resolve the small-scale properties. To assess the repeatability of the statistical quantities, a total of 32 independent realizations have been produced by adding different perturbations to the initial temperature interface. All statistical quantities studied in this paper are thus obtained by first calculating for each individual realization and then averaging over all these simulations. In all the runs,
$4096\times 8193$
grid points is used to adequately resolve the small-scale properties. To assess the repeatability of the statistical quantities, a total of 32 independent realizations have been produced by adding different perturbations to the initial temperature interface. All statistical quantities studied in this paper are thus obtained by first calculating for each individual realization and then averaging over all these simulations. In all the runs,
 $Ag=0.25$
,
$Ag=0.25$
,
 $L_{z}=1$
,
$L_{z}=1$
,
 ${\it\Theta}_{0}=1$
,
${\it\Theta}_{0}=1$
,
 ${\it\nu}={\it\kappa}=2.89\times 10^{-6}$
and
${\it\nu}={\it\kappa}=2.89\times 10^{-6}$
and
 $Pr=1$
, where
$Pr=1$
, where
 $A=({\it\beta}{\it\Theta}_{0})/2$
is the Atwood number and
$A=({\it\beta}{\it\Theta}_{0})/2$
is the Atwood number and
 $Pr={\it\nu}/{\it\kappa}$
is the Prandtl number.
$Pr={\it\nu}/{\it\kappa}$
is the Prandtl number.

Figure 1. (a) Snapshot of the instantaneous temperature field in a 4096
 $^{2}$
subregion at
$^{2}$
subregion at
 $t/{\it\tau}=4$
. Blue regions indicate the cold fluid, while red regions correspond to the hot fluid. (b) The corresponding velocity (arrows) and vorticity (colour) fields. Blue colours identify the negative values, while red colours mark the positive values.
$t/{\it\tau}=4$
. Blue regions indicate the cold fluid, while red regions correspond to the hot fluid. (b) The corresponding velocity (arrows) and vorticity (colour) fields. Blue colours identify the negative values, while red colours mark the positive values.
During the RT evolution, a layer of mixed fluid develops and grows in time. Figure 1(a) depicts a typical snapshot of the instantaneous temperature field in a 4096
 $^{2}$
subregion inside the mixing layer obtained in a late stage of RT evolution (at
$^{2}$
subregion inside the mixing layer obtained in a late stage of RT evolution (at
 $t/{\it\tau}=4$
, where
$t/{\it\tau}=4$
, where
 ${\it\tau}=\sqrt{L_{z}/Ag}$
is the characteristic time of the system). The corresponding velocity and vorticity fields are shown in figure 1(b). The growth of the mixing layer can be characterized by its height,
${\it\tau}=\sqrt{L_{z}/Ag}$
is the characteristic time of the system). The corresponding velocity and vorticity fields are shown in figure 1(b). The growth of the mixing layer can be characterized by its height,
 $h(t)$
, defined as a vertical layer where
$h(t)$
, defined as a vertical layer where
 $-0.4{\it\Theta}_{0}\leqslant \langle {\it\theta}(\boldsymbol{x},t)\rangle _{x}\leqslant 0.4{\it\Theta}_{0}$
, with
$-0.4{\it\Theta}_{0}\leqslant \langle {\it\theta}(\boldsymbol{x},t)\rangle _{x}\leqslant 0.4{\it\Theta}_{0}$
, with
 $\langle {\it\theta}(\boldsymbol{x},t)\rangle _{x}$
being the horizontally averaged temperature profiles. The temporal evolution of
$\langle {\it\theta}(\boldsymbol{x},t)\rangle _{x}$
being the horizontally averaged temperature profiles. The temporal evolution of
 $h(t)$
has been studied in our previous work (see figure 1 of Qiu et al.
Reference Qiu, Liu and Zhou2014). It is found that there is a self-similarity turbulent range
$h(t)$
has been studied in our previous work (see figure 1 of Qiu et al.
Reference Qiu, Liu and Zhou2014). It is found that there is a self-similarity turbulent range
 $1.6\lesssim t/{\it\tau}\lesssim 4$
within which
$1.6\lesssim t/{\it\tau}\lesssim 4$
within which
 $h(t)$
follows the accelerated law
$h(t)$
follows the accelerated law
 $h(t)\sim t^{2}$
and the spectra of both velocity and temperature fluctuations cover a broad range of scales. Various time-averaged global quantities and small-scale statistical properties within this self-similarity range have been reported previously (Zhou Reference Zhou2013; Qiu et al.
Reference Qiu, Liu and Zhou2014). Here, we apply a new analysis to the data and study the scale-to-scale energy and enstrophy transport using FST.
$h(t)\sim t^{2}$
and the spectra of both velocity and temperature fluctuations cover a broad range of scales. Various time-averaged global quantities and small-scale statistical properties within this self-similarity range have been reported previously (Zhou Reference Zhou2013; Qiu et al.
Reference Qiu, Liu and Zhou2014). Here, we apply a new analysis to the data and study the scale-to-scale energy and enstrophy transport using FST.
2.2. Filter-space techniques
For 2D RT turbulence, we consider the convolution,
 $$\begin{eqnarray}f^{(r)}(\boldsymbol{x})=\int G^{(r)}(\boldsymbol{x}-\boldsymbol{x}^{\prime })f(\boldsymbol{x}^{\prime })\,\text{d}\boldsymbol{x}^{\prime },\end{eqnarray}$$
as a low-pass filtered field, where
 $f=u_{i},{\it\theta}$
and
$f=u_{i},{\it\theta}$
and
 ${\it\omega}$
for velocity, temperature and vorticity, respectively,
${\it\omega}$
for velocity, temperature and vorticity, respectively,
 $G^{(r)}$
is chosen to be a round Gaussian filter, and the superscript
$G^{(r)}$
is chosen to be a round Gaussian filter, and the superscript
 $(r)$
indicates a quantity containing the information from contributions only at length scales larger than
$(r)$
indicates a quantity containing the information from contributions only at length scales larger than
 $r$
. With these filtered quantities, one can define the filtered kinetic energy to be
$r$
. With these filtered quantities, one can define the filtered kinetic energy to be
 $E^{(r)}=(u_{i}^{(r)}u_{i}^{(r)})/2$
, the thermal energy to be
$E^{(r)}=(u_{i}^{(r)}u_{i}^{(r)})/2$
, the thermal energy to be
 ${\it\Theta}^{(r)}=({\it\theta}^{(r)}{\it\theta}^{(r)})/2$
, and the enstrophy to be
${\it\Theta}^{(r)}=({\it\theta}^{(r)}{\it\theta}^{(r)})/2$
, and the enstrophy to be
 ${\it\Omega}^{(r)}=({\it\omega}^{(r)}{\it\omega}^{(r)})/2$
, and the evolution equations for
${\it\Omega}^{(r)}=({\it\omega}^{(r)}{\it\omega}^{(r)})/2$
, and the evolution equations for
 $E^{(r)}$
,
$E^{(r)}$
,
 ${\it\Theta}^{(r)}$
and
${\it\Theta}^{(r)}$
and
 ${\it\Omega}^{(r)}$
are, respectively, given by
${\it\Omega}^{(r)}$
are, respectively, given by
 $$\begin{eqnarray}\frac{\partial E^{(r)}}{\partial t}=-\frac{\partial J_{i}^{(r)}}{\partial x_{i}}-{\it\nu}\frac{\partial u_{i}^{(r)}}{\partial x_{i}}\frac{\partial u_{i}^{(r)}}{\partial x_{i}}+{\it\beta}g{\it\delta}_{i2}u_{i}^{(r)}{\it\theta}^{(r)}-{\it\Pi}^{(r)},\end{eqnarray}$$
 $$\begin{eqnarray}\frac{\partial {\it\Theta}^{(r)}}{\partial t}=-\frac{\partial K_{i}^{(r)}}{\partial x_{i}}-{\it\kappa}\frac{\partial {\it\theta}^{(r)}}{\partial x_{i}}\frac{\partial {\it\theta}^{(r)}}{\partial x_{i}}-N^{(r)}\end{eqnarray}$$
and
 $$\begin{eqnarray}\frac{\partial {\it\Omega}^{(r)}}{\partial t}=-\frac{\partial L_{i}^{(r)}}{\partial x_{i}}-{\it\nu}\frac{\partial {\it\omega}^{(r)}}{\partial x_{i}}\frac{\partial {\it\omega}^{(r)}}{\partial x_{i}}+{\it\beta}g{\it\delta}_{i1}{\it\omega}^{(r)}\frac{\partial {\it\theta}^{(r)}}{\partial x_{i}}-Z^{(r)}.\end{eqnarray}$$
Here,
 $J_{i}^{(r)}$
,
$J_{i}^{(r)}$
,
 $K_{i}^{(r)}$
and
$K_{i}^{(r)}$
and
 $L_{i}^{(r)}$
are spatial currents of
$L_{i}^{(r)}$
are spatial currents of
 $E^{(r)}$
,
$E^{(r)}$
,
 ${\it\Theta}^{(r)}$
and
${\it\Theta}^{(r)}$
and
 ${\it\Omega}^{(r)}$
, respectively, and the terms containing
${\it\Omega}^{(r)}$
, respectively, and the terms containing
 $J_{i}^{(r)}$
,
$J_{i}^{(r)}$
,
 $K_{i}^{(r)}$
and
$K_{i}^{(r)}$
and
 $L_{i}^{(r)}$
do not change the net budget, but spatially redistribute energy and enstrophy in the resolved scales, i.e the scales larger than
$L_{i}^{(r)}$
do not change the net budget, but spatially redistribute energy and enstrophy in the resolved scales, i.e the scales larger than
 $r$
. The terms proportional to
$r$
. The terms proportional to
 ${\it\nu}$
and
${\it\nu}$
and
 ${\it\kappa}$
are sink terms that denote direct dissipation of filtered energy and enstrophy due to the effects of viscosity and thermal diffusivity. The terms proportional to
${\it\kappa}$
are sink terms that denote direct dissipation of filtered energy and enstrophy due to the effects of viscosity and thermal diffusivity. The terms proportional to
 ${\it\beta}g$
are source terms that represent the kinetic energy and enstrophy injections due to the buoyancy effects. The final terms on the right-hand sides, given by
${\it\beta}g$
are source terms that represent the kinetic energy and enstrophy injections due to the buoyancy effects. The final terms on the right-hand sides, given by
 $$\begin{eqnarray}{\it\Pi}^{(r)}=-[(u_{i}u_{j})^{(r)}-u_{i}^{(r)}u_{j}^{(r)}]\frac{\partial u_{i}^{(r)}}{\partial x_{j}},\end{eqnarray}$$
 $$\begin{eqnarray}N^{(r)}=-[(u_{i}{\it\theta})^{(r)}-u_{i}^{(r)}{\it\theta}^{(r)}]\frac{\partial {\it\theta}^{(r)}}{\partial x_{i}}\end{eqnarray}$$
and
 $$\begin{eqnarray}Z^{(r)}=-[(u_{i}{\it\omega})^{(r)}-u_{i}^{(r)}{\it\omega}^{(r)}]\frac{\partial {\it\omega}^{(r)}}{\partial x_{i}},\end{eqnarray}$$
are the scale-to-scale fluxes, respectively, of
 $E^{(r)}$
,
$E^{(r)}$
,
 ${\it\Theta}^{(r)}$
and
${\it\Theta}^{(r)}$
and
 ${\it\Omega}^{(r)}$
across the filter scale
${\it\Omega}^{(r)}$
across the filter scale
 $r$
. These terms originate from the filtering of the nonlinear terms in the equations and express the coupling and interaction between the removed scales and the retained scales. With the above definitions, negative values for
$r$
. These terms originate from the filtering of the nonlinear terms in the equations and express the coupling and interaction between the removed scales and the retained scales. With the above definitions, negative values for
 ${\it\Pi}^{(r)}$
,
${\it\Pi}^{(r)}$
,
 $N^{(r)}$
and
$N^{(r)}$
and
 $Z^{(r)}$
denote the transfer of energy and enstrophy from scales
$Z^{(r)}$
denote the transfer of energy and enstrophy from scales
 ${<}r$
to scales
${<}r$
to scales
 ${>}r$
, while positive values imply the opposite transfer process.
${>}r$
, while positive values imply the opposite transfer process.

Figure 2. (a–f) Instantaneous spatial distributions of scale-to-scale (a,d) kinetic energy flux
 ${\it\Pi}^{(r)}$
, (b,e) thermal energy flux
${\it\Pi}^{(r)}$
, (b,e) thermal energy flux
 $N^{(r)}$
and (c,f) enstrophy flux
$N^{(r)}$
and (c,f) enstrophy flux
 $Z^{(r)}$
across the scales (a–c)
$Z^{(r)}$
across the scales (a–c)
 $r=1.9{\it\eta}$
and (d–f)
$r=1.9{\it\eta}$
and (d–f)
 $r=60.5{\it\eta}$
obtained from the same velocity, temperature and vorticity fields as in figure 1, with each normalized by its standard deviation. Red colours mean the transfer of energy and enstrophy to smaller length scales, while blue colours denote the transfer to larger scales. (g–i) PDFs of (g) kinetic energy
$r=60.5{\it\eta}$
obtained from the same velocity, temperature and vorticity fields as in figure 1, with each normalized by its standard deviation. Red colours mean the transfer of energy and enstrophy to smaller length scales, while blue colours denote the transfer to larger scales. (g–i) PDFs of (g) kinetic energy
 ${\it\Pi}^{(r)}$
, (h) thermal energy
${\it\Pi}^{(r)}$
, (h) thermal energy
 $N^{(f)}$
and (i) enstrophy
$N^{(f)}$
and (i) enstrophy
 $Z^{(r)}$
fluxes, normalized respectively by their standard deviations
$Z^{(r)}$
fluxes, normalized respectively by their standard deviations
 ${\it\Pi}_{sd}^{(r)}$
,
${\it\Pi}_{sd}^{(r)}$
,
 $N_{sd}^{(r)}$
and
$N_{sd}^{(r)}$
and
 $Z_{sd}^{(r)}$
, through different filter scales
$Z_{sd}^{(r)}$
, through different filter scales
 $r$
.
$r$
.
3. Results and discussion
Figure 2(a–f) shows examples of instantaneous scale-to-scale flux fields of
 ${\it\Pi}^{(r)}$
,
${\it\Pi}^{(r)}$
,
 $N^{(r)}$
and
$N^{(r)}$
and
 $Z^{(r)}$
across two different filter scales, i.e.
$Z^{(r)}$
across two different filter scales, i.e.
 $r=1.9{\it\eta}$
around the viscous scale
$r=1.9{\it\eta}$
around the viscous scale
 ${\it\eta}$
and
${\it\eta}$
and
 $r=60.5{\it\eta}$
within the inertial range. These fields are computed using the filtering procedure as described in § 2.2 from the same velocity, temperature and vorticity fields as in figure 1, and normalized by their respective standard deviations
$r=60.5{\it\eta}$
within the inertial range. These fields are computed using the filtering procedure as described in § 2.2 from the same velocity, temperature and vorticity fields as in figure 1, and normalized by their respective standard deviations
 ${\it\Pi}_{sd}^{(r)}$
,
${\it\Pi}_{sd}^{(r)}$
,
 $N_{sd}^{(r)}$
and
$N_{sd}^{(r)}$
and
 $Z_{sd}^{(r)}$
. In the figures, red regions represent positive flux, while blue regions mark negative flux. One sees that the spatial distributions of these instantaneous fluxes are strongly inhomogeneous. When a relatively small filter scale
$Z_{sd}^{(r)}$
. In the figures, red regions represent positive flux, while blue regions mark negative flux. One sees that the spatial distributions of these instantaneous fluxes are strongly inhomogeneous. When a relatively small filter scale
 $r$
is chosen, as shown in figure 2(a–c), linelike regions of intense (positive or negative) flux appear. These linelike structures seem to originate from the interfaces between hot and cold fluids, and we will return to this issue at the end of this section. The intense-flux regions become larger and smoother with increasing
$r$
is chosen, as shown in figure 2(a–c), linelike regions of intense (positive or negative) flux appear. These linelike structures seem to originate from the interfaces between hot and cold fluids, and we will return to this issue at the end of this section. The intense-flux regions become larger and smoother with increasing
 $r$
(see, e.g. figure 2
d–f), as more of the small-scale components are removed for a larger filter scale. In addition, regions of both inverse and forward cascades are observed for
$r$
(see, e.g. figure 2
d–f), as more of the small-scale components are removed for a larger filter scale. In addition, regions of both inverse and forward cascades are observed for
 ${\it\Pi}^{(r)}$
,
${\it\Pi}^{(r)}$
,
 $N^{(r)}$
and
$N^{(r)}$
and
 $Z^{(r)}$
, i.e. locally all these quantities can be transferred either to smaller scales or to larger scales.
$Z^{(r)}$
, i.e. locally all these quantities can be transferred either to smaller scales or to larger scales.

Figure 3. Skewness of (a) kinetic energy flux
 ${\it\Pi}^{(r)}$
, (b) thermal energy flux
${\it\Pi}^{(r)}$
, (b) thermal energy flux
 $N^{(r)}$
and (c) enstrophy flux
$N^{(r)}$
and (c) enstrophy flux
 $Z^{(r)}$
as a function of the normalized filter scale
$Z^{(r)}$
as a function of the normalized filter scale
 $r/{\it\eta}$
at times
$r/{\it\eta}$
at times
 $t/{\it\tau}=2$
, 3 and 4.
$t/{\it\tau}=2$
, 3 and 4.
To quantify the details of local fluxes, the probability density functions (PDFs) of kinetic energy
 ${\it\Pi}^{(r)}$
, thermal energy
${\it\Pi}^{(r)}$
, thermal energy
 $N^{(r)}$
and enstrophy
$N^{(r)}$
and enstrophy
 $Z^{(r)}$
fluxes, for three different filter scales
$Z^{(r)}$
fluxes, for three different filter scales
 $r=1.9{\it\eta}$
,
$r=1.9{\it\eta}$
,
 $14.2{\it\eta}$
and
$14.2{\it\eta}$
and
 $60.5{\it\eta}$
, are calculated and plotted in figure 2(g–i). It is seen that fluctuations of the kinetic energy flux
$60.5{\it\eta}$
, are calculated and plotted in figure 2(g–i). It is seen that fluctuations of the kinetic energy flux
 ${\it\Pi}^{(r)}$
are asymmetric, with the negative fluctuations being larger than the positive ones, and the level of this asymmetry becomes higher for smaller scales. The net gain of the negative fluctuations thus implies a mean inverse cascade of kinetic energy from small to large scales. The similar features can be revealed for the PDFs of
${\it\Pi}^{(r)}$
are asymmetric, with the negative fluctuations being larger than the positive ones, and the level of this asymmetry becomes higher for smaller scales. The net gain of the negative fluctuations thus implies a mean inverse cascade of kinetic energy from small to large scales. The similar features can be revealed for the PDFs of
 $N^{(r)}$
and
$N^{(r)}$
and
 $Z^{(r)}$
, except that the positive fluctuations of the two fluxes are both larger than their negative counterparts, suggesting a mean direct cascade of both thermal energy and enstrophy from large to small scales.
$Z^{(r)}$
, except that the positive fluctuations of the two fluxes are both larger than their negative counterparts, suggesting a mean direct cascade of both thermal energy and enstrophy from large to small scales.

Figure 4. (a) The negative value of the mean kinetic energy flux,
 $-\langle {\it\Pi}^{(r)}\rangle$
, as a function of the normalized filter scale
$-\langle {\it\Pi}^{(r)}\rangle$
, as a function of the normalized filter scale
 $r/{\it\eta}$
at times
$r/{\it\eta}$
at times
 $t/{\it\tau}=2$
, 3 and 4. Inset: the ratio
$t/{\it\tau}=2$
, 3 and 4. Inset: the ratio
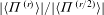 $|\langle {\it\Pi}^{(r)}\rangle |/|\langle {\it\Pi}^{(r/2)}\rangle |$
. (b) Sketch of the BO59 cascade of kinetic energy in 2D RT turbulence. The sketch is adapted from figure 4(b) of Lohse & Xia (Reference Lohse and Xia2010) for the three-dimensional Rayleigh–Bénard convection where the cascade is downscale. In the present case, kinetic energy, supplied by the buoyancy term
$|\langle {\it\Pi}^{(r)}\rangle |/|\langle {\it\Pi}^{(r/2)}\rangle |$
. (b) Sketch of the BO59 cascade of kinetic energy in 2D RT turbulence. The sketch is adapted from figure 4(b) of Lohse & Xia (Reference Lohse and Xia2010) for the three-dimensional Rayleigh–Bénard convection where the cascade is downscale. In the present case, kinetic energy, supplied by the buoyancy term
 ${\it\beta}g{\it\theta}_{r}u_{r}$
on scale
${\it\beta}g{\it\theta}_{r}u_{r}$
on scale
 $r$
, is driven by a backward transfer.
$r$
, is driven by a backward transfer.
The asymmetry of the local fluxes distribution can be quantitatively measured by their skewness. Figure 3(a–c) plots the flux skewness
 ${\it\Pi}_{skewness}^{(r)}$
,
${\it\Pi}_{skewness}^{(r)}$
,
 $N_{skewness}^{(r)}$
and
$N_{skewness}^{(r)}$
and
 $Z_{skewness}^{(r)}$
as a function of the filter scale at three different evolution times
$Z_{skewness}^{(r)}$
as a function of the filter scale at three different evolution times
 $t/{\it\tau}=2$
, 3 and 4. Three features are worthy of note: (i) all skewness of
$t/{\it\tau}=2$
, 3 and 4. Three features are worthy of note: (i) all skewness of
 ${\it\Pi}^{(r)}$
are negative, while
${\it\Pi}^{(r)}$
are negative, while
 $N_{skewness}^{(r)}$
and
$N_{skewness}^{(r)}$
and
 $Z_{skewness}^{(r)}$
are positive for most of scales; (ii) their magnitudes decrease continuously to zero with increasing filter scale
$Z_{skewness}^{(r)}$
are positive for most of scales; (ii) their magnitudes decrease continuously to zero with increasing filter scale
 $r$
, suggesting symmetric fluctuations of these fluxes at large scales; (iii) the maximum skewness magnitude occurs at small scales and this maximum increases with increasing evolution time
$r$
, suggesting symmetric fluctuations of these fluxes at large scales; (iii) the maximum skewness magnitude occurs at small scales and this maximum increases with increasing evolution time
 $t$
. Note that the present observed PDFs, especially for small scales, seem to be more asymmetric than those measured in other 2D turbulence systems (Rivera et al.
Reference Rivera, Daniel, Chen and Ecke2003; Chen et al.
Reference Chen, Ecke, Eyink, Rivera, Wan and Xiao2006; Boffetta Reference Boffetta2007). This may be attributed to the buoyancy effects in 2D RT turbulence. For example, from flow visualizations (Qiu et al.
Reference Qiu, Liu and Zhou2014) we found that small thermal structures are more likely to merge and group together to form large-scale structures, and during this process the kinetic energy, supplied by buoyancy forces at small scales, goes primarily to large scales.
$t$
. Note that the present observed PDFs, especially for small scales, seem to be more asymmetric than those measured in other 2D turbulence systems (Rivera et al.
Reference Rivera, Daniel, Chen and Ecke2003; Chen et al.
Reference Chen, Ecke, Eyink, Rivera, Wan and Xiao2006; Boffetta Reference Boffetta2007). This may be attributed to the buoyancy effects in 2D RT turbulence. For example, from flow visualizations (Qiu et al.
Reference Qiu, Liu and Zhou2014) we found that small thermal structures are more likely to merge and group together to form large-scale structures, and during this process the kinetic energy, supplied by buoyancy forces at small scales, goes primarily to large scales.
We now turn to the mean energy and enstrophy transport. Figure 4(a) shows in a log–log plot the negative value of the spatially averaged kinetic energy flux,
 $-\langle {\it\Pi}^{(r)}\rangle$
, as a function of the filter scale at times
$-\langle {\it\Pi}^{(r)}\rangle$
, as a function of the filter scale at times
 $t/{\it\tau}=2$
, 3 and 4. A negative flux of kinetic energy is observed for all times and over all scales studied, indicating that the kinetic energy is transferred, on average, to large scales, as first pointed out by Celani et al. (Reference Celani, Mazzino and Vozella2006) and theoretically expected by Soulard (Reference Soulard2012). This result agrees well with the conclusion of an upscale kinetic energy transfer, for scales sufficiently large in a quasi-2D RT system, revealed from the third-order velocity structure function by Boffetta et al. (Reference Boffetta, de Lillo, Mazzino and Musacchio2012). Taking this result together with those obtained in previous works (Celani et al.
Reference Celani, Mazzino and Vozella2006; Biferale et al.
Reference Biferale, Mantovani, Sbragaglia, Scagliarini, Toschi and Tripiccione2010; Boffetta et al.
Reference Boffetta, de Lillo, Mazzino and Musacchio2012; Zhou Reference Zhou2013), we can now try to sketch the cascade picture of kinetic energy in 2D RT turbulence. As shown in figure 4(b), the kinetic energy, injected by buoyancy term
$t/{\it\tau}=2$
, 3 and 4. A negative flux of kinetic energy is observed for all times and over all scales studied, indicating that the kinetic energy is transferred, on average, to large scales, as first pointed out by Celani et al. (Reference Celani, Mazzino and Vozella2006) and theoretically expected by Soulard (Reference Soulard2012). This result agrees well with the conclusion of an upscale kinetic energy transfer, for scales sufficiently large in a quasi-2D RT system, revealed from the third-order velocity structure function by Boffetta et al. (Reference Boffetta, de Lillo, Mazzino and Musacchio2012). Taking this result together with those obtained in previous works (Celani et al.
Reference Celani, Mazzino and Vozella2006; Biferale et al.
Reference Biferale, Mantovani, Sbragaglia, Scagliarini, Toschi and Tripiccione2010; Boffetta et al.
Reference Boffetta, de Lillo, Mazzino and Musacchio2012; Zhou Reference Zhou2013), we can now try to sketch the cascade picture of kinetic energy in 2D RT turbulence. As shown in figure 4(b), the kinetic energy, injected by buoyancy term
 ${\it\beta}g{\it\theta}_{r}u_{r}$
on scale
${\it\beta}g{\it\theta}_{r}u_{r}$
on scale
 $r$
, cascades upwards to larger scales. The BO59 scenario would require the balance
$r$
, cascades upwards to larger scales. The BO59 scenario would require the balance
 ${\it\beta}g{\it\theta}_{r}u_{r}\sim {\it\Pi}^{(r)}\sim u_{r}^{3}/r$
, which has been verified to be valid for all scales below the integral length scale (Zhou Reference Zhou2013). As indicated by Lohse & Xia (Reference Lohse and Xia2010) in their review paper, this balance implies that on scale
${\it\beta}g{\it\theta}_{r}u_{r}\sim {\it\Pi}^{(r)}\sim u_{r}^{3}/r$
, which has been verified to be valid for all scales below the integral length scale (Zhou Reference Zhou2013). As indicated by Lohse & Xia (Reference Lohse and Xia2010) in their review paper, this balance implies that on scale
 $r$
the kinetic energy obtained from smaller scales (such as from scale
$r$
the kinetic energy obtained from smaller scales (such as from scale
 $r/2$
) would be required to be negligible when compared with the energy transferred to larger scales (such as to scale
$r/2$
) would be required to be negligible when compared with the energy transferred to larger scales (such as to scale
 $2r$
), i.e.
$2r$
), i.e.
 $|\langle {\it\Pi}^{(r)}\rangle |\gg |\langle {\it\Pi}^{(r/2)}\rangle |$
. In the inset of figure 4, we plot the ratio between
$|\langle {\it\Pi}^{(r)}\rangle |\gg |\langle {\it\Pi}^{(r/2)}\rangle |$
. In the inset of figure 4, we plot the ratio between
 $|\langle {\it\Pi}^{(r)}\rangle |$
and
$|\langle {\it\Pi}^{(r)}\rangle |$
and
 $|\langle {\it\Pi}^{(r/2)}\rangle |$
. It is seen that
$|\langle {\it\Pi}^{(r/2)}\rangle |$
. It is seen that
 $|\langle {\it\Pi}^{(r)}\rangle |>\langle {\it\Pi}^{(r/2)}\rangle |$
over all scales studied and
$|\langle {\it\Pi}^{(r)}\rangle |>\langle {\it\Pi}^{(r/2)}\rangle |$
over all scales studied and
 $|\langle {\it\Pi}^{(r)}\rangle |$
is further larger than
$|\langle {\it\Pi}^{(r)}\rangle |$
is further larger than
 $4|\langle {\it\Pi}^{(r/2)}\rangle |$
for
$4|\langle {\it\Pi}^{(r/2)}\rangle |$
for
 $r\lesssim 20{\it\eta}$
.
$r\lesssim 20{\it\eta}$
.

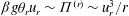
Figure 5. The mean (a) thermal energy
 $\langle N^{(r)}\rangle$
and (b) enstrophy
$\langle N^{(r)}\rangle$
and (b) enstrophy
 $\langle Z^{(r)}\rangle$
fluxes as a function of the normalized filter scale
$\langle Z^{(r)}\rangle$
fluxes as a function of the normalized filter scale
 $r/{\it\eta}$
at times
$r/{\it\eta}$
at times
 $t/{\it\tau}=2$
, 3 and 4. Inset of (a):
$t/{\it\tau}=2$
, 3 and 4. Inset of (a):
 $\langle N^{(r)}\rangle$
compensated by the spatially averaged thermal dissipation rate
$\langle N^{(r)}\rangle$
compensated by the spatially averaged thermal dissipation rate
 $\langle {\it\varepsilon}_{{\it\theta}}(t)\rangle$
.
$\langle {\it\varepsilon}_{{\it\theta}}(t)\rangle$
.
Although the kinetic energy follows an inverse cascade due to the buoyancy effects, the temperature fluctuations, governed by the temperature advection equation (2.2), are expected to cascade continuously from large to small scales (Chertkov Reference Chertkov2003; Lohse & Xia Reference Lohse and Xia2010; Soulard Reference Soulard2012). Figure 5(a) shows the spatially averaged thermal energy flux
 $\langle N^{(r)}\rangle$
as a function of filter scale at three evolution times. Positive values are definitely observed for
$\langle N^{(r)}\rangle$
as a function of filter scale at three evolution times. Positive values are definitely observed for
 $\langle N^{(r)}\rangle$
over all scales. Furthermore, the thermal energy flux seems to asymptote to a plateau value for scales
$\langle N^{(r)}\rangle$
over all scales. Furthermore, the thermal energy flux seems to asymptote to a plateau value for scales
 $r\gtrsim 30{\it\eta}$
, indicative of an inertial downscale transfer of thermal energy. Indeed, the thermal balance derived from (2.2) requires that in the inertial range the thermal transfer rate is independent of the scale and is equal to the thermal dissipation rate, i.e.
$r\gtrsim 30{\it\eta}$
, indicative of an inertial downscale transfer of thermal energy. Indeed, the thermal balance derived from (2.2) requires that in the inertial range the thermal transfer rate is independent of the scale and is equal to the thermal dissipation rate, i.e.
 $$\begin{eqnarray}\langle N^{(r)}\rangle \sim \langle {\it\varepsilon}_{{\it\theta}}\rangle ,\end{eqnarray}$$
where
 $$\begin{eqnarray}{\it\varepsilon}_{{\it\theta}}(\boldsymbol{x},t)\equiv {\it\kappa}[\partial {\it\theta}(\boldsymbol{x},t)/\partial x_{i}]^{2}\end{eqnarray}$$
is the thermal dissipation rate. To test this balance, we plot in the inset of figure 5(a) the compensated thermal energy flux
 $\langle N^{(r)}\rangle /\langle {\it\varepsilon}_{{\it\theta}}\rangle$
. After compensation, the three data sets gained at different times of RT evolution collapse almost perfectly on top of each other. And there is a reasonably extended range (over roughly one decade) through which the compensated thermal energy flux has an approximately constant value of unity. The presented results thus validate the thermal balance in 2D RT turbulence.
$\langle N^{(r)}\rangle /\langle {\it\varepsilon}_{{\it\theta}}\rangle$
. After compensation, the three data sets gained at different times of RT evolution collapse almost perfectly on top of each other. And there is a reasonably extended range (over roughly one decade) through which the compensated thermal energy flux has an approximately constant value of unity. The presented results thus validate the thermal balance in 2D RT turbulence.
The spatial average of the enstrophy flux is plotted as a function of filter scale in figure 5(b). Again, positive values are seen for
 $\langle Z^{(r)}\rangle$
for all times and scales, indicating a direct cascade of enstrophy to small scales. This is qualitatively consistent with previous observations in other 2D flow systems (Rivera et al.
Reference Rivera, Daniel, Chen and Ecke2003; Boffetta Reference Boffetta2007; Liao & Ouellette Reference Liao and Ouellette2014). Notice that the maximum of the enstrophy flux occurs at the scale
$\langle Z^{(r)}\rangle$
for all times and scales, indicating a direct cascade of enstrophy to small scales. This is qualitatively consistent with previous observations in other 2D flow systems (Rivera et al.
Reference Rivera, Daniel, Chen and Ecke2003; Boffetta Reference Boffetta2007; Liao & Ouellette Reference Liao and Ouellette2014). Notice that the maximum of the enstrophy flux occurs at the scale
 $r\simeq 10{\it\eta}$
, around which both the kinetic and thermal energy fluxes experience a transition, as shown in figures 4(a) and 5(a), respectively. The scale
$r\simeq 10{\it\eta}$
, around which both the kinetic and thermal energy fluxes experience a transition, as shown in figures 4(a) and 5(a), respectively. The scale
 $r\simeq 10{\it\eta}$
is the approximate cross-scale between the inertial range and the viscous range (Zhou Reference Zhou2013). Therefore, the observed different behaviours of
$r\simeq 10{\it\eta}$
is the approximate cross-scale between the inertial range and the viscous range (Zhou Reference Zhou2013). Therefore, the observed different behaviours of
 ${\it\Pi}^{(r)}$
,
${\it\Pi}^{(r)}$
,
 $N^{(r)}$
and
$N^{(r)}$
and
 $Z^{(r)}$
above and below this scale are attributed to different statistical properties of these fluxes within different (i.e. inertial and viscous) ranges. Note also that, unlike other 2D turbulence systems, the energy and enstrophy cascades in 2D RT turbulence seem to operate in the same range of scales. This is because in 2D RT system the kinetic energy and enstrophy are simultaneously injected by buoyancy forces at all scales smaller than the energy-containing scale.
$Z^{(r)}$
above and below this scale are attributed to different statistical properties of these fluxes within different (i.e. inertial and viscous) ranges. Note also that, unlike other 2D turbulence systems, the energy and enstrophy cascades in 2D RT turbulence seem to operate in the same range of scales. This is because in 2D RT system the kinetic energy and enstrophy are simultaneously injected by buoyancy forces at all scales smaller than the energy-containing scale.

Figure 6. Cross-correlation coefficients (a)
 $C_{{\it\Pi}N}(r)$
, (b)
$C_{{\it\Pi}N}(r)$
, (b)
 $C_{{\it\Pi}Z}(r)$
and (c)
$C_{{\it\Pi}Z}(r)$
and (c)
 $C_{NZ}(r)$
as a function of the normalized filter scale
$C_{NZ}(r)$
as a function of the normalized filter scale
 $r/{\it\eta}$
at times
$r/{\it\eta}$
at times
 $t/{\it\tau}=2$
, 3 and 4.
$t/{\it\tau}=2$
, 3 and 4.
Next, we study the correlations among the three local fluxes. To explore this question, we calculated the cross-correlation coefficients
 $C_{{\it\Pi}N}(r)$
between
$C_{{\it\Pi}N}(r)$
between
 ${\it\Pi}^{(r)}$
and
${\it\Pi}^{(r)}$
and
 $N^{(r)}$
,
$N^{(r)}$
,
 $C_{{\it\Pi}Z}(r)$
between
$C_{{\it\Pi}Z}(r)$
between
 ${\it\Pi}^{(r)}$
and
${\it\Pi}^{(r)}$
and
 $Z^{(r)}$
, and
$Z^{(r)}$
, and
 $C_{NZ}(r)$
between
$C_{NZ}(r)$
between
 $N^{(r)}$
and
$N^{(r)}$
and
 $Z^{(r)}$
, respectively, according to
$Z^{(r)}$
, respectively, according to
 $$\begin{eqnarray}C_{{\it\Pi}N}(r)=\frac{\langle ({\it\Pi}^{(r)}-\langle {\it\Pi}^{(r)}\rangle )(N^{(r)}-\langle N^{(r)}\rangle )\rangle }{{\it\Pi}_{sd}^{(r)}N_{sd}^{(r)}},\end{eqnarray}$$
 $$\begin{eqnarray}C_{{\it\Pi}Z}(r)=\frac{\langle ({\it\Pi}^{(r)}-\langle {\it\Pi}^{(r)}\rangle )(Z^{(r)}-\langle Z^{(r)}\rangle )\rangle }{{\it\Pi}_{sd}^{(r)}Z_{sd}^{(r)}}\end{eqnarray}$$
and
 $$\begin{eqnarray}C_{NZ}(r)=\frac{\langle (N^{(r)}-\langle N^{(r)}\rangle )(Z^{(r)}-\langle Z^{(r)}\rangle )\rangle }{N_{sd}^{(r)}Z_{sd}^{(r)}}.\end{eqnarray}$$
The dependence of the coefficients
 $C_{{\it\Pi}N}(r)$
,
$C_{{\it\Pi}N}(r)$
,
 $C_{{\it\Pi}Z}(r)$
and
$C_{{\it\Pi}Z}(r)$
and
 $C_{NZ}(r)$
on the filter scale at three evolution times is reported in figure 6(a–c). One sees that the coefficients are negative for
$C_{NZ}(r)$
on the filter scale at three evolution times is reported in figure 6(a–c). One sees that the coefficients are negative for
 $C_{{\it\Pi}N}(r)$
and
$C_{{\it\Pi}N}(r)$
and
 $C_{{\it\Pi}Z}(r)$
, but positive for
$C_{{\it\Pi}Z}(r)$
, but positive for
 $C_{NZ}(r)$
. In general, the correlation is higher for smaller
$C_{NZ}(r)$
. In general, the correlation is higher for smaller
 $r$
than that for larger
$r$
than that for larger
 $r$
. At small scales, the three fluxes are strongly correlated or anticorrelated. This can also be revealed by figure 2(a–c), from which it is easy to see that the scale-to-scale flux fields of
$r$
. At small scales, the three fluxes are strongly correlated or anticorrelated. This can also be revealed by figure 2(a–c), from which it is easy to see that the scale-to-scale flux fields of
 ${\it\Pi}^{(r)}$
,
${\it\Pi}^{(r)}$
,
 $N^{(r)}$
and
$N^{(r)}$
and
 $Z^{(r)}$
across the filter scale
$Z^{(r)}$
across the filter scale
 $r=1.9{\it\eta}$
share similar linelike patterns, i.e. the intense energy and enstrophy fluxes appear nearly in the same physical regions. At large scales, however, the strength of the correlation becomes weaker.
$r=1.9{\it\eta}$
share similar linelike patterns, i.e. the intense energy and enstrophy fluxes appear nearly in the same physical regions. At large scales, however, the strength of the correlation becomes weaker.
The interpretation of the strong correlations among the three fluxes at small scales relies on the understanding of those linelike structures, as shown in figure 1(a–c). Unlike the spotty structures in other 2D turbulence systems, these structures are quite unique in 2D RT turbulence, suggesting that they may be related to some flow structures in our system. In two dimensions, a line can be used to separate an area into two distinct regions. In figure 1(a), the two regions can be physically interpreted as hot and cold plumes, and those lines seem to mark their interfaces. Figure 7(a) shows the instantaneous field of
 ${\it\varepsilon}_{{\it\theta}}(\boldsymbol{x},t)$
calculated from the temperature field in figure 1(a). For comparison, we replot the figure 2(b) as figure 7(b). The red lines in figure 7(a) indicating large temperature gradients are very similar to those of the intense fluxes in figure 7(b). More quantitatively, the cross-correlation coefficient between the two reaches 0.8. This is a very large correlation considering that
${\it\varepsilon}_{{\it\theta}}(\boldsymbol{x},t)$
calculated from the temperature field in figure 1(a). For comparison, we replot the figure 2(b) as figure 7(b). The red lines in figure 7(a) indicating large temperature gradients are very similar to those of the intense fluxes in figure 7(b). More quantitatively, the cross-correlation coefficient between the two reaches 0.8. This is a very large correlation considering that
 ${\it\varepsilon}_{{\it\theta}}$
is a positively defined quantity and the other one is not. Together with the large correlations among the three fluxes, it suggests that, at small scales, the intense fluxes are all located near the interfaces of cold and hot plumes.
${\it\varepsilon}_{{\it\theta}}$
is a positively defined quantity and the other one is not. Together with the large correlations among the three fluxes, it suggests that, at small scales, the intense fluxes are all located near the interfaces of cold and hot plumes.
In RT turbulence, the kinetic energy is siphoned from the potential energy by means of the invasion of cold and hot plumes into each other. The interface between the two will therefore evolve from a single horizontal straight line at the beginning to complex topological structures with large tortuosity. In the interfacial regions, the magnitudes of the various quantities, such as the temperature gradient as well as the shear between the two plumes moving in the opposite directions, should be large. Since it happens in a thin layer near the interface, these structures dominate the small-scale energy and enstrophy fluxes, and thus correspond to the strong correlations among the three fluxes. Based on this, the linelike structures may be used as a new indication of the time evolution of the mixing in RT turbulence.

Figure 7. (a) Snapshot of the instantaneous field of thermal dissipation rate
 ${\it\varepsilon}_{{\it\theta}}(\boldsymbol{x},t)$
, corresponding to the temperature field in figure 1(a). Red colours indicate positions of large temperature gradients, and thus can be used to detect the interfaces between hot and cold fluids. (b) Replot of figure 2(b) for comparison.
${\it\varepsilon}_{{\it\theta}}(\boldsymbol{x},t)$
, corresponding to the temperature field in figure 1(a). Red colours indicate positions of large temperature gradients, and thus can be used to detect the interfaces between hot and cold fluids. (b) Replot of figure 2(b) for comparison.

Figure 8. (a) Temporal evolution of the mean kinetic energy dissipation rate
 $\langle {\it\varepsilon}_{u}\rangle$
and its conditional value
$\langle {\it\varepsilon}_{u}\rangle$
and its conditional value
 $\langle {\it\varepsilon}_{u}\mid {\it\theta}=0\rangle$
calculated at the interfaces. The two vertical dashed lines mark the self-similarity turbulent range
$\langle {\it\varepsilon}_{u}\mid {\it\theta}=0\rangle$
calculated at the interfaces. The two vertical dashed lines mark the self-similarity turbulent range
 $1.6\lesssim t/{\it\tau}\lesssim 4$
and the solid straight lines are the temporal scalings
$1.6\lesssim t/{\it\tau}\lesssim 4$
and the solid straight lines are the temporal scalings
 $t^{-0.2}$
and
$t^{-0.2}$
and
 $t^{-0.5}$
for reference. (b) Temporal evolution of the mean thermal dissipation rate
$t^{-0.5}$
for reference. (b) Temporal evolution of the mean thermal dissipation rate
 $\langle {\it\varepsilon}_{{\it\theta}}\rangle$
and its conditional value
$\langle {\it\varepsilon}_{{\it\theta}}\rangle$
and its conditional value
 $\langle {\it\varepsilon}_{{\it\theta}}\mid {\it\theta}=0\rangle$
calculated at the interfaces. The solid straight lines are the temporal scalings
$\langle {\it\varepsilon}_{{\it\theta}}\mid {\it\theta}=0\rangle$
calculated at the interfaces. The solid straight lines are the temporal scalings
 $t^{-0.66}$
and
$t^{-0.66}$
and
 $t^{-1}$
for reference.
$t^{-1}$
for reference.
As a preliminary try, we consider here the time behaviours of
 $\langle {\it\varepsilon}_{u}(\boldsymbol{x},t)\mid {\it\theta}=0\rangle$
and
$\langle {\it\varepsilon}_{u}(\boldsymbol{x},t)\mid {\it\theta}=0\rangle$
and
 $\langle {\it\varepsilon}_{{\it\theta}}(\boldsymbol{x},t)\mid {\it\theta}=0\rangle$
, the conditional average of the kinetic energy and thermal dissipation rates at the interfaces (i.e. the contour of
$\langle {\it\varepsilon}_{{\it\theta}}(\boldsymbol{x},t)\mid {\it\theta}=0\rangle$
, the conditional average of the kinetic energy and thermal dissipation rates at the interfaces (i.e. the contour of
 ${\it\theta}=0$
), where
${\it\theta}=0$
), where
 $$\begin{eqnarray}{\it\varepsilon}_{u}(\boldsymbol{x},t)\equiv {\it\nu}[\partial u_{j}(\boldsymbol{x},t)/\partial x_{i}]^{2}\end{eqnarray}$$
is the kinetic energy dissipation rate. Figures 8(a,b) show, respectively, the temporal evolution of
 $\langle {\it\varepsilon}_{u}\mid {\it\theta}=0\rangle$
and
$\langle {\it\varepsilon}_{u}\mid {\it\theta}=0\rangle$
and
 $\langle {\it\varepsilon}_{{\it\theta}}\mid {\it\theta}=0\rangle$
. In the figures, we also plot the mean kinetic energy and thermal dissipation rates,
$\langle {\it\varepsilon}_{{\it\theta}}\mid {\it\theta}=0\rangle$
. In the figures, we also plot the mean kinetic energy and thermal dissipation rates,
 $\langle {\it\varepsilon}_{u}\rangle$
and
$\langle {\it\varepsilon}_{u}\rangle$
and
 $\langle {\it\varepsilon}_{{\it\theta}}\rangle$
, for comparison. As expected, one sees that both
$\langle {\it\varepsilon}_{{\it\theta}}\rangle$
, for comparison. As expected, one sees that both
 $\langle {\it\varepsilon}_{u}\mid {\it\theta}=0\rangle$
and
$\langle {\it\varepsilon}_{u}\mid {\it\theta}=0\rangle$
and
 $\langle {\it\varepsilon}_{{\it\theta}}\mid {\it\theta}=0\rangle$
are much larger than
$\langle {\it\varepsilon}_{{\it\theta}}\mid {\it\theta}=0\rangle$
are much larger than
 $\langle {\it\varepsilon}_{u}\rangle$
and
$\langle {\it\varepsilon}_{u}\rangle$
and
 $\langle {\it\varepsilon}_{{\it\theta}}\rangle$
, respectively, indicating intense velocity and temperature gradients at the interfaces. In the BO59 framework, Chertkov (Reference Chertkov2003) predicted
$\langle {\it\varepsilon}_{{\it\theta}}\rangle$
, respectively, indicating intense velocity and temperature gradients at the interfaces. In the BO59 framework, Chertkov (Reference Chertkov2003) predicted
 $\langle {\it\varepsilon}_{u}\rangle \sim t^{-0.5}$
and
$\langle {\it\varepsilon}_{u}\rangle \sim t^{-0.5}$
and
 $\langle {\it\varepsilon}_{{\it\theta}}\rangle \sim t^{-1}$
. It is seen that in the self-similarity turbulent regime, as indicated by the two vertical dashed lines in figure 8, both
$\langle {\it\varepsilon}_{{\it\theta}}\rangle \sim t^{-1}$
. It is seen that in the self-similarity turbulent regime, as indicated by the two vertical dashed lines in figure 8, both
 $\langle {\it\varepsilon}_{u}\rangle$
and
$\langle {\it\varepsilon}_{u}\rangle$
and
 $\langle {\it\varepsilon}_{{\it\theta}}\rangle$
follow the theoretical predications well; this is also consistent with our previous results (Zhou Reference Zhou2013). On the other hand,
$\langle {\it\varepsilon}_{{\it\theta}}\rangle$
follow the theoretical predications well; this is also consistent with our previous results (Zhou Reference Zhou2013). On the other hand,
 $\langle {\it\varepsilon}_{u}\mid {\it\theta}=0\rangle$
and
$\langle {\it\varepsilon}_{u}\mid {\it\theta}=0\rangle$
and
 $\langle {\it\varepsilon}_{{\it\theta}}\mid {\it\theta}=0\rangle$
obtained at the interfaces both exhibit a less steep temporal scaling. The best fits to the data in the self-similarity range yield
$\langle {\it\varepsilon}_{{\it\theta}}\mid {\it\theta}=0\rangle$
obtained at the interfaces both exhibit a less steep temporal scaling. The best fits to the data in the self-similarity range yield
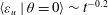 $\langle {\it\varepsilon}_{u}\mid {\it\theta}=0\rangle \sim t^{-0.2}$
and
$\langle {\it\varepsilon}_{u}\mid {\it\theta}=0\rangle \sim t^{-0.2}$
and
 $\langle {\it\varepsilon}_{{\it\theta}}\mid {\it\theta}=0\rangle \sim t^{-0.66}$
. As
$\langle {\it\varepsilon}_{{\it\theta}}\mid {\it\theta}=0\rangle \sim t^{-0.66}$
. As
 $\langle {\it\varepsilon}_{u}\mid {\it\theta}=0\rangle$
and
$\langle {\it\varepsilon}_{u}\mid {\it\theta}=0\rangle$
and
 $\langle {\it\varepsilon}_{{\it\theta}}\mid {\it\theta}=0\rangle$
are obtained from the most intense dissipation events, these new scaling laws may be attributed to the intermittent effects, as identified and discussed previously by Celani et al. (Reference Celani, Mazzino and Vozella2006), Biferale et al. (Reference Biferale, Mantovani, Sbragaglia, Scagliarini, Toschi and Tripiccione2010), and Zhou (Reference Zhou2013).
$\langle {\it\varepsilon}_{{\it\theta}}\mid {\it\theta}=0\rangle$
are obtained from the most intense dissipation events, these new scaling laws may be attributed to the intermittent effects, as identified and discussed previously by Celani et al. (Reference Celani, Mazzino and Vozella2006), Biferale et al. (Reference Biferale, Mantovani, Sbragaglia, Scagliarini, Toschi and Tripiccione2010), and Zhou (Reference Zhou2013).
4. Conclusion
To conclude, we have analysed the energy and enstrophy transfer in 2D RT turbulence, by means of direct numerical simulations. Using FST, the fluxes of kinetic energy, thermal energy, and enstrophy across any given filter scale
 $r$
are determined. With this information and the results obtained in previous works (Celani et al.
Reference Celani, Mazzino and Vozella2006; Biferale et al.
Reference Biferale, Mantovani, Sbragaglia, Scagliarini, Toschi and Tripiccione2010; Boffetta et al.
Reference Boffetta, de Lillo, Mazzino and Musacchio2012; Zhou Reference Zhou2013), the cascade picture, in an averaged sense, of 2D RT turbulence can now be sketched as follows: on one hand, buoyancy forces provide kinetic energy on scale
$r$
are determined. With this information and the results obtained in previous works (Celani et al.
Reference Celani, Mazzino and Vozella2006; Biferale et al.
Reference Biferale, Mantovani, Sbragaglia, Scagliarini, Toschi and Tripiccione2010; Boffetta et al.
Reference Boffetta, de Lillo, Mazzino and Musacchio2012; Zhou Reference Zhou2013), the cascade picture, in an averaged sense, of 2D RT turbulence can now be sketched as follows: on one hand, buoyancy forces provide kinetic energy on scale
 $r$
, and then the kinetic energy is driven by an inverse cascade (figure 4
a and Boffetta et al.
Reference Boffetta, de Lillo, Mazzino and Musacchio2012), due to the merging and grouping of buoyant structures. On the other hand, the temperature/density fluctuations follow a forward cascade from large to small scales (figure 5
a). In the so-called inertial range, the above cascade processes are governed by two balances: one is the kinetic balance that the transport rate of the kinetic energy equals the buoyancy term (Zhou Reference Zhou2013), and the other is the scalar balance that the transfer rate of the temperature/density variance is scale-independent and is equal to its dissipation rate (inset of figure 5
a). With these two balances, the BO59 scaling (1.1a,b
) is yielded.
$r$
, and then the kinetic energy is driven by an inverse cascade (figure 4
a and Boffetta et al.
Reference Boffetta, de Lillo, Mazzino and Musacchio2012), due to the merging and grouping of buoyant structures. On the other hand, the temperature/density fluctuations follow a forward cascade from large to small scales (figure 5
a). In the so-called inertial range, the above cascade processes are governed by two balances: one is the kinetic balance that the transport rate of the kinetic energy equals the buoyancy term (Zhou Reference Zhou2013), and the other is the scalar balance that the transfer rate of the temperature/density variance is scale-independent and is equal to its dissipation rate (inset of figure 5
a). With these two balances, the BO59 scaling (1.1a,b
) is yielded.
The statistical properties of the instantaneous local fluxes are also studied. It is found that locally there are regions of both inverse and direct cascades for all the three fluxes with asymmetric distributions. The fluctuations of
 ${\it\Pi}^{(r)}$
,
${\it\Pi}^{(r)}$
,
 $N^{(r)}$
and
$N^{(r)}$
and
 $Z^{(r)}$
are more asymmetrically distributed at small scales than those at large scales. The analysis of the cross-correlation coefficients among the three local fluxes reveals that at small scales there is a strong correlation or anticorrelation between any two fluxes and the strength of this correlation or anticorrelation becomes weaker with increasing filter scale. These small-scale features are attributed to the mixing and dissipation near the interfaces between hot and cold plumes.
$Z^{(r)}$
are more asymmetrically distributed at small scales than those at large scales. The analysis of the cross-correlation coefficients among the three local fluxes reveals that at small scales there is a strong correlation or anticorrelation between any two fluxes and the strength of this correlation or anticorrelation becomes weaker with increasing filter scale. These small-scale features are attributed to the mixing and dissipation near the interfaces between hot and cold plumes.
Acknowledgements
We thank N. T. Ouellette for helpful comments and discussions. This work was supported by Natural Science Foundation of China under grant nos. 11222222, 11572185 (Q.Z.), 11202122 (Y.-X.H.), 11272196 (Z.-M.L.) and 11332006 (Y.-L.L.), Innovation Program of Shanghai Municipal Education Commission under grant no. 13YZ008, Shanghai Shuguang Project under grant no. 13SG40, and Program for New Century Excellent Talents in University under grant no. NCET-13. Q.Z. wishes to acknowledge support given to him from the organization department of the CPC Central Committee through National Program for Support of Top-notch Young Professionals.


