


1 Introduction
In the design process of offshore structures, slamming wave load calculations play an important role. Several engineering models are commonly used in the industry as an extension to standard force models such as Morison (Reference Morison1953) and Rainey (Reference Rainey1989, Reference Rainey1995, Reference Rainey2007). One of the most commonly used approaches for vertical circular cylinders is based on the work of Goda, Haranaka & Kitahata (Reference Goda, Haranaka and Kitahata1966) formulated as
 $$\begin{eqnarray}F_{I}(t)=\unicode[STIX]{x1D706}\unicode[STIX]{x1D702}_{b}\unicode[STIX]{x03C0}\unicode[STIX]{x1D70C}RC^{2}\left(1-\frac{C}{R}t\right),\end{eqnarray}$$
where
 $\unicode[STIX]{x1D706}\unicode[STIX]{x1D702}_{b}$
is the height of the impact zone,
$\unicode[STIX]{x1D706}\unicode[STIX]{x1D702}_{b}$
is the height of the impact zone,
 $\unicode[STIX]{x1D702}_{b}$
is the crest height of the breaking wave and
$\unicode[STIX]{x1D702}_{b}$
is the crest height of the breaking wave and
 $\unicode[STIX]{x1D706}$
is defined as the curling factor. Further,
$\unicode[STIX]{x1D706}$
is defined as the curling factor. Further,
 $C$
is the wave celerity,
$C$
is the wave celerity,
 $\unicode[STIX]{x1D70C}$
is the fluid density and
$\unicode[STIX]{x1D70C}$
is the fluid density and
 $R$
is the cylinder’s radius. The time interval of this equation is from 0 to
$R$
is the cylinder’s radius. The time interval of this equation is from 0 to
 $R/C$
. The breaker front is vertical and moves with the celerity of the wave. Very often the maximum inline force per unit height is described as a function of a slamming coefficient,
$R/C$
. The breaker front is vertical and moves with the celerity of the wave. Very often the maximum inline force per unit height is described as a function of a slamming coefficient,
 $C_{s}$
, where
$C_{s}$
, where
 $F_{I,max}=C_{s}\unicode[STIX]{x1D70C}RV^{2}$
. In the formulation of Goda et al. (Reference Goda, Haranaka and Kitahata1966),
$F_{I,max}=C_{s}\unicode[STIX]{x1D70C}RV^{2}$
. In the formulation of Goda et al. (Reference Goda, Haranaka and Kitahata1966),
 $C_{s}=\unicode[STIX]{x03C0}$
, according to the von Karman (Reference von Karman1929) model, which does not account for the deformation of the free surface. The latter causes the immersion of the cylinder to occur earlier, resulting in a decrease of the impact duration and an increase of the impact peak force/pressure. This behaviour is included in the model of Wagner (Reference Wagner1932), who developed a solution for the peak pressure during the impact of a solid object on a still fluid in two dimensions. The solution predicted a slamming coefficient of
$C_{s}=\unicode[STIX]{x03C0}$
, according to the von Karman (Reference von Karman1929) model, which does not account for the deformation of the free surface. The latter causes the immersion of the cylinder to occur earlier, resulting in a decrease of the impact duration and an increase of the impact peak force/pressure. This behaviour is included in the model of Wagner (Reference Wagner1932), who developed a solution for the peak pressure during the impact of a solid object on a still fluid in two dimensions. The solution predicted a slamming coefficient of
 $C_{s}=2\unicode[STIX]{x03C0}$
. Later Cointe & Armand (Reference Cointe and Armand1987) applied the method of matched asymptotic expansions to solve the boundary condition problem of the velocity potential and free surface of the flow around the structure. The model provides the same result as Wagner’s theory for the slamming coefficient,
$C_{s}=2\unicode[STIX]{x03C0}$
. Later Cointe & Armand (Reference Cointe and Armand1987) applied the method of matched asymptotic expansions to solve the boundary condition problem of the velocity potential and free surface of the flow around the structure. The model provides the same result as Wagner’s theory for the slamming coefficient,
 $C_{s}=2\unicode[STIX]{x03C0}$
. The study further included the decay of the impact force on the cylinder in time. More recently, Wienke & Oumeraci (Reference Wienke and Oumeraci2005) proposed a new formulation which extends the model of Wagner (Reference Wagner1932) for the total duration of the impact in three dimensions. Hallowell, Myers & Arwade (Reference Hallowell, Myers and Arwade2016) used measurements from a site test campaign of the Blyth wind farm off the coast of England to categorize and identify breaking waves and quantify the variability of their impact loads. The accuracy of several breaking wave criteria and impact force models were analysed, and the impact force models were shown to represent the measurements with varying accuracy and to be sensitive to modelling assumptions. Their results showed that the mudline moments calculated using the model developed by Goda et al. (Reference Goda, Haranaka and Kitahata1966) were most consistent with the measurements; however, this consistency was claimed to be site- and structure-specific.
$C_{s}=2\unicode[STIX]{x03C0}$
. The study further included the decay of the impact force on the cylinder in time. More recently, Wienke & Oumeraci (Reference Wienke and Oumeraci2005) proposed a new formulation which extends the model of Wagner (Reference Wagner1932) for the total duration of the impact in three dimensions. Hallowell, Myers & Arwade (Reference Hallowell, Myers and Arwade2016) used measurements from a site test campaign of the Blyth wind farm off the coast of England to categorize and identify breaking waves and quantify the variability of their impact loads. The accuracy of several breaking wave criteria and impact force models were analysed, and the impact force models were shown to represent the measurements with varying accuracy and to be sensitive to modelling assumptions. Their results showed that the mudline moments calculated using the model developed by Goda et al. (Reference Goda, Haranaka and Kitahata1966) were most consistent with the measurements; however, this consistency was claimed to be site- and structure-specific.
Since the duration of the impact on the structure is usually very short, the time-integrated force impulse may be sufficient for an accurate response prediction. The pressure impulse theory is relevant in such cases. Further, the theory gives the spatial distribution of the pressure impulse over the structure. In Cooker & Peregrine (Reference Cooker and Peregrine1995), the pressure impulse theory was derived for wave impact on a vertical wall in two dimensions. A parametric study was performed to identify the dependence on the ratio of the breaker height to total depth and the length of the breaker. Later this model was extended to three dimensions by Wood & Peregrine (Reference Wood and Peregrine1998). The model was not validated against measurements or other more comprehensive models. The approach was extended to more complicated configurations such as breaking wave impact on a wall by Iafrati & Korobkin (Reference Iafrati and Korobkin2006), impact on an elastic wall by Korobkin & Malenica (Reference Korobkin and Malenica2007), wave impact on perforated structures by Korobkin (Reference Korobkin2008) and breaking wave impact on permeable barriers by Cooker (Reference Cooker2013). In a more general form, Scolan & Korobkin (Reference Scolan and Korobkin2001) addressed the three-dimensional (3D) problem of blunt-body impact onto the free surface of an ideal incompressible liquid within the Wagner theory. The method provides a wide range of exact analytical solutions in the case of an elliptic contact region. They suggested to use strip theory for elongated cases such as cylinders. The work did not include validations against experiments. Korobkin & Scolan (Reference Korobkin and Scolan2006) addressed the same problem with asymptotic analysis of the linearized Wagner problem for close-to-axisymmetric bodies such as cones and pyramids. Korobkin (Reference Korobkin2004) reviewed the models available for the prediction of the hydrodynamic pressure distribution and the force on a body entering liquid. Particular attention was given to analytical models based on the velocity potential given by the classical Wagner theory. He modified the Wagner solution by including the nonlinear terms in the Bernoulli equation and compared the results between the original and modified Wagner solution to the original and modified Logvinovich model (Logvinovich & Yakimov Reference Logvinovich, Yakimov, Sedov and Stepanov1973; Korobkin & Malenica Reference Korobkin and Malenica2005). He validated these results against simulations and experiments and concluded that the modified Logvinovich model is well suited for practical calculations of impact loads acting on an arbitrary blunt body. Most recently Chatjigeorgiou et al. (Reference Chatjigeorgiou, Korobkin, Cooker and Ave2016b ) presented a 3D steep wave impact onto a vertical plate with finite width and obtained the time variation of the slamming load on a vertical cylinder by combination with strip theory. Later they validated the model against laboratory data for a 3D wave impact onto a rectangular column with the wave front resembling the face of a steep wave (Chatjigeorgiou, Cooker & Korobkin Reference Chatjigeorgiou, Cooker and Korobkin2016a ). In a further paper, Chatjigeorgiou, Korobkin & Cooker (Reference Chatjigeorgiou, Korobkin and Cooker2017) treated the 3D hydrodynamic slamming problem on a vertical cylinder as a set of two-dimensional (2D) problems in the vertical direction. They found a closed-form solution for the time-dependent potential, the pressure impulse, the shape of the wave front and the slamming force as a function of time. More thorough reviews of the previous work can be found in the papers presented by Peregrine (Reference Peregrine2003), Faltinsen, Landrini & Greco (Reference Faltinsen, Landrini and Greco2004) and Dias & Ghidaglia (Reference Dias and Ghidaglia2018).
In the present paper a 3D pressure impulse model for a wave impact of a wedge-shaped geometry is derived. A 3D box generalization of the 2D wall model of Cooker & Peregrine (Reference Cooker and Peregrine1995) is presented in § 2 along with an axisymmetric impact model. The effective parameters of the 3D impact model are investigated with reference to the behaviour of the two simpler models. The role of the maximum impact angle, and of the model parameters, is discussed and a comparison to a realistic numerical wave impact is presented in § 3. A summary and further discussion of the model applications are presented in § 4.
2 Mathematical formulation
The peak pressure of an impulse event can vary substantially between impacts with the same nominal characteristics. Linked to the overall momentum conservation, however, the time integral of the pressure – the pressure impulse – can be expected to show a smaller variability. Hence, Cooker & Peregrine (Reference Cooker and Peregrine1995) suggested that pressure impulse is a better quantity to model an impact event than the peak pressure. Further, for impacts of small duration relative to the structure’s natural frequency, the response is governed by the impulse rather than the detailed time history of force and pressure. The pressure impulse
 $P$
is defined by
$P$
is defined by
 $$\begin{eqnarray}P(\boldsymbol{x})=\int _{t_{b}}^{t_{a}}p(\boldsymbol{x},t)\,\text{d}t,\end{eqnarray}$$
where
 $t_{b}$
and
$t_{b}$
and
 $t_{a}$
are the times immediately before and after impact, respectively, and pressure is denoted by
$t_{a}$
are the times immediately before and after impact, respectively, and pressure is denoted by
 $p$
. The speed of the fluid is often much less than the speed of sound, so the incompressibility assumption can be applied. In addition, the effect of viscosity is negligible. Further, since the impact occurs in a very short time, the convective terms and gravity are negligible, so Euler’s equation reads
$p$
. The speed of the fluid is often much less than the speed of sound, so the incompressibility assumption can be applied. In addition, the effect of viscosity is negligible. Further, since the impact occurs in a very short time, the convective terms and gravity are negligible, so Euler’s equation reads
 $$\begin{eqnarray}\frac{\unicode[STIX]{x2202}\boldsymbol{u}}{\unicode[STIX]{x2202}t}=-\frac{1}{\unicode[STIX]{x1D70C}}\unicode[STIX]{x1D735}p.\end{eqnarray}$$
After integration with respect to time through the impact interval, the equation becomes
 $$\begin{eqnarray}\boldsymbol{u}_{a}-\boldsymbol{u}_{b}=-\frac{1}{\unicode[STIX]{x1D70C}}\unicode[STIX]{x1D735}P.\end{eqnarray}$$
This equation can be rewritten by taking the divergence of both sides, which leads to the Laplace equation for the pressure impulse
 $\unicode[STIX]{x1D6FB}^{2}P=0$
. Following Cooker & Peregrine (Reference Cooker and Peregrine1995), the pressure impulse field satisfies the boundary conditions
$\unicode[STIX]{x1D6FB}^{2}P=0$
. Following Cooker & Peregrine (Reference Cooker and Peregrine1995), the pressure impulse field satisfies the boundary conditions
 $P=0$
at a free surface,
$P=0$
at a free surface,
 $\unicode[STIX]{x2202}P/\unicode[STIX]{x2202}n=0$
at a stationary rigid-body boundary and
$\unicode[STIX]{x2202}P/\unicode[STIX]{x2202}n=0$
at a stationary rigid-body boundary and
 $\unicode[STIX]{x2202}P/\unicode[STIX]{x2202}n=\unicode[STIX]{x1D70C}u_{nb}$
where the liquid meets a solid boundary during impact. Here
$\unicode[STIX]{x2202}P/\unicode[STIX]{x2202}n=\unicode[STIX]{x1D70C}u_{nb}$
where the liquid meets a solid boundary during impact. Here
 $u_{nb}$
is the fluid impact velocity projected to the normal direction of the boundary.
$u_{nb}$
is the fluid impact velocity projected to the normal direction of the boundary.
2.1 Impact of an idealized finite-width wave on a vertical wall
The simplest case in three dimensions is to have a box-shaped volume of fluid impacting a flat vertical wall. The domain and the boundaries for this problem are shown in figure 1. The flat plate is located at
 $x=0$
. At the time of impact, the fluid touches the wall in the region
$x=0$
. At the time of impact, the fluid touches the wall in the region
 $-H\leqslant z\leqslant -\unicode[STIX]{x1D707}H$
and hits the wall with normal velocity
$-H\leqslant z\leqslant -\unicode[STIX]{x1D707}H$
and hits the wall with normal velocity
 $U$
in the region
$U$
in the region
 $-\unicode[STIX]{x1D707}H\leqslant z\leqslant 0$
. Note that
$-\unicode[STIX]{x1D707}H\leqslant z\leqslant 0$
. Note that
 $\unicode[STIX]{x1D707}$
is defined as the ratio of the height of the impacting fluid to the whole fluid height until the bed. Hence, it is slightly different from the curling factor,
$\unicode[STIX]{x1D707}$
is defined as the ratio of the height of the impacting fluid to the whole fluid height until the bed. Hence, it is slightly different from the curling factor,
 $\unicode[STIX]{x1D706}$
, which is associated with the crest height. Other limits of the domain are
$\unicode[STIX]{x1D706}$
, which is associated with the crest height. Other limits of the domain are
 $0\leqslant x\leqslant b$
and
$0\leqslant x\leqslant b$
and
 $-W\leqslant y\leqslant W$
. The boundary conditions on the flat plate and on the bed are shown in figure 1. On the other boundaries,
$-W\leqslant y\leqslant W$
. The boundary conditions on the flat plate and on the bed are shown in figure 1. On the other boundaries,
 $P=0$
must be satisfied.
$P=0$
must be satisfied.

Figure 1. Definition sketch for 3D block impact on a flat plate.

Figure 2. Pressure impulse of a finite-width fluid block on a flat vertical plate at
 $x=0$
for
$x=0$
for
 $\unicode[STIX]{x1D707}=0.5$
,
$\unicode[STIX]{x1D707}=0.5$
,
 $W/H=0.5$
and
$W/H=0.5$
and
 $b/H=1$
.
$b/H=1$
.
The Laplace equation is solved using separation of variables and Fourier series analysis. The solution can be written as
 $$\begin{eqnarray}\displaystyle & & \displaystyle P(x,y,z)\nonumber\\ \displaystyle & & \displaystyle \quad =\mathop{\sum }_{m=1}^{\infty }\mathop{\sum }_{n=1}^{\infty }\left(A_{mn}\cos \left(L_{m}\frac{y}{W}\right)\sin \left(k_{n}\frac{z}{H}\right)\frac{\displaystyle \sinh \left(\sqrt{L_{m}^{2}\left(\frac{H}{W}\right)^{2}+k_{n}^{2}}\left(\frac{b}{H}-\frac{x}{H}\right)\right)}{\displaystyle \cosh \left(\sqrt{L_{m}^{2}\left(HW\right)^{2}+k_{n}^{2}}bH\right)}\right),\nonumber\\ \displaystyle & & \displaystyle\end{eqnarray}$$
where
 $L_{m}=(m-1/2)\unicode[STIX]{x03C0}$
,
$L_{m}=(m-1/2)\unicode[STIX]{x03C0}$
,
 $k_{n}=(n-1/2)\unicode[STIX]{x03C0}$
and
$k_{n}=(n-1/2)\unicode[STIX]{x03C0}$
and
 $$\begin{eqnarray}A_{mn}=4\unicode[STIX]{x1D70C}UH\frac{(\cos (k_{n}\unicode[STIX]{x1D707})-1)\sin (L_{m})}{\displaystyle k_{n}L_{m}\sqrt{L_{m}^{2}\left(HW\right)^{2}+k_{n}^{2}}}.\end{eqnarray}$$
Similar results for the same problem were presented by Wood & Peregrine (Reference Wood and Peregrine1998). For
 $W\rightarrow \infty$
, (2.4) and (2.5) reduce to the 2D solution of Cooker & Peregrine (Reference Cooker and Peregrine1995). Additional to the 2D properties, (2.4) has an extra dependence on the second horizontal direction through the term
$W\rightarrow \infty$
, (2.4) and (2.5) reduce to the 2D solution of Cooker & Peregrine (Reference Cooker and Peregrine1995). Additional to the 2D properties, (2.4) has an extra dependence on the second horizontal direction through the term
 $\cos (L_{m}y/W)$
and the coefficients in the hyperbolic functions. The normalized pressure impulse field can thus be seen to depend on three dimensionless parameters as follows:
$\cos (L_{m}y/W)$
and the coefficients in the hyperbolic functions. The normalized pressure impulse field can thus be seen to depend on three dimensionless parameters as follows:
 $$\begin{eqnarray}\frac{P}{\unicode[STIX]{x1D70C}UH}\left(\frac{x}{H},\frac{y}{W},\frac{z}{H}\right)=f\left(\frac{b}{H},\unicode[STIX]{x1D707},\frac{W}{H}\right).\end{eqnarray}$$
These parameters are the relative length of the impacting block
 $b/H$
, the relative height of the impact zone
$b/H$
, the relative height of the impact zone
 $\unicode[STIX]{x1D707}$
and the relative width of the block
$\unicode[STIX]{x1D707}$
and the relative width of the block
 $W/H$
. As an example, the result for
$W/H$
. As an example, the result for
 $\unicode[STIX]{x1D707}=0.5$
,
$\unicode[STIX]{x1D707}=0.5$
,
 $W/H=0.5$
and
$W/H=0.5$
and
 $b/H=1$
is shown in figure 2. The pressure impulse extends in the middle of the block to lower heights than
$b/H=1$
is shown in figure 2. The pressure impulse extends in the middle of the block to lower heights than
 $-\unicode[STIX]{x1D707}H$
, which means that part of the pressure impulse is carried by the bottom fluid. Convergence was achieved in this case with 30 components in each summation in (2.4).
$-\unicode[STIX]{x1D707}H$
, which means that part of the pressure impulse is carried by the bottom fluid. Convergence was achieved in this case with 30 components in each summation in (2.4).
The dependence of the pressure impulse on the width of the impacting block of fluid is shown in figure 3 at the depth of
 $z/H=-\unicode[STIX]{x1D707}H/2$
as a function of
$z/H=-\unicode[STIX]{x1D707}H/2$
as a function of
 $y/W$
. The pressure impulse is maximum at the centre of the plate (
$y/W$
. The pressure impulse is maximum at the centre of the plate (
 $y/W=0$
) and increases with width until the 2D limit is reached as marked by the solid line. At the middle of the plate this is achieved for
$y/W=0$
) and increases with width until the 2D limit is reached as marked by the solid line. At the middle of the plate this is achieved for
 $W/H\approx 2$
in the present case and is gradually achieved for larger
$W/H\approx 2$
in the present case and is gradually achieved for larger
 $W/H$
values towards the sides of the wall. In figure 4 the pressure impulse at the vertical centreline of the plate is plotted as a function of height for the same parameters. As the width of the fluid box is increased to
$W/H$
values towards the sides of the wall. In figure 4 the pressure impulse at the vertical centreline of the plate is plotted as a function of height for the same parameters. As the width of the fluid box is increased to
 $W/H=10$
, the results of the box impact approach the 2D case results.
$W/H=10$
, the results of the box impact approach the 2D case results.

Figure 3. Pressure impulse as a function of width of the impacting block, plotted at the mid-height on the flat wall (
 $z/H=-\unicode[STIX]{x1D707}/2$
and
$z/H=-\unicode[STIX]{x1D707}/2$
and
 $x/H=0$
).
$x/H=0$
).

Figure 4. Pressure impulse as a function of width of the impacting block, plotted at the mid-width on the flat wall (
 $y/W=0$
and
$y/W=0$
and
 $x/H=0$
).
$x/H=0$
).
2.2 Impact of an idealized all-directional wave on a cylinder
With the insight from the 3D box impact problem, we proceed to impacts on cylinders. First the simple case of an axisymmetric impact is studied. An idealized wave front hits the cylinder from all directions with a normal velocity of
 $U$
in the vertical zone
$U$
in the vertical zone
 $-\unicode[STIX]{x1D707}H\leqslant z\leqslant 0$
. Below this zone, in
$-\unicode[STIX]{x1D707}H\leqslant z\leqslant 0$
. Below this zone, in
 $-H\leqslant z\leqslant -\unicode[STIX]{x1D707}H$
, the fluid touches the cylinder at impact. The outer radius of the impacting fluid is denoted by
$-H\leqslant z\leqslant -\unicode[STIX]{x1D707}H$
, the fluid touches the cylinder at impact. The outer radius of the impacting fluid is denoted by
 $b$
, and the cylinder radius by
$b$
, and the cylinder radius by
 $a$
. A sketch of the domain and the boundary conditions is provided in figure 5. The boundaries on the walls are shown in the figure, while at all other boundaries
$a$
. A sketch of the domain and the boundary conditions is provided in figure 5. The boundaries on the walls are shown in the figure, while at all other boundaries
 $P=0$
.
$P=0$
.

Figure 5. Definition sketch for axisymmetric impact on a vertical cylinder.

Figure 6. Pressure impulse of an axisymmetric wave impact on a cylinder with increasing
 $a/b$
.
$a/b$
.
The Laplace equation is solved in the cylindrical coordinate system to yield
 $$\begin{eqnarray}P=\mathop{\sum }_{n=1}^{\infty }\left(A_{n}\frac{\displaystyle \text{I}_{0}\left(k_{n}\frac{r}{H}\right)+\unicode[STIX]{x1D6FC}_{n}\text{K}_{0}\left(k_{n}\frac{r}{H}\right)}{\displaystyle \unicode[STIX]{x2202}_{r}\left(\text{I}_{0}\left(k_{n}rH\right)+\unicode[STIX]{x1D6FC}_{n}\text{K}_{0}\left(k_{n}rH\right)\right)_{r=a}}\sin \left(k_{n}\frac{z}{H}\right)\right),\end{eqnarray}$$
where
 $k_{n}=(n-1/2)\unicode[STIX]{x03C0}$
,
$k_{n}=(n-1/2)\unicode[STIX]{x03C0}$
,
 $\unicode[STIX]{x2202}_{r}$
is the partial derivative with regards to
$\unicode[STIX]{x2202}_{r}$
is the partial derivative with regards to
 $r$
,
$r$
,
 $\text{I}_{0}$
and
$\text{I}_{0}$
and
 $\text{K}_{0}$
are the first and second kind modified Bessel functions of zeroth order, and
$\text{K}_{0}$
are the first and second kind modified Bessel functions of zeroth order, and
 $$\begin{eqnarray}A_{n}=2\unicode[STIX]{x1D70C}U\frac{1-\cos (k_{n}\unicode[STIX]{x1D707})}{k_{n}}.\end{eqnarray}$$
The modified Bessel functions
 $\text{I}_{0}$
and
$\text{I}_{0}$
and
 $\text{K}_{0}$
were chosen for the radial dependence due to their non-oscillatory variation, which is suitable for the impact problem. A linear combination of the two functions is used here to assure compliance with the boundary condition
$\text{K}_{0}$
were chosen for the radial dependence due to their non-oscillatory variation, which is suitable for the impact problem. A linear combination of the two functions is used here to assure compliance with the boundary condition
 $P=0$
at
$P=0$
at
 $r=b$
using the multiplier
$r=b$
using the multiplier
 $$\begin{eqnarray}\unicode[STIX]{x1D6FC}_{n}=\frac{-\text{I}_{0}(k_{n}b/H)}{\text{K}_{0}(k_{n}b/H)}.\end{eqnarray}$$
From (2.7), the non-dimensional pressure impulse on the cylinder wall depends on the relative outer radius of the impacting fluid
 $b/H$
, the relative height of the impact region
$b/H$
, the relative height of the impact region
 $\unicode[STIX]{x1D707}$
and the ratio of the inner to outer radius
$\unicode[STIX]{x1D707}$
and the ratio of the inner to outer radius
 $a/b$
:
$a/b$
:
 $$\begin{eqnarray}\frac{P}{\unicode[STIX]{x1D70C}UH}\left(\frac{r}{H},\frac{z}{H}\right)=f\left(\frac{b}{H},\unicode[STIX]{x1D707},\frac{a}{b}\right).\end{eqnarray}$$
The axisymmetric pressure impulse solution is shown in figure 6 for
 $b/H=1$
,
$b/H=1$
,
 $\unicode[STIX]{x1D707}=0.5$
and varying radius ratio. When the inner radius is increased, the cylinder wall absorbs a larger amount of incident momentum and the pressure impulse increases. For the present values of
$\unicode[STIX]{x1D707}=0.5$
and varying radius ratio. When the inner radius is increased, the cylinder wall absorbs a larger amount of incident momentum and the pressure impulse increases. For the present values of
 $\unicode[STIX]{x1D707}$
and
$\unicode[STIX]{x1D707}$
and
 $b/H$
, it reaches a maximum at
$b/H$
, it reaches a maximum at
 $a/b$
around 0.7 and decreases thereafter due to the reduced initial momentum for
$a/b$
around 0.7 and decreases thereafter due to the reduced initial momentum for
 $a/b\rightarrow 1$
.
$a/b\rightarrow 1$
.
The axisymmetric solution can be compared to the 2D wall case of Cooker & Peregrine. Good similarity can be expected when the radius of the cylinder is so large that the effect of curvature,
 $1/a$
, is negligible. The pressure impulse field for the axisymmetric case of
$1/a$
, is negligible. The pressure impulse field for the axisymmetric case of
 $b/H=10.4$
,
$b/H=10.4$
,
 $a/b=0.96$
and the wall case of
$a/b=0.96$
and the wall case of
 $b/H=0.4$
are compared in figure 7. For both cases
$b/H=0.4$
are compared in figure 7. For both cases
 $\unicode[STIX]{x1D707}=0.5$
. A very similar appearance of the two fields can be seen.
$\unicode[STIX]{x1D707}=0.5$
. A very similar appearance of the two fields can be seen.

Figure 7. Pressure impulse (with
 $\unicode[STIX]{x1D707}=0.5$
) for (a) an axisymmetric cylinder (
$\unicode[STIX]{x1D707}=0.5$
) for (a) an axisymmetric cylinder (
 $b/H=10.4$
and
$b/H=10.4$
and
 $a/b=0.96$
) and (b) a 2D vertical wall
$a/b=0.96$
) and (b) a 2D vertical wall
 $(b/H=0.4)$
.
$(b/H=0.4)$
.

Figure 8. Definition sketch for wedge-shaped 3D impact on a vertical cylinder.
2.3 Impact of an idealized wave on a cylinder with azimuth limits
We now proceed to the 3D model of impact on a cylinder. The domain of the problem and its boundary conditions are shown in figure 8. In this case, the fluid is wedge-shaped in the azimuthal direction with limits
 $-\unicode[STIX]{x1D703}_{max}\leqslant \unicode[STIX]{x1D703}\leqslant \unicode[STIX]{x1D703}_{max}$
. In the lower region
$-\unicode[STIX]{x1D703}_{max}\leqslant \unicode[STIX]{x1D703}\leqslant \unicode[STIX]{x1D703}_{max}$
. In the lower region
 $-H\leqslant z\leqslant -\unicode[STIX]{x1D707}H$
the fluid touches the cylinder, while in the upper region
$-H\leqslant z\leqslant -\unicode[STIX]{x1D707}H$
the fluid touches the cylinder, while in the upper region
 $-\unicode[STIX]{x1D707}H\leqslant z\leqslant 0$
it impacts on the cylinder with velocity
$-\unicode[STIX]{x1D707}H\leqslant z\leqslant 0$
it impacts on the cylinder with velocity
 $U\cos (\unicode[STIX]{x1D703})$
in the negative radial direction. At boundaries
$U\cos (\unicode[STIX]{x1D703})$
in the negative radial direction. At boundaries
 $\unicode[STIX]{x1D703}=\pm \unicode[STIX]{x1D703}_{max}$
,
$\unicode[STIX]{x1D703}=\pm \unicode[STIX]{x1D703}_{max}$
,
 $z=0$
and
$z=0$
and
 $r=b$
, the condition
$r=b$
, the condition
 $P=0$
is satisfied. The Laplace equation is solved in the cylindrical coordinate system to yield
$P=0$
is satisfied. The Laplace equation is solved in the cylindrical coordinate system to yield
 $$\begin{eqnarray}P=\mathop{\sum }_{m=1}^{\infty }\mathop{\sum }_{n=1}^{\infty }\left(A_{mn}\cos \left(\frac{L_{m}\unicode[STIX]{x1D703}}{\unicode[STIX]{x1D703}_{max}}\right)\sin \left(k_{n}\frac{z}{H}\right)\frac{\displaystyle \text{I}_{q_{m}}\left(k_{n}\frac{r}{H}\right)+\unicode[STIX]{x1D6FC}_{mn}\text{K}_{q_{m}}\left(k_{n}\frac{r}{H}\right)}{\displaystyle \unicode[STIX]{x2202}_{r}\left(\text{I}_{q_{m}}\left(k_{n}rH\right)+\unicode[STIX]{x1D6FC}_{mn}\text{K}_{q_{m}}\left(k_{n}rH\right)\right)_{r=a}}\right),\end{eqnarray}$$
where
 $L_{m}=(m-1/2)\unicode[STIX]{x03C0}$
,
$L_{m}=(m-1/2)\unicode[STIX]{x03C0}$
,
 $k_{n}=(n-1/2)\unicode[STIX]{x03C0}$
and
$k_{n}=(n-1/2)\unicode[STIX]{x03C0}$
and
 $q_{m}=L_{m}/\unicode[STIX]{x1D703}_{max}$
is the order of the Bessel functions. Further
$q_{m}=L_{m}/\unicode[STIX]{x1D703}_{max}$
is the order of the Bessel functions. Further
 $\unicode[STIX]{x1D6FC}_{mn}$
is chosen such that
$\unicode[STIX]{x1D6FC}_{mn}$
is chosen such that
 $P=0$
at
$P=0$
at
 $r=b$
,
$r=b$
,
 $$\begin{eqnarray}\unicode[STIX]{x1D6FC}_{mn}=\frac{-\text{I}_{q_{m}}(k_{n}b/H)}{\text{K}_{q_{m}}(k_{n}b/H)},\end{eqnarray}$$
and
 $$\begin{eqnarray}A_{mn}=\frac{2\unicode[STIX]{x1D70C}U}{\unicode[STIX]{x1D703}_{max}}\frac{1-\cos (k_{n}\unicode[STIX]{x1D707})}{k_{n}}\int _{-\unicode[STIX]{x1D703}_{max}}^{\unicode[STIX]{x1D703}_{max}}\cos (\unicode[STIX]{x1D703})\cos \left(\frac{L_{m}\unicode[STIX]{x1D703}}{\unicode[STIX]{x1D703}_{max}}\right)\text{d}\unicode[STIX]{x1D703}\,\text{d}z.\end{eqnarray}$$
In this case the non-dimensional pressure impulse depends on the maximum impact angle,
 $\unicode[STIX]{x1D703}_{max}$
, in addition to the parameters already defined for the axisymmetric impact:
$\unicode[STIX]{x1D703}_{max}$
, in addition to the parameters already defined for the axisymmetric impact:
 $$\begin{eqnarray}\frac{P}{\unicode[STIX]{x1D70C}UH}\left(\frac{r}{H},\unicode[STIX]{x1D703},\frac{z}{H}\right)=f\left(\frac{b}{H},\unicode[STIX]{x1D707},\frac{a}{b},\unicode[STIX]{x1D703}_{max}\right).\end{eqnarray}$$

Figure 9. Dimensionless pressure impulse on the inner cylinder, at
 $\unicode[STIX]{x1D703}=0$
, plotted as a function of
$\unicode[STIX]{x1D703}=0$
, plotted as a function of
 $z/H$
, (a) for several values of
$z/H$
, (a) for several values of
 $b/H$
and (b) for several values of
$b/H$
and (b) for several values of
 $\unicode[STIX]{x1D707}$
.
$\unicode[STIX]{x1D707}$
.
A parameter study was conducted to investigate the effect of the different parameters. The dependence on the relative length of the impacting wave
 $b/H$
is shown in figure 9(a) for
$b/H$
is shown in figure 9(a) for
 $\unicode[STIX]{x1D703}=0$
,
$\unicode[STIX]{x1D703}=0$
,
 $\unicode[STIX]{x1D707}=0.5$
,
$\unicode[STIX]{x1D707}=0.5$
,
 $a/H=0.1$
and
$a/H=0.1$
and
 $\unicode[STIX]{x1D703}_{max}=\unicode[STIX]{x03C0}/4$
. As
$\unicode[STIX]{x1D703}_{max}=\unicode[STIX]{x03C0}/4$
. As
 $b/H$
increases up to 0.35, the pressure impulse increases in all heights and then remains unchanged. This shows an asymptotic behaviour for increasing
$b/H$
increases up to 0.35, the pressure impulse increases in all heights and then remains unchanged. This shows an asymptotic behaviour for increasing
 $b/H$
. The same asymptotic behaviour was observed by Cooker & Peregrine (Reference Cooker and Peregrine1995) for the 2D flat-plate case. We next investigate the dependence on the height of the impact region,
$b/H$
. The same asymptotic behaviour was observed by Cooker & Peregrine (Reference Cooker and Peregrine1995) for the 2D flat-plate case. We next investigate the dependence on the height of the impact region,
 $\unicode[STIX]{x1D707}$
, in figure 9(b). A width of
$\unicode[STIX]{x1D707}$
, in figure 9(b). A width of
 $b/H=0.3$
is used and
$b/H=0.3$
is used and
 $\unicode[STIX]{x1D707}$
,
$\unicode[STIX]{x1D707}$
,
 $\unicode[STIX]{x1D703}_{max}$
and
$\unicode[STIX]{x1D703}_{max}$
and
 $a/H$
are identical to the values in figure 9(a). By the increase of
$a/H$
are identical to the values in figure 9(a). By the increase of
 $\unicode[STIX]{x1D707}$
, the peak of the pressure impulse moves down as expected and increases the pressure impulse. The results from this figure are also consistent with the ones shown in figure 5 of Cooker & Peregrine (Reference Cooker and Peregrine1995).
$\unicode[STIX]{x1D707}$
, the peak of the pressure impulse moves down as expected and increases the pressure impulse. The results from this figure are also consistent with the ones shown in figure 5 of Cooker & Peregrine (Reference Cooker and Peregrine1995).
The variation with respect to the relative inner radius
 $a/b$
is investigated in figure 10(a) for
$a/b$
is investigated in figure 10(a) for
 $\unicode[STIX]{x1D707}=0.5$
,
$\unicode[STIX]{x1D707}=0.5$
,
 $\unicode[STIX]{x1D703}_{max}=\unicode[STIX]{x03C0}/4$
and
$\unicode[STIX]{x1D703}_{max}=\unicode[STIX]{x03C0}/4$
and
 $b/H=0.3$
. The pressure impulse increases as
$b/H=0.3$
. The pressure impulse increases as
 $a/b$
increases up to
$a/b$
increases up to
 $a/b=0.5$
. For
$a/b=0.5$
. For
 $a/b$
values larger than 0.67, the pressure impulse decreases similarly to the case shown for the axisymmetric impact. First, the area on the cylinder that absorbs incident momentum increases as the radius increases. Thereby the pressure impulse increases. However, at the same time the volume of fluid that impacts on the cylinder decreases, so within the interval
$a/b$
values larger than 0.67, the pressure impulse decreases similarly to the case shown for the axisymmetric impact. First, the area on the cylinder that absorbs incident momentum increases as the radius increases. Thereby the pressure impulse increases. However, at the same time the volume of fluid that impacts on the cylinder decreases, so within the interval
 $0.5<a/b<0.7$
, a value of
$0.5<a/b<0.7$
, a value of
 $a/b$
occurs for which the distribution possesses a global maximum in pressure impulse.
$a/b$
occurs for which the distribution possesses a global maximum in pressure impulse.
The effect of the width of the fluid domain (in azimuth) is shown in figure 10(b) for
 $a/b=0.33$
,
$a/b=0.33$
,
 $b/H=0.3$
and
$b/H=0.3$
and
 $\unicode[STIX]{x1D707}=0.5$
. As the width of the domain increases, the pressure impulse also increases. This increase can be explained by the increase in the total impacting volume of fluid
$\unicode[STIX]{x1D707}=0.5$
. As the width of the domain increases, the pressure impulse also increases. This increase can be explained by the increase in the total impacting volume of fluid
 $V=(b^{2}-a^{2})\unicode[STIX]{x1D703}_{max}\unicode[STIX]{x1D707}H$
as
$V=(b^{2}-a^{2})\unicode[STIX]{x1D703}_{max}\unicode[STIX]{x1D707}H$
as
 $\unicode[STIX]{x1D703}_{max}$
increases. This conclusion is similar to the increased pressure impulse of the 3D impact of the fluid on the flat vertical plate of figure 3. The rate of increase of the pressure impulse becomes gradually smaller as the azimuthal angle limit increases until it reaches a maximum at
$\unicode[STIX]{x1D703}_{max}$
increases. This conclusion is similar to the increased pressure impulse of the 3D impact of the fluid on the flat vertical plate of figure 3. The rate of increase of the pressure impulse becomes gradually smaller as the azimuthal angle limit increases until it reaches a maximum at
 $\unicode[STIX]{x1D703}_{max}=\unicode[STIX]{x03C0}/2$
.
$\unicode[STIX]{x1D703}_{max}=\unicode[STIX]{x03C0}/2$
.

Figure 10. Dimensionless pressure impulse on the inner cylinder plotted (a) as a function of
 $z/H$
, at
$z/H$
, at
 $\unicode[STIX]{x1D703}=0$
, for several values of
$\unicode[STIX]{x1D703}=0$
, for several values of
 $a/b$
, and (b) as function of
$a/b$
, and (b) as function of
 $\unicode[STIX]{x1D703}/\unicode[STIX]{x1D703}_{max}$
, at
$\unicode[STIX]{x1D703}/\unicode[STIX]{x1D703}_{max}$
, at
 $z=-0.25~\unicode[STIX]{x03BC}\text{H}$
, for several values of
$z=-0.25~\unicode[STIX]{x03BC}\text{H}$
, for several values of
 $\unicode[STIX]{x1D703}_{max}$
.
$\unicode[STIX]{x1D703}_{max}$
.
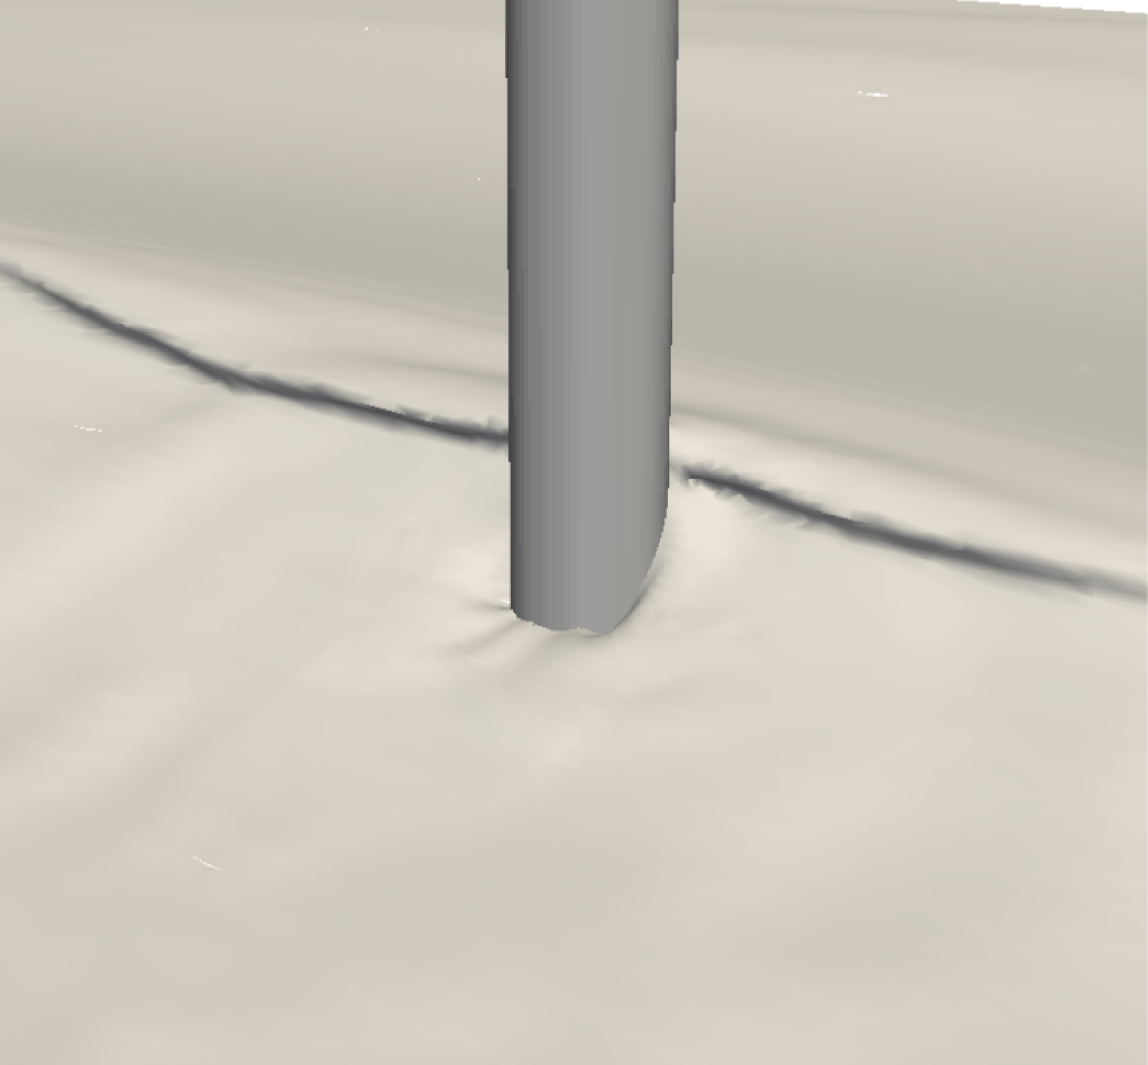
Figure 11. Snapshot of the wave impact on the cylinder from CFD model results.
3 Validation against computational fluid dynamics results
We now validate the model against a realistic wave impact. The chosen wave is a phase- and direction-focused wave group for a sea state of
 $H_{s}=9.5$
m and
$H_{s}=9.5$
m and
 $T_{p}=12$
s in 33 m water depth with a cylinder diameter of
$T_{p}=12$
s in 33 m water depth with a cylinder diameter of
 $7$
m. Computational fluid dynamics (CFD) results at scale
$7$
m. Computational fluid dynamics (CFD) results at scale
 $1:50$
for this impact were presented by Ghadirian, Bredmose & Dixen (Reference Ghadirian, Bredmose and Dixen2016). A snapshot of the wave at the time of impact is shown in figure 11. The impacting water spreads to the sides, upwards and downwards after impacting the monopile. Here
$1:50$
for this impact were presented by Ghadirian, Bredmose & Dixen (Reference Ghadirian, Bredmose and Dixen2016). A snapshot of the wave at the time of impact is shown in figure 11. The impacting water spreads to the sides, upwards and downwards after impacting the monopile. Here
 $b$
is chosen as the distance from the cylinder centre to the back of the wave crest at the still-water level. Further
$b$
is chosen as the distance from the cylinder centre to the back of the wave crest at the still-water level. Further
 $\unicode[STIX]{x1D707}$
is determined from the height of the breaker. Hereby
$\unicode[STIX]{x1D707}$
is determined from the height of the breaker. Hereby
 $b/H=0.64$
,
$b/H=0.64$
,
 $\unicode[STIX]{x1D707}=0.12$
and
$\unicode[STIX]{x1D707}=0.12$
and
 $a/b=0.13$
, with
$a/b=0.13$
, with
 $\unicode[STIX]{x1D703}_{max}$
left as the only free parameter.
$\unicode[STIX]{x1D703}_{max}$
left as the only free parameter.
In figure 12 the inline force time series from the CFD model is presented. The slamming contribution to the force time series is shown by the blue shading and the time instant of the snapshot of figure 11 is marked by the red star. The area of the blue region is the same as the integrated pressure impulse on the cylinder wall after projection to the inline direction.
As a necessary step to isolate the impact force impulse from the contribution induced by the non-impacting parts of the wave, the pressure on the cylinder from just before the impact was subtracted from all the time instants in the CFD results. Then the time integral from the beginning of the impact until the end was calculated. The resulting pressure impulse is shown in figure 13(a). The largest pressure impulse is observed below
 $z/H=-0.05$
at
$z/H=-0.05$
at
 $\unicode[STIX]{x1D703}/\unicode[STIX]{x1D703}_{max}=0$
and the pressure impulse extends down to
$\unicode[STIX]{x1D703}/\unicode[STIX]{x1D703}_{max}=0$
and the pressure impulse extends down to
 $z/H=-0.2$
. Note that, despite the subtraction of the pressures just before impact, some of the extended impulse may be caused by the kinematics of the wave itself and not necessarily the slamming impact. It is observed that the pressure impulse decreases to around zero at close to
$z/H=-0.2$
. Note that, despite the subtraction of the pressures just before impact, some of the extended impulse may be caused by the kinematics of the wave itself and not necessarily the slamming impact. It is observed that the pressure impulse decreases to around zero at close to
 $\unicode[STIX]{x1D703}_{max}$
, which shows that the chosen azimuthal limit is sensible.
$\unicode[STIX]{x1D703}_{max}$
, which shows that the chosen azimuthal limit is sensible.

Figure 12. Inline force time series from the CFD model. The blue shaded region shows the effect of slamming.
The result of the pressure impulse model can be seen in figure 13(b). The value of
 $\unicode[STIX]{x1D703}_{max}$
was chosen such that the impact force impulse of the CFD model was equal to the wall-integrated pressure impulse in the inline direction. This led to
$\unicode[STIX]{x1D703}_{max}$
was chosen such that the impact force impulse of the CFD model was equal to the wall-integrated pressure impulse in the inline direction. This led to
 $\unicode[STIX]{x1D703}_{max}=\unicode[STIX]{x03C0}/4$
with only 3 % overprediction of the impulsive force by the model. A general good consistency between the model and CFD pressure impulse distribution and magnitude is observed. The pressure impulse is localized in the upper layer in both the CFD and model results, which is linked to the small breaker height ratio.
$\unicode[STIX]{x1D703}_{max}=\unicode[STIX]{x03C0}/4$
with only 3 % overprediction of the impulsive force by the model. A general good consistency between the model and CFD pressure impulse distribution and magnitude is observed. The pressure impulse is localized in the upper layer in both the CFD and model results, which is linked to the small breaker height ratio.
The model result is based on a fit of
 $\unicode[STIX]{x1D703}_{max}$
to match the force impulse. However, since the force impulse is not generally available from the incident wave parameters, the dependence of the total impulsive force on
$\unicode[STIX]{x1D703}_{max}$
to match the force impulse. However, since the force impulse is not generally available from the incident wave parameters, the dependence of the total impulsive force on
 $\unicode[STIX]{x1D703}_{max}$
is shown in figure 14. The total impulsive force increases as the azimuthal angle limit increases up until
$\unicode[STIX]{x1D703}_{max}$
is shown in figure 14. The total impulsive force increases as the azimuthal angle limit increases up until
 $\unicode[STIX]{x03C0}/2$
where it reaches its maximum. The variation of the pressure impulse relative to
$\unicode[STIX]{x03C0}/2$
where it reaches its maximum. The variation of the pressure impulse relative to
 $\unicode[STIX]{x1D703}_{max}$
is robust and homogeneous. Hence, calibration based on this parameter is possible for similar cases. The total force impulse of the model can be compared to the existing impact models of Goda et al. (Reference Goda, Haranaka and Kitahata1966) and Wienke & Oumeraci (Reference Wienke and Oumeraci2005). The force impulse calculated based on these models has approximately 190 % and 100 % overprediction respectively. The overprediction may be caused by the predicted maximum force magnitude as well as the time span, which has been validated to a lesser extent in previous studies.
$\unicode[STIX]{x1D703}_{max}$
is robust and homogeneous. Hence, calibration based on this parameter is possible for similar cases. The total force impulse of the model can be compared to the existing impact models of Goda et al. (Reference Goda, Haranaka and Kitahata1966) and Wienke & Oumeraci (Reference Wienke and Oumeraci2005). The force impulse calculated based on these models has approximately 190 % and 100 % overprediction respectively. The overprediction may be caused by the predicted maximum force magnitude as well as the time span, which has been validated to a lesser extent in previous studies.

Figure 13. Pressure impulse contour plot from impact of a wave on a cylinder from (a) CFD model and (b) suggested pressure impulse model.

Figure 14. Total impulsive force as a function of
 $\unicode[STIX]{x1D703}_{max}$
. The star marker shows the value of force impulse for
$\unicode[STIX]{x1D703}_{max}$
. The star marker shows the value of force impulse for
 $\unicode[STIX]{x1D703}_{max}=\unicode[STIX]{x03C0}/4$
, which was used for validation against CFD.
$\unicode[STIX]{x1D703}_{max}=\unicode[STIX]{x03C0}/4$
, which was used for validation against CFD.
4 Summary and future work
Pressure impulse models for a 3D box, axisymmetric impact on a vertical circular cylinder and 3D wave impact on a vertical circular cylinder have been derived. The 3D model is formulated in a simplified wedge-shaped geometry and depends on the normalized crest length, impact zone height, inner radius and maximum impact angle. It is intended for calculation of slamming loads as an extension to standard force models such as Morison (Reference Morison1953) and Rainey (Reference Rainey1989, Reference Rainey1995, Reference Rainey2007). The parameter space was investigated and linked to the behaviour within the simpler models. We found that the pressure impulse increases with crest length up until an asymptotic limit, which appears to be effective for realistic wave impacts. The impact zone height governs the vertical extent of the pressure impulse distribution. The pressure impulse was further found to increase with increasing inner radius,
 $a$
, up to a certain limit due to the increased cylinder wall area. However, after this limit the pressure impulse was found to decrease due to the diminishing incident momentum as the volume of the slamming water becomes smaller. The only parameter that cannot be directly determined from the incident wave geometry is the maximum impact angle
$a$
, up to a certain limit due to the increased cylinder wall area. However, after this limit the pressure impulse was found to decrease due to the diminishing incident momentum as the volume of the slamming water becomes smaller. The only parameter that cannot be directly determined from the incident wave geometry is the maximum impact angle
 $\unicode[STIX]{x1D703}_{max}$
. In validation against a numerical wave impact, a value of
$\unicode[STIX]{x1D703}_{max}$
. In validation against a numerical wave impact, a value of
 $\unicode[STIX]{x1D703}_{max}=\unicode[STIX]{x03C0}/4$
was chosen through matching of the numerical force impulse. This led to an encouraging agreement between the results of the two methods. For the same wave parameters, the force impulse was overpredicted by 190 % and 100 % by two established force models. This underlines the model’s potential for further validation and application in structural load and response calculations. The model shows robust and physics-inspired variations with respect to simple input parameters. Further work is thus to validate the model against more CFD results of impact events and experimental data. Ideally, repeated experiments of extreme waves with a structure, measuring the inline force, and without the structure, measuring the wave celerity,
$\unicode[STIX]{x1D703}_{max}=\unicode[STIX]{x03C0}/4$
was chosen through matching of the numerical force impulse. This led to an encouraging agreement between the results of the two methods. For the same wave parameters, the force impulse was overpredicted by 190 % and 100 % by two established force models. This underlines the model’s potential for further validation and application in structural load and response calculations. The model shows robust and physics-inspired variations with respect to simple input parameters. Further work is thus to validate the model against more CFD results of impact events and experimental data. Ideally, repeated experiments of extreme waves with a structure, measuring the inline force, and without the structure, measuring the wave celerity,
 $\unicode[STIX]{x1D707}$
and
$\unicode[STIX]{x1D707}$
and
 $H$
are needed for such cases. Thereby more insight into the appropriate value of
$H$
are needed for such cases. Thereby more insight into the appropriate value of
 $\unicode[STIX]{x1D703}_{max}$
can be gained and the probability distribution of test results relative to the model’s impulse prediction can be quantified.
$\unicode[STIX]{x1D703}_{max}$
can be gained and the probability distribution of test results relative to the model’s impulse prediction can be quantified.
Acknowledgements
This work was funded by the Innovation Fund Denmark and other partners as part of DeRisk project with grant number 4106-00038B. This support is gratefully acknowledged by the authors.


