1 Introduction
Helical vortices play an important role in a wide range of applications. This particular vortex system is a main feature of rotating lifting surfaces present in wind turbine compounds, helicopters, counter-rotating rotors or naval propellers. They impact in particular the efficiency of such devices, increasing the load on rotor blades, generating undesirable wake or acoustic nuisances. The helical vortices generated by rotating blades keep their coherent state in the near wake before breaking up into turbulence in the far-wake region of the flow. The path of transition to turbulence depends on various parameters such as the helix radius, helix pitch, vortex-core radius and the number of blades considered. The study of the transition dynamics of such vortices is therefore of crucial interest, as the near- and far-wake regions display important differences in terms of flow structures, patterns and kinetic energy content. The precise knowledge of the wake dynamics related to helical vortices can, for example, allow selection of the optimal arrangement for a wind turbine farm.
The theoretical stability bounds of a single helical vortex filament have been studied by Widnall (Reference Widnall1972), who reported three types of instabilities that can lead to the turbulent breakdown of such vortices. The first type relates to a short-wavelength perturbation of the filament, arguably present on all curved filaments. The second type is due to a long-wavelength perturbation of the filament, and the last one, termed the mutual inductance phenomenon, occurs when the pitch of the helix is sufficiently low to allow for the neighbouring filaments to interact strongly. This phenomenon is particularly important regarding the stability of helical vortices, as it drives the amplitude of the growth rates of vortex-core displacement for sufficiently small helical pitch values. Gupta & Loewy (Reference Gupta and Loewy1974) have investigated analytically the stability of multiple arrays of helical vortices and have shown that increasing the number of intertwined helical filaments or decreasing the helical pitch leads to an increase in the instability growth rates. Okulov (Reference Okulov2004) carried out a similar study and concluded that an increase in the number of vortices or a decrease of the helical pitch yields the instability of a wider range of modes. More recently, Nemes et al. (Reference Nemes, Lo Jacono, Blackburn and Sheridan2015) have investigated experimentally the dynamics of a pair of helical vortices subject to mutual inductance. They found that a decrease in helical pitch led to faster transition to turbulence, confirming the analysis of Gupta & Loewy (Reference Gupta and Loewy1974). Felli, Camussi & Di Felice (Reference Felli, Camussi and Di Felice2011) have studied experimentally the wake shed by propellers featuring different number of blades at various rotating speeds corresponding to different helical pitches. They found that both the increase in number of blades and reduction of helical pitch led to an anticipated transition towards a turbulent state, in agreement with the theoretical study of Gupta & Loewy (Reference Gupta and Loewy1974). Once the system of helical vortices is destabilized, it has been observed both numerically and experimentally that the leap frogging or merging of vortices can occur (Ivanell et al. Reference Ivanell, Mikkelsen, Sørensen and Henningson2010; Felli et al. Reference Felli, Camussi and Di Felice2011; Sherry et al. Reference Sherry, Nemes, Lo Jacono, Blackburn and Sheridan2013; Nemes et al. Reference Nemes, Lo Jacono, Blackburn and Sheridan2015). These events yield a breakdown of the initial vortices and lead to the production of small-scale turbulence.
As numerous works studied the stability of helical vortices by experimental or numerical means (Alekseenko et al.
Reference Alekseenko, Kuibin, Okulov and Shtork1999; Okulov Reference Okulov2004; Okulov & Sørensen Reference Okulov and Sørensen2007; Walther et al.
Reference Walther, Guenot, Machefaux, Rasmussen, Chatelain, Okulov, Sørensen, Bergdorf and Koumoutsakos2007; Sørensen, Naumov & Okulov Reference Sørensen, Naumov and Okulov2011; Delbende, Rossi & Daube Reference Delbende, Rossi and Daube2012; Quaranta, Bolnot & Leweke Reference Quaranta, Bolnot and Leweke2015), there is still the need to explain the vortex reconnection events that appear in the flow during transition and to study the properties of the resulting turbulence associated with the wake shed by transitional helical vortices, in particular the type of scales and anisotropy in the flow. The present work considers a parameter space for which these reconnection events and the associated generation of small scales are likely to occur, that is, for moderately high circulation-based Reynolds numbers,
![]() $Re_{\unicode[STIX]{x1D6E4}}>7000$
and small vortex-core-to-helix-radius ratios,
$Re_{\unicode[STIX]{x1D6E4}}>7000$
and small vortex-core-to-helix-radius ratios,
![]() $r_{c}/R<0.2$
. Lower Reynolds numbers and/or thicker vortex cores, such as
$r_{c}/R<0.2$
. Lower Reynolds numbers and/or thicker vortex cores, such as
![]() $Re_{\unicode[STIX]{x1D6E4}}=1000{-}10\,000$
, and
$Re_{\unicode[STIX]{x1D6E4}}=1000{-}10\,000$
, and
![]() $r_{c}/R\approx 0.2{-}0.3$
considered in the simulations of Delbende, Piton & Rossi (Reference Delbende, Piton and Rossi2015), lead to the merging of a pair of helical vortices, without the presence of vortex reconnection events.
$r_{c}/R\approx 0.2{-}0.3$
considered in the simulations of Delbende, Piton & Rossi (Reference Delbende, Piton and Rossi2015), lead to the merging of a pair of helical vortices, without the presence of vortex reconnection events.
The objectives of the present study are threefold: (i) by means of high-fidelity Navier–Stokes computations, study the influence of Reynolds number, initial vortex-core radius and helical pitch on the growth rates of the helical vortex instability driven by mutual inductance; (ii) characterize the type of vortex reconnection events that typically appear in such flows during transition; (iii) study the properties of turbulence in the far wake, and in particular evaluate the turbulent scales and quantify the anisotropy.
The structure of the paper is the following: § 2 presents the computational set-up based on a high-order compact finite difference framework and the coherent-vorticity preserving (CvP, Chapelier, Wasistho & Scalo Reference Chapelier, Wasistho and Scalo2018) model for large-eddy simulation. Section 3 introduces the numerical set-up for the study, based on the definition of helical vortices in a triply periodic box using the Biot–Savart law with regularized vortex core. Section 4 deals with the validation of the proposed numerical set-up by reproducing the experiment of Nemes et al. (Reference Nemes, Lo Jacono, Blackburn and Sheridan2015) for various helical pitch values. Section 5.3 presents a sensitivity study of the vortex-core displacement rates to various parameters, namely the helical pitch, Reynolds number based on circulation and vortex-core radius. A collapse of the vortex-core displacement growth rates considering various pitch values is obtained considering a non-dimensional time
![]() $t^{\star }=t\unicode[STIX]{x1D6E4}/h^{2}$
where
$t^{\star }=t\unicode[STIX]{x1D6E4}/h^{2}$
where
![]() $\unicode[STIX]{x1D6E4}$
is the vortex circulation and
$\unicode[STIX]{x1D6E4}$
is the vortex circulation and
![]() $h$
the helical pitch. Computations involving various Reynolds numbers are performed and it is shown that the growth rates are essentially insensitive to the Reynolds number. Finally, computations involving various vortex-core radii show that large vortex cores impact the growth rates, confirming the theoretical study of Gupta & Loewy (Reference Gupta and Loewy1974). Section 5.4 deals with the characterization of the vortex reconnection events occurring during the transition, after the end of the inviscid evolution of the flow. In particular, the helical vortices undergo leap frogging, which creates the conditions of neighbouring orthogonal vortex filaments to interact. This event yields the separation of the aforementioned filaments as well as the creation of elongated threads in the axial direction. A second reconnection event resembling the Crow instability (Crow Reference Crow1970) is identified for low pitch-to-helix radius ratio. In § 6, the wake anisotropy is studied by analysing the values of the anisotropic Reynolds stress tensor as well as its invariants which are plotted in the Lumley triangle. It is found that for all cases considered, the turbulent wake retains high anisotropy for long time integration, with a dominance of the axial fluctuations, in particular in the low Reynolds and large core radius cases. Higher Reynolds numbers and smaller core radii tend to lower the anisotropy, with a reduced axial component and more important radial and azimuthal components, which are also equal. A scale-by-scale anisotropy study reveals that the integral lengths computed during the decaying regime scale with the initial helical pitch, emphasizing the influence of the initial conditions even at late stages of flow evolution. This study also shows that the flow structures are elongated in the streamwise direction and thin in the radial direction. The large-scale anisotropy is also found to propagate to the dissipative scales as shown by the ratio of squared velocity gradients in the radial and longitudinal directions.
$h$
the helical pitch. Computations involving various Reynolds numbers are performed and it is shown that the growth rates are essentially insensitive to the Reynolds number. Finally, computations involving various vortex-core radii show that large vortex cores impact the growth rates, confirming the theoretical study of Gupta & Loewy (Reference Gupta and Loewy1974). Section 5.4 deals with the characterization of the vortex reconnection events occurring during the transition, after the end of the inviscid evolution of the flow. In particular, the helical vortices undergo leap frogging, which creates the conditions of neighbouring orthogonal vortex filaments to interact. This event yields the separation of the aforementioned filaments as well as the creation of elongated threads in the axial direction. A second reconnection event resembling the Crow instability (Crow Reference Crow1970) is identified for low pitch-to-helix radius ratio. In § 6, the wake anisotropy is studied by analysing the values of the anisotropic Reynolds stress tensor as well as its invariants which are plotted in the Lumley triangle. It is found that for all cases considered, the turbulent wake retains high anisotropy for long time integration, with a dominance of the axial fluctuations, in particular in the low Reynolds and large core radius cases. Higher Reynolds numbers and smaller core radii tend to lower the anisotropy, with a reduced axial component and more important radial and azimuthal components, which are also equal. A scale-by-scale anisotropy study reveals that the integral lengths computed during the decaying regime scale with the initial helical pitch, emphasizing the influence of the initial conditions even at late stages of flow evolution. This study also shows that the flow structures are elongated in the streamwise direction and thin in the radial direction. The large-scale anisotropy is also found to propagate to the dissipative scales as shown by the ratio of squared velocity gradients in the radial and longitudinal directions.
2 Computational set-up
In this work, the compressible fluid motion is simulated by discretizing the Navier–Stokes operator
![]() ${\mathcal{N}}{\mathcal{S}}(\boldsymbol{w})$
, which can be cast in the form:
${\mathcal{N}}{\mathcal{S}}(\boldsymbol{w})$
, which can be cast in the form:
where
![]() $\boldsymbol{w}=(\unicode[STIX]{x1D70C},\unicode[STIX]{x1D70C}\boldsymbol{U},\unicode[STIX]{x1D70C}E)^{\text{T}}$
is the vector of conserved variables
$\boldsymbol{w}=(\unicode[STIX]{x1D70C},\unicode[STIX]{x1D70C}\boldsymbol{U},\unicode[STIX]{x1D70C}E)^{\text{T}}$
is the vector of conserved variables
![]() $\unicode[STIX]{x1D70C}$
,
$\unicode[STIX]{x1D70C}$
,
![]() $\boldsymbol{U}$
and
$\boldsymbol{U}$
and
![]() $E$
(the density, velocity and total energy respectively), and
$E$
(the density, velocity and total energy respectively), and
![]() $(\unicode[STIX]{x1D735}\boldsymbol{w})_{ij}=\unicode[STIX]{x2202}w_{i}/\unicode[STIX]{x2202}x_{j}$
is the gradient of the vector of conservative variables. Here
$(\unicode[STIX]{x1D735}\boldsymbol{w})_{ij}=\unicode[STIX]{x2202}w_{i}/\unicode[STIX]{x2202}x_{j}$
is the gradient of the vector of conservative variables. Here
![]() $\unicode[STIX]{x1D641}_{c}$
,
$\unicode[STIX]{x1D641}_{c}$
,
![]() $\unicode[STIX]{x1D641}_{v}\in \mathbb{R}^{5\times 3}$
are the convective and viscous fluxes, respectively. The ideal gas law is considered for the closure of the system of equations.
$\unicode[STIX]{x1D641}_{v}\in \mathbb{R}^{5\times 3}$
are the convective and viscous fluxes, respectively. The ideal gas law is considered for the closure of the system of equations.
In the present study, the compressible large-eddy simulation (LES) formalism introduced by Lesieur, Métais & Comte (Reference Lesieur, Métais and Comte2005) is adopted, yielding the following set of filtered compressible Navier–Stokes equations:
where
![]() $\overline{\boldsymbol{w}}=(\overline{\unicode[STIX]{x1D70C}},\overline{\unicode[STIX]{x1D70C}}\widetilde{\boldsymbol{U}},\overline{\unicode[STIX]{x1D70C}}\widetilde{E})^{\text{T}}$
is the vector of filtered and Favre-filtered conservative variables. The Favre filter is defined as, for a given function
$\overline{\boldsymbol{w}}=(\overline{\unicode[STIX]{x1D70C}},\overline{\unicode[STIX]{x1D70C}}\widetilde{\boldsymbol{U}},\overline{\unicode[STIX]{x1D70C}}\widetilde{E})^{\text{T}}$
is the vector of filtered and Favre-filtered conservative variables. The Favre filter is defined as, for a given function
![]() $\unicode[STIX]{x1D711}$
, as
$\unicode[STIX]{x1D711}$
, as
![]() $\widetilde{\unicode[STIX]{x1D711}}=\overline{\unicode[STIX]{x1D70C}\unicode[STIX]{x1D711}}/\overline{\unicode[STIX]{x1D70C}}$
. In the present approach, the filter is assumed to be implicitly performed by the discretization, hence termed hereafter grid filter, with a corresponding filter width of
$\widetilde{\unicode[STIX]{x1D711}}=\overline{\unicode[STIX]{x1D70C}\unicode[STIX]{x1D711}}/\overline{\unicode[STIX]{x1D70C}}$
. In the present approach, the filter is assumed to be implicitly performed by the discretization, hence termed hereafter grid filter, with a corresponding filter width of
![]() $\overline{\unicode[STIX]{x1D6E5}}$
which is the grid spacing.
$\overline{\unicode[STIX]{x1D6E5}}$
which is the grid spacing.
The subgrid-scale (SGS) tensor
![]() $\unicode[STIX]{x1D641}_{SGS}$
is the result of the filtering operation and it encapsulates the dynamics of the unresolved subgrid scales, and is modelled here using the eddy-viscosity assumption, yielding:
$\unicode[STIX]{x1D641}_{SGS}$
is the result of the filtering operation and it encapsulates the dynamics of the unresolved subgrid scales, and is modelled here using the eddy-viscosity assumption, yielding:
where
![]() $\unicode[STIX]{x1D64E}$
is the strain rate tensor,
$\unicode[STIX]{x1D64E}$
is the strain rate tensor,
![]() $Pr_{t}$
is the turbulent Prandtl number that is set to 0.5. The CvP–Smagorinsky eddy-viscosity closure (Chapelier et al.
Reference Chapelier, Wasistho and Scalo2018), which is accurate for the prediction of transitional flows, is considered in the present study. This method aims at reducing the influence of subgrid dissipation during transition or in regions for which only coherent scales are present. The correction of the eddy viscosity
$Pr_{t}$
is the turbulent Prandtl number that is set to 0.5. The CvP–Smagorinsky eddy-viscosity closure (Chapelier et al.
Reference Chapelier, Wasistho and Scalo2018), which is accurate for the prediction of transitional flows, is considered in the present study. This method aims at reducing the influence of subgrid dissipation during transition or in regions for which only coherent scales are present. The correction of the eddy viscosity
![]() $\unicode[STIX]{x1D707}_{t}$
computed using traditional SGS models is proposed in the form:
$\unicode[STIX]{x1D707}_{t}$
computed using traditional SGS models is proposed in the form:
where
![]() $f(\unicode[STIX]{x1D70E})$
is a function detecting small-scale turbulence by the means of the parameter
$f(\unicode[STIX]{x1D70E})$
is a function detecting small-scale turbulence by the means of the parameter
![]() $\unicode[STIX]{x1D70E}$
which is the ratio of test-filtered to grid-filtered enstrophy:
$\unicode[STIX]{x1D70E}$
which is the ratio of test-filtered to grid-filtered enstrophy:
where
![]() $\unicode[STIX]{x1D709}=\unicode[STIX]{x1D74E}\boldsymbol{\cdot }\unicode[STIX]{x1D74E}/2$
, and the hat symbol represents the test filter associated with a width being larger than the grid filter size. This sensor is activated by progressively following the spectral broadening of enstrophy associated with the onset of small scales in the flow, using the following expression:
$\unicode[STIX]{x1D709}=\unicode[STIX]{x1D74E}\boldsymbol{\cdot }\unicode[STIX]{x1D74E}/2$
, and the hat symbol represents the test filter associated with a width being larger than the grid filter size. This sensor is activated by progressively following the spectral broadening of enstrophy associated with the onset of small scales in the flow, using the following expression:
 $$\begin{eqnarray}f(\unicode[STIX]{x1D70E})=\left\{\begin{array}{@{}ll@{}}1\quad & \text{for }\unicode[STIX]{x1D70E}<\unicode[STIX]{x1D70E}_{eq},\\ {\displaystyle \frac{1}{2}}\left(1+\sin \left(\unicode[STIX]{x03C0}{\displaystyle \frac{\unicode[STIX]{x1D70E}_{eq}-2\unicode[STIX]{x1D70E}+1}{2(1-\unicode[STIX]{x1D70E}_{eq})}}\right)\right)\quad & \text{for }\unicode[STIX]{x1D70E}\in [\unicode[STIX]{x1D70E}_{eq},1],\\ 0\quad & \text{for }\unicode[STIX]{x1D70E}>1,\end{array}\right.\end{eqnarray}$$
where
![]() $\unicode[STIX]{x1D70E}_{eq}$
is the value of test-filtered to grid-filtered enstrophy ratio corresponding to an equilibrium turbulent state having the Kolmogorov spectrum in the inertial range. An assessment of the sensor
$\unicode[STIX]{x1D70E}_{eq}$
is the value of test-filtered to grid-filtered enstrophy ratio corresponding to an equilibrium turbulent state having the Kolmogorov spectrum in the inertial range. An assessment of the sensor
![]() $f$
for the present physical system is proposed in § 4. The baseline eddy viscosity corresponds to the Smagorinsky model:
$f$
for the present physical system is proposed in § 4. The baseline eddy viscosity corresponds to the Smagorinsky model:
where
![]() $\overline{\unicode[STIX]{x1D6E5}}$
is the grid spacing and
$\overline{\unicode[STIX]{x1D6E5}}$
is the grid spacing and
![]() $C_{S}$
the model coefficient set to the usual value 0.172. The test filter used to compute the ratio
$C_{S}$
the model coefficient set to the usual value 0.172. The test filter used to compute the ratio
![]() $\unicode[STIX]{x1D70E}$
is a sixth-order compact finite difference filter with strength set to 0.4 (see Chapelier et al. (Reference Chapelier, Wasistho and Scalo2018) for additional details).
$\unicode[STIX]{x1D70E}$
is a sixth-order compact finite difference filter with strength set to 0.4 (see Chapelier et al. (Reference Chapelier, Wasistho and Scalo2018) for additional details).
The compressible, Favre-filtered Navier–Stokes equations are solved using a sixth-order compact finite difference scheme solver originally written by Nagarajan, Lele & Ferziger (Reference Nagarajan, Lele and Ferziger2003), currently under development at Purdue University. The solver is based on the staggered grid arrangement, providing superior accuracy compared to a fully collocated approach. This type of staggered, compact high-order finite difference schemes developed by Lele (Reference Lele1992) is found to provide quasi-spectral accuracy. The time integration is performed using a third-order Runge–Kutta scheme.
3 Problem definition
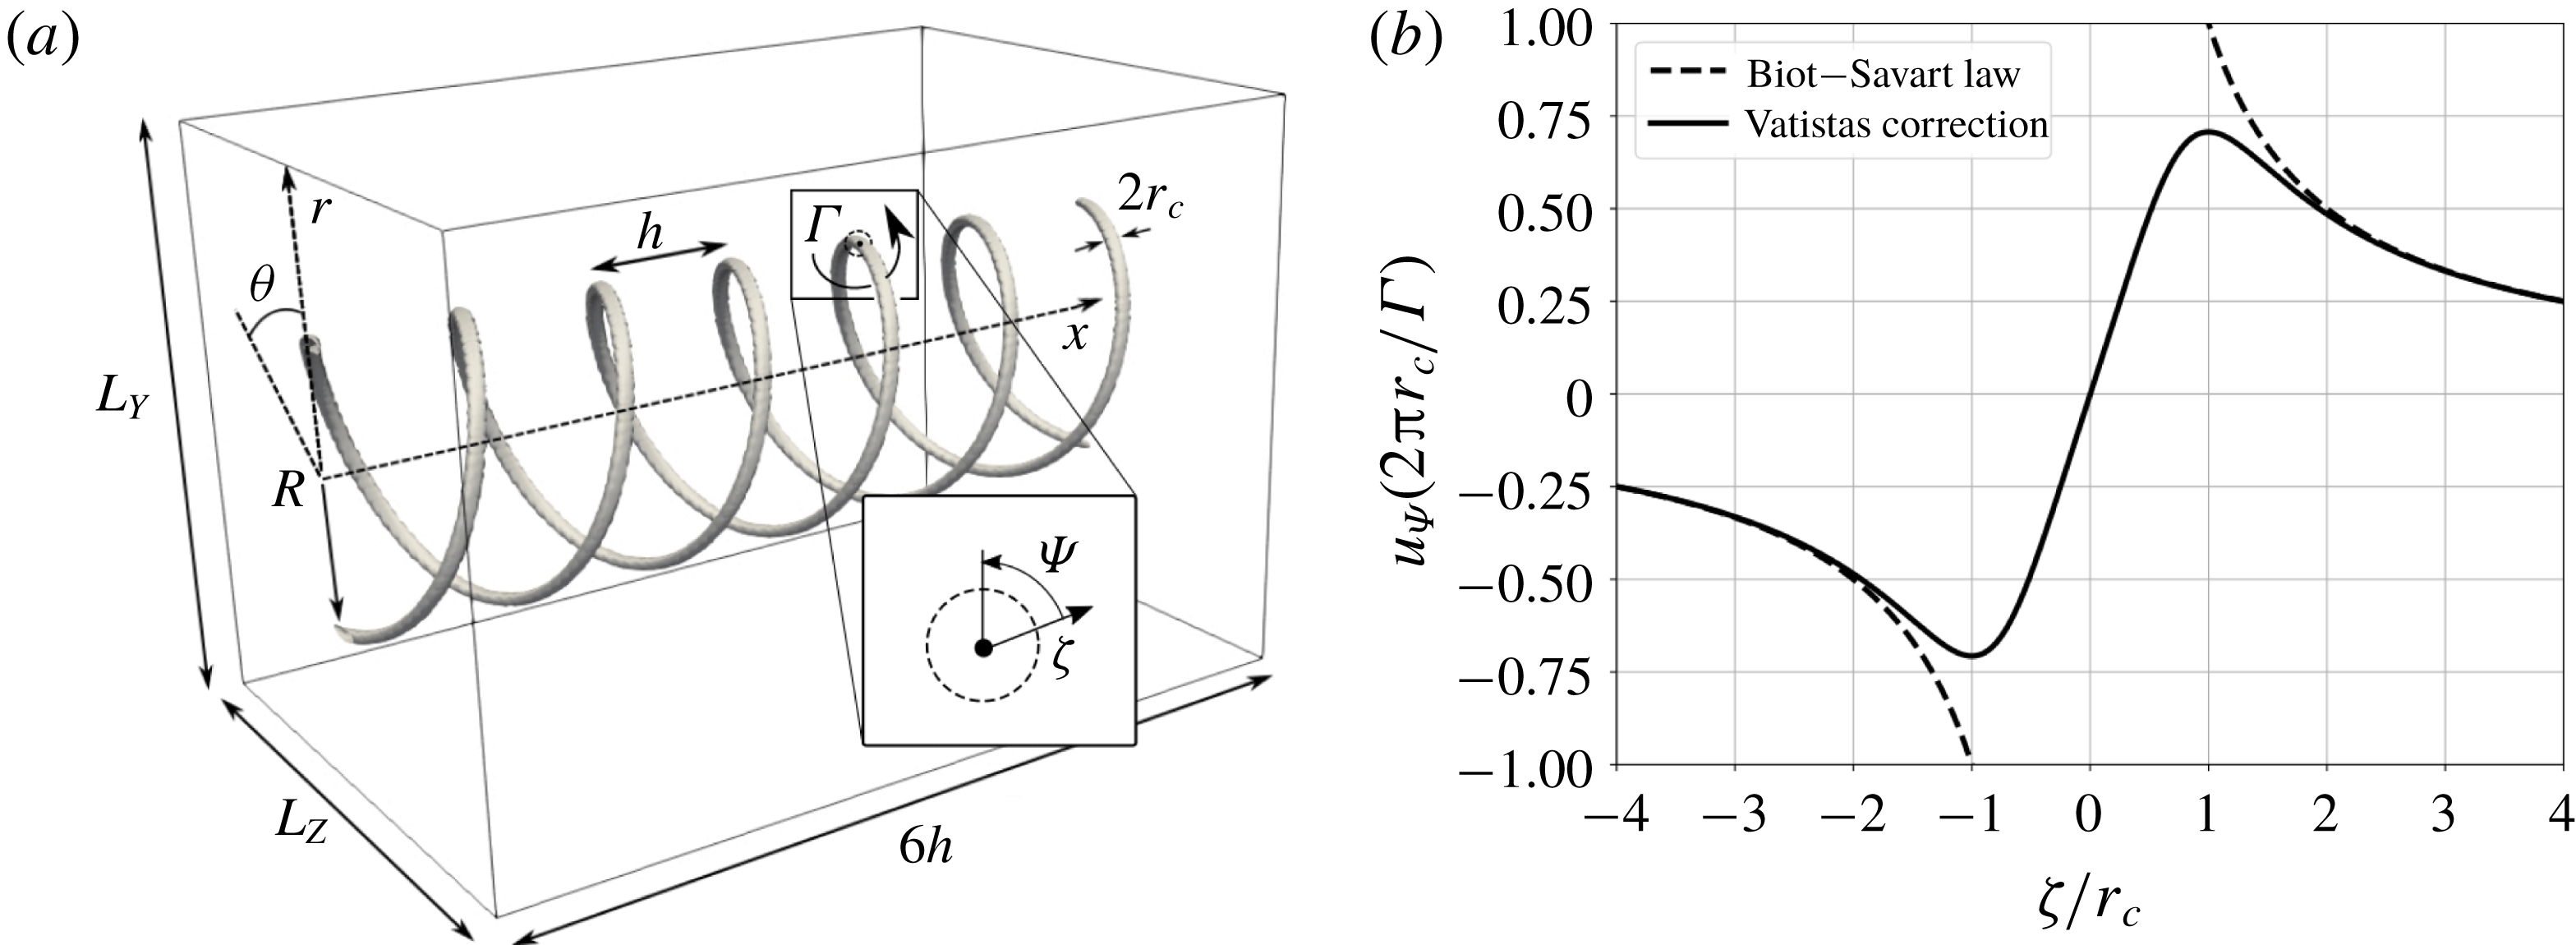
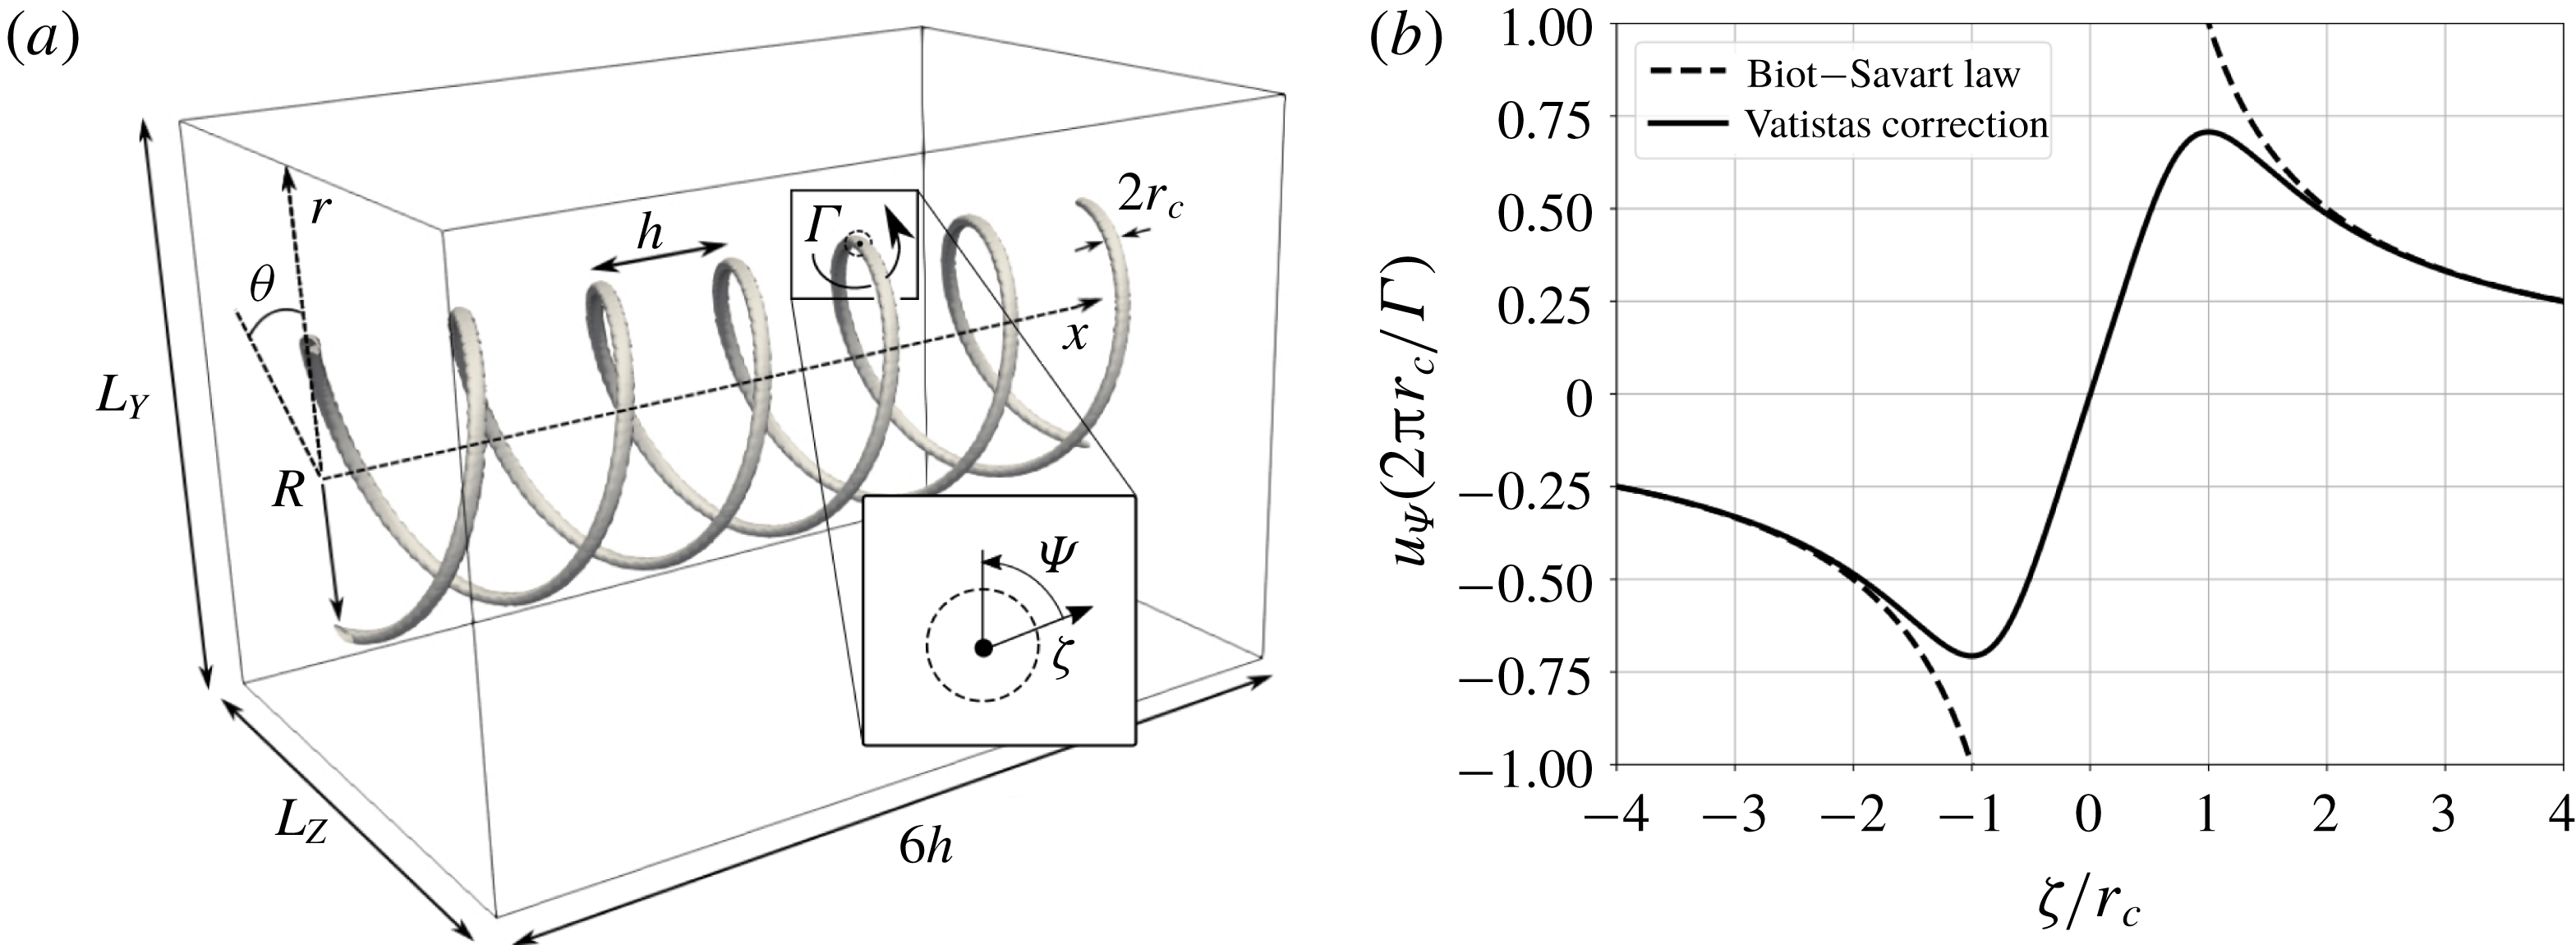
Figure 1. (a) Sketch of the numerical set-up for the simulation of temporally evolving helical vortices, with inset showing cylindrical system of coordinates local to the vortex core. (b) Tangential velocity profile,
![]() $u_{\unicode[STIX]{x1D6F9}}$
versus the distance from the vortex core,
$u_{\unicode[STIX]{x1D6F9}}$
versus the distance from the vortex core,
![]() $\unicode[STIX]{x1D701}$
via Biot–Savart law (3.2) with and without application of the smoothing kernel (3.3).
$\unicode[STIX]{x1D701}$
via Biot–Savart law (3.2) with and without application of the smoothing kernel (3.3).
The present work focuses on the study of a pair of temporally developing helical vortices, initialized in a periodic box, and left to evolve in time. The helical vortex filaments are first defined in a triply periodic box
![]() $[L_{X},L_{Y},L_{Z}]$
using a parametric curve:
$[L_{X},L_{Y},L_{Z}]$
using a parametric curve:
where
![]() $R$
is the radius,
$R$
is the radius,
![]() $h=2\unicode[STIX]{x03C0}\ell /N$
the pitch of the helix divided by the number of helical arrays
$h=2\unicode[STIX]{x03C0}\ell /N$
the pitch of the helix divided by the number of helical arrays
![]() $N$
and
$N$
and
![]() $\unicode[STIX]{x1D719}$
is an angular variable, varying from 0 to
$\unicode[STIX]{x1D719}$
is an angular variable, varying from 0 to
![]() $2\unicode[STIX]{x03C0}M$
, where
$2\unicode[STIX]{x03C0}M$
, where
![]() $M$
is the number of helical periods, used to define the parametric curve. The latter should not be confused with
$M$
is the number of helical periods, used to define the parametric curve. The latter should not be confused with
![]() $\unicode[STIX]{x1D703}$
, which is the azimuthal coordinate in the cylindrical system of reference in figure 1. In the present study, a double helical vortex configuration is considered, hence
$\unicode[STIX]{x1D703}$
, which is the azimuthal coordinate in the cylindrical system of reference in figure 1. In the present study, a double helical vortex configuration is considered, hence
![]() $N=2$
with three helical periods corresponding to
$N=2$
with three helical periods corresponding to
![]() $M=3$
. The velocity field induced by the vortex filament is determined by the Biot–Savart law:
$M=3$
. The velocity field induced by the vortex filament is determined by the Biot–Savart law:
where
![]() $\boldsymbol{t}(\unicode[STIX]{x1D719})=(\ell ,-R\sin \unicode[STIX]{x1D719},R\cos \unicode[STIX]{x1D719})$
is the tangent vector to the helical filament,
$\boldsymbol{t}(\unicode[STIX]{x1D719})=(\ell ,-R\sin \unicode[STIX]{x1D719},R\cos \unicode[STIX]{x1D719})$
is the tangent vector to the helical filament,
![]() $\unicode[STIX]{x1D6E4}$
is the circulation and
$\unicode[STIX]{x1D6E4}$
is the circulation and
![]() $K_{v}$
is a smoothing kernel defining the shape of the vortex core. Van Hoydonck, Bakker & Van Tooren (Reference Van Hoydonck, Bakker and Van Tooren2010) have proposed an expression for
$K_{v}$
is a smoothing kernel defining the shape of the vortex core. Van Hoydonck, Bakker & Van Tooren (Reference Van Hoydonck, Bakker and Van Tooren2010) have proposed an expression for
![]() $K_{v}$
verifying the model for the vortex-core tangential velocity
$K_{v}$
verifying the model for the vortex-core tangential velocity
![]() $u_{\unicode[STIX]{x1D6F9}}(\unicode[STIX]{x1D701})$
, as a function of the radial distance from the core centre,
$u_{\unicode[STIX]{x1D6F9}}(\unicode[STIX]{x1D701})$
, as a function of the radial distance from the core centre,
![]() $\unicode[STIX]{x1D701}$
, (figures 1
a, inset and 1
b) proposed by Vatistas, Kozel & Mih (Reference Vatistas, Kozel and Mih1991). This expression has been discussed and tested by Bhagwat & Leishman (Reference Bhagwat and Leishman2014), and reads:
$\unicode[STIX]{x1D701}$
, (figures 1
a, inset and 1
b) proposed by Vatistas, Kozel & Mih (Reference Vatistas, Kozel and Mih1991). This expression has been discussed and tested by Bhagwat & Leishman (Reference Bhagwat and Leishman2014), and reads:
where
![]() $r_{c}$
is the vortex-core radius.
$r_{c}$
is the vortex-core radius.
More recent work by Vatistas, Panagiotakakos & Manikis (Reference Vatistas, Panagiotakakos and Manikis2015) aimed at defining a Reynolds-number-dependent turbulent tangential velocity profile. In the present study, we consider profiles for a laminar flow, as our aim is to investigate the initial flow instability dynamics and transition to a turbulent state.
Figure 1 presents a view of the initial condition for the simulation of a pair of helical vortices with all relevant parameters. Here, we set
![]() $L_{X}=6h$
for all simulations, corresponding to three turns of the helices. The box size in the cross-section is chosen as
$L_{X}=6h$
for all simulations, corresponding to three turns of the helices. The box size in the cross-section is chosen as
![]() $L_{Y}=L_{Z}=4.3R$
. The number of grid points in the
$L_{Y}=L_{Z}=4.3R$
. The number of grid points in the
![]() $x$
direction is chosen such that the grid spacings are equal in each direction, namely
$x$
direction is chosen such that the grid spacings are equal in each direction, namely
![]() $\unicode[STIX]{x0394}x=\unicode[STIX]{x0394}y=\unicode[STIX]{x0394}z$
. This yields a different number of grid points in the
$\unicode[STIX]{x0394}x=\unicode[STIX]{x0394}y=\unicode[STIX]{x0394}z$
. This yields a different number of grid points in the
![]() $x$
direction compared to the
$x$
direction compared to the
![]() $y$
and
$y$
and
![]() $z$
directions, depending on the helical pitch. For convenience of notation, the resolution of computations will be referred to as
$z$
directions, depending on the helical pitch. For convenience of notation, the resolution of computations will be referred to as
![]() $N_{y}^{3}$
, where
$N_{y}^{3}$
, where
![]() $N_{y}$
is the number of grid points in the
$N_{y}$
is the number of grid points in the
![]() $y$
and
$y$
and
![]() $z$
directions, whereas the effective number of grid points is
$z$
directions, whereas the effective number of grid points is
![]() $N_{y}^{2}\times N_{y}\times 6h/L_{Y}$
.
$N_{y}^{2}\times N_{y}\times 6h/L_{Y}$
.
As the mutual inductance between vortex filaments is governed by the helical pitch, the relevant dimensional quantities for the problem are:
(i) The velocity
 $\unicode[STIX]{x1D6E4}/h$
characterizing the self-motion of the system of helical vortices.
$\unicode[STIX]{x1D6E4}/h$
characterizing the self-motion of the system of helical vortices.(ii) The helical pitch
 $h$
, which is the distance separating two neighbouring vortex filaments.
$h$
, which is the distance separating two neighbouring vortex filaments.(iii) The circulation
 $\unicode[STIX]{x1D6E4}$
of the vortex filaments.
The corresponding Reynolds number formed from these quantities is based on circulation and reads
![]() $Re_{\unicode[STIX]{x1D6E4}}=\unicode[STIX]{x1D6E4}/\unicode[STIX]{x1D708}$
.
$Re_{\unicode[STIX]{x1D6E4}}=\unicode[STIX]{x1D6E4}/\unicode[STIX]{x1D708}$
.
Although the numerical method considered in the present study solves the compressible Navier–Stokes equations, incompressible flow is achieved by setting the Mach number
![]() $\unicode[STIX]{x1D6E4}/h/c_{0}$
close to 0.1, where
$\unicode[STIX]{x1D6E4}/h/c_{0}$
close to 0.1, where
![]() $c_{0}=\sqrt{\unicode[STIX]{x1D6FE}p_{0}/\unicode[STIX]{x1D70C}_{0}}$
is the speed of sound based on reference thermodynamic quantities. The initial vector of conservative variables therefore reads:
$c_{0}=\sqrt{\unicode[STIX]{x1D6FE}p_{0}/\unicode[STIX]{x1D70C}_{0}}$
is the speed of sound based on reference thermodynamic quantities. The initial vector of conservative variables therefore reads:
According to Okulov (Reference Okulov2004), systems of helical vortices with more than one helix and helical pitch lower than
![]() $h/R\approx 5$
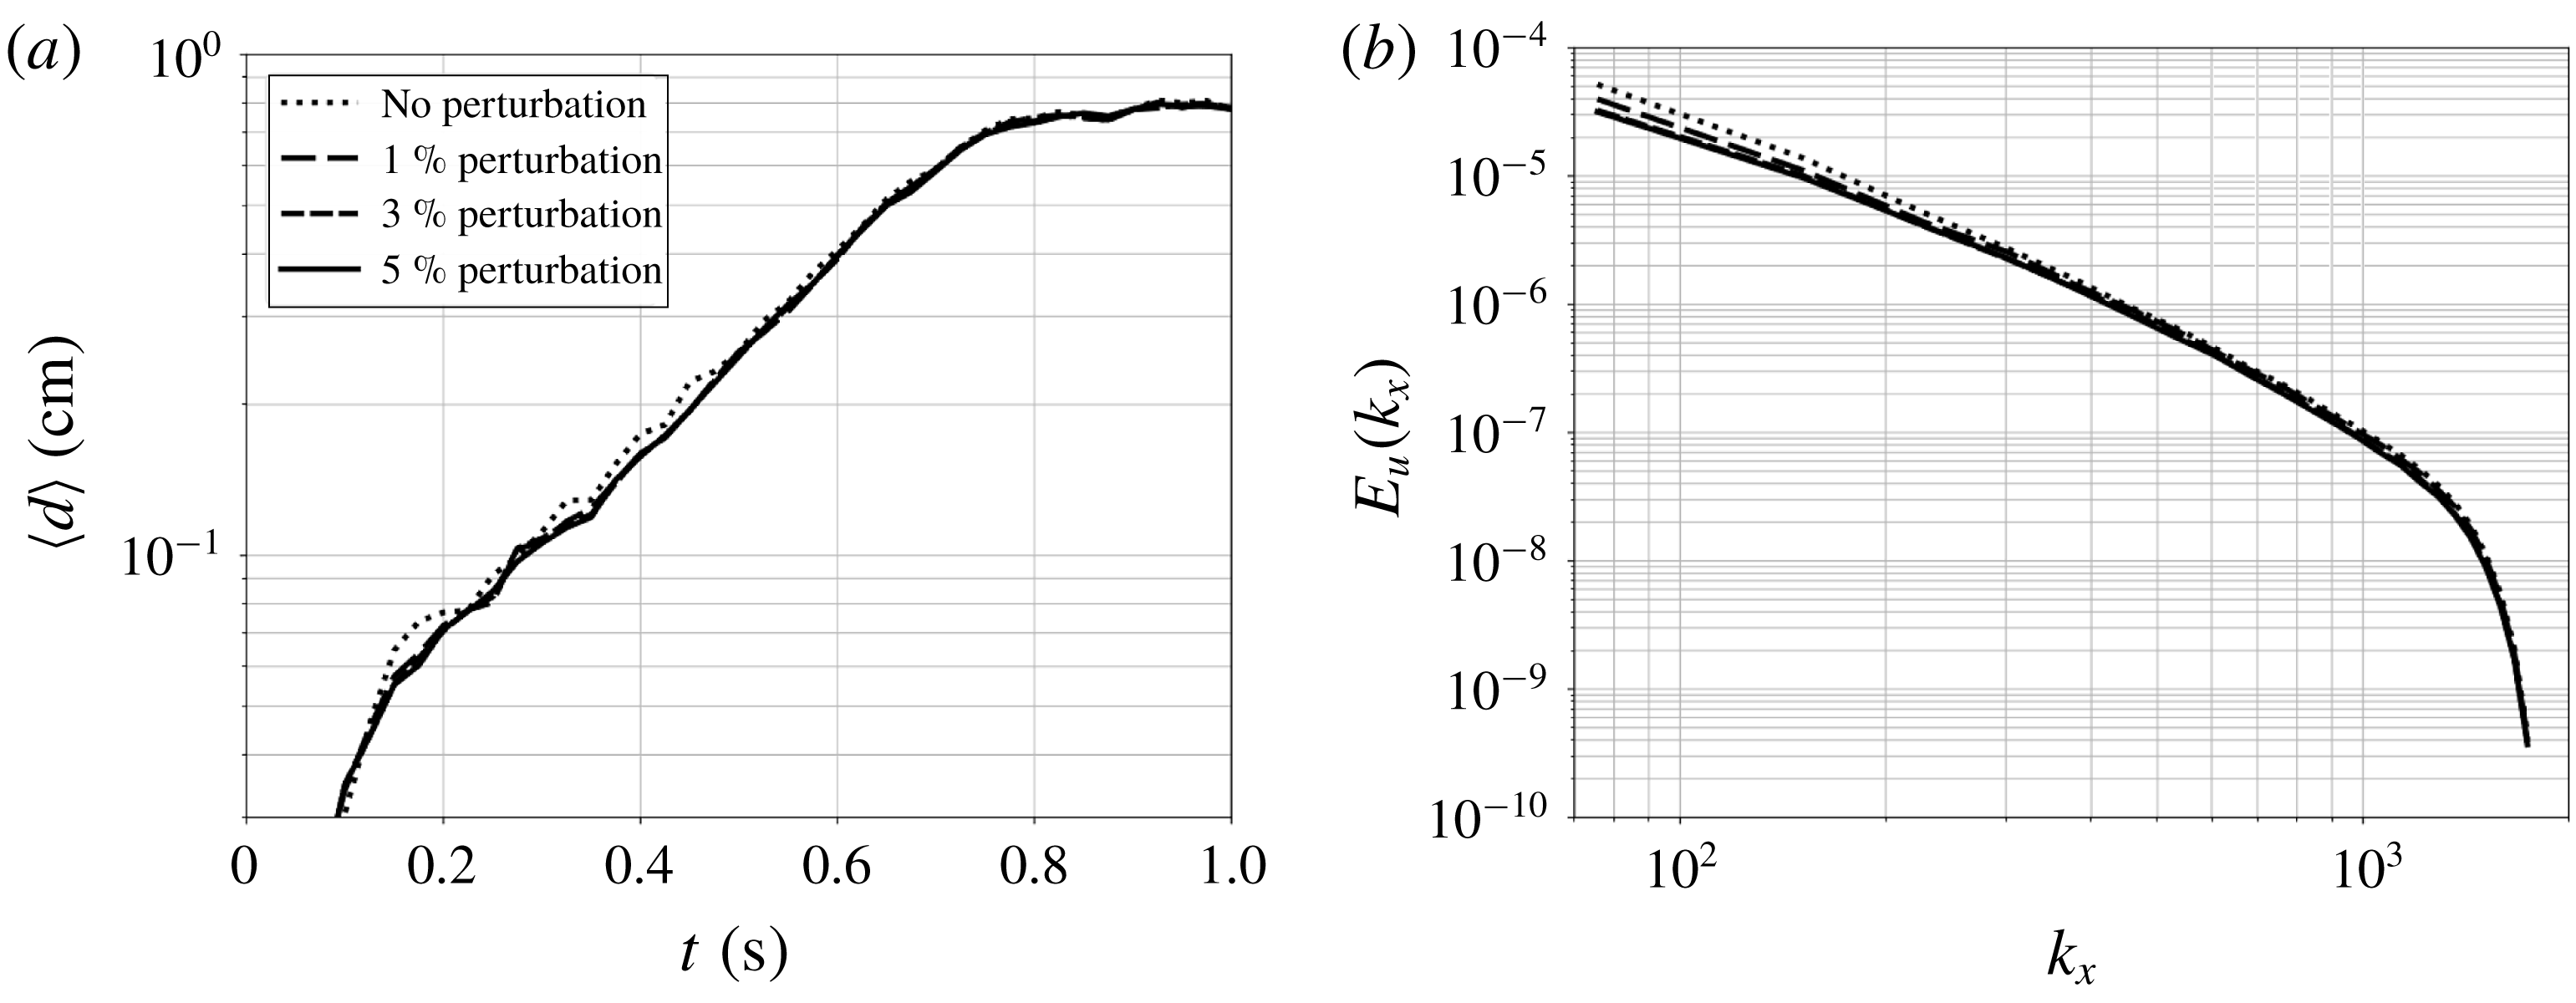
are highly unstable as a wide range of perturbation modes have a positive growth rate. In fact, the release of small amplitude acoustic waves due to the compressible nature of the numerical solver, as well as the approximations induced by determining the velocity using a discretely integrated Biot–Savart law, are sufficient to trigger the flow instability. The influence of added perturbations to the initial velocity field is assessed in appendix B.
$h/R\approx 5$
are highly unstable as a wide range of perturbation modes have a positive growth rate. In fact, the release of small amplitude acoustic waves due to the compressible nature of the numerical solver, as well as the approximations induced by determining the velocity using a discretely integrated Biot–Savart law, are sufficient to trigger the flow instability. The influence of added perturbations to the initial velocity field is assessed in appendix B.
4 Validation against experiments
The present numerical set-up for the study of the dynamics of helical vortices is first validated against the experiment of Nemes et al. (Reference Nemes, Lo Jacono, Blackburn and Sheridan2015). To facilitate the comparison with their work, in which they use the definition of the helical pitch
![]() $\ell =2h$
, the ratio
$\ell =2h$
, the ratio
![]() $2h/R$
will be considered to yield the same values between the two studies. Although their study involves eight different cases with
$2h/R$
will be considered to yield the same values between the two studies. Although their study involves eight different cases with
![]() $2h/R$
ranging from 0.7 to 1.8, the comparison between the present computations and experiments is performed considering the four cases
$2h/R$
ranging from 0.7 to 1.8, the comparison between the present computations and experiments is performed considering the four cases
![]() $2h/R=0.72$
,
$2h/R=0.72$
,
![]() $2h/R=0.91$
,
$2h/R=0.91$
,
![]() $2h/R=1.08$
and
$2h/R=1.08$
and
![]() $2h/R=1.22$
. The spatial displacement of vortex cores is computed as the difference between the radius of the vortices
$2h/R=1.22$
. The spatial displacement of vortex cores is computed as the difference between the radius of the vortices
![]() $r_{h}(x,t)$
and the initial radius
$r_{h}(x,t)$
and the initial radius
![]() $r_{h}(x,0)=R$
. The displacement is computed as:
$r_{h}(x,0)=R$
. The displacement is computed as:
with
![]() $r_{h}(x,t)$
evaluated based on the position of the maximal vorticity magnitude in the plane
$r_{h}(x,t)$
evaluated based on the position of the maximal vorticity magnitude in the plane
![]() $(y,z)$
. Nemes et al. (Reference Nemes, Lo Jacono, Blackburn and Sheridan2015) found an exponential evolution of the vortex-core displacement as a function of time,
$(y,z)$
. Nemes et al. (Reference Nemes, Lo Jacono, Blackburn and Sheridan2015) found an exponential evolution of the vortex-core displacement as a function of time,
![]() $d(t)\propto \exp (\unicode[STIX]{x1D6FC}t)$
.
$d(t)\propto \exp (\unicode[STIX]{x1D6FC}t)$
.
This section features an evaluation of the numerical set-up for the physical system considered in the present study. Four computations featuring
![]() $96^{3}$
,
$96^{3}$
,
![]() $144^{3}$
,
$144^{3}$
,
![]() $192^{3}$
and
$192^{3}$
and
![]() $256^{3}$
grid points with the physical parameters set to
$256^{3}$
grid points with the physical parameters set to
![]() $2h/R=1.08$
,
$2h/R=1.08$
,
![]() $r_{c}/R=0.06$
and
$r_{c}/R=0.06$
and
![]() $Re_{\unicode[STIX]{x1D6E4}}=7000$
are considered. The behaviour of the CvP–LES approach is first assessed by plotting the iso-surfaces of vorticity at various times of the
$Re_{\unicode[STIX]{x1D6E4}}=7000$
are considered. The behaviour of the CvP–LES approach is first assessed by plotting the iso-surfaces of vorticity at various times of the
![]() $192^{3}$
computation and colouring them using the turbulence sensor feature, see Chapelier et al. (Reference Chapelier, Wasistho and Scalo2018). Figure 2 shows that the turbulent sensor is first inactive during the transition, it then activates at locations when vortex filaments connect and start to generate small scales and ultimately stays active in the whole computational domain when the flow enters the fully developed turbulent regime. The sensor function is a factor of the eddy viscosity, allowing for a reduction of the subgrid dissipation in the vicinity of coherent vortices, which is particularly useful to capture accurately the transition.
$192^{3}$
computation and colouring them using the turbulence sensor feature, see Chapelier et al. (Reference Chapelier, Wasistho and Scalo2018). Figure 2 shows that the turbulent sensor is first inactive during the transition, it then activates at locations when vortex filaments connect and start to generate small scales and ultimately stays active in the whole computational domain when the flow enters the fully developed turbulent regime. The sensor function is a factor of the eddy viscosity, allowing for a reduction of the subgrid dissipation in the vicinity of coherent vortices, which is particularly useful to capture accurately the transition.
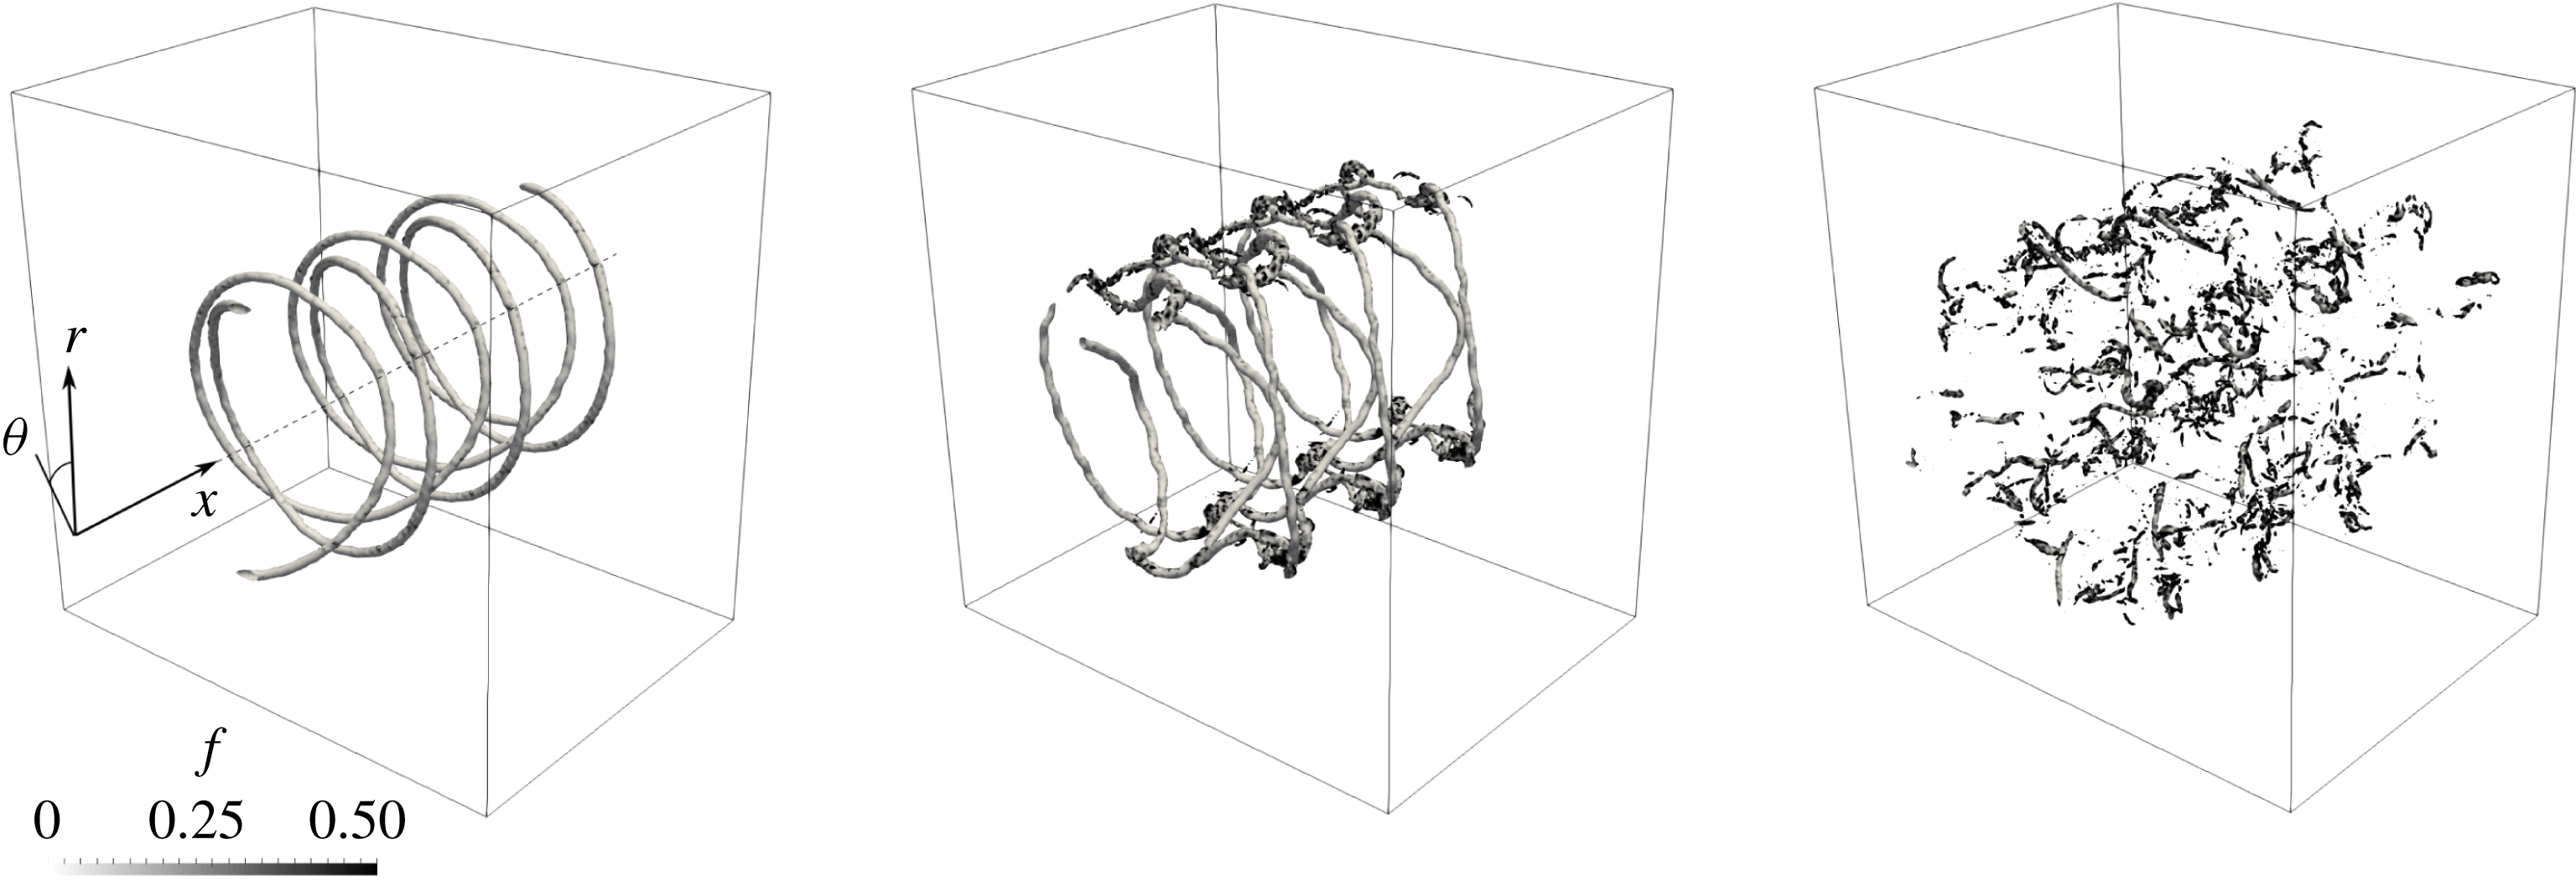
Figure 2. Iso-surfaces of vorticity coloured by the CvP–LES sensor function for three different times: before turbulent breakdown, during the vortex filament reconnection event and during the fully developed turbulent regime.
One critical concern is the number of grid points defined to discretize the vortex cores when the flow is initialized. This directly impacts the prediction of the growth rate,
![]() $\unicode[STIX]{x1D6FC}$
, which is based on the accurate identification of the vortex cores. Computations with
$\unicode[STIX]{x1D6FC}$
, which is based on the accurate identification of the vortex cores. Computations with
![]() $96^{3}$
,
$96^{3}$
,
![]() $144^{3}$
,
$144^{3}$
,
![]() $192^{3}$
and
$192^{3}$
and
![]() $256^{3}$
grid points resolve the initial vortex core of radius
$256^{3}$
grid points resolve the initial vortex core of radius
![]() $r_{c}$
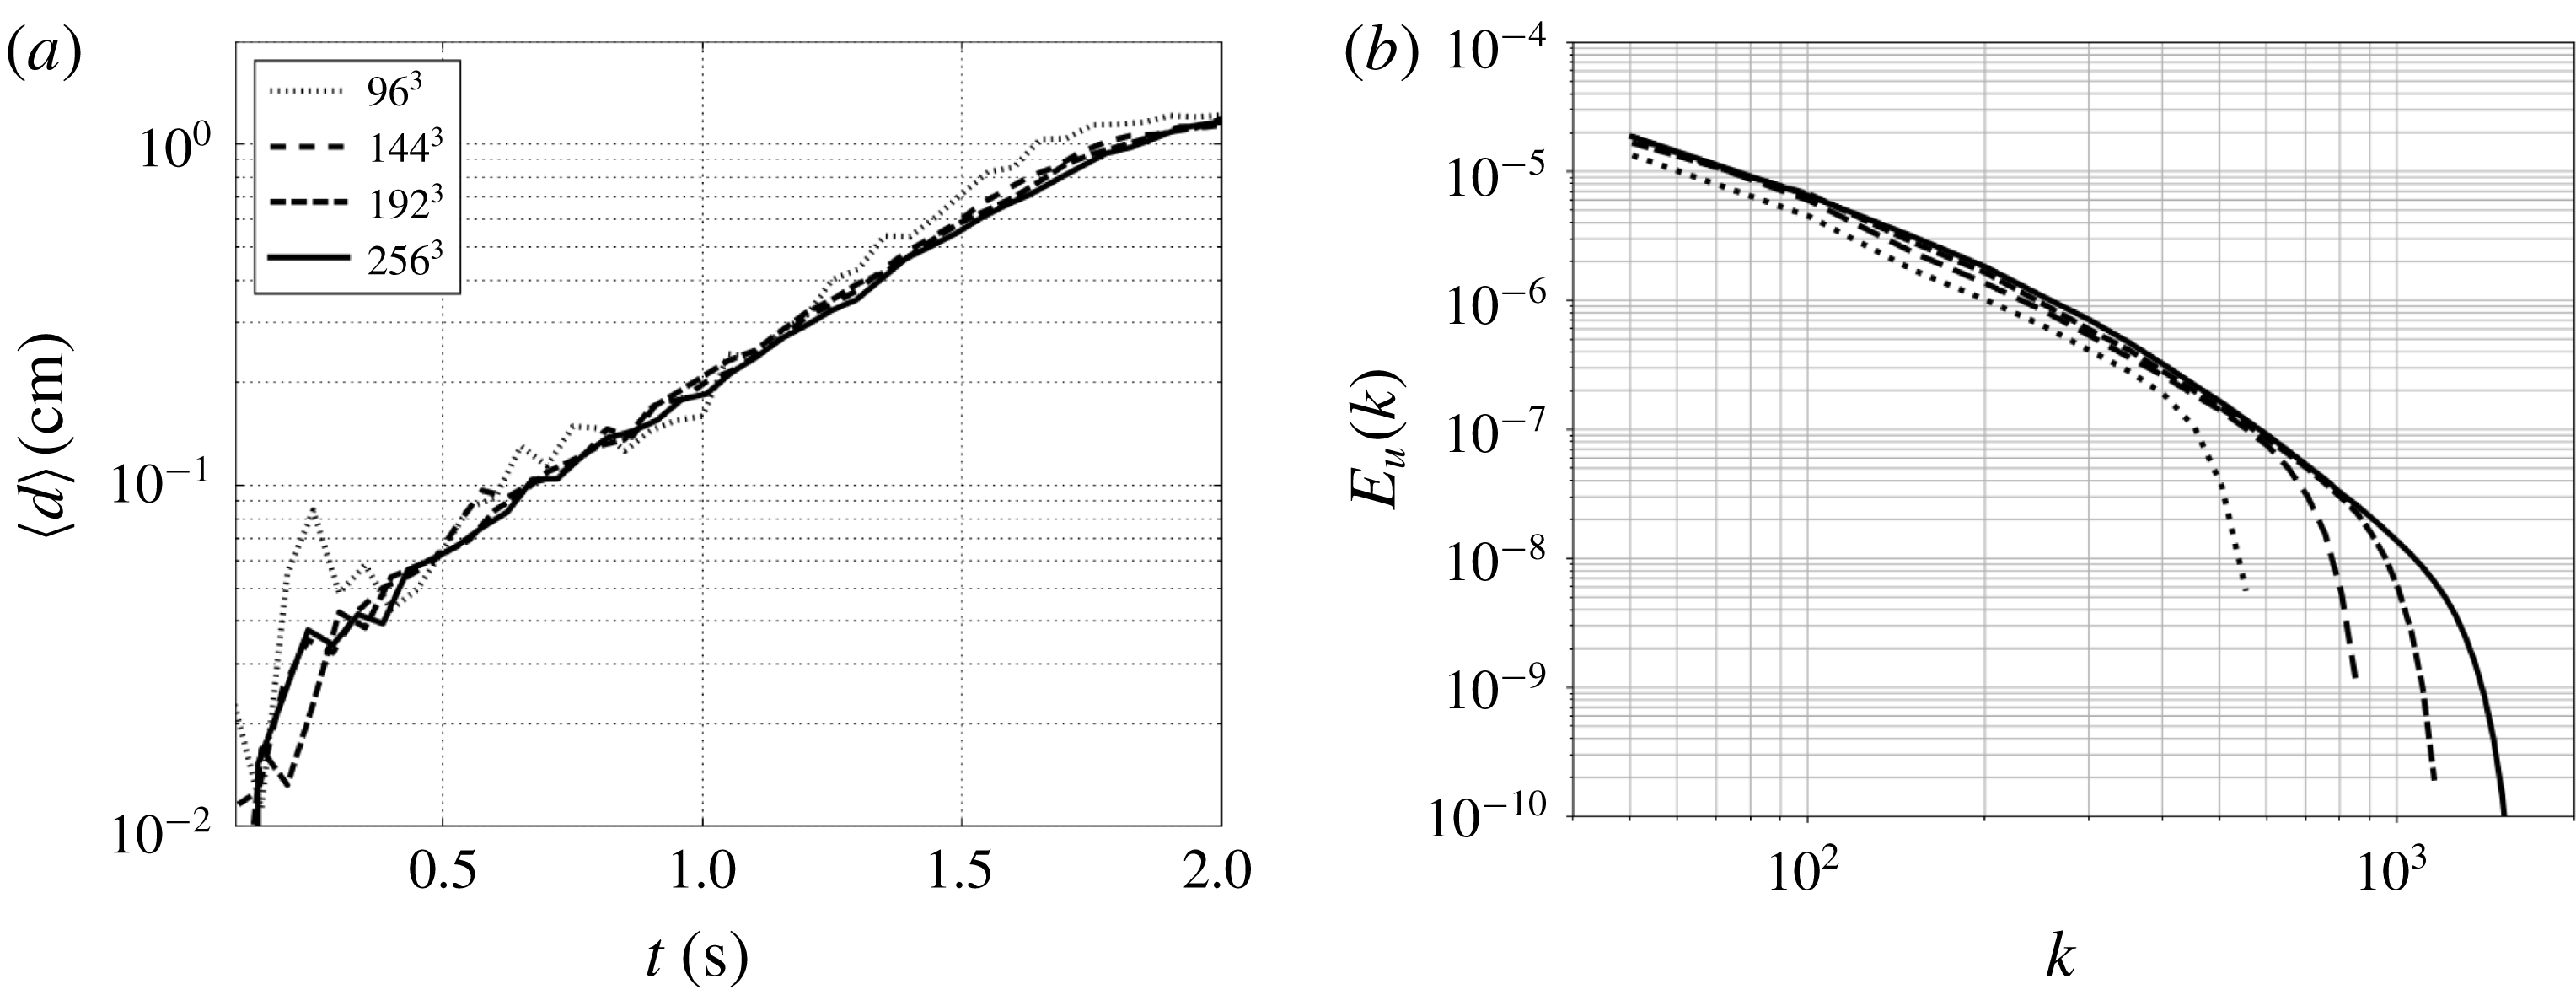
with respectively 2.5, 4, 5 and 7 grid points. The vortex-core displacement growth rates are shown in figure 3(a) for the three discretizations considered. The discretization with
$r_{c}$
with respectively 2.5, 4, 5 and 7 grid points. The vortex-core displacement growth rates are shown in figure 3(a) for the three discretizations considered. The discretization with
![]() $96^{3}$
grid points shows fluctuations of the vortex-core displacement due to the difficulty of identifying the vortex cores locations at coarse resolution. Increasing the number of grid points leads to a smoother evolution, yielding quasi-grid-independent results for resolutions of
$96^{3}$
grid points shows fluctuations of the vortex-core displacement due to the difficulty of identifying the vortex cores locations at coarse resolution. Increasing the number of grid points leads to a smoother evolution, yielding quasi-grid-independent results for resolutions of
![]() $144^{3}$
and beyond. Four points per vortex core are hence sufficient to capture the initial inviscid evolution of the flow. The grid convergence is also checked for the fully developed turbulence part by assessing the axial energy spectra at the final time of computations (
$144^{3}$
and beyond. Four points per vortex core are hence sufficient to capture the initial inviscid evolution of the flow. The grid convergence is also checked for the fully developed turbulence part by assessing the axial energy spectra at the final time of computations (
![]() $t=12~\text{s}$
), plotted in figure 3(b). Again, from the resolution of
$t=12~\text{s}$
), plotted in figure 3(b). Again, from the resolution of
![]() $144^{3}$
onwards, the spectra peel off each other, demonstrating the grid convergence of the numerical procedure. Only the
$144^{3}$
onwards, the spectra peel off each other, demonstrating the grid convergence of the numerical procedure. Only the
![]() $96^{3}$
discretization seems under-resolved and shows differences with the other grids also in the lower wavenumber range. This convergence study suggests that the
$96^{3}$
discretization seems under-resolved and shows differences with the other grids also in the lower wavenumber range. This convergence study suggests that the
![]() $192^{3}$
grid is adequate to represent accurately the range of relevant physical phenomena for the present validation study and is chosen as the reference discretization for the comparison with experimental results involving several values of
$192^{3}$
grid is adequate to represent accurately the range of relevant physical phenomena for the present validation study and is chosen as the reference discretization for the comparison with experimental results involving several values of
![]() $2h/R$
.
$2h/R$
.
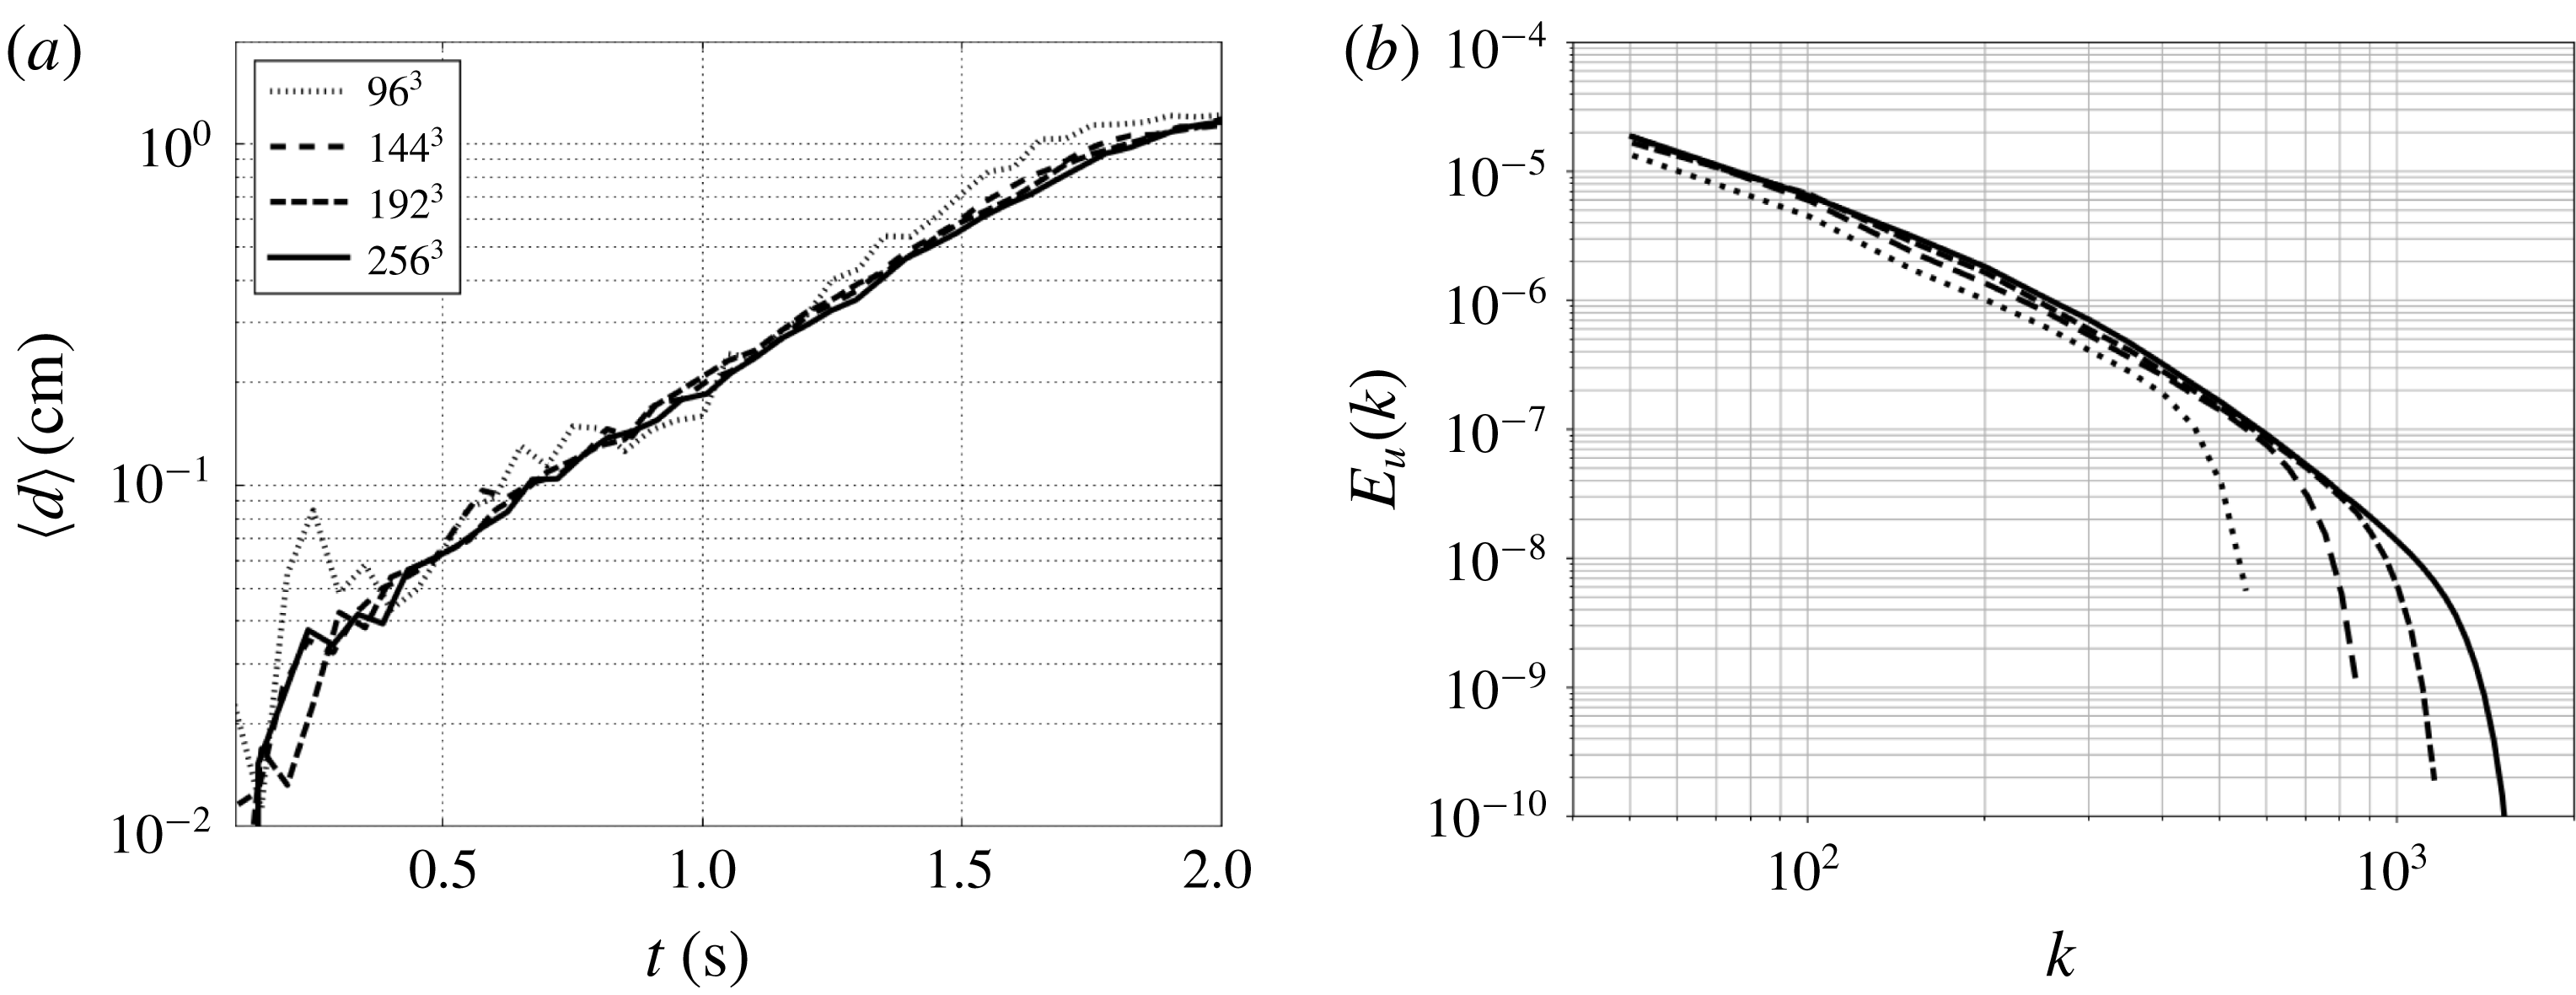
Figure 3. Sensitivity of growth rates (a) and energy spectra at
![]() $t=12~\text{s}$
(b) to the discretization for the LES computations of the pair of helical vortices at
$t=12~\text{s}$
(b) to the discretization for the LES computations of the pair of helical vortices at
![]() $Re_{\unicode[STIX]{x1D6E4}}=7000$
.
$Re_{\unicode[STIX]{x1D6E4}}=7000$
.

Figure 4. (a) Comparison of experimental and numerical growth rates for the validation of the LES computations of the pair of helical vortices at
![]() $Re_{\unicode[STIX]{x1D6E4}}=7000$
. The evolution of the average vortex-core displacement
$Re_{\unicode[STIX]{x1D6E4}}=7000$
. The evolution of the average vortex-core displacement
![]() $d(t)$
(4.1) after the transition to turbulence is not displayed. (b) Sketch of helix vortex-core displacement.
$d(t)$
(4.1) after the transition to turbulence is not displayed. (b) Sketch of helix vortex-core displacement.
Table 1. Experimental and numerical growth rates
![]() $\unicode[STIX]{x1D6FC}$
computed as
$\unicode[STIX]{x1D6FC}$
computed as
![]() $d(t)\propto \exp (\unicode[STIX]{x1D6FC}t)$
. Experimental measurements have an uncertainty of 5–12 % (Nemes et al.
Reference Nemes, Lo Jacono, Blackburn and Sheridan2015).
$d(t)\propto \exp (\unicode[STIX]{x1D6FC}t)$
. Experimental measurements have an uncertainty of 5–12 % (Nemes et al.
Reference Nemes, Lo Jacono, Blackburn and Sheridan2015).

Figure 4 shows the growth rates of vortex-core displacement computed numerically as well as the exponential slopes determined in the experiments by Nemes et al. (Reference Nemes, Lo Jacono, Blackburn and Sheridan2015). As seen from figure 4 and table 1, a very good agreement is found between the simulations and experiment for the four different cases considered, thus corroborating the adequacy of the present numerical set-up for the study of transitional helical vortices subject to mutual inductance. Also, the fact that the temporal growth of the vortex-core displacement is a function of the helical pitch provides the evidence that the transition is driven by the mutual inductance between the successive turns of the helices.
5 Dynamics of a pair of helical vortices subject to mutual inductance
5.1 Flow parameters
This section features a comprehensive physical study of the system of a temporally developing pair of helical vortices. The dynamics of the various flow regimes is studied considering a range of flow parameters. When the helical pitch
![]() $h$
and circulation
$h$
and circulation
![]() $\unicode[STIX]{x1D6E4}$
are chosen as reference parameters, three non-dimensional quantities govern the dynamics of the present configuration. Namely, the ratio of pitch to helix radius
$\unicode[STIX]{x1D6E4}$
are chosen as reference parameters, three non-dimensional quantities govern the dynamics of the present configuration. Namely, the ratio of pitch to helix radius
![]() $h/R$
, the ratio of vortex radius to pitch
$h/R$
, the ratio of vortex radius to pitch
![]() $r_{c}/h$
and the Reynolds number
$r_{c}/h$
and the Reynolds number
![]() $Re_{\unicode[STIX]{x1D6E4}}$
. A complete parametric study is performed to assess the influence of each quantity on the growth rate of vortex-core displacements driven by mutual inductance. The Reynolds number values span from
$Re_{\unicode[STIX]{x1D6E4}}$
. A complete parametric study is performed to assess the influence of each quantity on the growth rate of vortex-core displacements driven by mutual inductance. The Reynolds number values span from
![]() $Re_{\unicode[STIX]{x1D6E4}}=7000$
to
$Re_{\unicode[STIX]{x1D6E4}}=7000$
to
![]() $Re_{\unicode[STIX]{x1D6E4}}=70\,000$
, the ratio helical radius to helical pitch from
$Re_{\unicode[STIX]{x1D6E4}}=70\,000$
, the ratio helical radius to helical pitch from
![]() $h/R=0.36$
to
$h/R=0.36$
to
![]() $h/R=0.61$
and the vortex-core radius from
$h/R=0.61$
and the vortex-core radius from
![]() $r_{c}/h=0.166$
to
$r_{c}/h=0.166$
to
![]() $r_{c}/h=0.333$
. To give an idea about the size of the vortex-core radius compared to the helix radius, which is often employed in the literature, the present flow conditions span values of
$r_{c}/h=0.333$
. To give an idea about the size of the vortex-core radius compared to the helix radius, which is often employed in the literature, the present flow conditions span values of
![]() $r_{c}/R$
between 0.06 and 0.20. Table 2 summarizes the parameter space for the present study, yielding 18 computations for the combination of all possible values. A thorough evaluation of the resolution quality for each Reynolds number has been performed including computations considering various mesh sizes, and is found in appendix A. It has been determined that resolutions of
$r_{c}/R$
between 0.06 and 0.20. Table 2 summarizes the parameter space for the present study, yielding 18 computations for the combination of all possible values. A thorough evaluation of the resolution quality for each Reynolds number has been performed including computations considering various mesh sizes, and is found in appendix A. It has been determined that resolutions of
![]() $288^{3}$
,
$288^{3}$
,
![]() $384^{3}$
and
$384^{3}$
and
![]() $480^{3}$
grids points are adapted to the Reynolds numbers
$480^{3}$
grids points are adapted to the Reynolds numbers
![]() $Re_{\unicode[STIX]{x1D6E4}}=7000$
, 21 000 and
$Re_{\unicode[STIX]{x1D6E4}}=7000$
, 21 000 and
![]() $70\,000$
, respectively.
$70\,000$
, respectively.
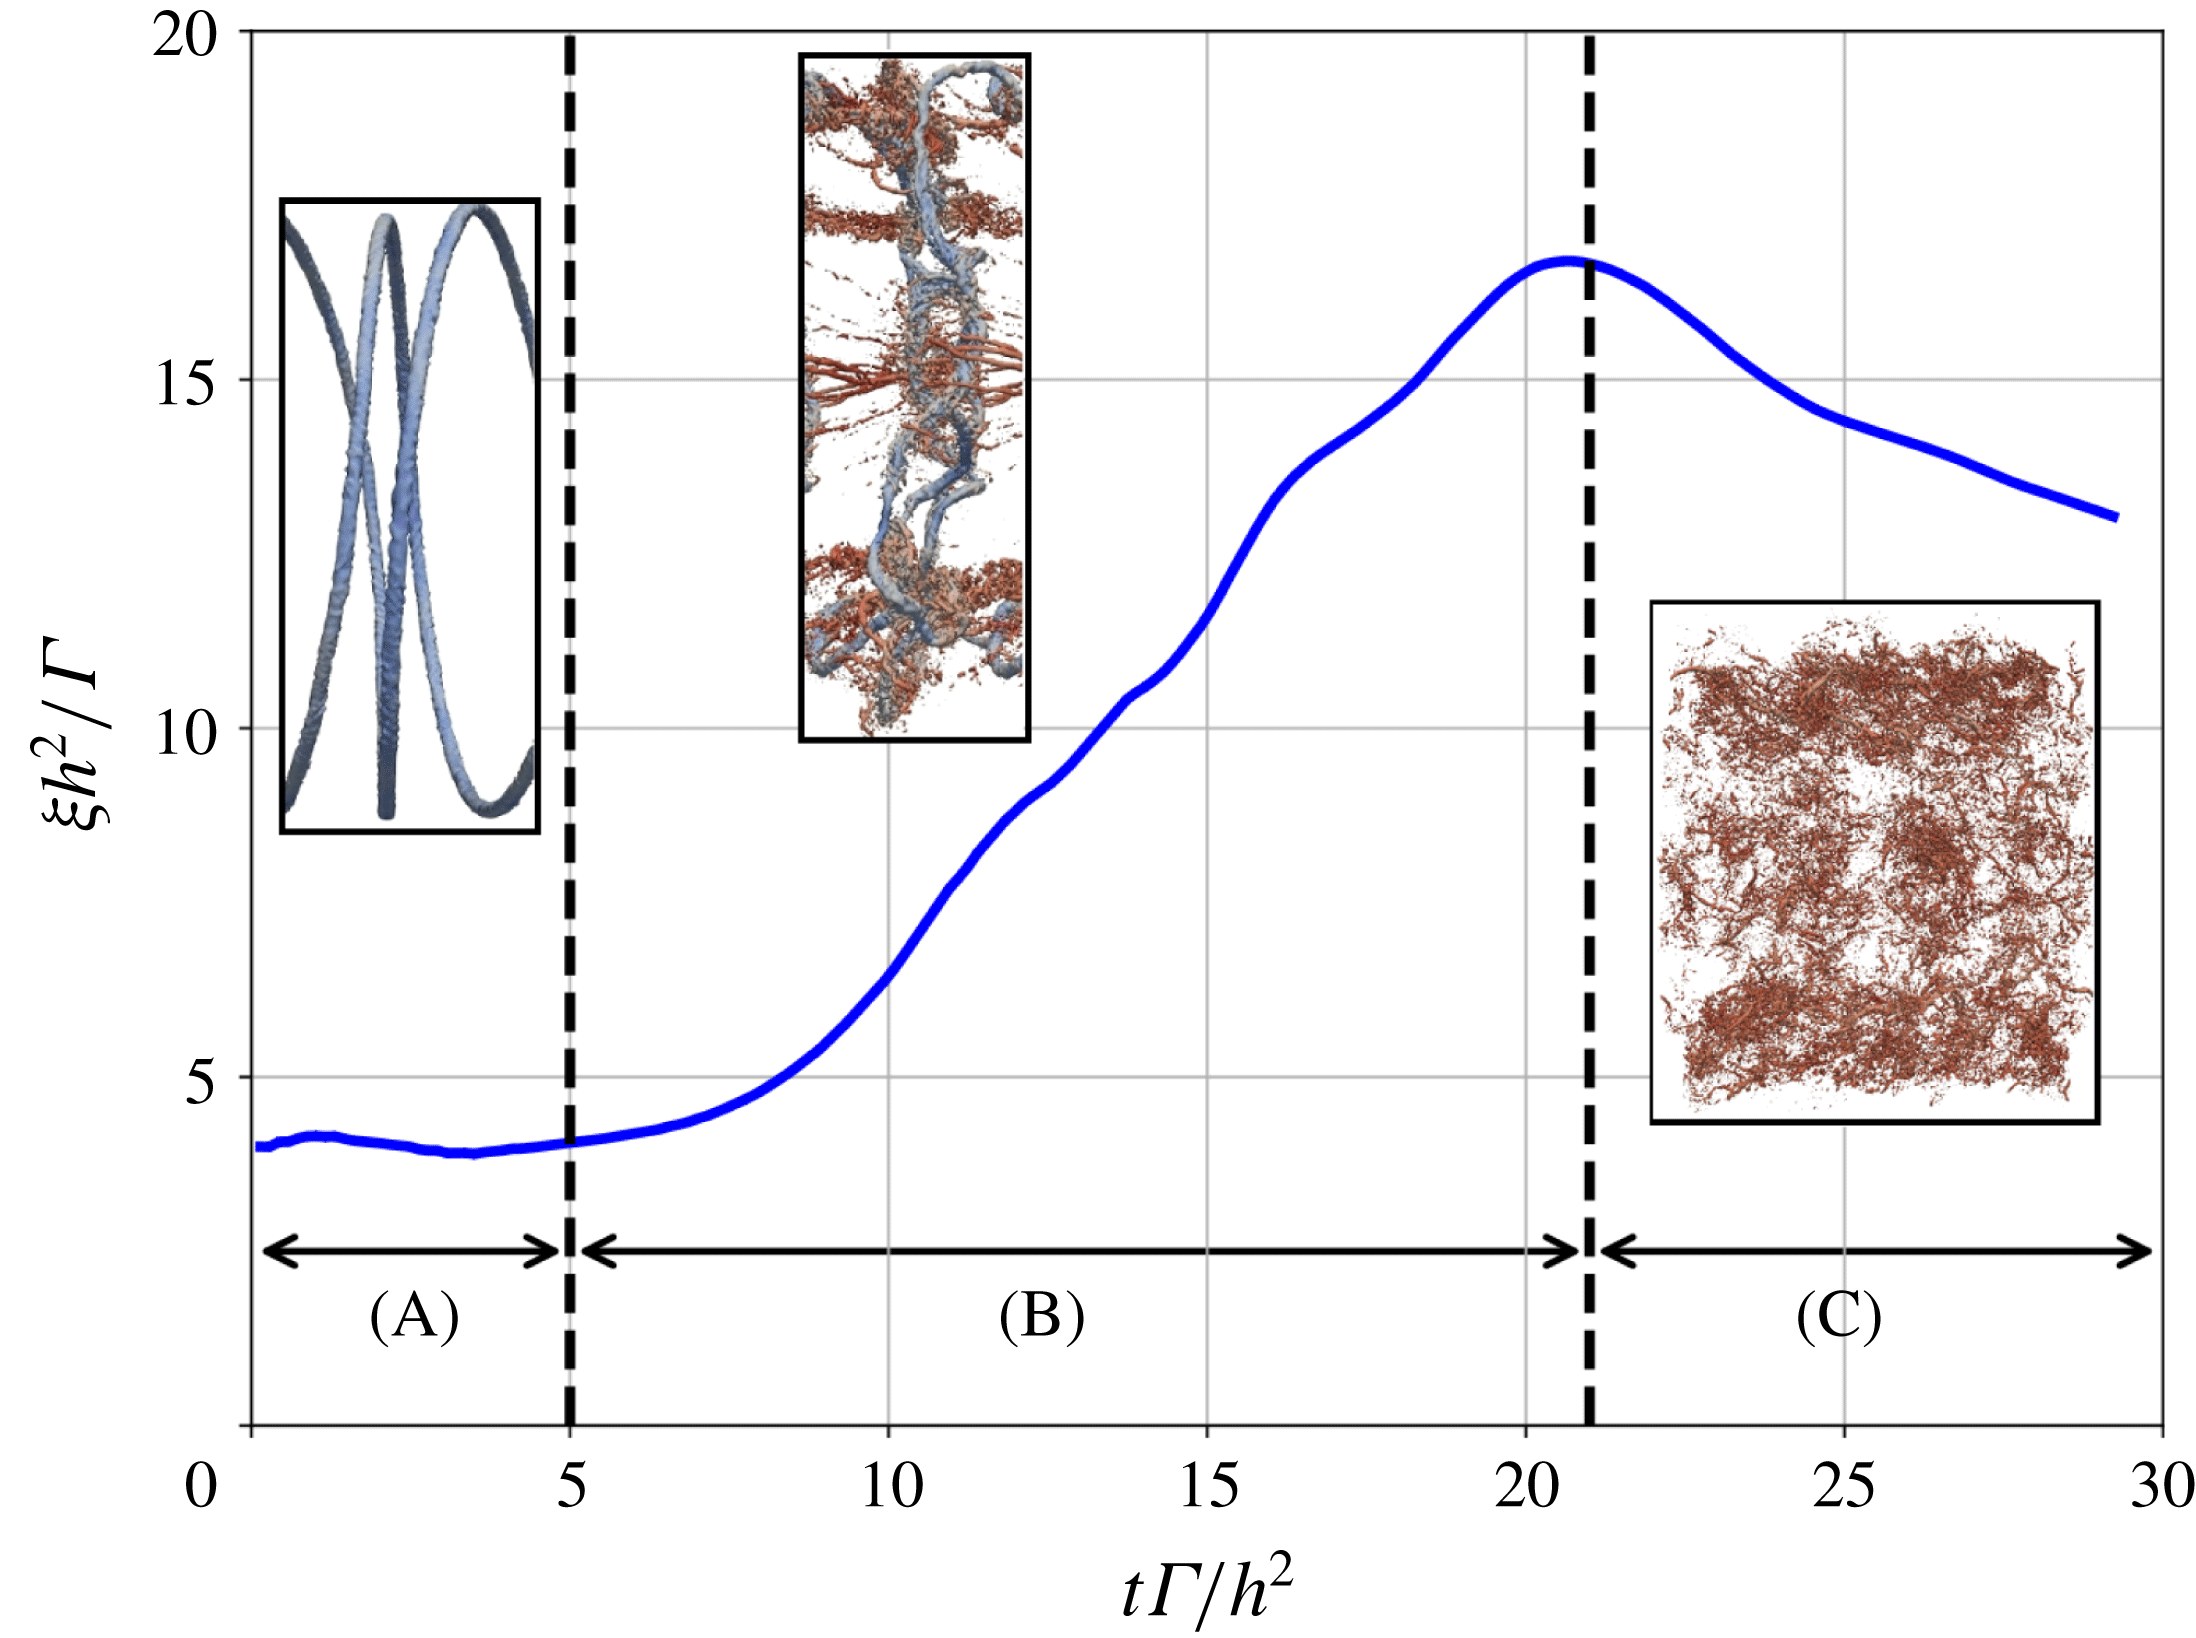
Figure 5. Flow regimes described from the evolution of volume-averaged enstrophy. Case
![]() $r_{c}/h=0.166$
,
$r_{c}/h=0.166$
,
![]() $Re_{\unicode[STIX]{x1D6E4}}=21\,000$
and
$Re_{\unicode[STIX]{x1D6E4}}=21\,000$
and
![]() $h/R=0.36$
.
$h/R=0.36$
.
Table 2. Parameter space and corresponding symbols for the computations of the double helical vortex configuration. These conditions are reproduced for two different vortex-core radius ratios:
![]() $r_{c}/h=0.166$
and
$r_{c}/h=0.166$
and
![]() $r_{c}/h=0.333$
.
$r_{c}/h=0.333$
.

5.2 Regimes of flow evolution
The flow can be decomposed into three different regimes, represented on the enstrophy evolution in figure 5, as a function of the non-dimensional time
![]() $t^{\star }=t\unicode[STIX]{x1D6E4}/h^{2}$
. From the beginning of the computation up to
$t^{\star }=t\unicode[STIX]{x1D6E4}/h^{2}$
. From the beginning of the computation up to
![]() $t^{\star }\approx 5$
(regime (A)), the flow dynamics is essentially inviscid, and the helical structures undergo relative displacements of their vortex cores with respect to the initial radius, induced by the mutual interaction between vortex filaments. During this first period, the volume-averaged enstrophy remains approximately constant in the flow as the vortices do not experience significant modification of their properties (vortex-core shapes and circulation). From
$t^{\star }\approx 5$
(regime (A)), the flow dynamics is essentially inviscid, and the helical structures undergo relative displacements of their vortex cores with respect to the initial radius, induced by the mutual interaction between vortex filaments. During this first period, the volume-averaged enstrophy remains approximately constant in the flow as the vortices do not experience significant modification of their properties (vortex-core shapes and circulation). From
![]() $t^{\star }=5$
and onwards (regime (B)), we can notice a strong increase of enstrophy levels in the flow. The relative displacement of the vortex cores becomes significant enough such that the vortex lines become closer to each other and start interacting strongly, ultimately leading to the reconnection of vortex filaments at multiple locations on the helices. These vortex reconnection events generate small scales in the flow and modify significantly the shape of the initial helical vortices. The peak of enstrophy is reached when all the vortex reconnection events have occurred and all scales have developed in the flow. The time corresponding to the peak of enstrophy may vary depending on the flow parameters (Reynolds, helical pitch, initial vortex-core radius). After the peak of enstrophy is reached, the fully developed turbulent regime (C) is established.
$t^{\star }=5$
and onwards (regime (B)), we can notice a strong increase of enstrophy levels in the flow. The relative displacement of the vortex cores becomes significant enough such that the vortex lines become closer to each other and start interacting strongly, ultimately leading to the reconnection of vortex filaments at multiple locations on the helices. These vortex reconnection events generate small scales in the flow and modify significantly the shape of the initial helical vortices. The peak of enstrophy is reached when all the vortex reconnection events have occurred and all scales have developed in the flow. The time corresponding to the peak of enstrophy may vary depending on the flow parameters (Reynolds, helical pitch, initial vortex-core radius). After the peak of enstrophy is reached, the fully developed turbulent regime (C) is established.
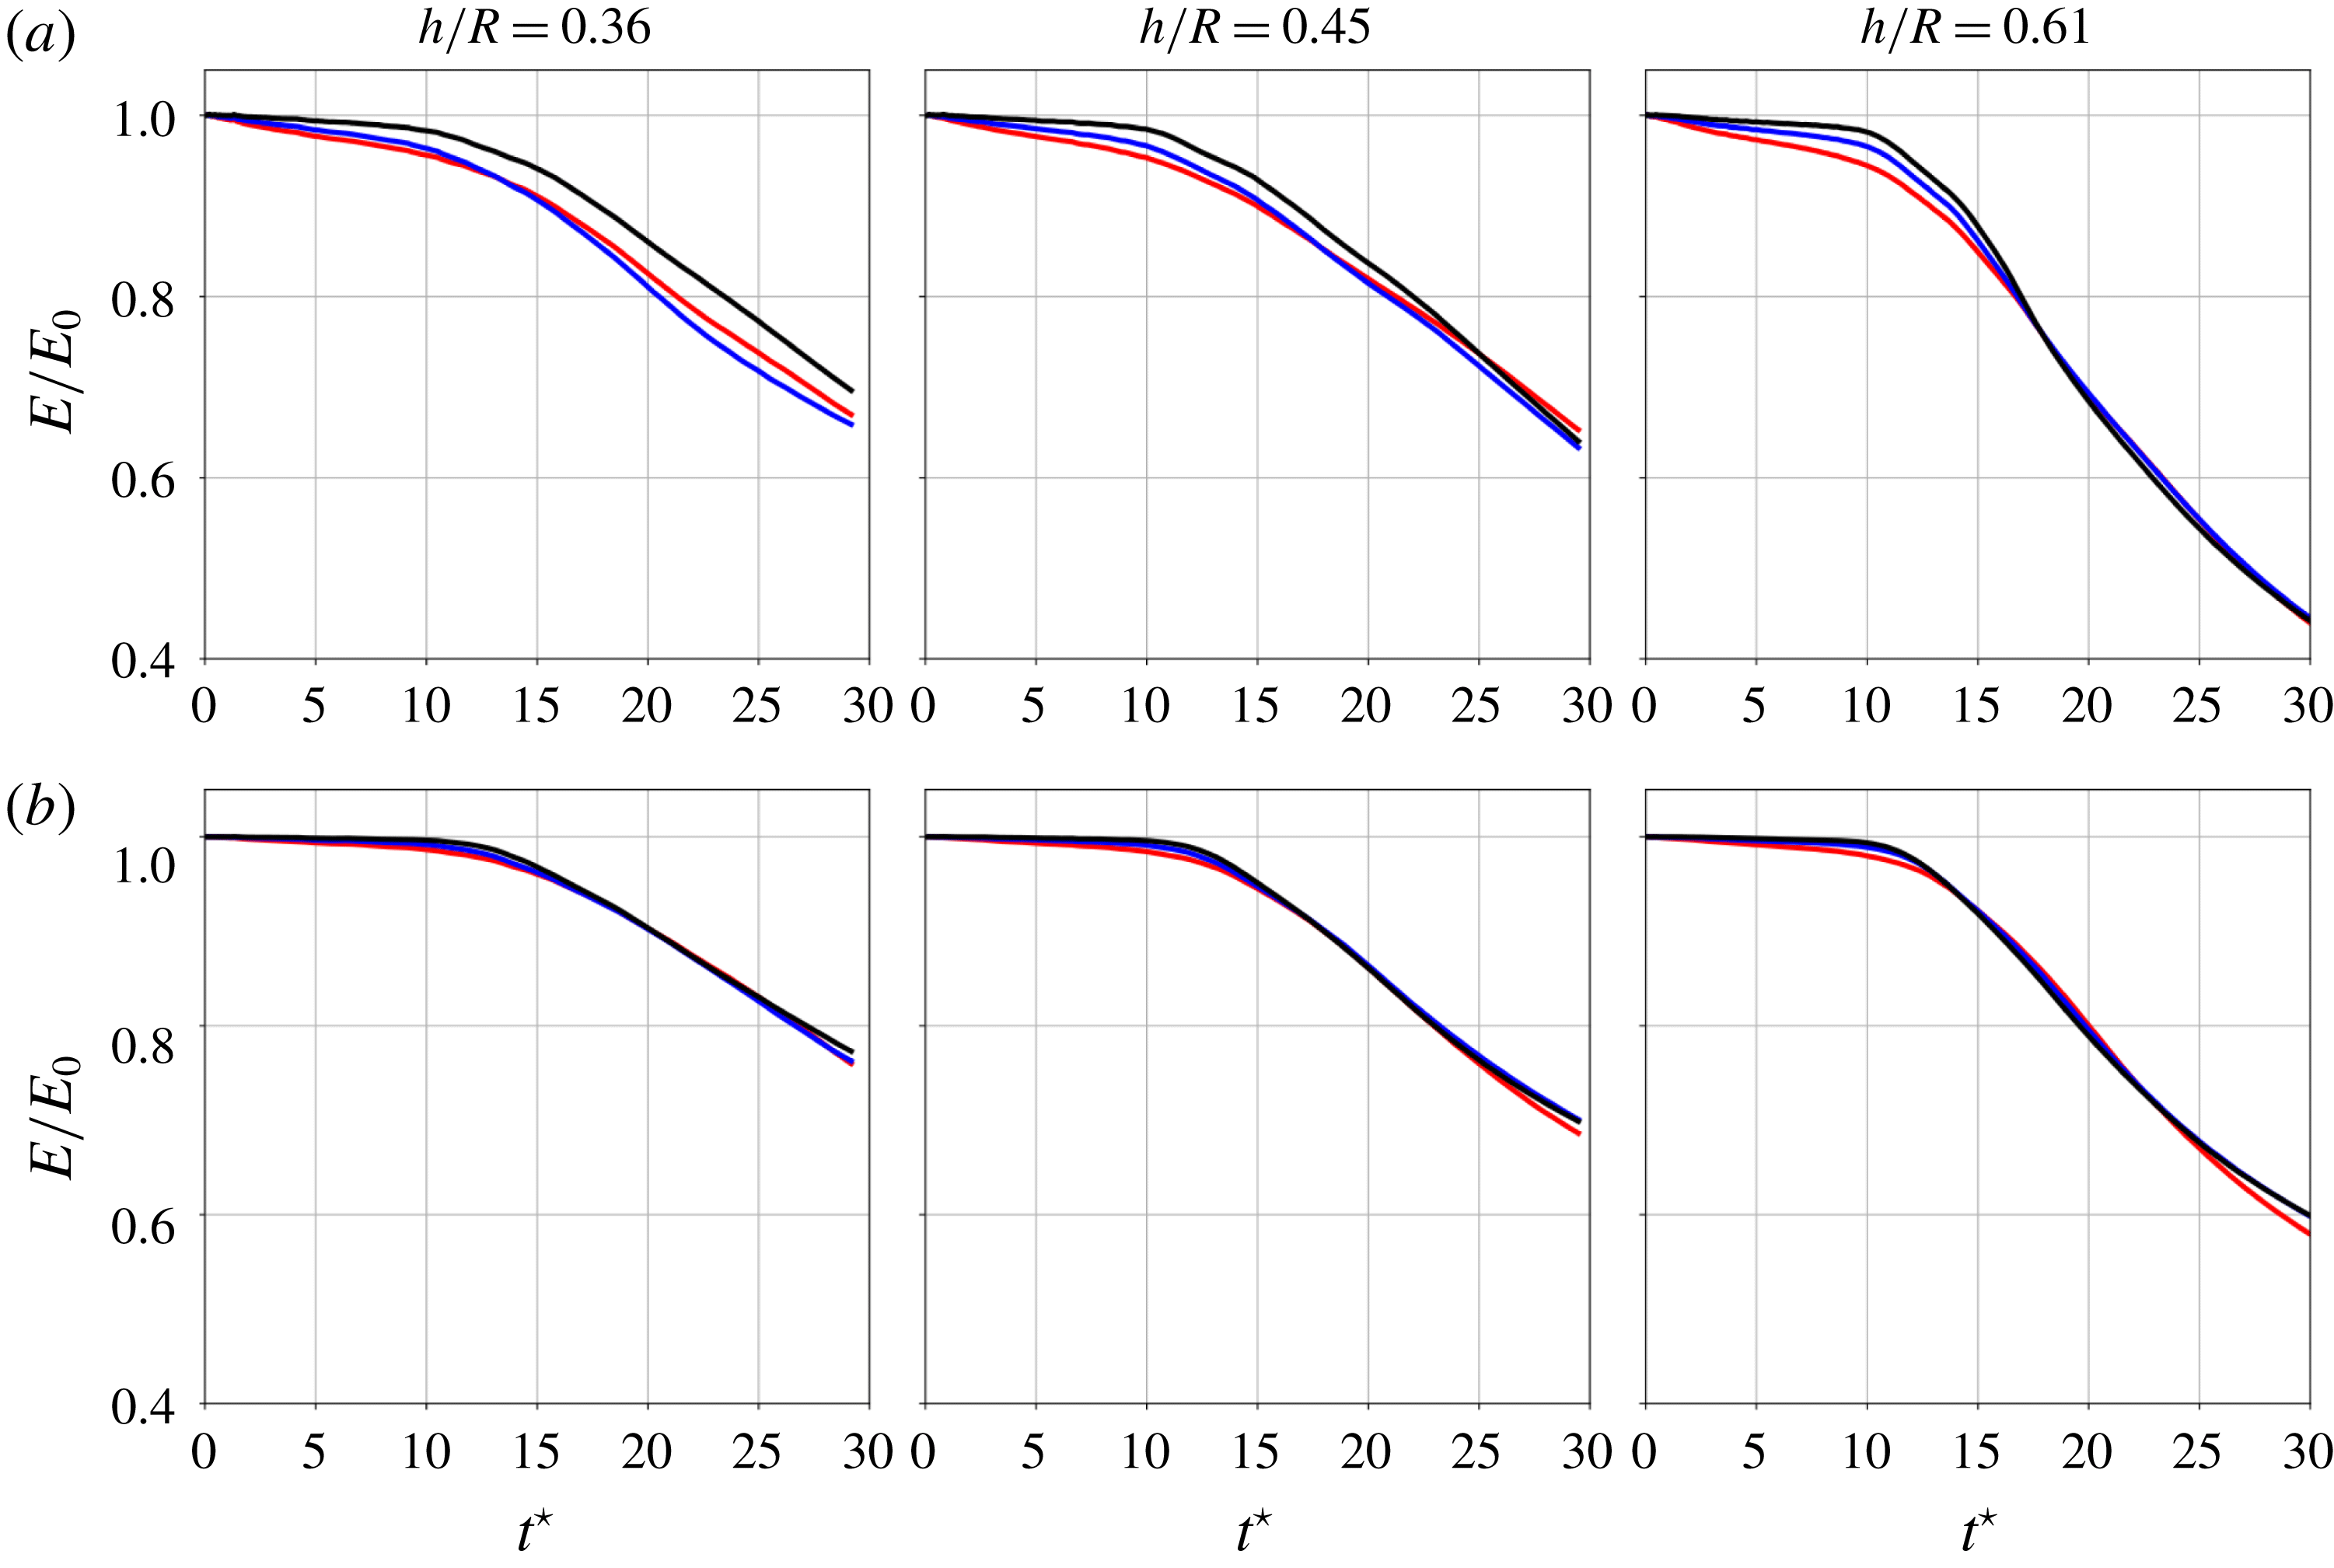
A number of considerations can be made by inspecting the evolution of the volume-averaged kinetic energy (figure 6). For all cases, the energy weakly decays up to
![]() $t^{\star }\approx 10$
, corresponding to the period during which the flow evolution is mostly inviscid. Lower Reynolds number cases have the viscous diffusion impact at the large scales from the beginning of the computations, yielding stronger energy decrease. Another interesting observation lies in the fact that even if the non-dimensional time scale
$t^{\star }\approx 10$
, corresponding to the period during which the flow evolution is mostly inviscid. Lower Reynolds number cases have the viscous diffusion impact at the large scales from the beginning of the computations, yielding stronger energy decrease. Another interesting observation lies in the fact that even if the non-dimensional time scale
![]() $t^{\star }$
related to parameters
$t^{\star }$
related to parameters
![]() $h$
and
$h$
and
![]() $\unicode[STIX]{x1D6E4}$
is fit to collapse the flow evolution for all cases up to
$\unicode[STIX]{x1D6E4}$
is fit to collapse the flow evolution for all cases up to
![]() $t^{\star }\approx 10$
, it does not collapse the turbulent decay rates for
$t^{\star }\approx 10$
, it does not collapse the turbulent decay rates for
![]() $t^{\star }>10$
. Given that the non-dimensional time
$t^{\star }>10$
. Given that the non-dimensional time
![]() $t^{\star }$
is scaled with the helical pitch
$t^{\star }$
is scaled with the helical pitch
![]() $h$
, the dimensional time at
$h$
, the dimensional time at
![]() $t^{\star }=30$
is higher for higher values of
$t^{\star }=30$
is higher for higher values of
![]() $h$
. It is therefore likely that by
$h$
. It is therefore likely that by
![]() $t^{\star }=30$
, the wake is at a more advanced stage of development for higher helical pitches.
$t^{\star }=30$
, the wake is at a more advanced stage of development for higher helical pitches.
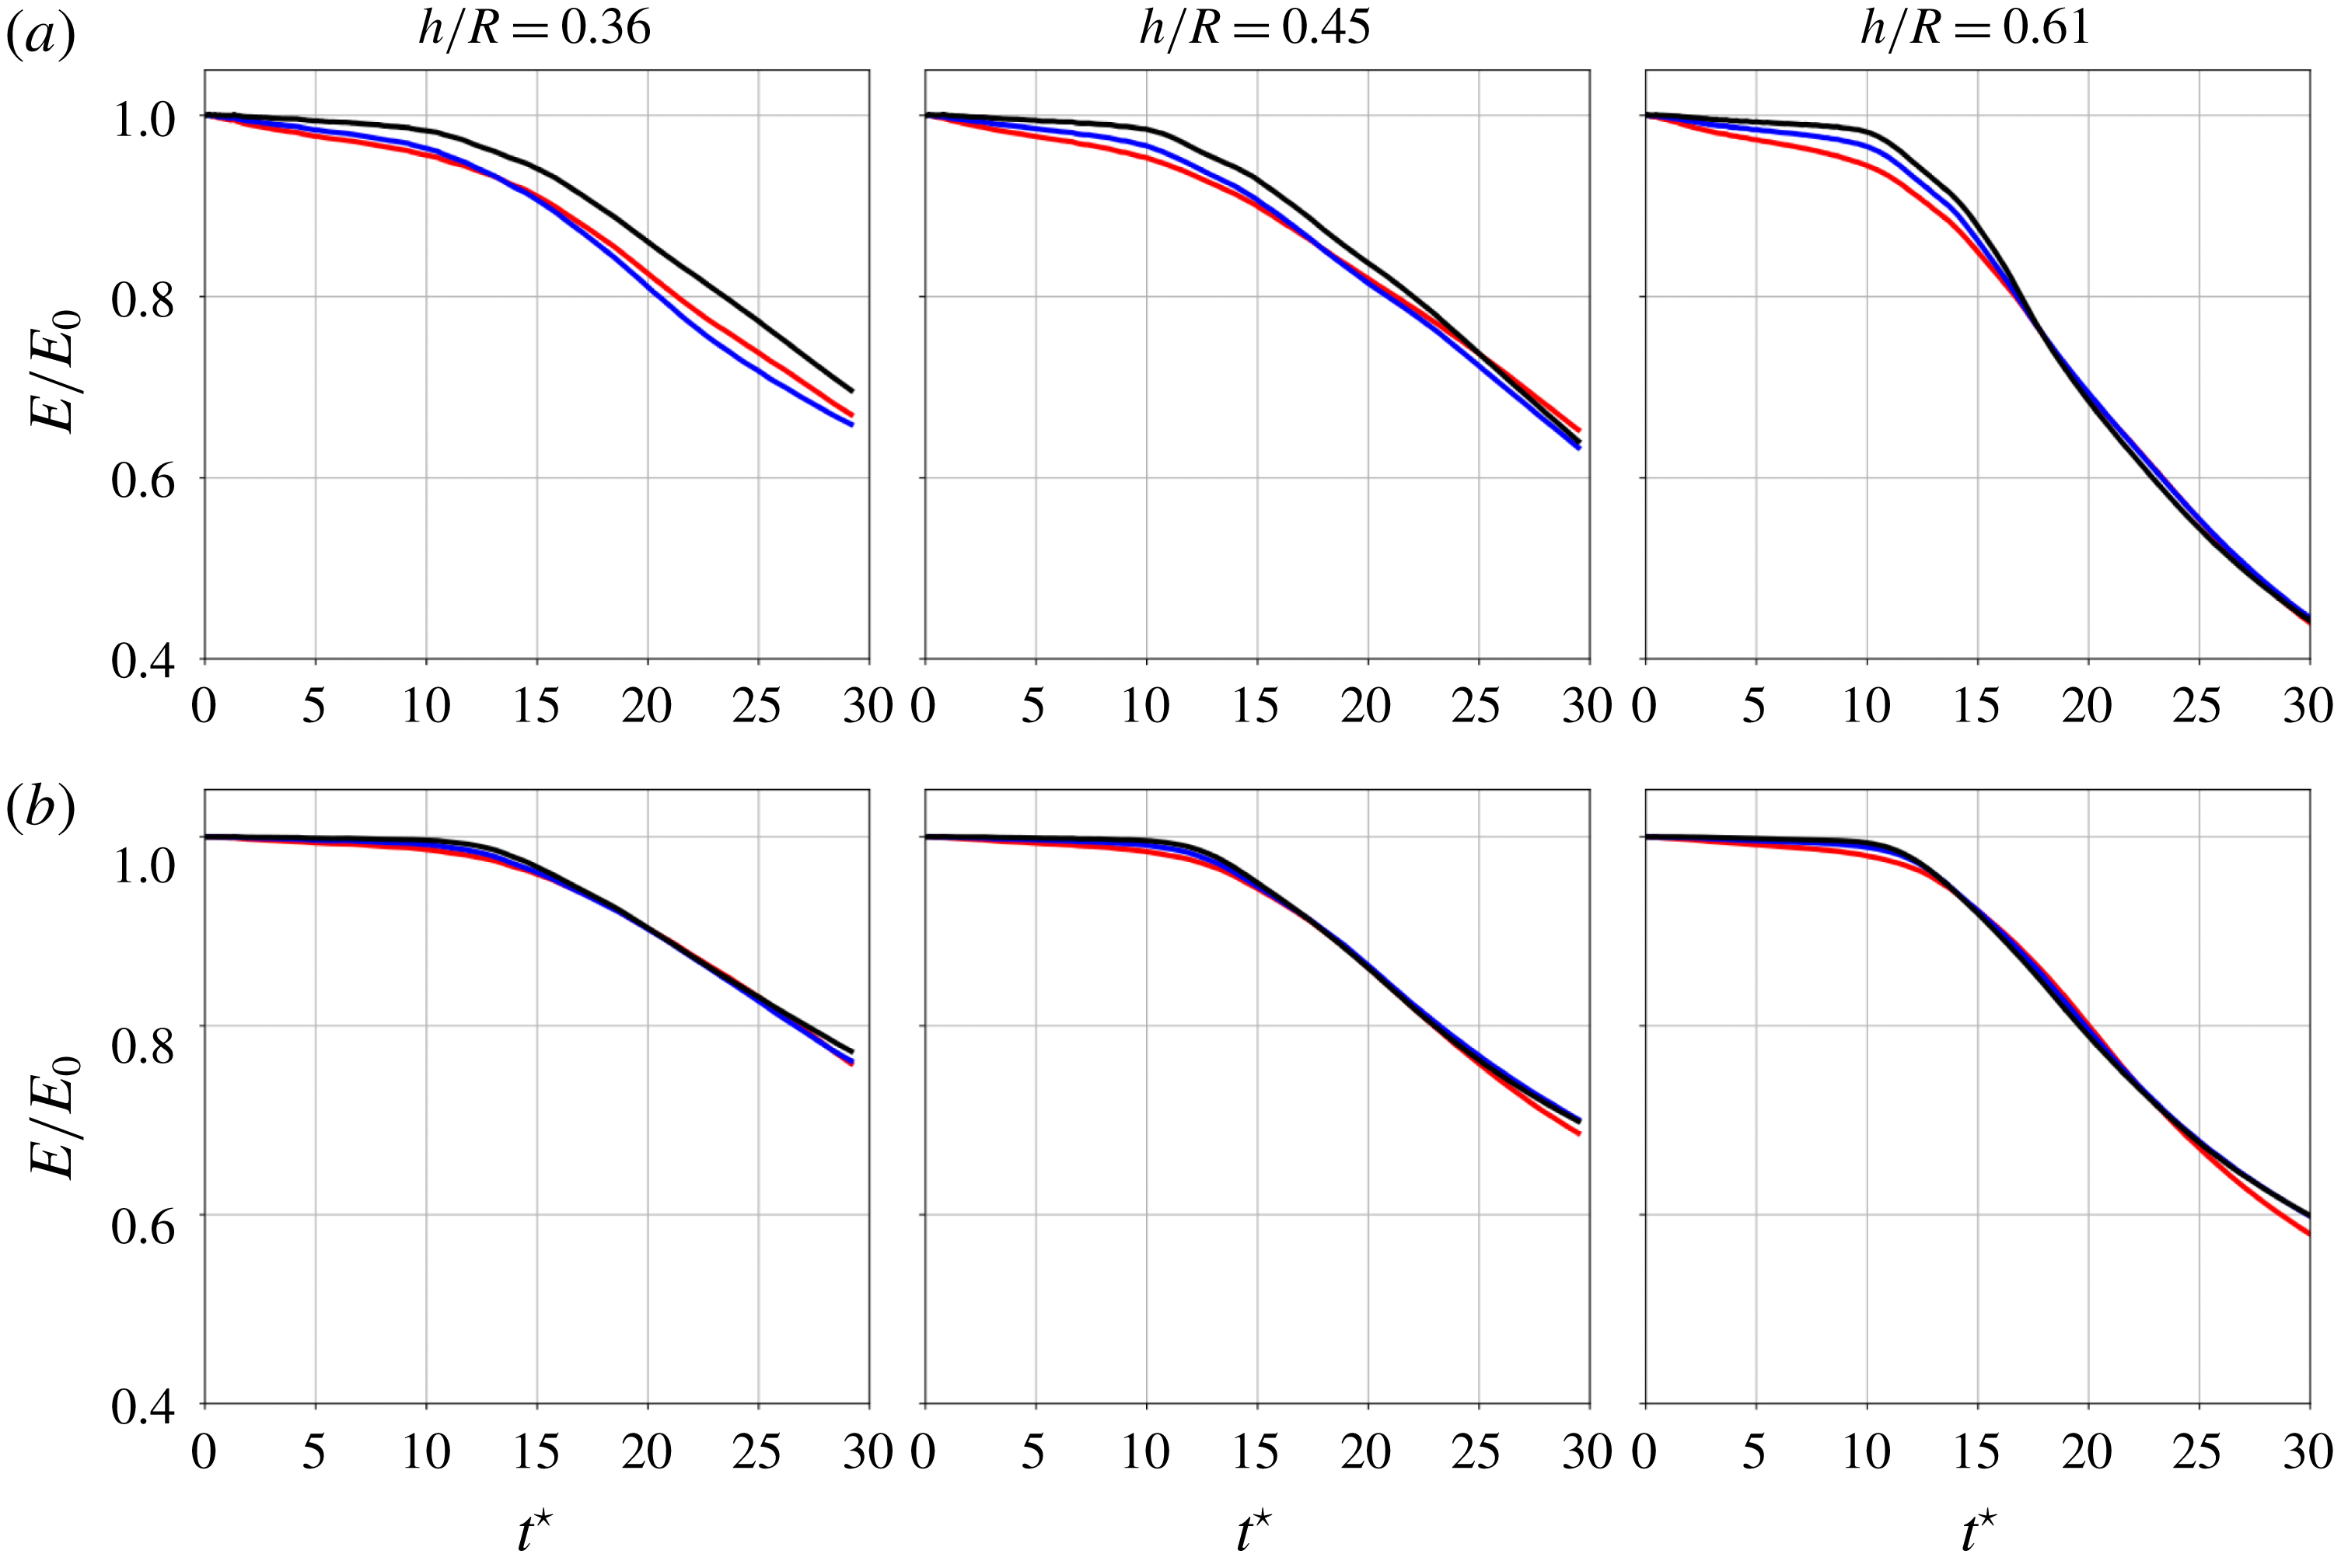
Figure 6. Evolution of kinetic energy normalized by its initial value as a function of dimensionless time
![]() $t^{\star }$
, for vortex-core radius
$t^{\star }$
, for vortex-core radius
![]() $r_{c}/h=0.166$
(a) and
$r_{c}/h=0.166$
(a) and
![]() $r_{c}/h=0.333$
(b). Different colours correspond to different Reynolds numbers (see table 2).
$r_{c}/h=0.333$
(b). Different colours correspond to different Reynolds numbers (see table 2).
5.3 Inviscid regime and vortex-core displacement growth rates
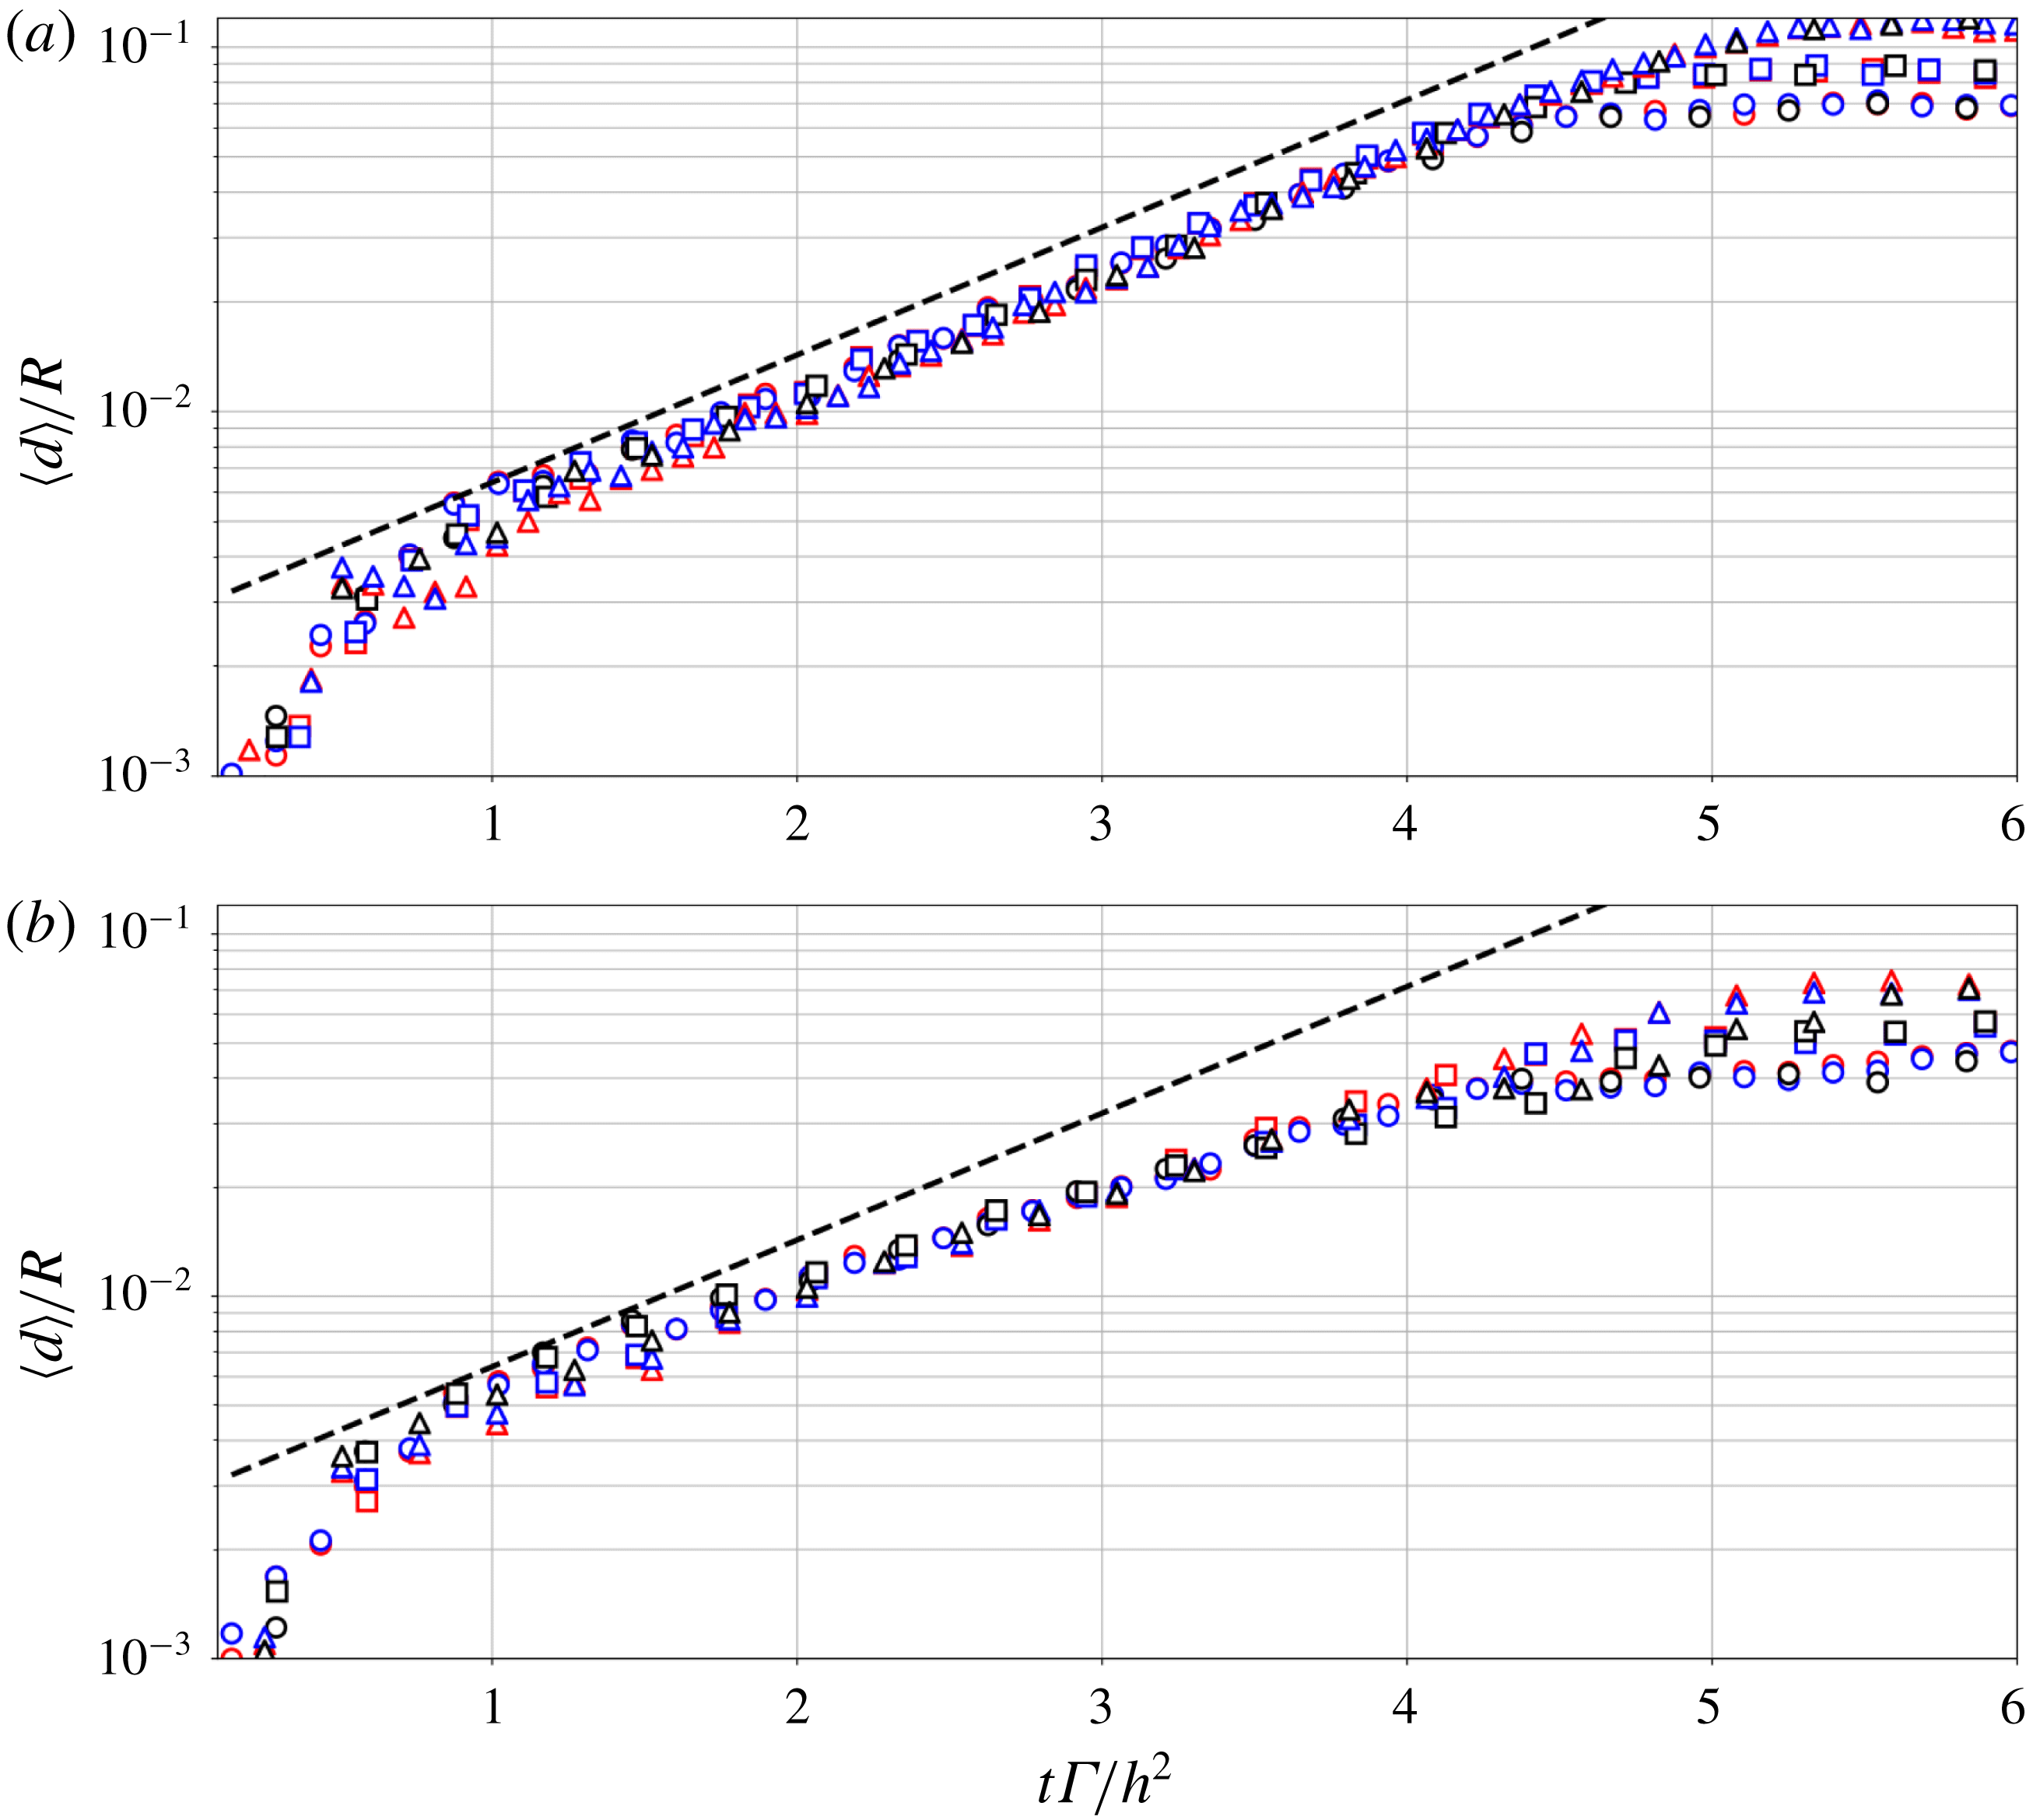
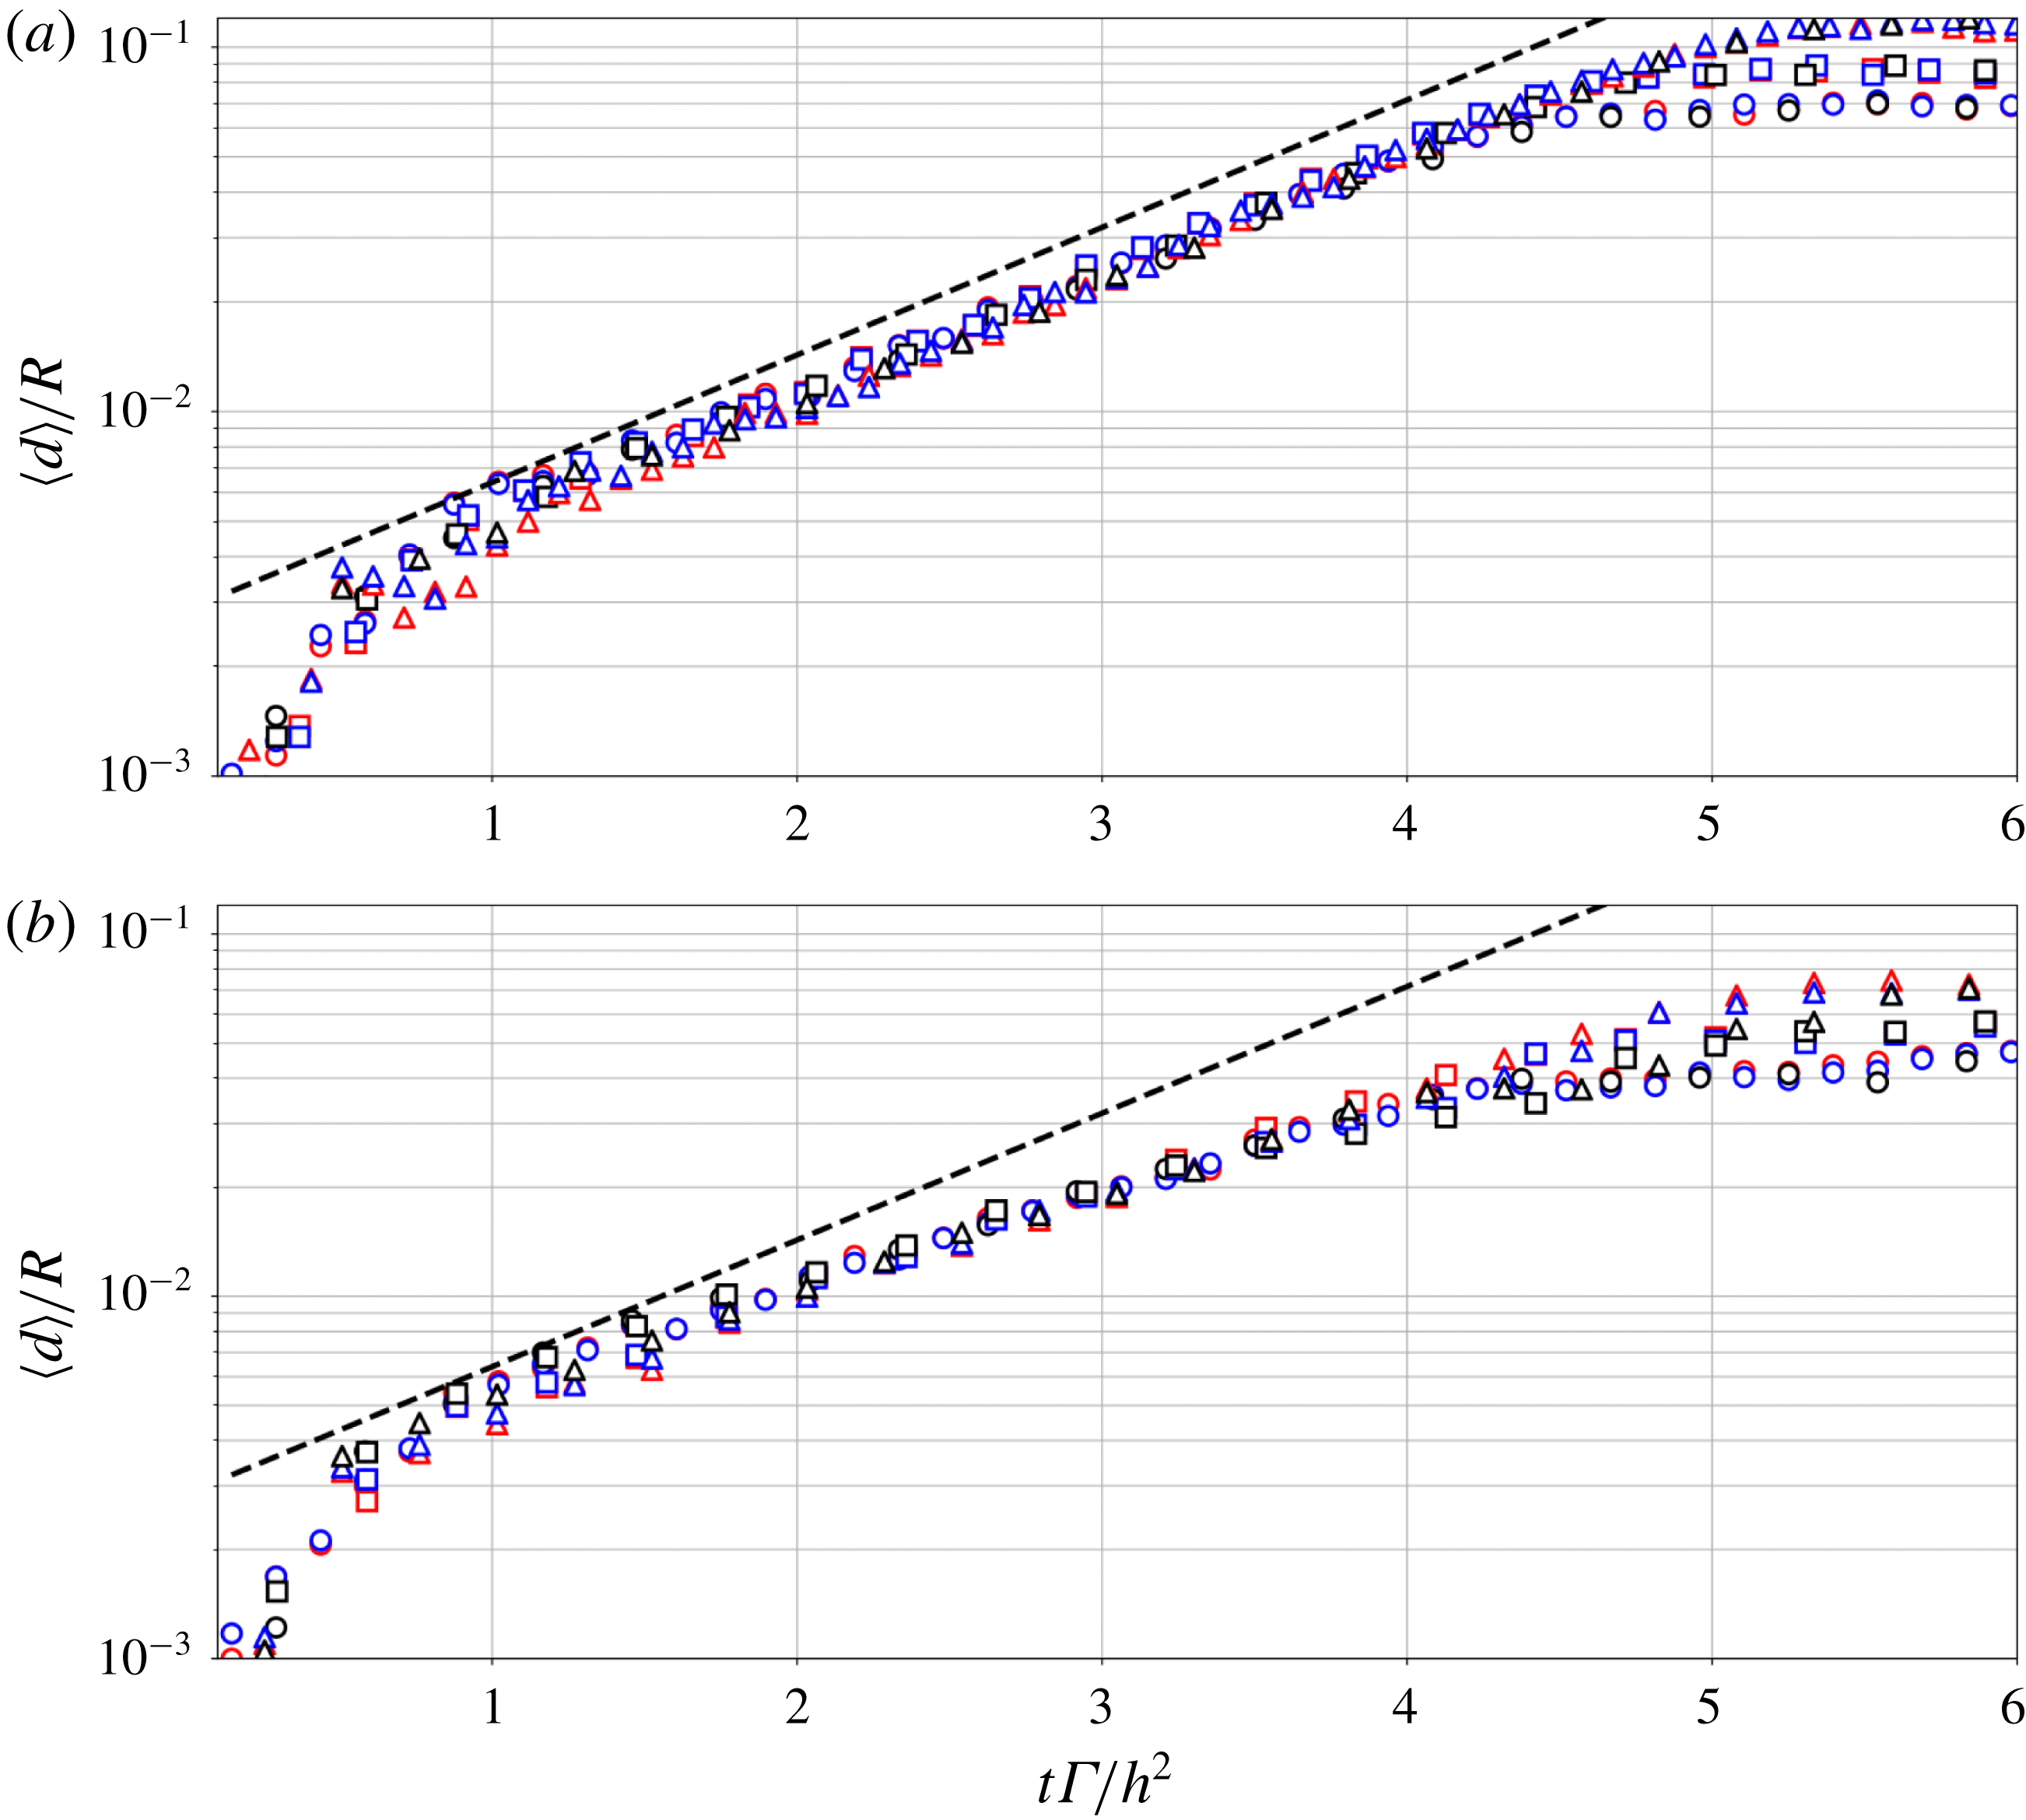
Figure 7. Vortex-core displacement rates as a function of non-dimensional time
![]() $t^{\star }$
, for vortex-core radii
$t^{\star }$
, for vortex-core radii
![]() $r_{c}/h=0.166$
(a),
$r_{c}/h=0.166$
(a),
![]() $r_{c}/h=0.333$
(b). Dashed line: exponential growth rate
$r_{c}/h=0.333$
(b). Dashed line: exponential growth rate
![]() $\unicode[STIX]{x1D6FC}^{\star }=20.2$
.
$\unicode[STIX]{x1D6FC}^{\star }=20.2$
.
In this section, the flow dynamics during the initial inviscid regime is studied. In particular, we are interested in quantifying the growth rates of vortex-core displacements with respect to their rigid translation due to self-induced axial advection. The displacements are caused by mutual inductance due to the proximity of vortex filaments.
The growth rates are studied for a range of flow parameters including helical pitch, Reynolds number and vortex-core radius. The vortex-core displacement growth rates are expressed as a function of the non-dimensional time
![]() $t^{\star }=t\unicode[STIX]{x1D6E4}/h^{2}$
. This non-dimensional time is obtained using the helical pitch as the reference length and the reference velocity
$t^{\star }=t\unicode[STIX]{x1D6E4}/h^{2}$
. This non-dimensional time is obtained using the helical pitch as the reference length and the reference velocity
![]() $h/\unicode[STIX]{x1D6E4}$
, which corresponds to the self-motion of the helical vortex induced by the proximity of vortex filaments. Figure 7 shows the evolution of vortex-core displacement as a function of the time
$h/\unicode[STIX]{x1D6E4}$
, which corresponds to the self-motion of the helical vortex induced by the proximity of vortex filaments. Figure 7 shows the evolution of vortex-core displacement as a function of the time
![]() $t^{\star }$
. The growth rates collapse well and the transitional regime following an exponential temporal evolution of the vortex-core displacement ends near
$t^{\star }$
. The growth rates collapse well and the transitional regime following an exponential temporal evolution of the vortex-core displacement ends near
![]() $t^{\star }=4$
. This result confirms that the helical pitch and therefore the mutual inductance between successive turn of the helices govern the growth rate of vortex-core displacements. This collapse of the vortex-core evolution confirms that the growth rate made non-dimensional using the helical pitch and circulation is a constant value when the mutual inductance mode is predominant. Here, we choose the same definition of non-dimensional growth rate as Nemes et al. (Reference Nemes, Lo Jacono, Blackburn and Sheridan2015):
$t^{\star }=4$
. This result confirms that the helical pitch and therefore the mutual inductance between successive turn of the helices govern the growth rate of vortex-core displacements. This collapse of the vortex-core evolution confirms that the growth rate made non-dimensional using the helical pitch and circulation is a constant value when the mutual inductance mode is predominant. Here, we choose the same definition of non-dimensional growth rate as Nemes et al. (Reference Nemes, Lo Jacono, Blackburn and Sheridan2015):
In their experiment, they found a value of
![]() $\unicode[STIX]{x1D6FC}^{\star }$
close to 20 for various helical pitches (with experimental uncertainty between 5 and 12 %). In the present calculations, the growth rate obtained by fitting the data between
$\unicode[STIX]{x1D6FC}^{\star }$
close to 20 for various helical pitches (with experimental uncertainty between 5 and 12 %). In the present calculations, the growth rate obtained by fitting the data between
![]() $t^{\star }=2$
and
$t^{\star }=2$
and
![]() $t^{\star }=4$
is
$t^{\star }=4$
is
![]() $\unicode[STIX]{x1D6FC}^{\star }=20.2$
, which is close to the value of 20 found by Nemes et al. (Reference Nemes, Lo Jacono, Blackburn and Sheridan2015). Gupta & Loewy (Reference Gupta and Loewy1974) also reported linear stability calculations of the growth rates for two helical pitches
$\unicode[STIX]{x1D6FC}^{\star }=20.2$
, which is close to the value of 20 found by Nemes et al. (Reference Nemes, Lo Jacono, Blackburn and Sheridan2015). Gupta & Loewy (Reference Gupta and Loewy1974) also reported linear stability calculations of the growth rates for two helical pitches
![]() $2h/R=0.63$
and
$2h/R=0.63$
and
![]() $2h/R=0.95$
(in the context of a system of two helical vortices) and reported a maximum value of the growth rate of
$2h/R=0.95$
(in the context of a system of two helical vortices) and reported a maximum value of the growth rate of
![]() $\unicode[STIX]{x1D6FC}^{\star }=20$
for both, with respect to various types of perturbations. We can also compare the growth rate to those obtained for a single helical filament, for which
$\unicode[STIX]{x1D6FC}^{\star }=20$
for both, with respect to various types of perturbations. We can also compare the growth rate to those obtained for a single helical filament, for which
![]() $h$
is defined by the distance separating two successive turns of the single helix. The linear stability computations of Widnall (Reference Widnall1972) report maximal growth rates
$h$
is defined by the distance separating two successive turns of the single helix. The linear stability computations of Widnall (Reference Widnall1972) report maximal growth rates
![]() $\unicode[STIX]{x1D6FC}^{\star }\approx 20;21;23;20$
for helical pitches
$\unicode[STIX]{x1D6FC}^{\star }\approx 20;21;23;20$
for helical pitches
![]() $h/R=0.63;1.26;1.9;6.3$
respectively. An experimental study of the stability of a single vortex filament by Quaranta et al. (Reference Quaranta, Bolnot and Leweke2015) reports a maximal growth rate of
$h/R=0.63;1.26;1.9;6.3$
respectively. An experimental study of the stability of a single vortex filament by Quaranta et al. (Reference Quaranta, Bolnot and Leweke2015) reports a maximal growth rate of
![]() $\unicode[STIX]{x1D6FC}^{\star }\approx 20$
for the helical pitch
$\unicode[STIX]{x1D6FC}^{\star }\approx 20$
for the helical pitch
![]() $h/R=0.5$
. These results emphasize that the growth rate
$h/R=0.5$
. These results emphasize that the growth rate
![]() $\unicode[STIX]{x1D6FC}$
made non-dimensional using the helical pitch (or in the case of a double filament, the shortest distance between two successive helices), shows similar values for a range of theoretical and experimental studies. The present results confirm this observation.
$\unicode[STIX]{x1D6FC}$
made non-dimensional using the helical pitch (or in the case of a double filament, the shortest distance between two successive helices), shows similar values for a range of theoretical and experimental studies. The present results confirm this observation.
Figure 7 also reveals that variations in the Reynolds number do not impact the transient regime. It is also seen, after
![]() $t^{\star }=4$
, that the Reynolds number as well as the helical pitch have an influence on the growth rates. Namely, low Reynolds numbers and low helical pitches impair the growth rates of vortex-core displacement, while high Reynolds and high helical pitches yield a prolongation of the exponential growth past
$t^{\star }=4$
, that the Reynolds number as well as the helical pitch have an influence on the growth rates. Namely, low Reynolds numbers and low helical pitches impair the growth rates of vortex-core displacement, while high Reynolds and high helical pitches yield a prolongation of the exponential growth past
![]() $t^{\star }=4$
. These effects can be attributed to viscous interactions that can occur earlier when lower Reynolds numbers are considered, interrupting prematurely the inviscid evolution of the vortices. An increase in the vortex-core size is also found to reduce the growth of the vortex-core displacement amplitude in time, while still showing an exponential evolution. This result is in line with the observation of Gupta & Loewy (Reference Gupta and Loewy1974) who determined analytically that an increase in the vortex-core radius led to a reduction of the growth rates for two helical vortices. Widnall (Reference Widnall1972) determined the same behaviour in the context of the stability of a single helical vortex filament.
$t^{\star }=4$
. These effects can be attributed to viscous interactions that can occur earlier when lower Reynolds numbers are considered, interrupting prematurely the inviscid evolution of the vortices. An increase in the vortex-core size is also found to reduce the growth of the vortex-core displacement amplitude in time, while still showing an exponential evolution. This result is in line with the observation of Gupta & Loewy (Reference Gupta and Loewy1974) who determined analytically that an increase in the vortex-core radius led to a reduction of the growth rates for two helical vortices. Widnall (Reference Widnall1972) determined the same behaviour in the context of the stability of a single helical vortex filament.
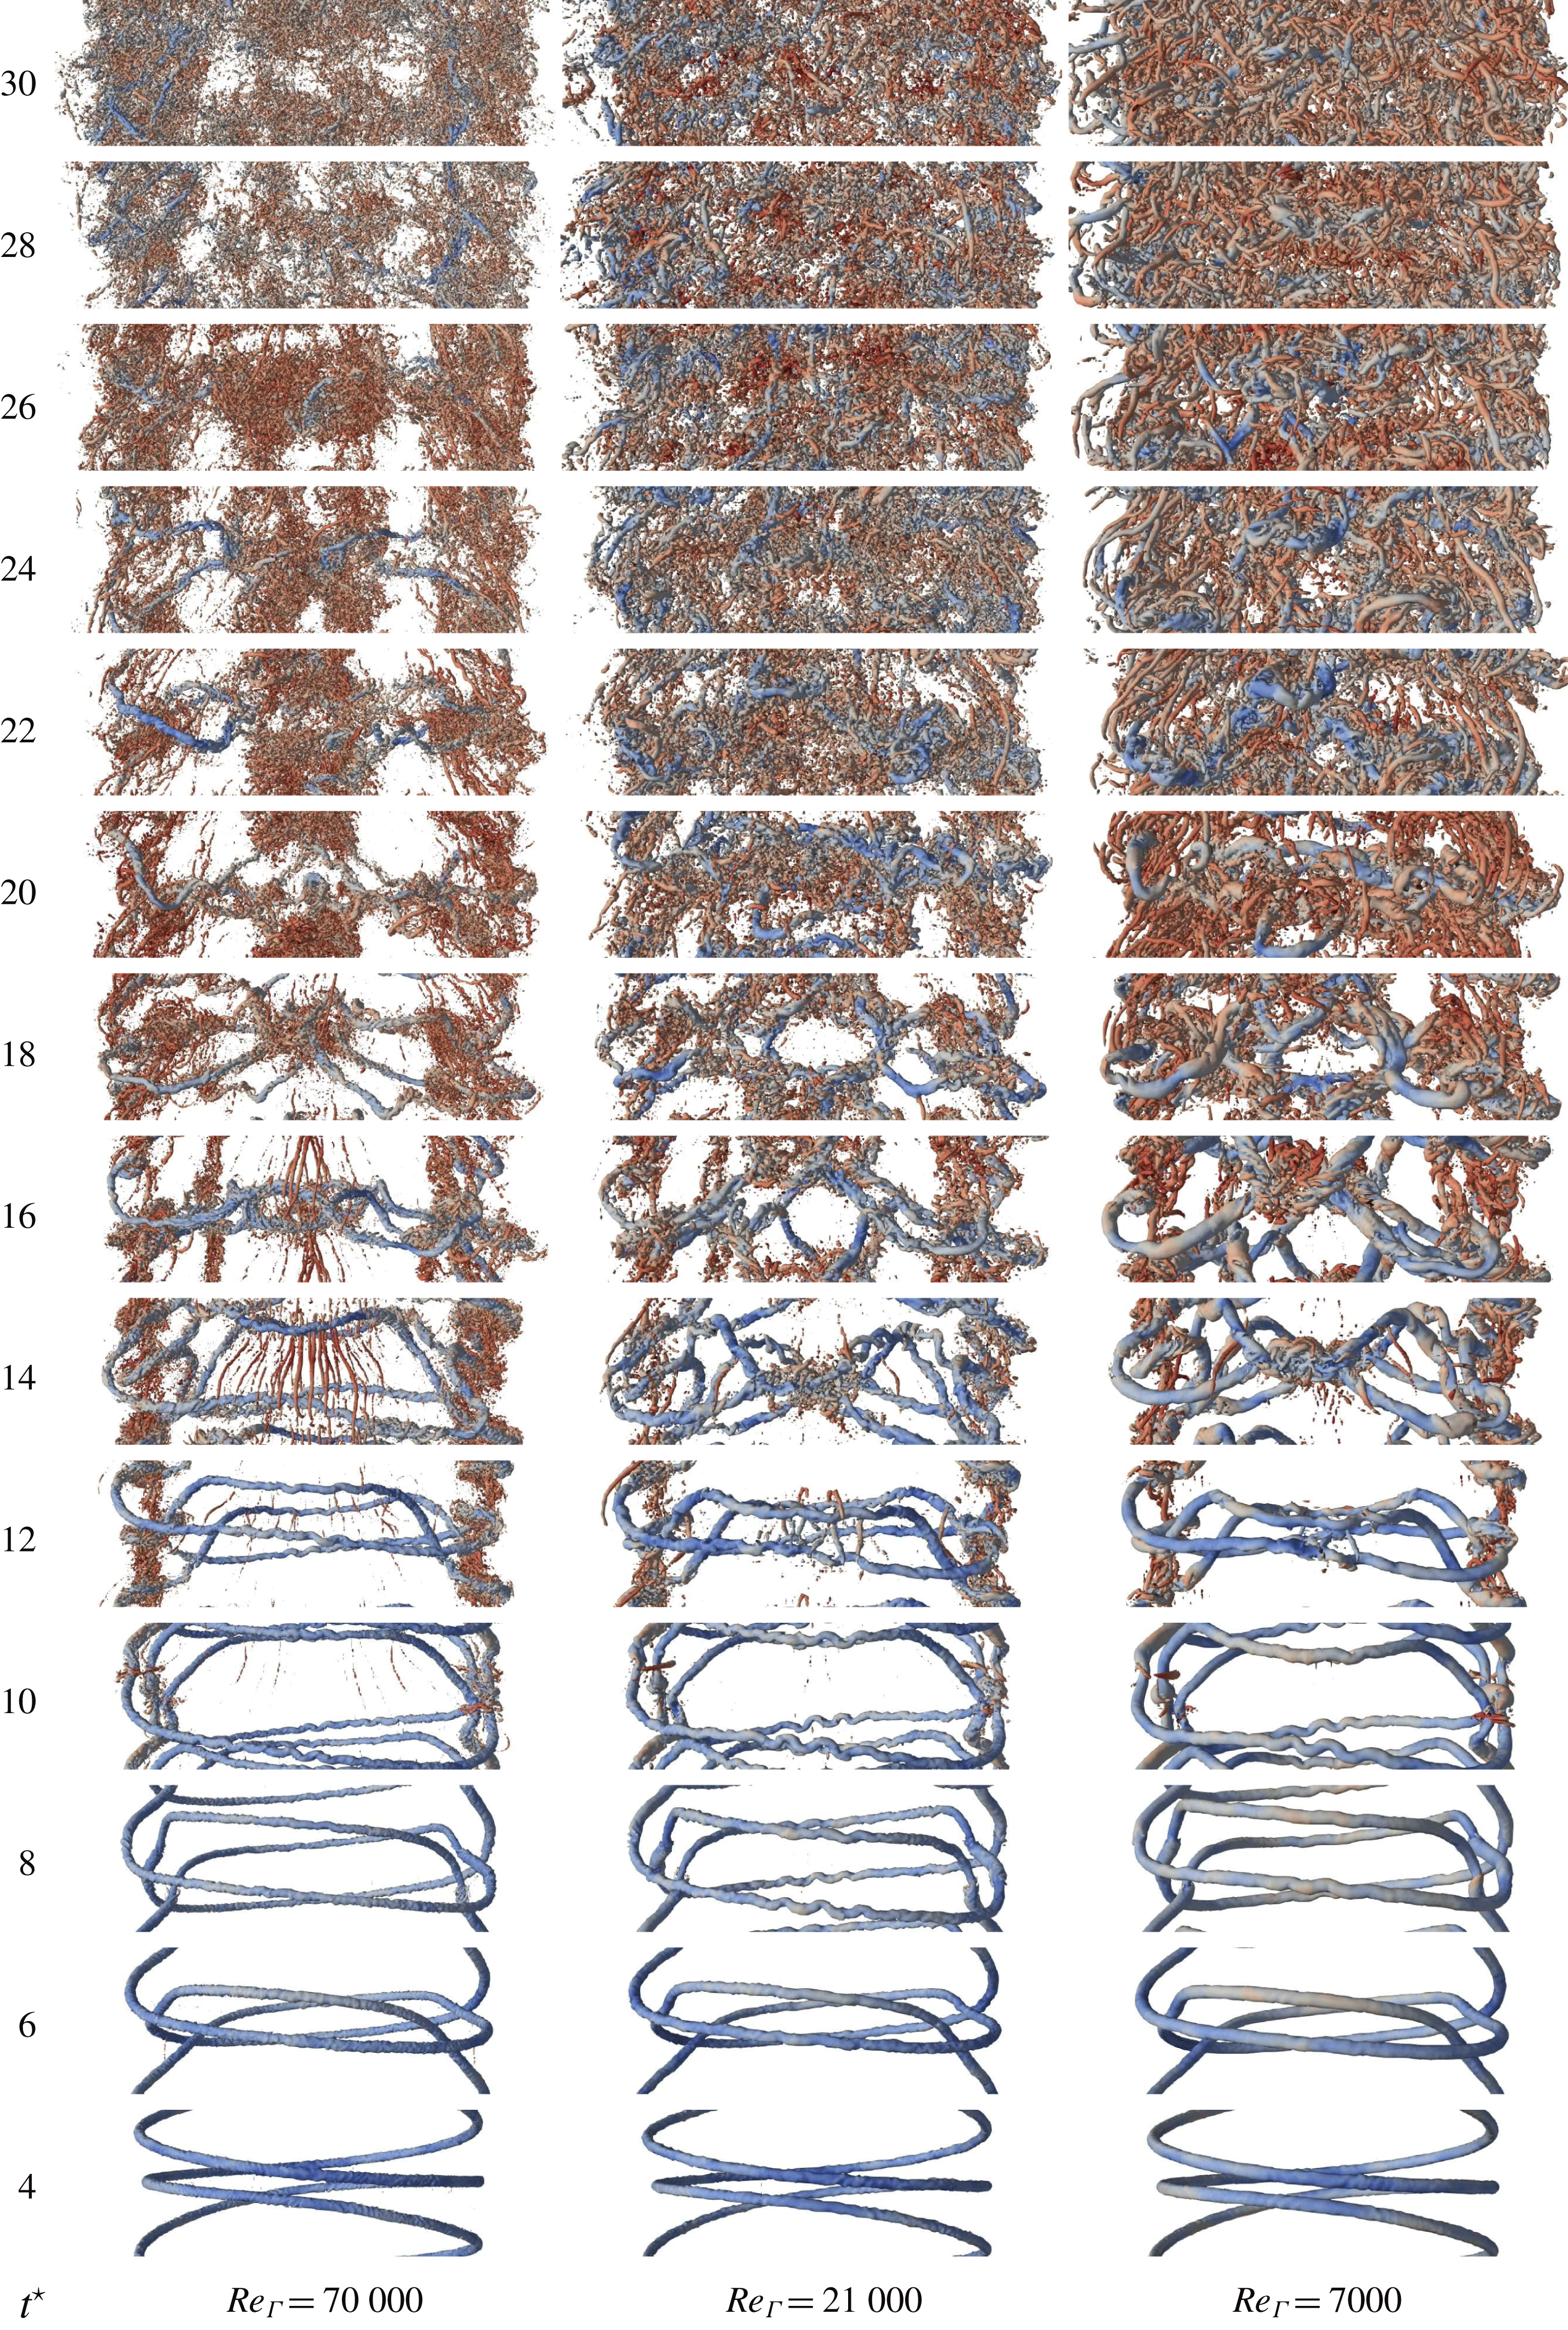
Figure 8.
![]() $Q$
-criterion iso-surfaces coloured by pressure plotted at the beginning of transient regime starting from
$Q$
-criterion iso-surfaces coloured by pressure plotted at the beginning of transient regime starting from
![]() $t^{\star }=4$
, for the helical pitch
$t^{\star }=4$
, for the helical pitch
![]() $h/R=0.36$
. The lowest core radius
$h/R=0.36$
. The lowest core radius
![]() $r_{c}/h=0.166$
case is considered.
$r_{c}/h=0.166$
case is considered.
5.4 Transient break-up and study of flow topology
5.4.1 Dynamics for low helical pitch
The flow evolution is studied by inspecting the history of
![]() $Q$
-criterion iso-surfaces at various times for all Reynolds numbers considered, comparing low and high helical pitches. Figure 8 presents these vorticity plots for the lowest helical pitch and smallest core radius. Between
$Q$
-criterion iso-surfaces at various times for all Reynolds numbers considered, comparing low and high helical pitches. Figure 8 presents these vorticity plots for the lowest helical pitch and smallest core radius. Between
![]() $t^{\star }=0$
and 4, the two helical vortices interact, yielding an acceleration and radius reduction of one helix, and deceleration and radius increase for the other helix. This phenomenon leads to a leap frogging of the two helices, as seen from the plot at
$t^{\star }=0$
and 4, the two helical vortices interact, yielding an acceleration and radius reduction of one helix, and deceleration and radius increase for the other helix. This phenomenon leads to a leap frogging of the two helices, as seen from the plot at
![]() $t^{\star }=6$
. The proximity of parallel vortices travelling at different velocities due to the leap frogging triggers sinusoidal oscillations of the vortex filaments as seen at
$t^{\star }=6$
. The proximity of parallel vortices travelling at different velocities due to the leap frogging triggers sinusoidal oscillations of the vortex filaments as seen at
![]() $t^{\star }=8$
and
$t^{\star }=8$
and
![]() $t^{\star }=10$
. These short-wave oscillations have been experimentally observed by Felli et al. (Reference Felli, Camussi and Di Felice2011) in the context of the flow past marine propellers. The nature of these oscillations depends greatly on the Reynolds number. The highest Reynolds case displays small amplitude/small wavelengths oscillations, whereas at lower Reynolds numbers, the amplitude of the oscillations and their wavelengths increase. This enhanced amplitude of oscillations for the lower Reynolds cases facilitates the reconnection between vortex filaments. The two helices merge where the oscillation amplitude is the highest, forming an X-shaped structure seen at
$t^{\star }=10$
. These short-wave oscillations have been experimentally observed by Felli et al. (Reference Felli, Camussi and Di Felice2011) in the context of the flow past marine propellers. The nature of these oscillations depends greatly on the Reynolds number. The highest Reynolds case displays small amplitude/small wavelengths oscillations, whereas at lower Reynolds numbers, the amplitude of the oscillations and their wavelengths increase. This enhanced amplitude of oscillations for the lower Reynolds cases facilitates the reconnection between vortex filaments. The two helices merge where the oscillation amplitude is the highest, forming an X-shaped structure seen at
![]() $t^{\star }=14$
for the
$t^{\star }=14$
for the
![]() $Re_{\unicode[STIX]{x1D6E4}}=7000$
case and for the
$Re_{\unicode[STIX]{x1D6E4}}=7000$
case and for the
![]() $Re_{\unicode[STIX]{x1D6E4}}=21\,000$
case. For the
$Re_{\unicode[STIX]{x1D6E4}}=21\,000$
case. For the
![]() $Re_{\unicode[STIX]{x1D6E4}}=70\,000$
case, the merging of these vortices occurs at
$Re_{\unicode[STIX]{x1D6E4}}=70\,000$
case, the merging of these vortices occurs at
![]() $t^{\star }=18$
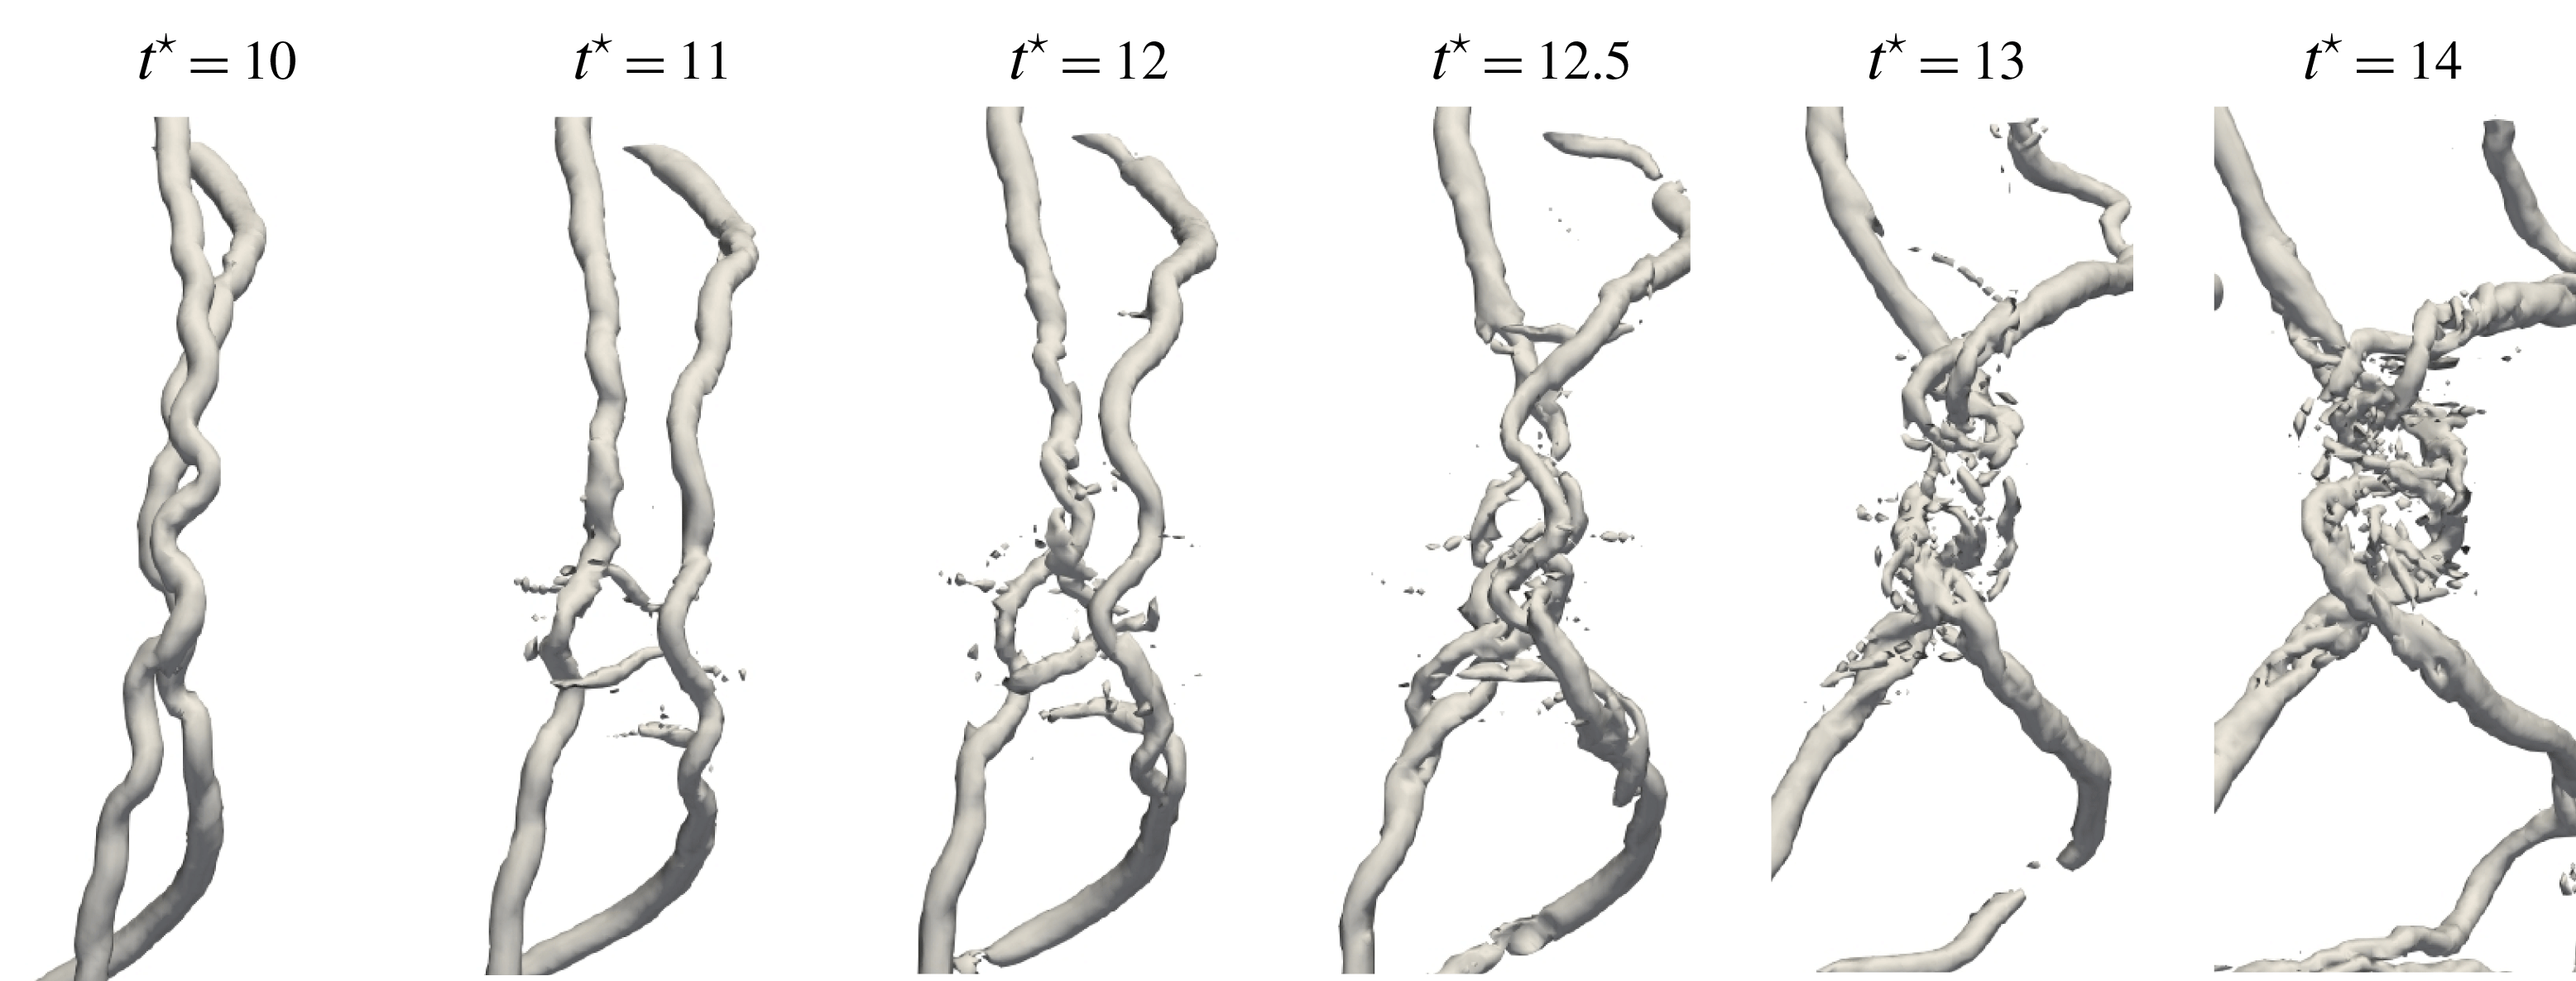
, as seen from figure 8. This merging of vortex filaments is the source of the generation of small scales in the flow as well as the decomposition of the main helical structures. This phenomenon is further studied by focusing on one merging event (figure 11). The event involves two parallel vortex filaments advected in the axial direction, one faster than the other. The two display sinusoidal displacements of their core location. The two vortices start pairing at the location of maximal displacement amplitude. This pairing is initiated by the appearance of vortex hooks that are perpendicular to the initial vortices. These secondary vortices interact with the main ones, and their reduced circulation/strength make them wind around both main vortices, a process similar to the one described by Zabusky & Melander (Reference Zabusky and Melander1989) in the interaction of strong and weak orthogonal vortices. This creates an entanglement of the two initial vortices at the location of maximal oscillation amplitude. Structures of different scales are observed at this location. The initial low-speed vortex keeps its vertical shape, while the high-speed one is strongly distorted and is shifted horizontally away from the reconnection zone. This phenomenon shares strong similarities with the Crow instability (Crow Reference Crow1970), which occurs when parallel counter-rotating vortices are subject to large oscillations. The presently observed phenomenon is also consistent with the computations performed by Laporte & Corjon (Reference Laporte and Corjon2000), who have super-imposed short-wave oscillations on two infinite, parallel vortex lines in the study of the elliptical Crow instability. The result is an entanglement of vortices at the locations where the distance between vortices is minimal.
$t^{\star }=18$
, as seen from figure 8. This merging of vortex filaments is the source of the generation of small scales in the flow as well as the decomposition of the main helical structures. This phenomenon is further studied by focusing on one merging event (figure 11). The event involves two parallel vortex filaments advected in the axial direction, one faster than the other. The two display sinusoidal displacements of their core location. The two vortices start pairing at the location of maximal displacement amplitude. This pairing is initiated by the appearance of vortex hooks that are perpendicular to the initial vortices. These secondary vortices interact with the main ones, and their reduced circulation/strength make them wind around both main vortices, a process similar to the one described by Zabusky & Melander (Reference Zabusky and Melander1989) in the interaction of strong and weak orthogonal vortices. This creates an entanglement of the two initial vortices at the location of maximal oscillation amplitude. Structures of different scales are observed at this location. The initial low-speed vortex keeps its vertical shape, while the high-speed one is strongly distorted and is shifted horizontally away from the reconnection zone. This phenomenon shares strong similarities with the Crow instability (Crow Reference Crow1970), which occurs when parallel counter-rotating vortices are subject to large oscillations. The presently observed phenomenon is also consistent with the computations performed by Laporte & Corjon (Reference Laporte and Corjon2000), who have super-imposed short-wave oscillations on two infinite, parallel vortex lines in the study of the elliptical Crow instability. The result is an entanglement of vortices at the locations where the distance between vortices is minimal.
A similar reconnection process occurs also for the perpendicular vortex filaments that can be observed at the top and bottom extremities of the helices at
![]() $t^{\star }=8$
and 10. This reconnection event also generates small-scale structures, visible for the higher Reynolds number cases. However, the time of reconnection of these perpendicular vortex filaments is independent of the Reynolds number. Small-scale generation related to this particular event can be observed for all three Reynolds cases at
$t^{\star }=8$
and 10. This reconnection event also generates small-scale structures, visible for the higher Reynolds number cases. However, the time of reconnection of these perpendicular vortex filaments is independent of the Reynolds number. Small-scale generation related to this particular event can be observed for all three Reynolds cases at
![]() $t^{\star }=10$
.
$t^{\star }=10$
.
These two events yield a significant alteration of the initial system of helical vortices. The transition towards fully developed turbulence is accelerated for lower Reynolds number cases as the first reconnection event promotes the onset of small scales and yields a decomposition of the coherent vortices. At
![]() $t^{\star }=26$
, for the
$t^{\star }=26$
, for the
![]() $Re_{\unicode[STIX]{x1D6E4}}=7000$
and
$Re_{\unicode[STIX]{x1D6E4}}=7000$
and
![]() $Re_{\unicode[STIX]{x1D6E4}}=21\,000$
cases, the initial shape of helical vortices is essentially lost, whereas it is still present for the
$Re_{\unicode[STIX]{x1D6E4}}=21\,000$
cases, the initial shape of helical vortices is essentially lost, whereas it is still present for the
![]() $Re_{\unicode[STIX]{x1D6E4}}=70\,000$
case.
$Re_{\unicode[STIX]{x1D6E4}}=70\,000$
case.
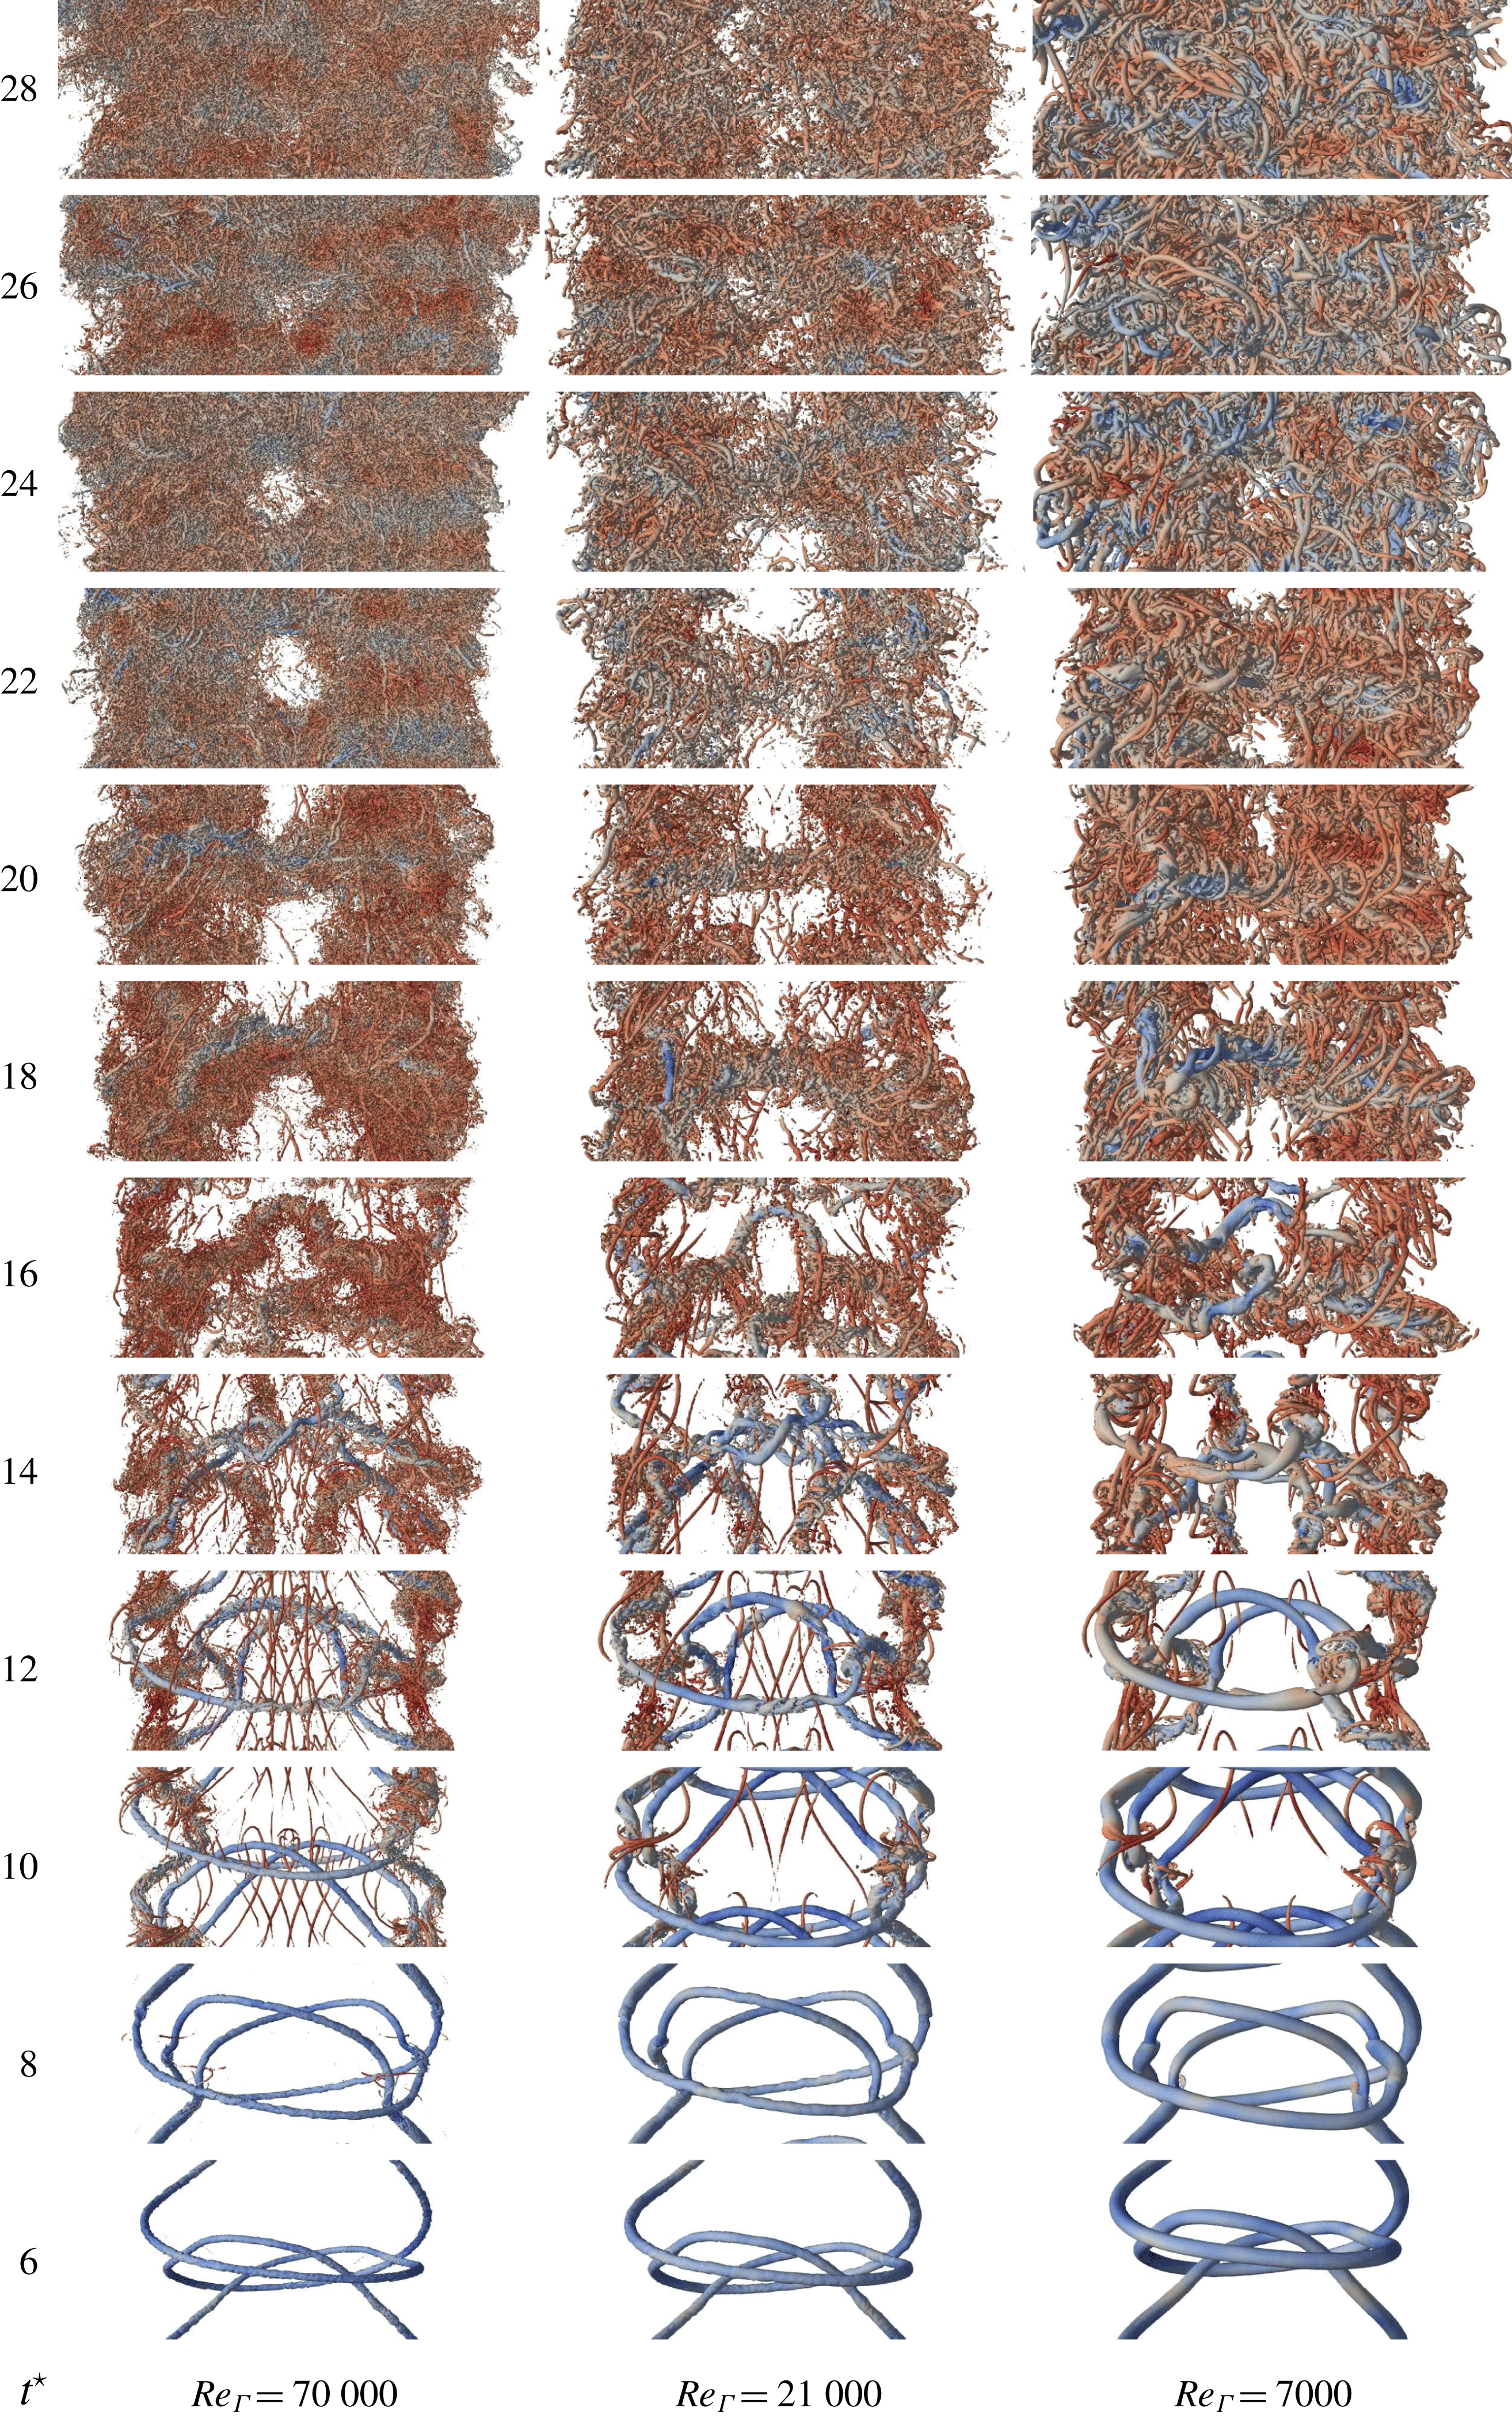
Figure 9.
![]() $Q$
-criterion iso-surfaces coloured by pressure plotted at the beginning of transient regime starting from
$Q$
-criterion iso-surfaces coloured by pressure plotted at the beginning of transient regime starting from
![]() $t^{\star }=4$
, for the helical pitch
$t^{\star }=4$
, for the helical pitch
![]() $h/R=0.61$
. The lowest core radius
$h/R=0.61$
. The lowest core radius
![]() $r_{c}/h=0.166$
case is considered.
$r_{c}/h=0.166$
case is considered.
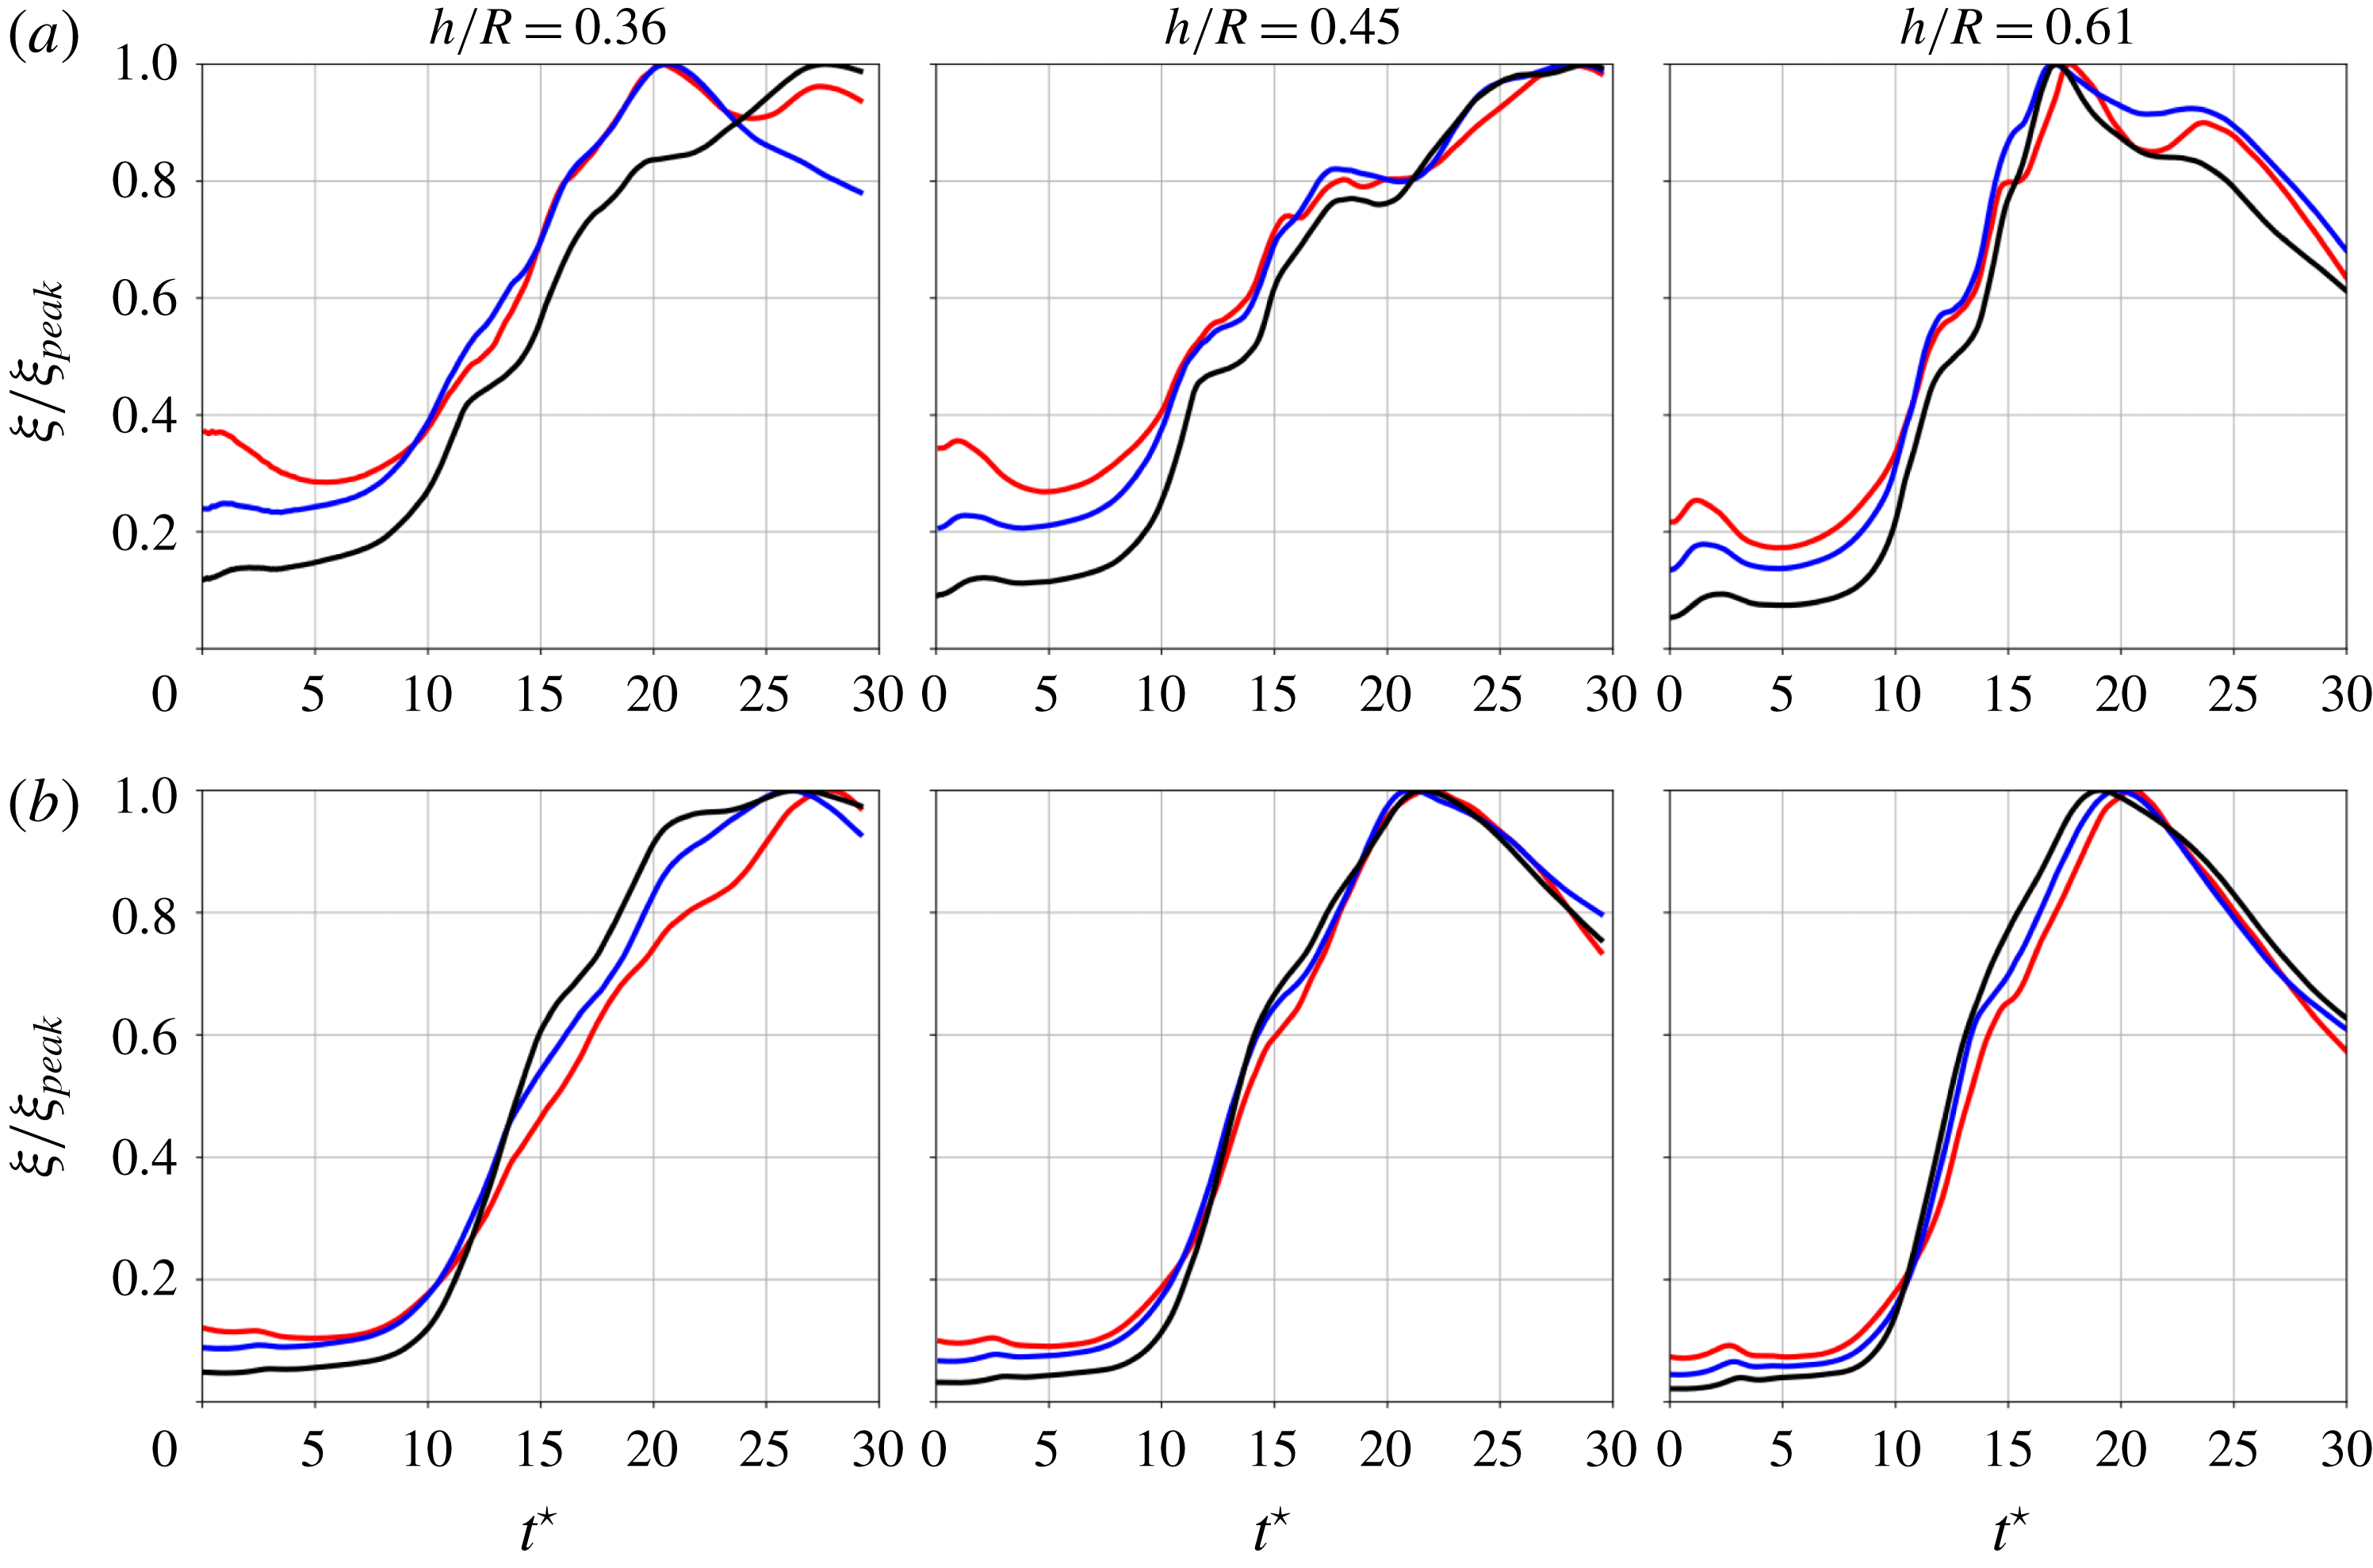
Figure 10. Evolution of enstrophy normalized by its peak value as a function of time
![]() $t^{\star }$
, for vortex-core radius
$t^{\star }$
, for vortex-core radius
![]() $r_{c}/h=0.166$
(a) and
$r_{c}/h=0.166$
(a) and
![]() $r_{c}/h=0.333$
(b).
$r_{c}/h=0.333$
(b).
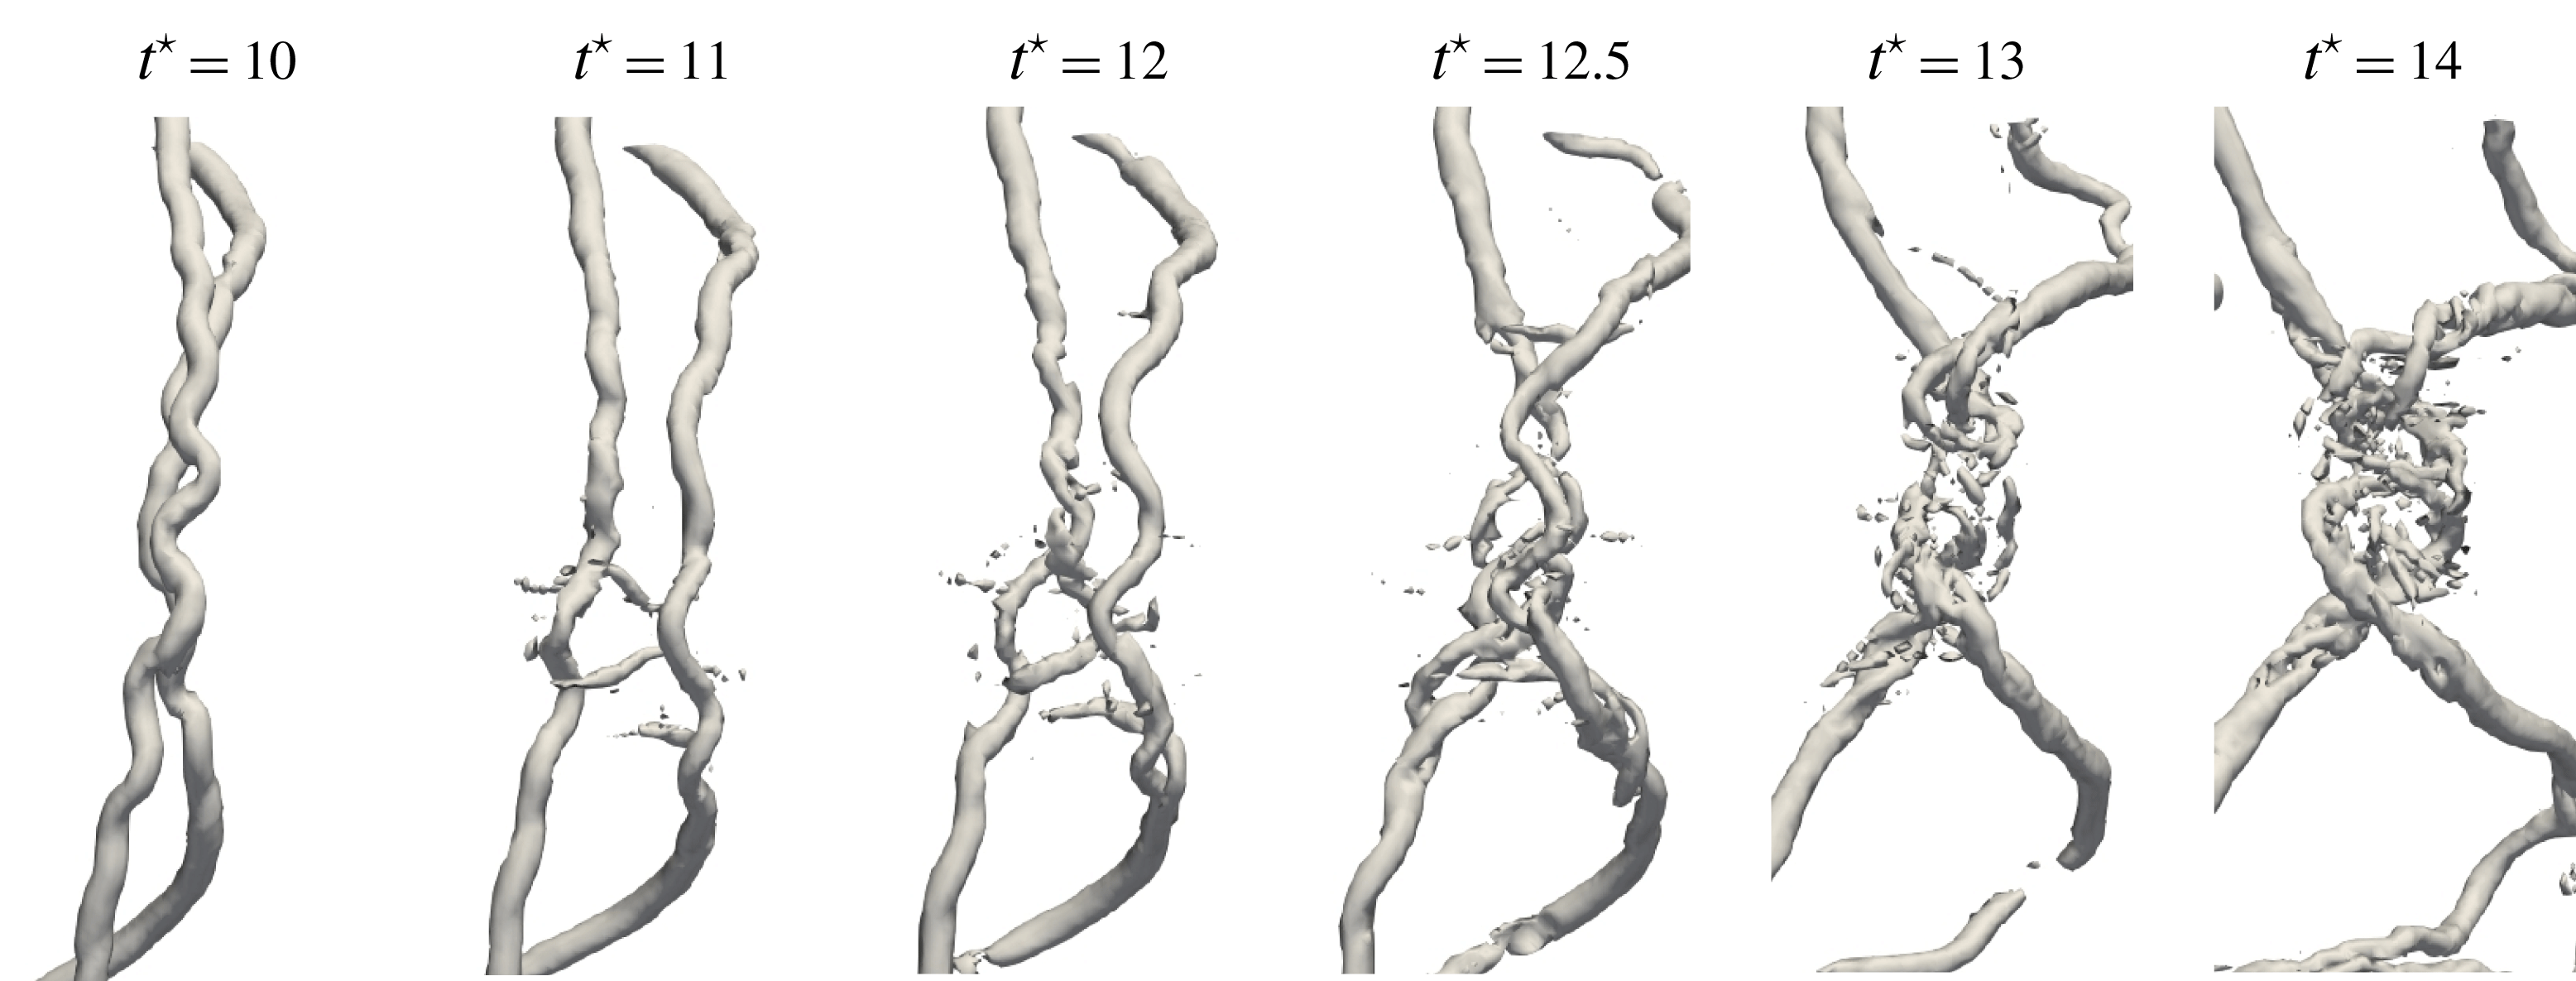
Figure 11. Description of the parallel reconnection event occurring for the low pitch case
![]() $h/R=0.36$
, small core radius
$h/R=0.36$
, small core radius
![]() $r_{c}/h=0.166$
and
$r_{c}/h=0.166$
and
![]() $Re_{\unicode[STIX]{x1D6E4}}=7000$
.
$Re_{\unicode[STIX]{x1D6E4}}=7000$
.
![]() $Q$
-criterion iso-surfaces plotted in the region of interest at different times during the reconnection.
$Q$
-criterion iso-surfaces plotted in the region of interest at different times during the reconnection.
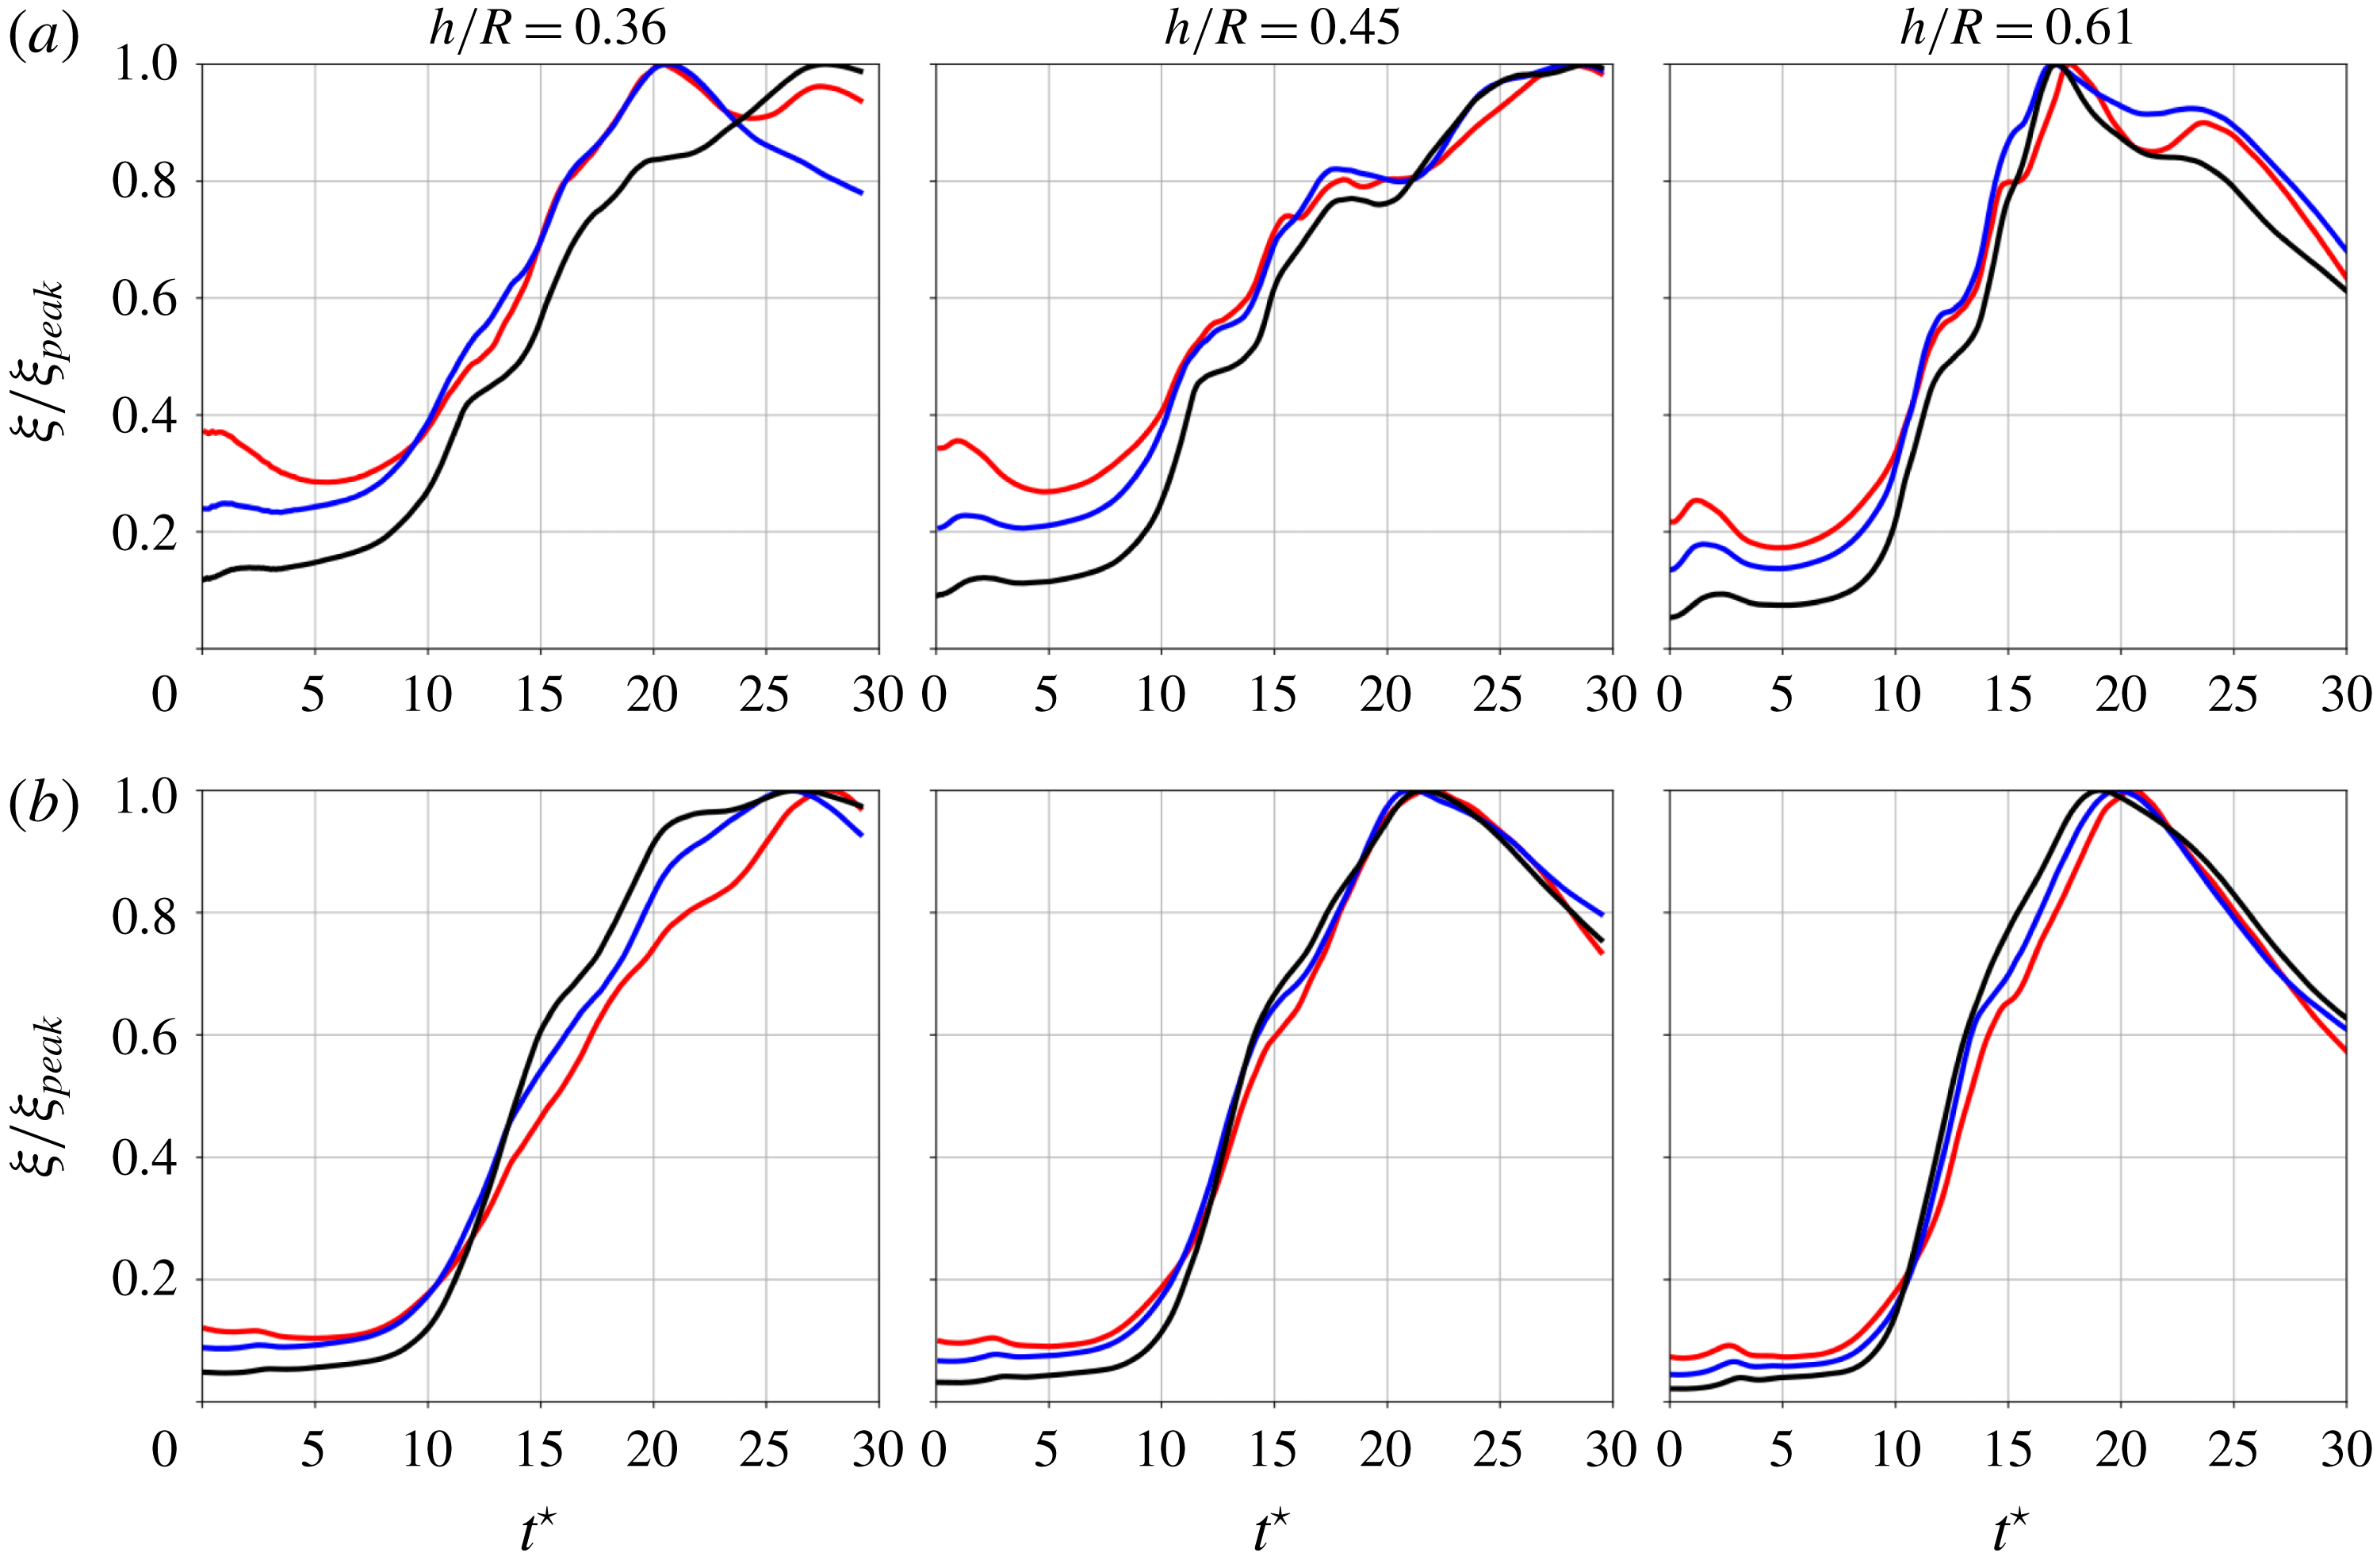
The influence of the reconnection of parallel vortices can also be observed by plotting the temporal evolution of volume-averaged enstrophy for all cases considered, see figure 10. In particular, for the lowest helical pitch case
![]() $h/R=0.36$
, the enstrophy peak’s location is clearly a function of the Reynolds number, as it occurs later for the high-Reynolds-number case
$h/R=0.36$
, the enstrophy peak’s location is clearly a function of the Reynolds number, as it occurs later for the high-Reynolds-number case
![]() $Re_{\unicode[STIX]{x1D6E4}}=70\,000$
. This early occurrence of enstrophy peak is related to the small scales generated by the parallel vortices reconnection. This difference is not visible for the larger core radius
$Re_{\unicode[STIX]{x1D6E4}}=70\,000$
. This early occurrence of enstrophy peak is related to the small scales generated by the parallel vortices reconnection. This difference is not visible for the larger core radius
![]() $r_{c}/h=0.333$
cases, which suggests that the short-wave oscillations responsible for vortex pairing are not present when larger core sizes are considered.
$r_{c}/h=0.333$
cases, which suggests that the short-wave oscillations responsible for vortex pairing are not present when larger core sizes are considered.
5.4.2 Dynamics for high helical pitch
Figure 9 shows the
![]() $Q$
-criterion iso-surfaces at times
$Q$
-criterion iso-surfaces at times
![]() $t^{\star }$
between 4 and 26, here for the highest helical pitch case
$t^{\star }$
between 4 and 26, here for the highest helical pitch case
![]() $h/R=0.61$
considered in the study. As seen from the plots, the flow shares similarities with the lower helical pitch but also shows some differences. First, the leap-frogging phenomenon occurs as well, yielding the reconnection of vortex filaments, but only in the location where the vortex filaments are perpendicular to each other. A close-up of the
$h/R=0.61$
considered in the study. As seen from the plots, the flow shares similarities with the lower helical pitch but also shows some differences. First, the leap-frogging phenomenon occurs as well, yielding the reconnection of vortex filaments, but only in the location where the vortex filaments are perpendicular to each other. A close-up of the
![]() $Q$
-criterion iso-surfaces detailing accurately this vortex reconnection event is displayed in figure 12. The proximity of orthogonal vortex filaments of equivalent strength generates vortex hooks or fingers (as described by Boratav, Pelz & Zabusky (Reference Boratav, Pelz and Zabusky1992) and Jaque & Fuentes (Reference Jaque and Fuentes2017)), which are secondary vortices that wrap around the orthogonal vortices. The two initial vortices become aligned and undergo a typical anti-parallel separation reconnection mechanism as described by Kida & Takaoka (Reference Kida and Takaoka1994). Bridges are formed at the extremity of the region for which the vortices are parallel, corresponding to two new vortex structures. In between these newly formed structures, a number of elongated threads appear which the vortex cores are smaller than the initial parallel vortices. The short-wave oscillations seen for the lower pitch case
$Q$
-criterion iso-surfaces detailing accurately this vortex reconnection event is displayed in figure 12. The proximity of orthogonal vortex filaments of equivalent strength generates vortex hooks or fingers (as described by Boratav, Pelz & Zabusky (Reference Boratav, Pelz and Zabusky1992) and Jaque & Fuentes (Reference Jaque and Fuentes2017)), which are secondary vortices that wrap around the orthogonal vortices. The two initial vortices become aligned and undergo a typical anti-parallel separation reconnection mechanism as described by Kida & Takaoka (Reference Kida and Takaoka1994). Bridges are formed at the extremity of the region for which the vortices are parallel, corresponding to two new vortex structures. In between these newly formed structures, a number of elongated threads appear which the vortex cores are smaller than the initial parallel vortices. The short-wave oscillations seen for the lower pitch case
![]() $h/R=0.36$
are not observed for the high pitch case
$h/R=0.36$
are not observed for the high pitch case
![]() $h/R=0.61$
. This yields the small-scale turbulent structures to be mainly concentrated at the locations where the perpendicular vortex reconnection occurs. What is remarkable is that the Reynolds number does not significantly influence the flow topology at large scales. The main features of the flow remain the same for the three Reynolds numbers considered, except for the small-scale features that develop around the main vortices, but without perturbing extensively their shapes. This similarity of flow patterns is also seen from the enstrophy evolution, see figure 10, for which the peak occurs at the same time (
$h/R=0.61$
. This yields the small-scale turbulent structures to be mainly concentrated at the locations where the perpendicular vortex reconnection occurs. What is remarkable is that the Reynolds number does not significantly influence the flow topology at large scales. The main features of the flow remain the same for the three Reynolds numbers considered, except for the small-scale features that develop around the main vortices, but without perturbing extensively their shapes. This similarity of flow patterns is also seen from the enstrophy evolution, see figure 10, for which the peak occurs at the same time (
![]() $t^{\star }\approx 17$
) for the three Reynolds numbers considered, with the helical pitch
$t^{\star }\approx 17$
) for the three Reynolds numbers considered, with the helical pitch
![]() $h/R=0.61$
. An interesting feature of the flow is the presence of secondary vortices, elongated in the axial direction and wrapped around the helical vortices. The number and size of these secondary vortices is highly dependent of the Reynolds number, as seen from figure 9, especially at times
$h/R=0.61$
. An interesting feature of the flow is the presence of secondary vortices, elongated in the axial direction and wrapped around the helical vortices. The number and size of these secondary vortices is highly dependent of the Reynolds number, as seen from figure 9, especially at times
![]() $t^{\star }=8$
and
$t^{\star }=8$
and
![]() $t^{\star }=10$
.
$t^{\star }=10$
.

Figure 12. Description of the orthogonal reconnection event occurring for the case
![]() $h/R=0.61$
,
$h/R=0.61$
,
![]() $r_{c}/h=0.166$
and
$r_{c}/h=0.166$
and
![]() $Re_{\unicode[STIX]{x1D6E4}}=7000$
.
$Re_{\unicode[STIX]{x1D6E4}}=7000$
.
![]() $Q$
-criterion iso-surfaces plotted in the region of interest at different times during the reconnection.
$Q$
-criterion iso-surfaces plotted in the region of interest at different times during the reconnection.
5.4.3 Energy spectra in the fully developed regime
Energy spectra are evaluated at the end of computations (
![]() $t^{\star }=30$
) for various pitch values and Reynolds numbers, with the value of vortex-core radius set to
$t^{\star }=30$
) for various pitch values and Reynolds numbers, with the value of vortex-core radius set to
![]() $r_{c}/h=0.166$
. Given the strong flow anisotropy, the plane-averaged one-dimensional energy spectra are considered, with the following definitions:
$r_{c}/h=0.166$
. Given the strong flow anisotropy, the plane-averaged one-dimensional energy spectra are considered, with the following definitions:
 $$\begin{eqnarray}\left.\begin{array}{@{}c@{}}E_{u}(k_{x})={\displaystyle \frac{1}{L_{y}L_{z}}}\displaystyle \int _{0}^{L_{z}}\displaystyle \int _{0}^{L_{y}}|\widehat{u}(k_{x},y,z)|^{2}\,\text{d}y\,\text{d}z\\ E_{r}(k_{r})={\displaystyle \frac{1}{2\unicode[STIX]{x03C0}L_{x}}}\displaystyle \int _{0}^{2\unicode[STIX]{x03C0}}\displaystyle \int _{0}^{L_{x}}|\widehat{u}_{r}(k_{r},\unicode[STIX]{x1D703},z)|^{2}\,\text{d}\unicode[STIX]{x1D703}\,\text{d}z.\end{array}\right\}\end{eqnarray}$$
The modes
![]() $\widehat{u}$
and
$\widehat{u}$
and
![]() $\widehat{u}_{r}$
are computed via a discrete Fourier transform (DFT) in the axial
$\widehat{u}_{r}$
are computed via a discrete Fourier transform (DFT) in the axial
![]() $x$
and radial
$x$
and radial
![]() $r$
directions, respectively. The radial direction is not periodic nor statistically homogeneous, however, the velocity component
$r$
directions, respectively. The radial direction is not periodic nor statistically homogeneous, however, the velocity component
![]() $u_{r}$
reaches negligible magnitudes values when approaching the helix axis,
$u_{r}$
reaches negligible magnitudes values when approaching the helix axis,
![]() $r\rightarrow 0$
, or the edges of the computational domain,
$r\rightarrow 0$
, or the edges of the computational domain,
![]() $r\gg R$
;
$r\gg R$
;
![]() $\hat{u} _{r}$
hence effectively benefits from a compact support in
$\hat{u} _{r}$
hence effectively benefits from a compact support in
![]() $r$
, which permits the use of the DFT, or any other variant (e.g. direct cosine transform of an appropriate type accounting for the non-periodic boundaries), yielding the same result.
$r$
, which permits the use of the DFT, or any other variant (e.g. direct cosine transform of an appropriate type accounting for the non-periodic boundaries), yielding the same result.
Figure 13 presents the compensated energy spectra plots, obtained using the total volume-averaged dissipation in the flow defined in appendix A. The
![]() $Re_{\unicode[STIX]{x1D6E4}}=21\,000$
and
$Re_{\unicode[STIX]{x1D6E4}}=21\,000$
and
![]() $Re_{\unicode[STIX]{x1D6E4}}=70\,000$
cases display a constant energy plateau for a range of wavenumbers in both directions, which suggests the presence of an inertial range. The lowest Reynolds
$Re_{\unicode[STIX]{x1D6E4}}=70\,000$
cases display a constant energy plateau for a range of wavenumbers in both directions, which suggests the presence of an inertial range. The lowest Reynolds
![]() $Re_{\unicode[STIX]{x1D6E4}}=7000$
case shows a strong intermediate and high wavenumber energy decay, emphasizing that the flow dynamics is mainly concentrated in the large scales. We can notice a collapse of spectra for the highest helical pitch and Reynolds numbers
$Re_{\unicode[STIX]{x1D6E4}}=7000$
case shows a strong intermediate and high wavenumber energy decay, emphasizing that the flow dynamics is mainly concentrated in the large scales. We can notice a collapse of spectra for the highest helical pitch and Reynolds numbers
![]() $Re_{\unicode[STIX]{x1D6E4}}=21\,000$
and
$Re_{\unicode[STIX]{x1D6E4}}=21\,000$
and
![]() $Re_{\unicode[STIX]{x1D6E4}}=70\,000$
. In this case, an increase in the Reynolds number generates additional smaller scales while retaining mostly the same low wavenumber content. This behaviour is different from the smaller helical pitches
$Re_{\unicode[STIX]{x1D6E4}}=70\,000$
. In this case, an increase in the Reynolds number generates additional smaller scales while retaining mostly the same low wavenumber content. This behaviour is different from the smaller helical pitches
![]() $h/R=0.36$
and
$h/R=0.36$
and
![]() $h/R=0.45$
cases, which display significant differences in terms of energy spectra when considering different Reynolds numbers. This is consistent with the different flow dynamics observed in figure 8, i.e. different short-wave distortion of the helical filaments which modifies the topology of the flow depending on the Reynolds number. In particular, the
$h/R=0.45$
cases, which display significant differences in terms of energy spectra when considering different Reynolds numbers. This is consistent with the different flow dynamics observed in figure 8, i.e. different short-wave distortion of the helical filaments which modifies the topology of the flow depending on the Reynolds number. In particular, the
![]() $Re_{\unicode[STIX]{x1D6E4}}=70\,000$
case presents a higher large-scale energy compared to the
$Re_{\unicode[STIX]{x1D6E4}}=70\,000$
case presents a higher large-scale energy compared to the
![]() $Re_{\unicode[STIX]{x1D6E4}}=21\,000$
in both directions, mainly because the parallel filaments’ reconnection occurs later and preserves the large scales for a longer time.
$Re_{\unicode[STIX]{x1D6E4}}=21\,000$
in both directions, mainly because the parallel filaments’ reconnection occurs later and preserves the large scales for a longer time.
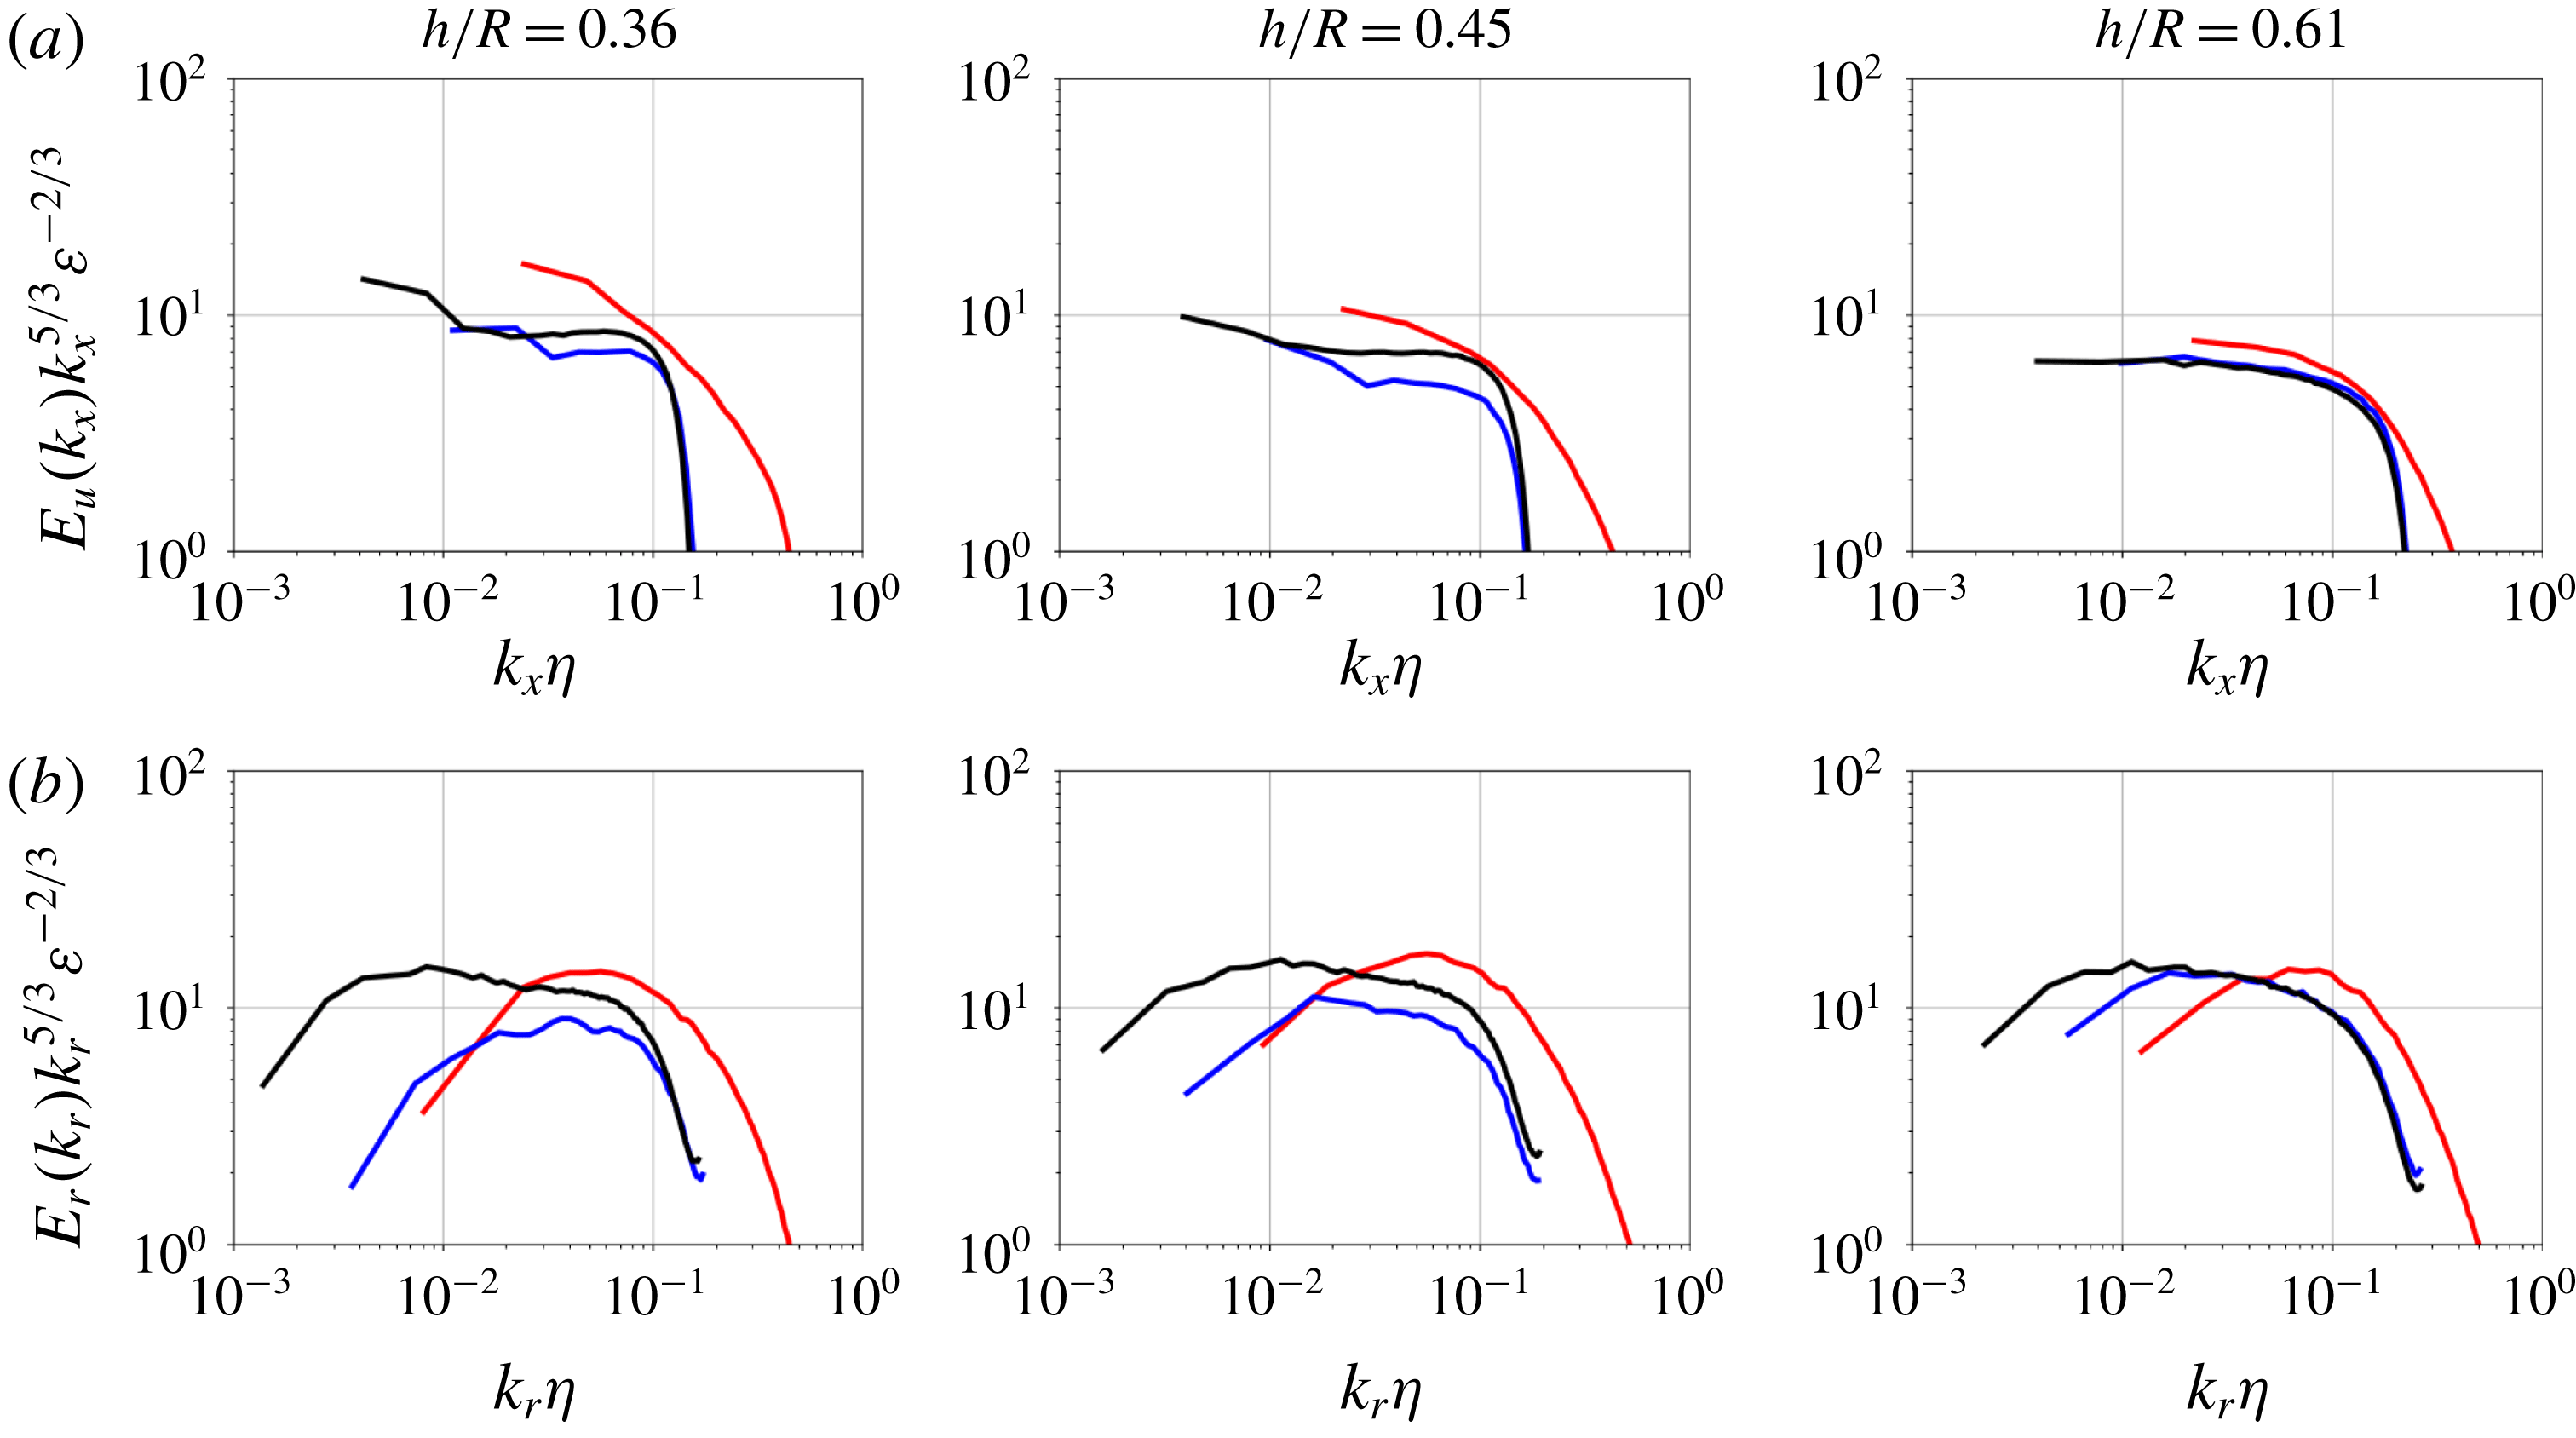
Figure 13. Energy spectra computed at
![]() $t^{\star }=30$
for
$t^{\star }=30$
for
![]() $r_{c}/h=0.166$
. (a) Axial energy spectra; (b) radial energy spectra.
$r_{c}/h=0.166$
. (a) Axial energy spectra; (b) radial energy spectra.
![]() $\unicode[STIX]{x1D702}$
is the Kolmogorov length scale defined in appendix A.
$\unicode[STIX]{x1D702}$
is the Kolmogorov length scale defined in appendix A.
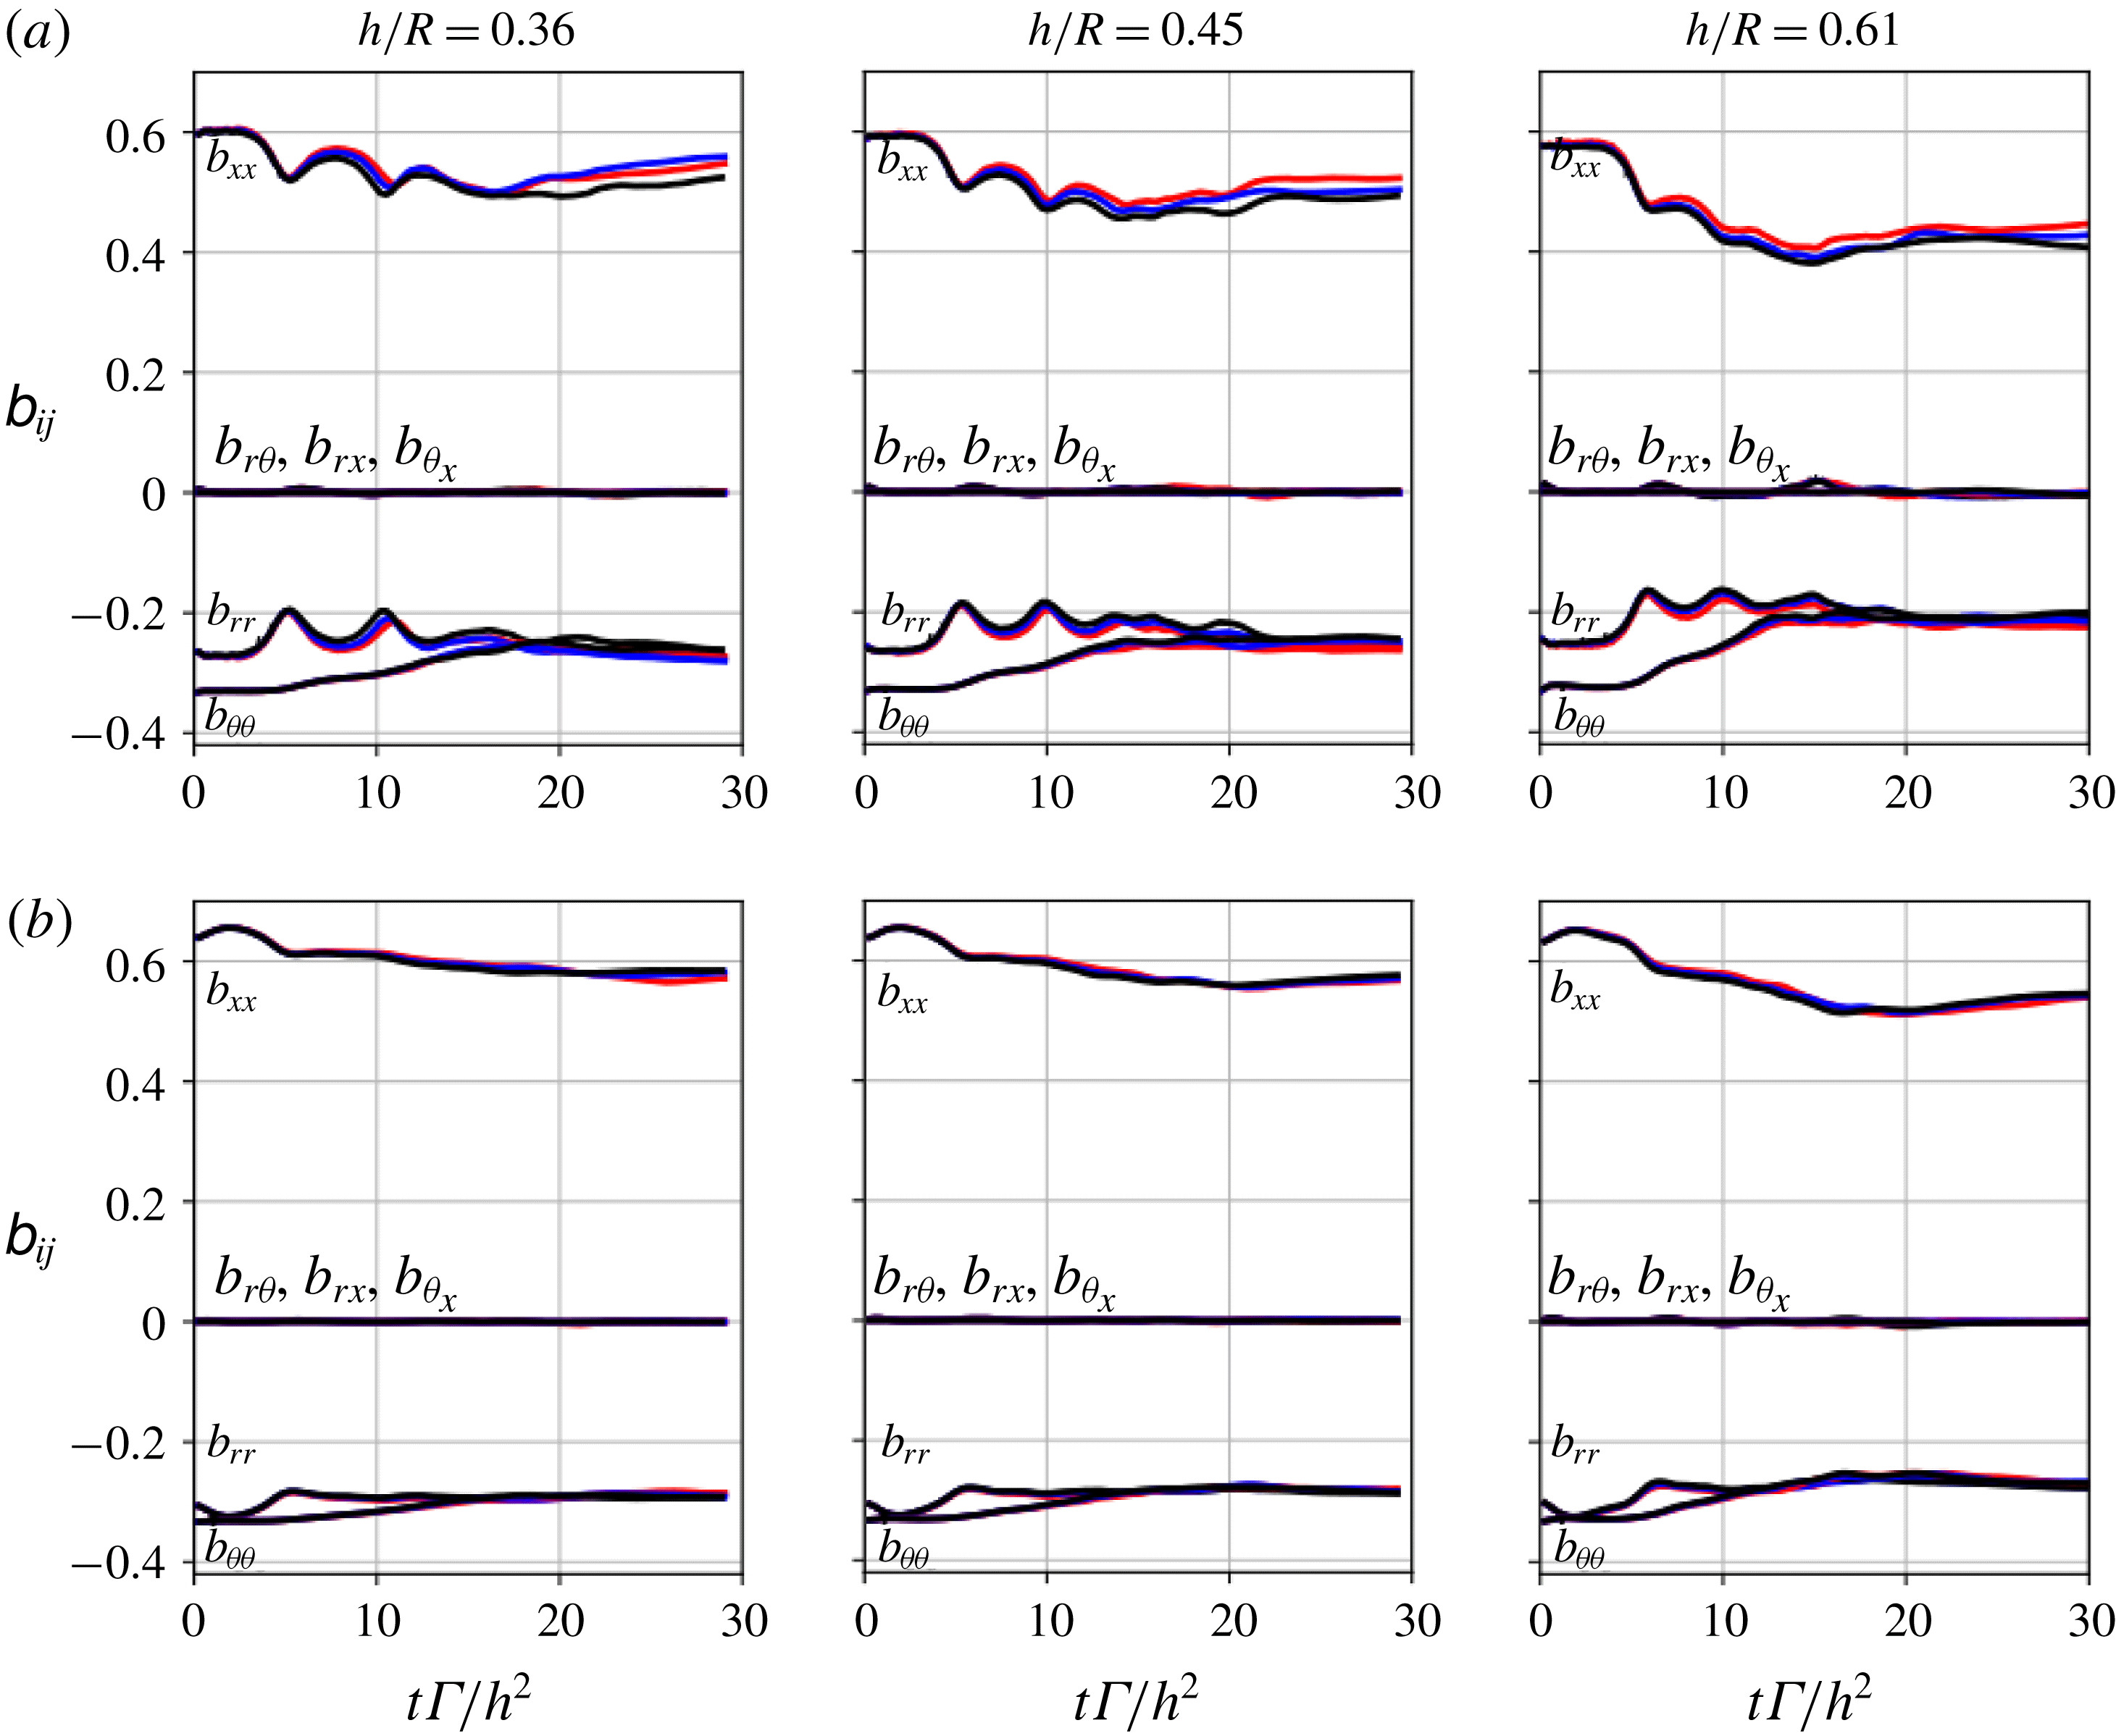
Figure 14. Evolution of the components of the anisotropic stress tensor as a function of time
![]() $t^{\star }$
, for vortex-core radius
$t^{\star }$
, for vortex-core radius
![]() $r_{c}/h=0.166$
(a) and
$r_{c}/h=0.166$
(a) and
![]() $r_{c}/h=0.333$
(b). Volume-averaged quantities.
$r_{c}/h=0.333$
(b). Volume-averaged quantities.
6 Turbulence properties in the fully developed wake
6.1 Anisotropy of velocity fluctuations
In this section, the anisotropy of turbulent stresses is assessed as a function of time, for all cases considered. First, the anisotropy stress tensor is computed as follows:
where
![]() $\langle u_{i}^{\prime }u_{j}^{\prime }\rangle =\langle u_{i}u_{j}\rangle -\langle u_{i}\rangle \langle u_{j}\rangle$
are the velocity fluctuations in the axial (index 1), radial (index 2) and azimuthal (index 3) directions, and
$\langle u_{i}^{\prime }u_{j}^{\prime }\rangle =\langle u_{i}u_{j}\rangle -\langle u_{i}\rangle \langle u_{j}\rangle$
are the velocity fluctuations in the axial (index 1), radial (index 2) and azimuthal (index 3) directions, and
![]() $\langle \cdot \rangle$
is a volume-averaging operator. The adoption of such an averaging operator over the whole computational domain does not imply that the flow is assumed to be homogeneous in all directions; quantities such as (6.1) are intended as flow diagnostics, rather than equivalent ensemble-averaged quantities (the statistical inhomogeneity of the turbulent fluctuations in the radial direction is taken into account in results presented in § 6.3).
$\langle \cdot \rangle$
is a volume-averaging operator. The adoption of such an averaging operator over the whole computational domain does not imply that the flow is assumed to be homogeneous in all directions; quantities such as (6.1) are intended as flow diagnostics, rather than equivalent ensemble-averaged quantities (the statistical inhomogeneity of the turbulent fluctuations in the radial direction is taken into account in results presented in § 6.3).
All components of the tensor
![]() $\unicode[STIX]{x1D623}_{ij}$
are plotted in figure 14 as a function of time, for the span of flow conditions summarized in table 2. First, it is observed that for all conditions considered, all cross-components of
$\unicode[STIX]{x1D623}_{ij}$
are plotted in figure 14 as a function of time, for the span of flow conditions summarized in table 2. First, it is observed that for all conditions considered, all cross-components of
![]() $\unicode[STIX]{x1D623}_{ij}$
are zero, the radial and azimuthal components
$\unicode[STIX]{x1D623}_{ij}$
are zero, the radial and azimuthal components
![]() $b_{rr}$
and
$b_{rr}$
and
![]() $b_{\unicode[STIX]{x1D703}\unicode[STIX]{x1D703}}$
are similar and the turbulence is dominated by the axial component
$b_{\unicode[STIX]{x1D703}\unicode[STIX]{x1D703}}$
are similar and the turbulence is dominated by the axial component
![]() $b_{xx}$
which carries most of the kinetic energy, hence showing a strong and persistent anisotropy. Second, it is seen that the degree of flow anisotropy is sensitive to the Reynolds number, vortex-core radius and helical pitch. Higher vortex-core radii strengthen the anisotropy of turbulence, while increasing the helical pitch or the Reynolds number tend to lower the anisotropy.
$b_{xx}$
which carries most of the kinetic energy, hence showing a strong and persistent anisotropy. Second, it is seen that the degree of flow anisotropy is sensitive to the Reynolds number, vortex-core radius and helical pitch. Higher vortex-core radii strengthen the anisotropy of turbulence, while increasing the helical pitch or the Reynolds number tend to lower the anisotropy.
A qualitative view of the flow anisotropy can be obtained by plotting the position of the invariants of the anisotropic stress tensor in the Lumley triangle. The two non-zero invariants, for an axisymmetric representation of the Reynolds tensor, read (see Simonsen & Krogstad Reference Simonsen and Krogstad2005):
The invariants for all cases are plotted at the end of computations (
![]() $t^{\star }=30$
) in the Lumley triangle and presented in figure 15. The cases with
$t^{\star }=30$
) in the Lumley triangle and presented in figure 15. The cases with
![]() $r_{c}/h=0.333$
yield a quasi one-component turbulence, characterized by a dominating axial component and vanishing radial and azimuthal components. In this case, the influence of the Reynolds number on the anisotropy is minimal. Increasing the helical pitch reduces slightly the anisotropy. For the lower vortex-core radius
$r_{c}/h=0.333$
yield a quasi one-component turbulence, characterized by a dominating axial component and vanishing radial and azimuthal components. In this case, the influence of the Reynolds number on the anisotropy is minimal. Increasing the helical pitch reduces slightly the anisotropy. For the lower vortex-core radius
![]() $r_{c}/h=0.166$
, an increase in the Reynolds number or helical pitch yields invariant positions moving along the delimiting line towards an isotropic turbulence state at
$r_{c}/h=0.166$
, an increase in the Reynolds number or helical pitch yields invariant positions moving along the delimiting line towards an isotropic turbulence state at
![]() $\text{II}=\text{III}=0$
. This line characterizes an axisymmetric turbulence with a dominating axial component and identical radial and azimuthal components. In particular, a high helical pitch coupled to high Reynolds yields a flow state closer to isotropy. In general, in terms of the geometrical representation of the stress tensor proposed by Simonsen & Krogstad (Reference Simonsen and Krogstad2005), the shape of stress tensor evolves from a line in the thick core radius and low Reynolds case, to an elongated prolate spheroid when the Reynolds is increased and core radius decreased. Finally, the elongation of the prolate spheroid is reduced as the Reynolds keeps increasing and the helical pitch is high, tending towards a spherical shape characterizing isotropic turbulence.
$\text{II}=\text{III}=0$
. This line characterizes an axisymmetric turbulence with a dominating axial component and identical radial and azimuthal components. In particular, a high helical pitch coupled to high Reynolds yields a flow state closer to isotropy. In general, in terms of the geometrical representation of the stress tensor proposed by Simonsen & Krogstad (Reference Simonsen and Krogstad2005), the shape of stress tensor evolves from a line in the thick core radius and low Reynolds case, to an elongated prolate spheroid when the Reynolds is increased and core radius decreased. Finally, the elongation of the prolate spheroid is reduced as the Reynolds keeps increasing and the helical pitch is high, tending towards a spherical shape characterizing isotropic turbulence.
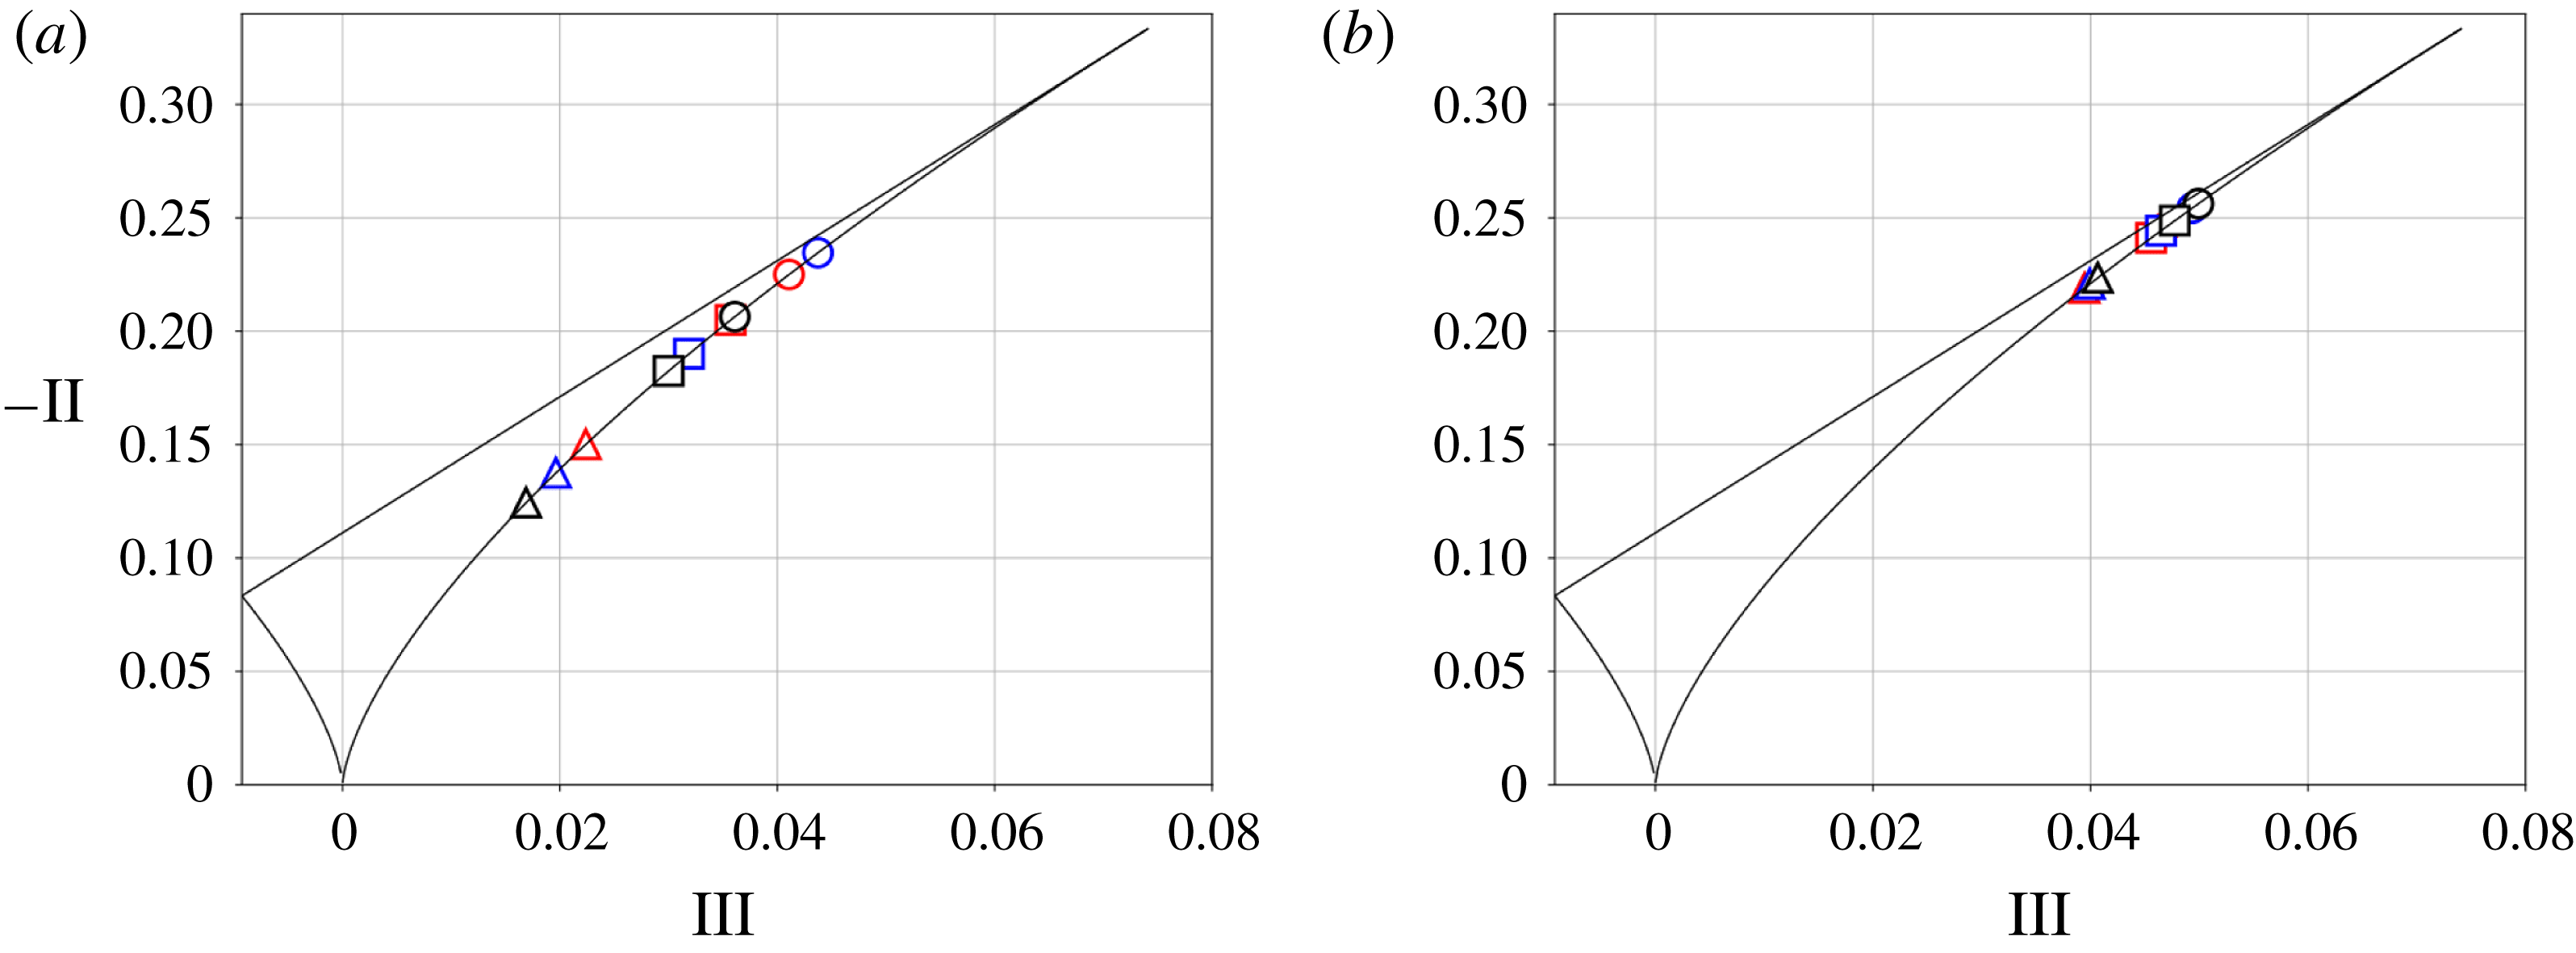
Figure 15. Anisotropic Reynolds stress tensor invariants plotted in Lumley triangle at
![]() $t^{\star }=30$
for vortex-core radii
$t^{\star }=30$
for vortex-core radii
![]() $r_{c}/h=0.166$
(a) and
$r_{c}/h=0.166$
(a) and
![]() $r_{c}/h=0.333$
(b).
$r_{c}/h=0.333$
(b).
6.2 Scale-by-scale anisotropy study
This section is devoted to the study of the relevant scales that develop during the turbulent regime, and their relation with the flow parameters. The integral scales of turbulence are defined as the integrals of the two-point correlation functions (see e.g. Pope Reference Pope2000):
where
![]() $k\neq i$
,
$k\neq i$
,
![]() $l\neq i$
and
$l\neq i$
and
![]() $k\neq l$
, such that the correlations are averaged in the two directions different than
$k\neq l$
, such that the correlations are averaged in the two directions different than
![]() $i$
.
$i$
.
![]() $\text{}\underline{e}_{j}$
is the unit vector in the
$\text{}\underline{e}_{j}$
is the unit vector in the
![]() $j$
th direction and
$j$
th direction and
![]() $x_{0}$
is the coordinate corresponding to the correlation function having a zero value. In our case, the index 1 corresponds to the axial direction, while the index 2 corresponds to the radial direction, yielding four different integral scales.
$x_{0}$
is the coordinate corresponding to the correlation function having a zero value. In our case, the index 1 corresponds to the axial direction, while the index 2 corresponds to the radial direction, yielding four different integral scales.
![]() $L_{xx}$
and
$L_{xx}$
and
![]() $L_{rr}$
are the axial scales related to the velocity components
$L_{rr}$
are the axial scales related to the velocity components
![]() $u$
and
$u$
and
![]() $u_{r}$
, respectively.
$u_{r}$
, respectively.
![]() $L_{xr}$
and
$L_{xr}$
and
![]() $L_{rx}$
are the transverse scales. We first plot the axial scales
$L_{rx}$
are the transverse scales. We first plot the axial scales
![]() $L_{xx}$
as a function of
$L_{xx}$
as a function of
![]() $h/R$
in figure 16 to assess the dependency of the length of the streamwise vortices to the helical pitch. The values of
$h/R$
in figure 16 to assess the dependency of the length of the streamwise vortices to the helical pitch. The values of
![]() $L_{xx}$
are computed at
$L_{xx}$
are computed at
![]() $t^{\star }=30$
which corresponds to the fully developed turbulent regime. Interestingly, the size of the streamwise structures is found to be directly proportional to the helical pitch, as the values
$t^{\star }=30$
which corresponds to the fully developed turbulent regime. Interestingly, the size of the streamwise structures is found to be directly proportional to the helical pitch, as the values
![]() $L_{xx}/h$
stay constant for different values of
$L_{xx}/h$
stay constant for different values of
![]() $h$
. This means that the initial value of helical pitch sets the size of streamwise turbulent structures even during the fully developed turbulent regime, and that the influence of the initial condition remains important for a long time after the breakdown of the helical structures. The Reynolds number and initial vortex-core radius are found to have little influence on the integral scale in the axial direction.
$h$
. This means that the initial value of helical pitch sets the size of streamwise turbulent structures even during the fully developed turbulent regime, and that the influence of the initial condition remains important for a long time after the breakdown of the helical structures. The Reynolds number and initial vortex-core radius are found to have little influence on the integral scale in the axial direction.
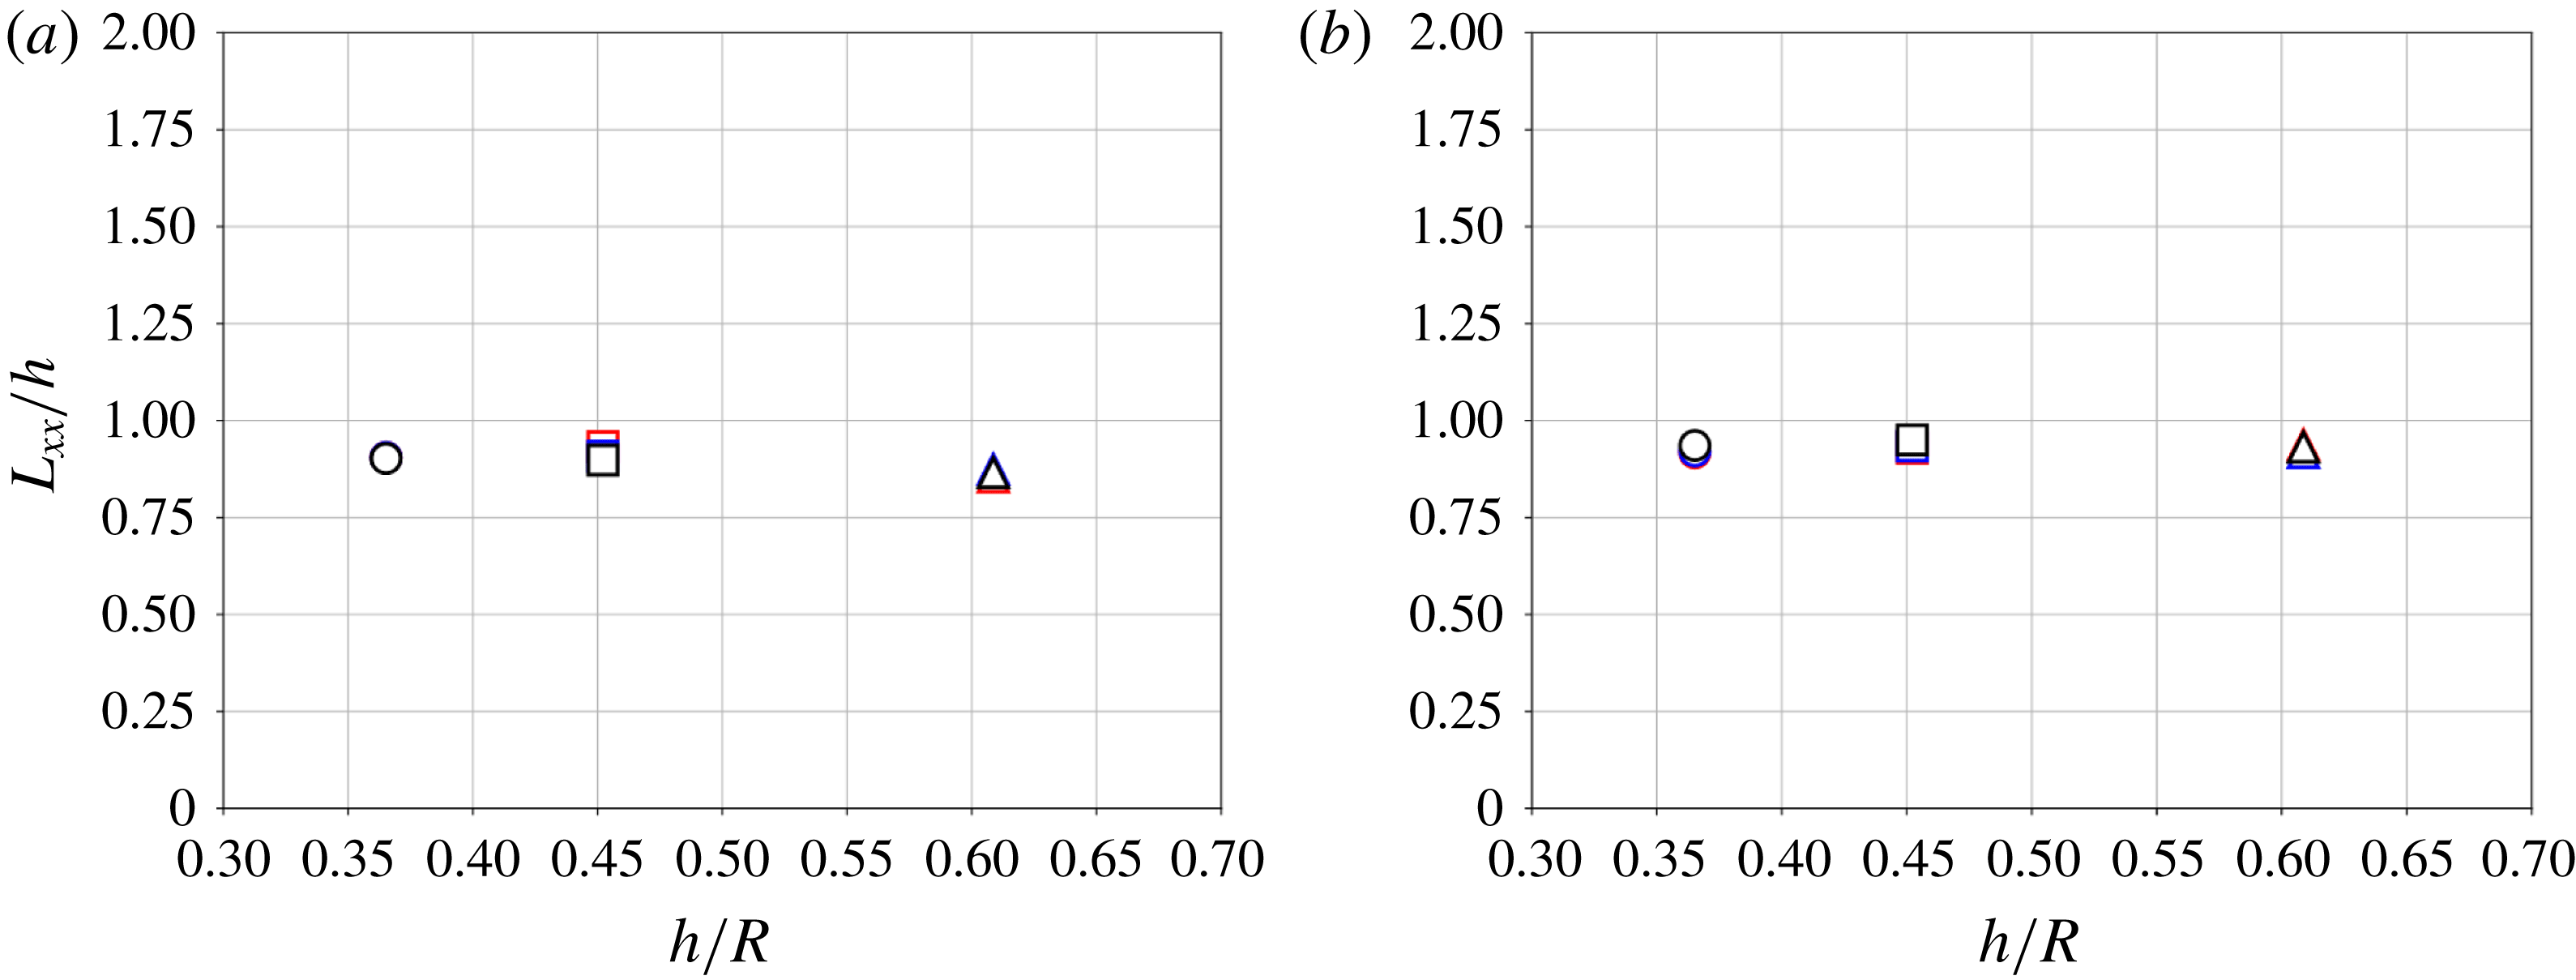
Figure 16. Axial integral scale
![]() $L_{xx}$
as a function of helical pitch
$L_{xx}$
as a function of helical pitch
![]() $h/R$
plotted at
$h/R$
plotted at
![]() $t^{\star }=30$
for vortex radii
$t^{\star }=30$
for vortex radii
![]() $r_{c}/h=0.166$
(a) and
$r_{c}/h=0.166$
(a) and
![]() $r_{c}/h=0.333$
(b).
$r_{c}/h=0.333$
(b).

Figure 17. Ratio of axial integral scales
![]() $\widetilde{L}_{x}/\widetilde{L}_{r}$
as a function of helical pitch
$\widetilde{L}_{x}/\widetilde{L}_{r}$
as a function of helical pitch
![]() $h/R$
plotted at
$h/R$
plotted at
![]() $t^{\star }=30$
for vortex radii
$t^{\star }=30$
for vortex radii
![]() $r_{c}/h=0.166$
(a) and
$r_{c}/h=0.166$
(a) and
![]() $r_{c}/h=0.333$
(b).
$r_{c}/h=0.333$
(b).
The anisotropy at large scales can be assessed by plotting the ratio of axial to radial integral scales, which should be equal to 1 for isotropic turbulence, see Pope (Reference Pope2000). In particular, we choose the definitions introduced by Carter & Coletti (Reference Carter and Coletti2017),
![]() $\widetilde{L}_{x}=(L_{xx}L_{xr})^{1/2}$
and
$\widetilde{L}_{x}=(L_{xx}L_{xr})^{1/2}$
and
![]() $\widetilde{L}_{r}=(L_{rr}L_{rx})^{1/2}$
, that account for the transverse integral length scales. Figure 17 shows the ratio
$\widetilde{L}_{r}=(L_{rr}L_{rx})^{1/2}$
, that account for the transverse integral length scales. Figure 17 shows the ratio
![]() $\widetilde{L}_{x}/\widetilde{L}_{r}$
at
$\widetilde{L}_{x}/\widetilde{L}_{r}$
at
![]() $t^{\star }=30$
for the various flow parameters. All cases display large-scale anisotropy, with the size of vortices being larger in the axial than in the radial direction (by a factor 2 to 4). Regarding the smaller core radius
$t^{\star }=30$
for the various flow parameters. All cases display large-scale anisotropy, with the size of vortices being larger in the axial than in the radial direction (by a factor 2 to 4). Regarding the smaller core radius
![]() $r_{c}/h=0.166$
cases, the ratio is highest for the intermediate helical pitch
$r_{c}/h=0.166$
cases, the ratio is highest for the intermediate helical pitch
![]() $h/R=0.45$
, and lower for the helical pitches
$h/R=0.45$
, and lower for the helical pitches
![]() $h/R=0.36$
and 0.61. This can be explained by two factors. First, the increase in helical pitch yields an increase of the axial integral scale, which explains the high values for the intermediate helical pitch. Second, the low values of integral scales ratio for the highest helical pitch can be explained by the fact that the turbulence is more isotropic for higher helical pitches, as seen from the Lumley triangle plots. This effect counteracts the increase of the axial-to-radial integral scale ratio, by an elongation of the turbulent structures in the radial direction.
$h/R=0.36$
and 0.61. This can be explained by two factors. First, the increase in helical pitch yields an increase of the axial integral scale, which explains the high values for the intermediate helical pitch. Second, the low values of integral scales ratio for the highest helical pitch can be explained by the fact that the turbulence is more isotropic for higher helical pitches, as seen from the Lumley triangle plots. This effect counteracts the increase of the axial-to-radial integral scale ratio, by an elongation of the turbulent structures in the radial direction.
Considering the larger vortex-core radius
![]() $r_{c}/h=0.333$
, a quasi-linear increase of the ratio as a function of the helical pitch is observed. From the observation that
$r_{c}/h=0.333$
, a quasi-linear increase of the ratio as a function of the helical pitch is observed. From the observation that
![]() $L_{xx}$
scales with
$L_{xx}$
scales with
![]() $h$
, this behaviour can be ascribed to radial scales the size of which is independent from the helical pitch. This fact is consistent with the observation from the Lumley triangle that the anisotropy is stronger for the larger vortex-core radius. The larger vortex core somewhat inhibits turbulent structure elongation in the radial direction, yielding increased large-scale anisotropy for increasing helical pitch.
$h$
, this behaviour can be ascribed to radial scales the size of which is independent from the helical pitch. This fact is consistent with the observation from the Lumley triangle that the anisotropy is stronger for the larger vortex-core radius. The larger vortex core somewhat inhibits turbulent structure elongation in the radial direction, yielding increased large-scale anisotropy for increasing helical pitch.
Overall, it is quite remarkable that the initial parameters defining the helical vortices have a persisting influence on the dynamics of the fully developed wake. In particular, the axial integral scales are directly proportional to the helical pitch, and the initial large vortex-core radius strengthens the anisotropy of the flow, preventing the turbulent structures becoming isotropic by restricting their radial extent.
The small-scale anisotropy is also investigated. As stated by George & Hussein (Reference George and Hussein1991), the average of the squared velocity gradients depend considerably on the dynamics of the smallest scales of the flow. Therefore, they proposed to study the small-scale anisotropy by computing the following ratios:
where
![]() $\langle \cdot \rangle$
denotes the volume-averaging operator. All these ratios should be equal to 1 for isotropic flows, and deviation from unity indicates a level of small-scale anisotropy. Moreover, these ratios are useful to verify the axisymmetric isotropy of small-scale structures (in the radial and azimuthal directions), satisfied if the equalities
$\langle \cdot \rangle$
denotes the volume-averaging operator. All these ratios should be equal to 1 for isotropic flows, and deviation from unity indicates a level of small-scale anisotropy. Moreover, these ratios are useful to verify the axisymmetric isotropy of small-scale structures (in the radial and azimuthal directions), satisfied if the equalities
![]() $K_{1}=K_{2}$
and
$K_{1}=K_{2}$
and
![]() $K_{3}=K_{4}$
hold.
$K_{3}=K_{4}$
hold.
The axisymmetry of small-scale structures is further checked by computing additional velocity gradient ratios as proposed by Ganapathisubramani, Lakshminarasimhan & Clemens (Reference Ganapathisubramani, Lakshminarasimhan and Clemens2008):
Axisymmetric isotropy is achieved when all these ratios are equal to 1. Figure 18 shows the values of ratios
![]() $K$
and
$K$
and
![]() $M$
for all cases considered, at
$M$
for all cases considered, at
![]() $t^{\star }=30$
. First, the axisymmetric isotropy seems to be well verified for all Reynolds numbers. Indeed, these cases show values of
$t^{\star }=30$
. First, the axisymmetric isotropy seems to be well verified for all Reynolds numbers. Indeed, these cases show values of
![]() $M_{1},M_{2},M_{3},M_{4}$
close to 1 and also verify the relations
$M_{1},M_{2},M_{3},M_{4}$
close to 1 and also verify the relations
![]() $K_{1}=K_{2}$
and
$K_{1}=K_{2}$
and
![]() $K_{3}=K_{4}$
. All computations exhibit a ratio
$K_{3}=K_{4}$
. All computations exhibit a ratio
![]() $K_{1}$
that tends to a value around 1.5, emphasizing a strong small-scale anisotropy. Similarly to the large-scale anisotropy, the small-scale anisotropy is stronger when the Reynolds number or the helical pitch decreases. The anisotropy identified at large scales seems therefore to propagate through the smallest scales via energy transfers. The fact that the ratios
$K_{1}$
that tends to a value around 1.5, emphasizing a strong small-scale anisotropy. Similarly to the large-scale anisotropy, the small-scale anisotropy is stronger when the Reynolds number or the helical pitch decreases. The anisotropy identified at large scales seems therefore to propagate through the smallest scales via energy transfers. The fact that the ratios
![]() $K_{1}$
and
$K_{1}$
and
![]() $K_{2}$
are greater than 1 also suggests an elongation of dissipative scales in the axial direction.
$K_{2}$
are greater than 1 also suggests an elongation of dissipative scales in the axial direction.
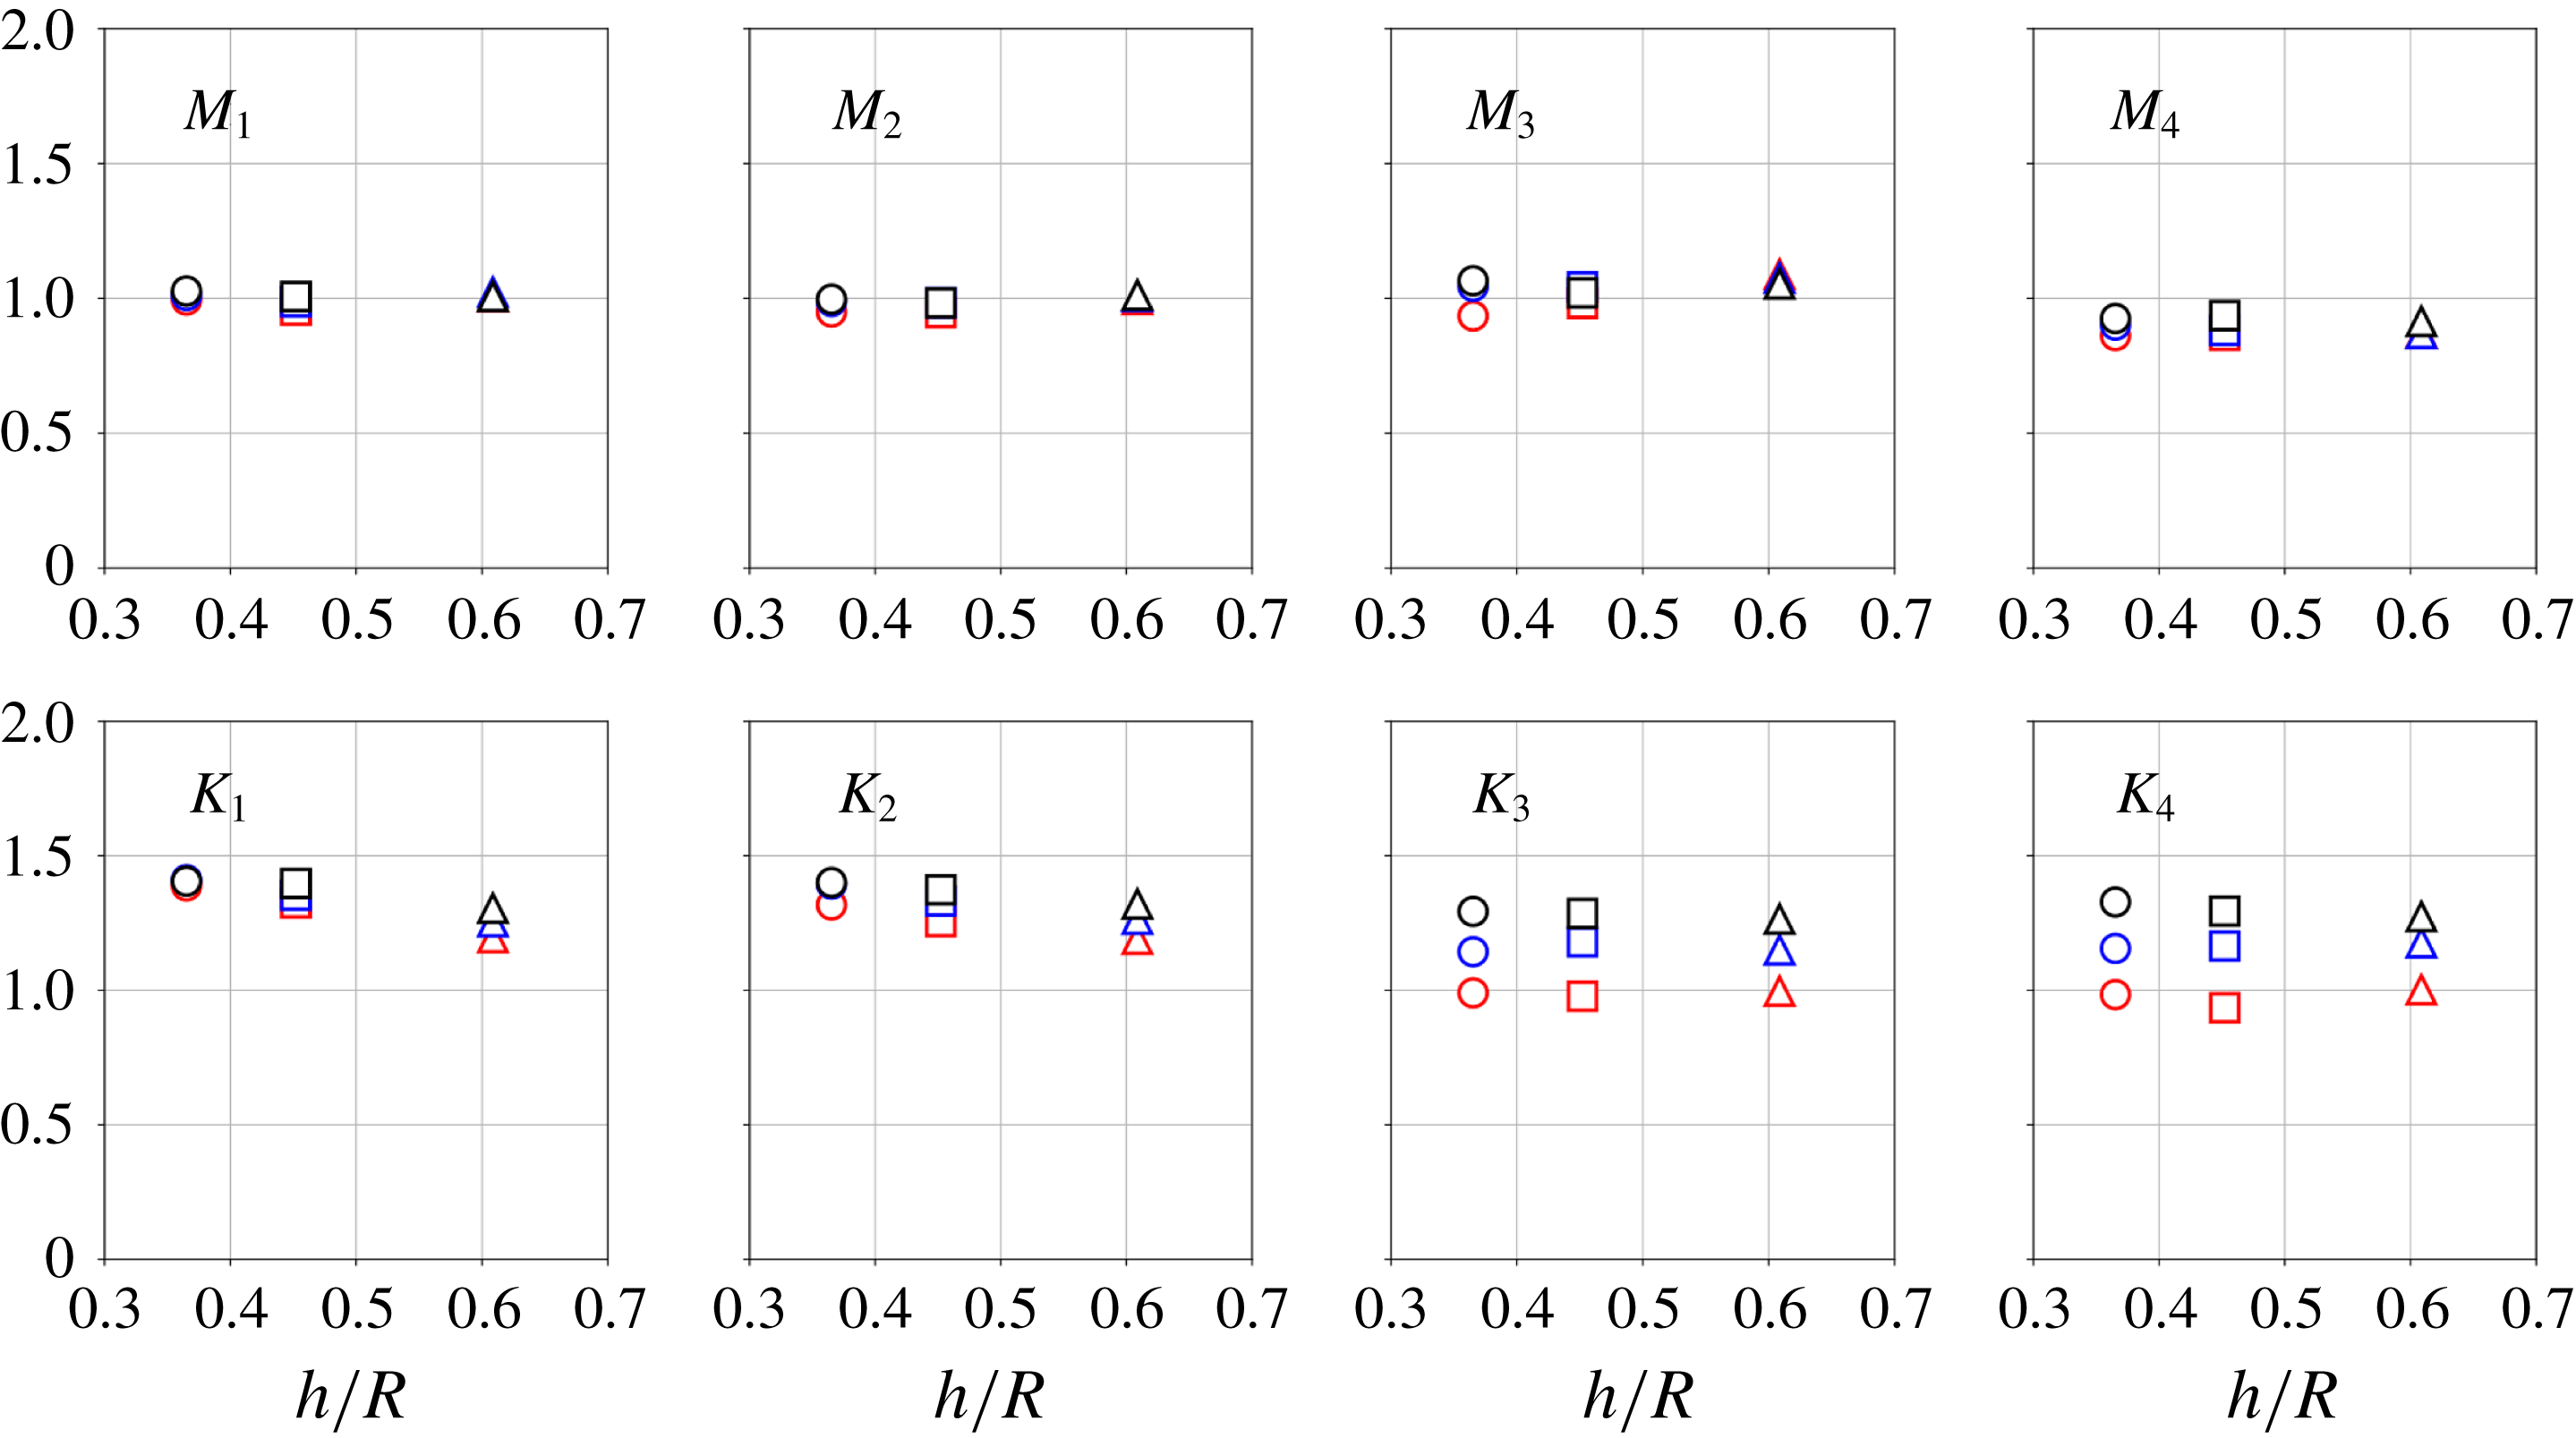
Figure 18. Small-scale anisotropy factors
![]() $K$
and
$K$
and
![]() $M$
as a function of
$M$
as a function of
![]() $h/R$
for an initial vortex-core radius
$h/R$
for an initial vortex-core radius
![]() $r_{c}/h=0.166$
.
$r_{c}/h=0.166$
.
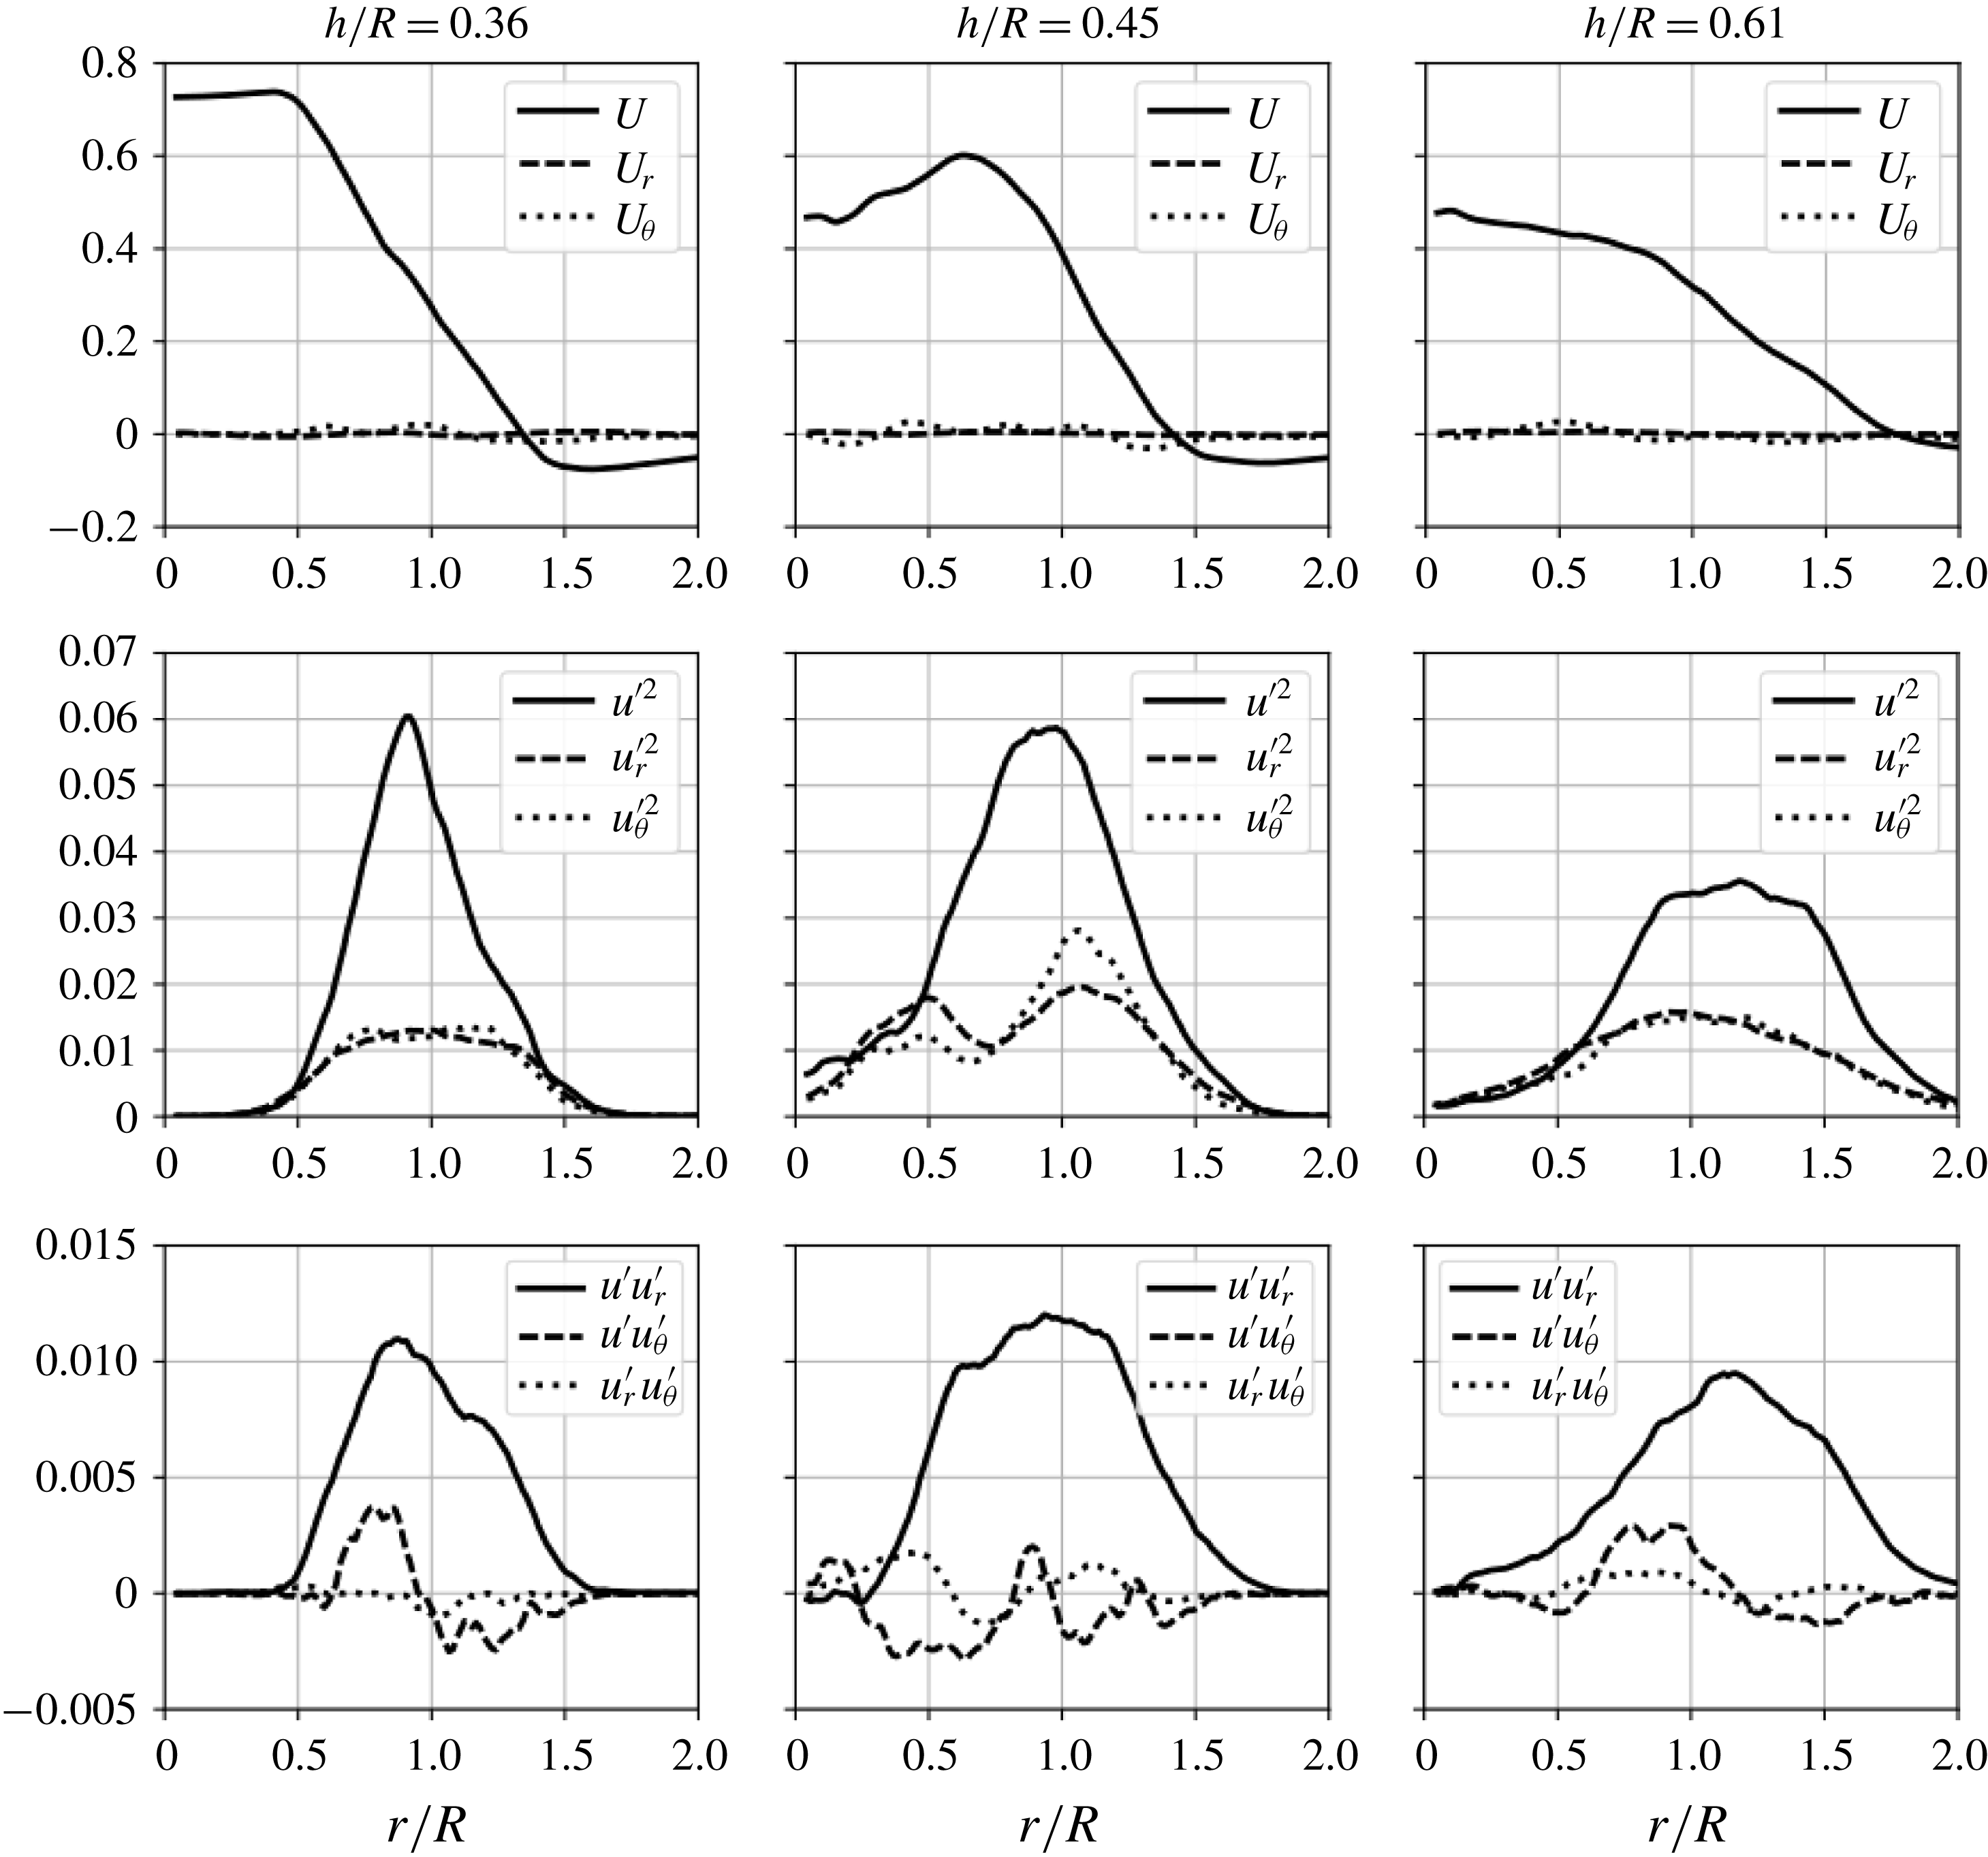
Figure 19. Radial velocity profiles plotted at
![]() $t^{\star }=30$
, cases
$t^{\star }=30$
, cases
![]() $Re_{\unicode[STIX]{x1D6E4}}=21\,000$
and
$Re_{\unicode[STIX]{x1D6E4}}=21\,000$
and
![]() $r_{c}/R=0.166$
. The mean components are normalized by
$r_{c}/R=0.166$
. The mean components are normalized by
![]() $\unicode[STIX]{x1D6E4}/h$
and the Reynolds stresses by
$\unicode[STIX]{x1D6E4}/h$
and the Reynolds stresses by
![]() $(\unicode[STIX]{x1D6E4}/h)^{2}$
. Quantities averaged in the axial and azimuthal directions.
$(\unicode[STIX]{x1D6E4}/h)^{2}$
. Quantities averaged in the axial and azimuthal directions.
6.3 Radial velocity profiles in the wake
In this section, the velocity profiles in the wake are studied using the classical Reynolds decomposition
![]() $u_{i}=U_{i}+u_{i}^{\prime }$
, where
$u_{i}=U_{i}+u_{i}^{\prime }$
, where
![]() $U_{i}$
is the (statistical) mean of the
$U_{i}$
is the (statistical) mean of the
![]() $i$
th component of velocity, hence averaged in the axial and azimuthal directions, with the respective operator indicated as
$i$
th component of velocity, hence averaged in the axial and azimuthal directions, with the respective operator indicated as
![]() $\langle \cdot \rangle _{x\,\unicode[STIX]{x1D703}}$
or
$\langle \cdot \rangle _{x\,\unicode[STIX]{x1D703}}$
or
![]() $\langle \cdot \rangle _{13}$
; the corresponding fluctuating quantity is indicated with
$\langle \cdot \rangle _{13}$
; the corresponding fluctuating quantity is indicated with
![]() $u_{i}^{\prime }$
. As a reminder, the directions
$u_{i}^{\prime }$
. As a reminder, the directions
![]() $(x,r,\unicode[STIX]{x1D703})$
are also herein referred to as
$(x,r,\unicode[STIX]{x1D703})$
are also herein referred to as
![]() $(1,2,3)$
. When the subscript is omitted for brevity, it is assumed that the symbol refers to the axial component, e.g.
$(1,2,3)$
. When the subscript is omitted for brevity, it is assumed that the symbol refers to the axial component, e.g.
![]() $U=U_{x}$
. The statistical quantities
$U=U_{x}$
. The statistical quantities
![]() $U=\langle u\rangle _{13}$
and
$U=\langle u\rangle _{13}$
and
![]() $\langle u_{i}^{\prime }\,u_{j}^{\prime }\rangle _{13}$
are therefore only a function of the radial direction
$\langle u_{i}^{\prime }\,u_{j}^{\prime }\rangle _{13}$
are therefore only a function of the radial direction
![]() $r$
.
$r$
.
Figure 19 shows the mean velocity profiles as well as the Reynolds stresses at various pitches for
![]() $Re_{\unicode[STIX]{x1D6E4}}=21\,000$
and
$Re_{\unicode[STIX]{x1D6E4}}=21\,000$
and
![]() $r_{c}/R=0.166$
. The profiles are plotted at the time
$r_{c}/R=0.166$
. The profiles are plotted at the time
![]() $t^{\star }=30$
at which the turbulent wake develops. Regarding the mean profiles, the axial component displays maximal values near the helix centreline, then decreases progressively when approaching the helix radius. This profile corresponds to the typical velocity defect observed in the wake of rotating devices. The mean radial and azimuthal velocities display values close to zero, which indicates that no average rotating motion is present in the flow. The axial fluctuations are dominant compared to the radial and azimuthal fluctuations which have the same levels. The peak of velocity fluctuations is located around
$t^{\star }=30$
at which the turbulent wake develops. Regarding the mean profiles, the axial component displays maximal values near the helix centreline, then decreases progressively when approaching the helix radius. This profile corresponds to the typical velocity defect observed in the wake of rotating devices. The mean radial and azimuthal velocities display values close to zero, which indicates that no average rotating motion is present in the flow. The axial fluctuations are dominant compared to the radial and azimuthal fluctuations which have the same levels. The peak of velocity fluctuations is located around
![]() $r=R$
, indicating that the region of turbulent production and small-scale generation is related to the initial helix radius. Overall, it is interesting to note that the wake development is more advanced when the helical pitch is increased, as seen from the mean centreline axial velocity,
$r=R$
, indicating that the region of turbulent production and small-scale generation is related to the initial helix radius. Overall, it is interesting to note that the wake development is more advanced when the helical pitch is increased, as seen from the mean centreline axial velocity,
![]() $U_{c}=U_{x}(r=0)$
, which is reduced for higher helical pitch, and the velocity fluctuations more spread out along the radial direction. This can be attributed to the time scale issue addressed in § 5.2 from the observation of the evolution of volume-averaged kinetic energy. The time scale
$U_{c}=U_{x}(r=0)$
, which is reduced for higher helical pitch, and the velocity fluctuations more spread out along the radial direction. This can be attributed to the time scale issue addressed in § 5.2 from the observation of the evolution of volume-averaged kinetic energy. The time scale
![]() $t^{\star }=t\unicode[STIX]{x1D6E4}/h^{2}$
is indeed suited to the collapse of the flow evolution for different helical pitches up to the occurrence of the reconnection events, but is not appropriate afterwards to describe the evolution of the turbulent wake. Hence, various wakes at the same dimensionless time
$t^{\star }=t\unicode[STIX]{x1D6E4}/h^{2}$
is indeed suited to the collapse of the flow evolution for different helical pitches up to the occurrence of the reconnection events, but is not appropriate afterwards to describe the evolution of the turbulent wake. Hence, various wakes at the same dimensionless time
![]() $t^{\star }=30$
are in fact in more advanced stages of development for higher helical pitches.
$t^{\star }=30$
are in fact in more advanced stages of development for higher helical pitches.
6.4 Far-wake self-similarity
In this section, the self-similarity of the flow is assessed in the far wake, and the self-similar properties compared to those of known results related to the spatial development of helical vortices past wind turbines. A simulation with the parameters
![]() $Re_{\unicode[STIX]{x1D6E4}}=21\,000$
,
$Re_{\unicode[STIX]{x1D6E4}}=21\,000$
,
![]() $h/R=0.36$
and
$h/R=0.36$
and
![]() $r_{c}/h=0.166$
is performed up to
$r_{c}/h=0.166$
is performed up to
![]() $t^{\star }=240$
, in order to assess the self-similarity in the turbulent far wake, with a box size extended to
$t^{\star }=240$
, in order to assess the self-similarity in the turbulent far wake, with a box size extended to
![]() $L_{y}=L_{z}=6.5R$
in the helix cross-section to accommodate the larger spreading of the wake. The number of grid points is increased accordingly to match the spatial resolution of the original simulation with a smaller box size. The region of self-similarity can be identified by plotting the evolution of the centreline velocity and displacement thickness which read:
$L_{y}=L_{z}=6.5R$
in the helix cross-section to accommodate the larger spreading of the wake. The number of grid points is increased accordingly to match the spatial resolution of the original simulation with a smaller box size. The region of self-similarity can be identified by plotting the evolution of the centreline velocity and displacement thickness which read:
where
![]() $U(r)$
is the axial velocity component averaged in the axial and azimuthal directions. According to Dufresne & Wosnik (Reference Dufresne and Wosnik2013) or Okulov et al. (Reference Okulov, Naumov, Mikkelsen and Sørensen2015), the self-similar region, for a spatially developing wind turbine wake, is identified when the centreline velocity and displacement thickness verify
$U(r)$
is the axial velocity component averaged in the axial and azimuthal directions. According to Dufresne & Wosnik (Reference Dufresne and Wosnik2013) or Okulov et al. (Reference Okulov, Naumov, Mikkelsen and Sørensen2015), the self-similar region, for a spatially developing wind turbine wake, is identified when the centreline velocity and displacement thickness verify
![]() $U_{c}\propto (x-x_{0})^{-2/3}$
and
$U_{c}\propto (x-x_{0})^{-2/3}$
and
![]() $\unicode[STIX]{x1D6FF}^{\star }\propto (x-x_{0})^{1/3}$
, respectively. For the present temporally developing wake configuration, the time replaces the longitudinal spatial coordinate such that these laws translate to
$\unicode[STIX]{x1D6FF}^{\star }\propto (x-x_{0})^{1/3}$
, respectively. For the present temporally developing wake configuration, the time replaces the longitudinal spatial coordinate such that these laws translate to
![]() $U_{c}\propto (t-t_{0})^{-2/3}$
and
$U_{c}\propto (t-t_{0})^{-2/3}$
and
![]() $\unicode[STIX]{x1D6FF}^{\star }\propto (t-t_{0})^{1/3}$
. The evolutions of
$\unicode[STIX]{x1D6FF}^{\star }\propto (t-t_{0})^{1/3}$
. The evolutions of
![]() $U_{c}$
and
$U_{c}$
and
![]() $\unicode[STIX]{x1D6FF}^{\star }$
are plotted in figure 20. The centreline velocity and displacement thickness remain constant up to approximately
$\unicode[STIX]{x1D6FF}^{\star }$
are plotted in figure 20. The centreline velocity and displacement thickness remain constant up to approximately
![]() $t^{\star }=50$
, then start to respectively decrease and increase. Starting from
$t^{\star }=50$
, then start to respectively decrease and increase. Starting from
![]() $t^{\star }\approx 100$
, the agreement with the
$t^{\star }\approx 100$
, the agreement with the
![]() $-2/3$
and
$-2/3$
and
![]() $1/3$
power laws for
$1/3$
power laws for
![]() $U_{c}$
and
$U_{c}$
and
![]() $\unicode[STIX]{x1D6FF}^{\star }$
, respectively, is reasonable, indicating the onset of the self-similar region. To further assess the self-similarity in the wake, the axial velocity and turbulent kinetic energy profiles are plotted in figure 21 at various times corresponding to the self-similar region. The profiles are made non-dimensional using either the self-similarity variables
$\unicode[STIX]{x1D6FF}^{\star }$
, respectively, is reasonable, indicating the onset of the self-similar region. To further assess the self-similarity in the wake, the axial velocity and turbulent kinetic energy profiles are plotted in figure 21 at various times corresponding to the self-similar region. The profiles are made non-dimensional using either the self-similarity variables
![]() $U_{c}$
and
$U_{c}$
and
![]() $\unicode[STIX]{x1D6FF}^{\star }$
(figure 21
b,d) or the non-self-similar variables
$\unicode[STIX]{x1D6FF}^{\star }$
(figure 21
b,d) or the non-self-similar variables
![]() $h,R$
and
$h,R$
and
![]() $\unicode[STIX]{x1D6E4}$
(figure 21
a,c). The mean axial velocity collapses well for the different times considered when made non-dimensional using the self-similarity variables, as well as the turbulent kinetic energy. The turbulent kinetic energy profiles show variations near the centre of the helix, which can be attributed to the relatively low statistical sampling depending directly on the axial extent of the box (in a spatially developing wake, this would correspond to the temporal sampling of the statistics). Considering larger boxes in the axial direction would probably yield a better statistical convergence allowing for a more thorough assessment of the wake self-similarity. As this can be a topic for future studies, the present results hint at the collapse of the velocity fluctuations in the self-similar region of the wake. Considering larger boxes in the cross-plane direction could also allow assessment for longer times of the spread of the wake and the extent of the self-similar regime. The results in the present section indicate that temporally developing helical vortices can relate to more applied rotor–wake configurations. An additional comparison against experiments in proposed in appendix C, in which the present methodology is assessed for the representation of large-scale instabilities that occur in the developed wake past rotor blades.
$\unicode[STIX]{x1D6E4}$
(figure 21
a,c). The mean axial velocity collapses well for the different times considered when made non-dimensional using the self-similarity variables, as well as the turbulent kinetic energy. The turbulent kinetic energy profiles show variations near the centre of the helix, which can be attributed to the relatively low statistical sampling depending directly on the axial extent of the box (in a spatially developing wake, this would correspond to the temporal sampling of the statistics). Considering larger boxes in the axial direction would probably yield a better statistical convergence allowing for a more thorough assessment of the wake self-similarity. As this can be a topic for future studies, the present results hint at the collapse of the velocity fluctuations in the self-similar region of the wake. Considering larger boxes in the cross-plane direction could also allow assessment for longer times of the spread of the wake and the extent of the self-similar regime. The results in the present section indicate that temporally developing helical vortices can relate to more applied rotor–wake configurations. An additional comparison against experiments in proposed in appendix C, in which the present methodology is assessed for the representation of large-scale instabilities that occur in the developed wake past rotor blades.
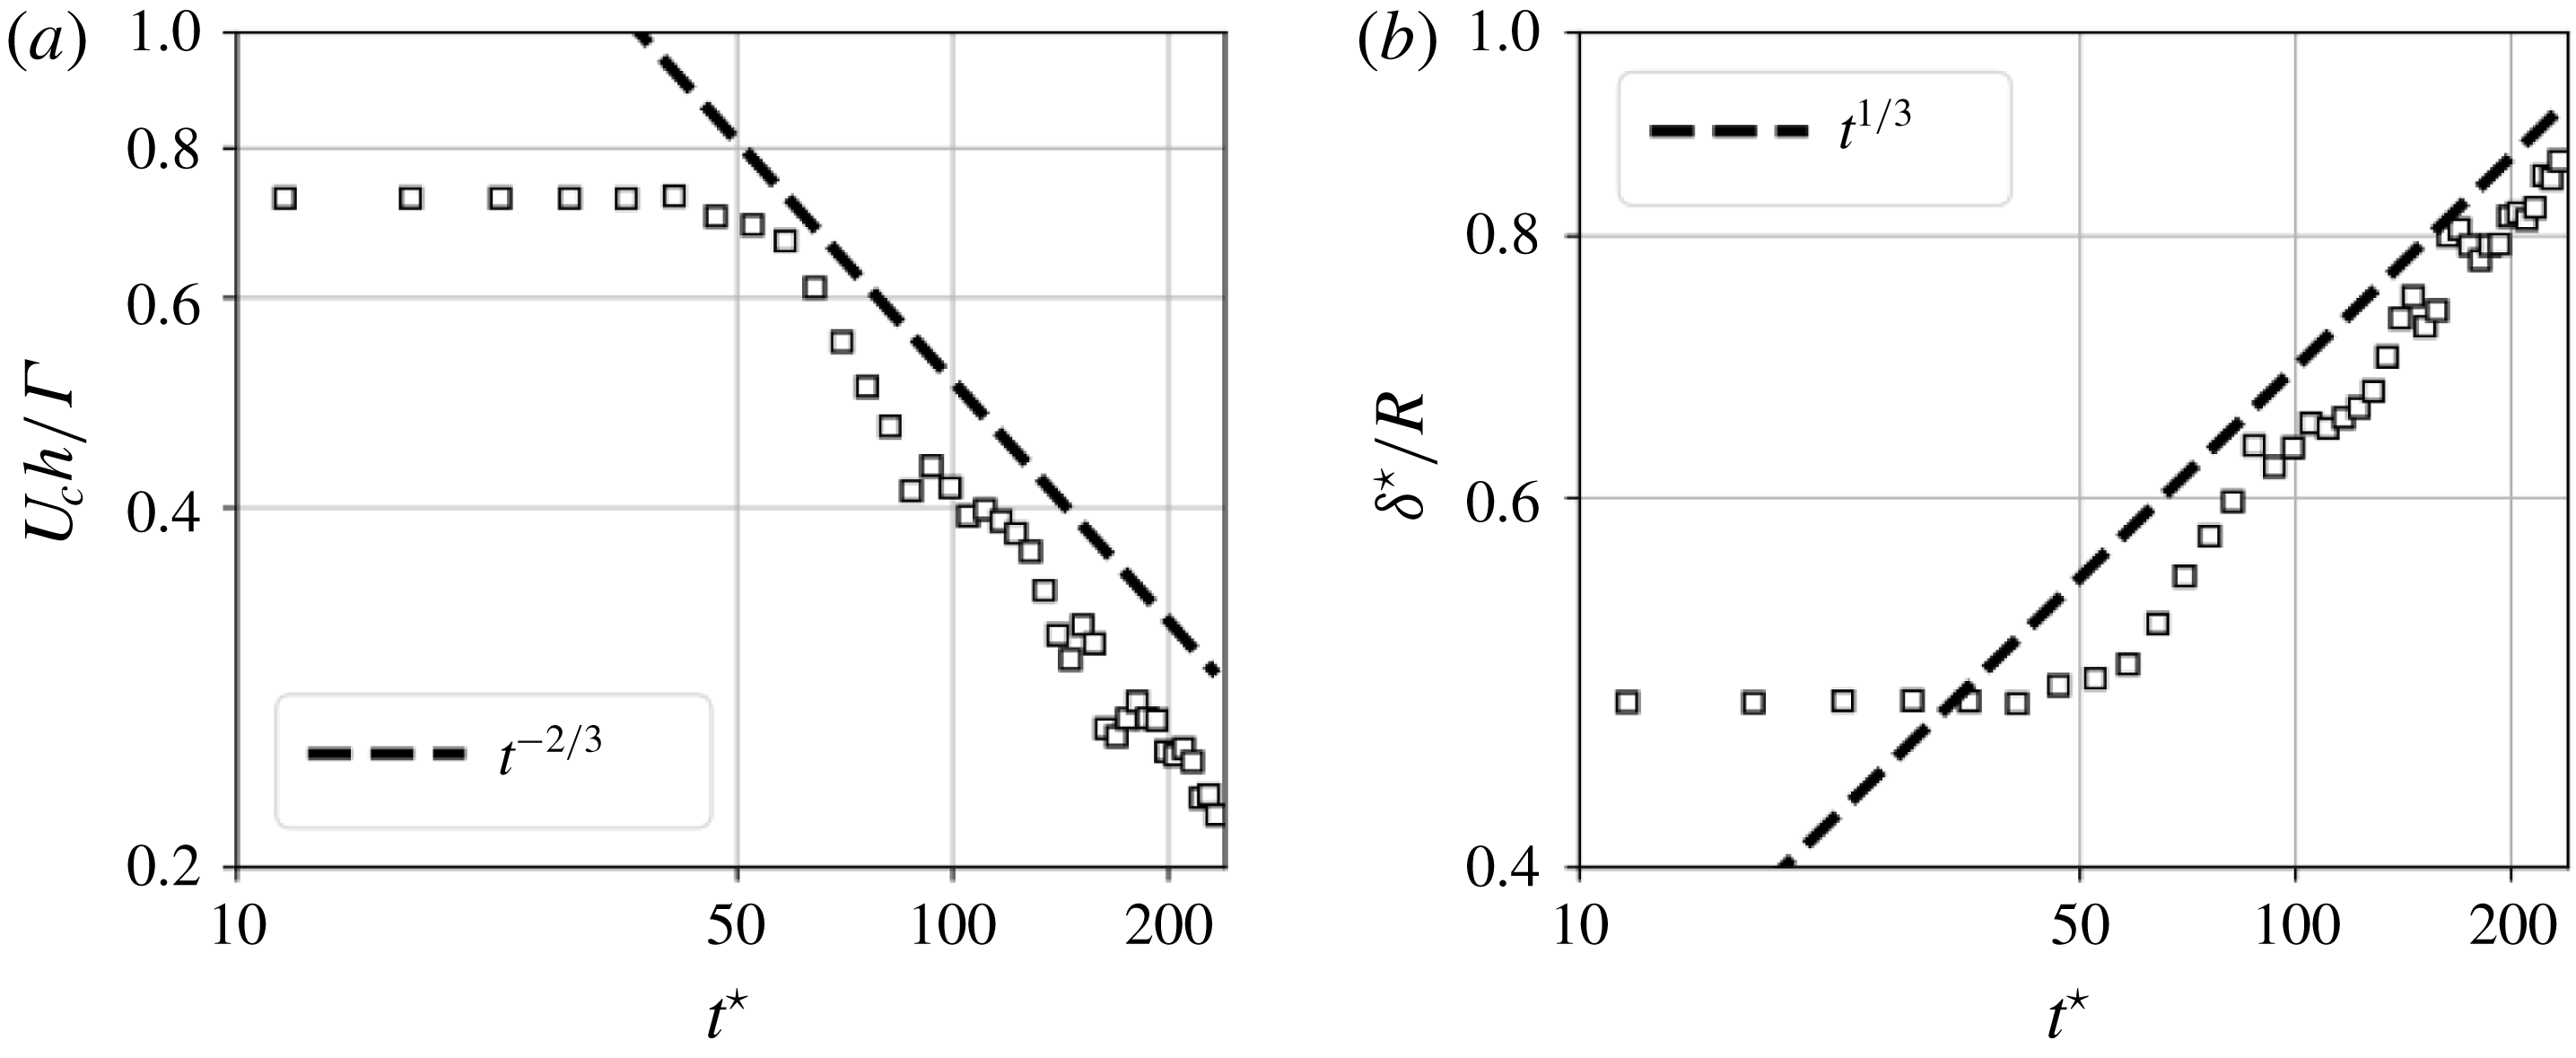
Figure 20. Temporal evolution of centreline velocity and displacement thickness for the simulation with parameters
![]() $Re_{\unicode[STIX]{x1D6E4}}=21\,000$
,
$Re_{\unicode[STIX]{x1D6E4}}=21\,000$
,
![]() $h/R=0.36$
and
$h/R=0.36$
and
![]() $r_{c}/h=0.166$
.
$r_{c}/h=0.166$
.
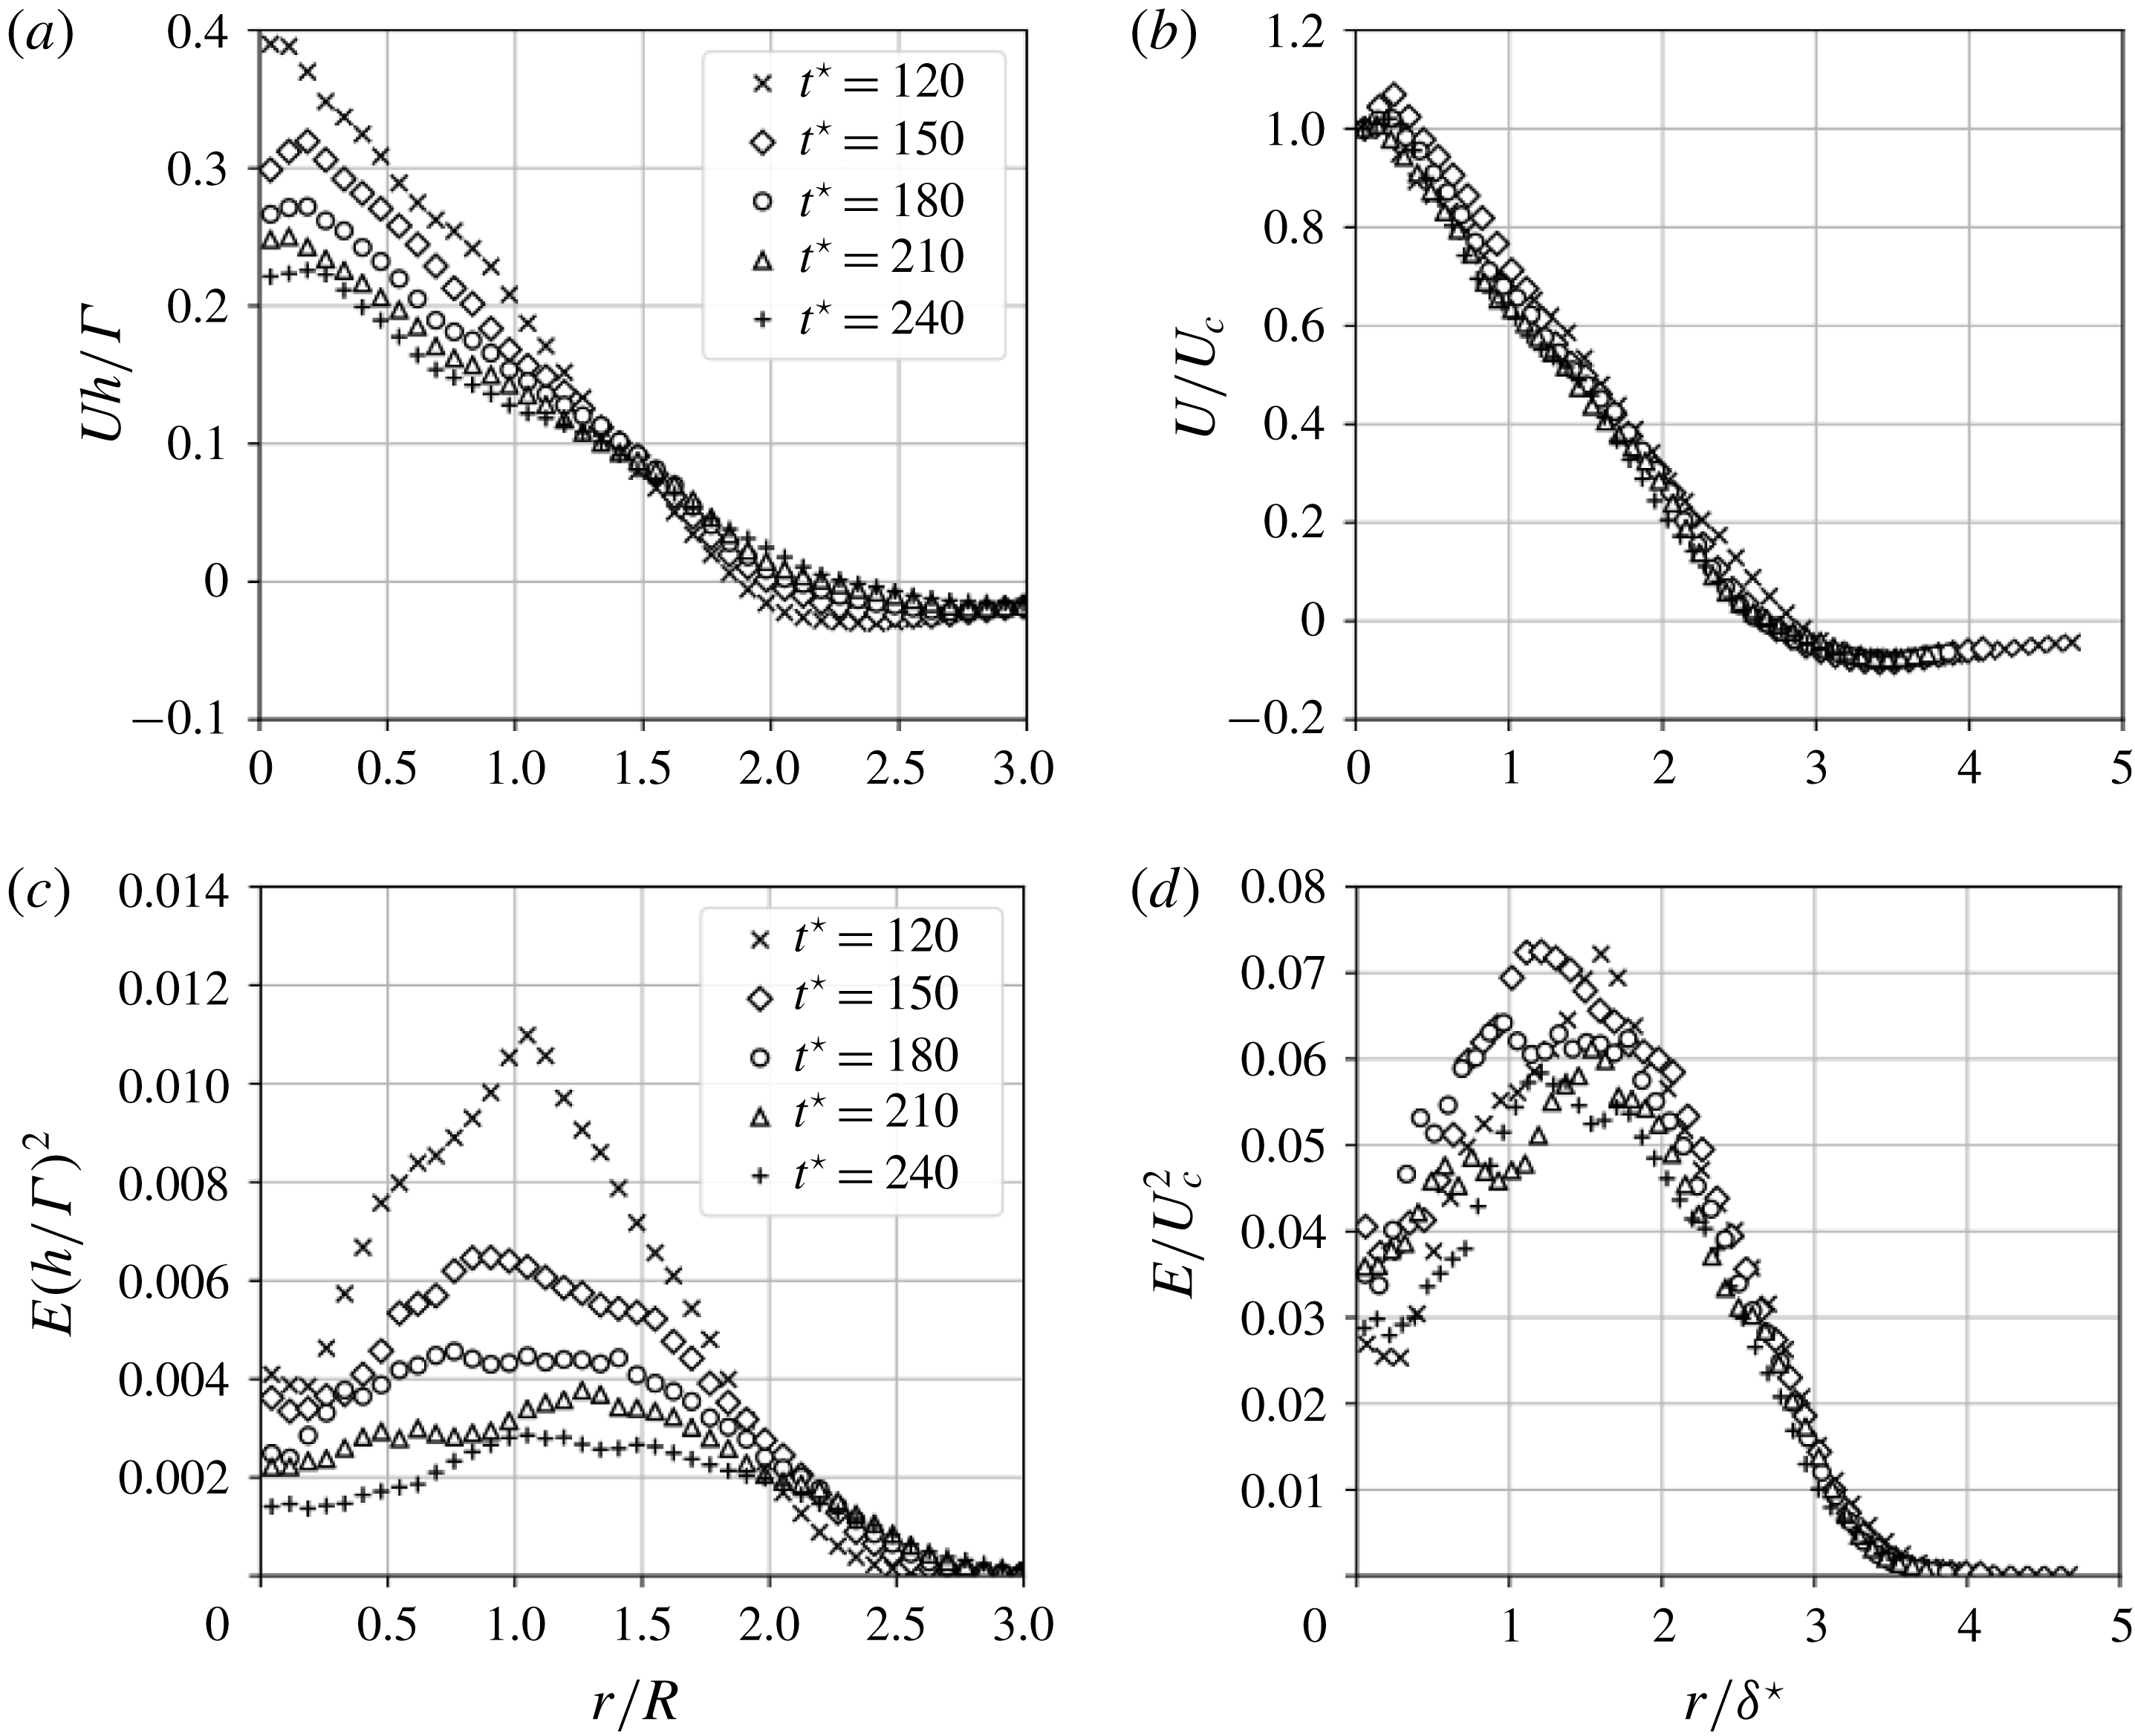
Figure 21. Mean velocity and turbulent kinetic energy radial profiles in the self-similar region of the wake. (a,c) Variables made non-dimensional using
![]() $h,R$
and
$h,R$
and
![]() $\unicode[STIX]{x1D6E4}$
. (b,d) Variables made non-dimensional using the self-similar quantities
$\unicode[STIX]{x1D6E4}$
. (b,d) Variables made non-dimensional using the self-similar quantities
![]() $U_{c}$
and
$U_{c}$
and
![]() $\unicode[STIX]{x1D6FF}^{\star }$
. The quantity
$\unicode[STIX]{x1D6FF}^{\star }$
. The quantity
![]() $E=(1/2)\langle u^{\prime 2}+u_{r}^{\prime 2}+u_{\unicode[STIX]{x1D703}}^{\prime 2}\rangle _{13}$
is the turbulent kinetic energy.
$E=(1/2)\langle u^{\prime 2}+u_{r}^{\prime 2}+u_{\unicode[STIX]{x1D703}}^{\prime 2}\rangle _{13}$
is the turbulent kinetic energy.
7 Conclusion
This paper discussed a numerical study of temporally developing double helical vortices subject to the mutual inductance phenomenon. The helical vortices are defined in a periodic domain using the Biot–Savart law with a regularized Kernel, then left to evolve temporally by solving the Navier–Stokes equations with an ad hoc large-eddy simulation closure, enabling the consideration of high-Reynolds-number computations. The numerical set-up has been validated by accurately reproducing the growth rates obtained from the experiment of Nemes et al. (Reference Nemes, Lo Jacono, Blackburn and Sheridan2015) for a range of helical pitches. A thorough study involving 18 computations covering a range of flow parameters including the helical pitch, initial vortex-core radius and Reynolds number has been conducted.
A study of vortex-core displacement growth rates occurring during the early inviscid regime considering various flow parameters has confirmed some properties of the mutual inductance phenomenon. A collapse of the growth rates regarding various helical pitches
![]() $h$
has been obtained defining a non-dimensional time
$h$
has been obtained defining a non-dimensional time
![]() $t^{\ast }=t\unicode[STIX]{x1D6E4}/h^{2}$
where
$t^{\ast }=t\unicode[STIX]{x1D6E4}/h^{2}$
where
![]() $\unicode[STIX]{x1D6E4}$
is the vortex circulation. Computations involving various Reynolds numbers have shown that vortex-core displacement growth rates are mostly insensitive to the Reynolds based on the circulation and fluid viscosity. At low Reynolds number, however, a restriction of the extent in time of the exponential growth of vortex-core displacement is observed. It has also been confirmed that a larger initial vortex-core radius reduces the growth rates, as found analytically by Gupta & Loewy (Reference Gupta and Loewy1974).
$\unicode[STIX]{x1D6E4}$
is the vortex circulation. Computations involving various Reynolds numbers have shown that vortex-core displacement growth rates are mostly insensitive to the Reynolds based on the circulation and fluid viscosity. At low Reynolds number, however, a restriction of the extent in time of the exponential growth of vortex-core displacement is observed. It has also been confirmed that a larger initial vortex-core radius reduces the growth rates, as found analytically by Gupta & Loewy (Reference Gupta and Loewy1974).
The vortex reconnection events yielding transition to fully developed turbulence have been characterized. After the end of the inviscid regime, the helices undergo leap frogging, which creates the conditions for vortex reconnection. Two types of vortex reconnection events have been identified. The first one, occurring for all values of helical pitch considered, is due to the proximity of orthogonal vortex filaments during the leap frogging of the helices. This event occurs when the orthogonal filaments become progressively anti-parallel, creating bridges separating the two initial vortices. Threads of small core radius that are elongated in the axial direction appear in between the bridges. The second event is observed only for small helical pitch, and concerns high- and low-speed vortex filaments that present large amplitude oscillation, allowing for a merging of vortices in a similar way as the elliptical Crow instability.
A study of the turbulence anisotropy in the wake of the pair of helical vortices during the fully developed turbulence regime has been conducted. Calculations of the anisotropic Reynolds stress tensor have revealed a strong anisotropy for all cases, with a dominant axial component compared to the radial and azimuthal fluctuations, which are equal. The computation of the Lumley invariants shows that increasing the helical pitch or Reynolds number reduces the turbulence anisotropy, whereas a larger initial vortex-core radius strengthens the anisotropy. A scale-by-scale anisotropy study showed that the axial integral scale is directly proportional to the helical pitch. The large scales are found to be anisotropic, with an elongation in the axial direction compared to the radial direction. This large-scale anisotropy is also propagated to smaller scales, as found by computing the moments of vorticity gradient ratios in various directions.
Future directions for this work may involve the evaluation of the shapes of the vortex cores and their evolution in terms of the wake’s age, as proposed by Martin & Leishman (Reference Martin and Leishman2003), in order to determine how the transition to turbulence in the present case affects the vortex-core velocity profiles. The self-similarity study and assessment of large-scale instabilities in the far wake should also be extended to more realistic configurations, including the blade root vortex and vortex-core initialization that takes into account inflow turbulence.
Acknowledgements
The authors acknowledge financial support of the subcontract KSC-17-001 between Purdue University and Kord Technologies, Inc (Huntsville), conducting research under the US Navy Contract N68335-17-C-0159 STTR-Phase II, Purdue Proposal no. 00065007, Topic N15A-T002 entitled Vortex preserving and consistent large eddy simulations for naval applications; and the interactions with Dr D. Findlay and Dr J. Forsythe. The authors also acknowledge the support of the Army Research Office’s Young Investigator Program (ARO-YIP) Award W911NF-18-1-0045 for the proposal entitled Coherent-vorticity-preserving (CvP) large-eddy simulation (LES) of very-high-Reynolds-number vortex dynamics and the inspiring conversations with Dr M. Munson (Army Research Office).
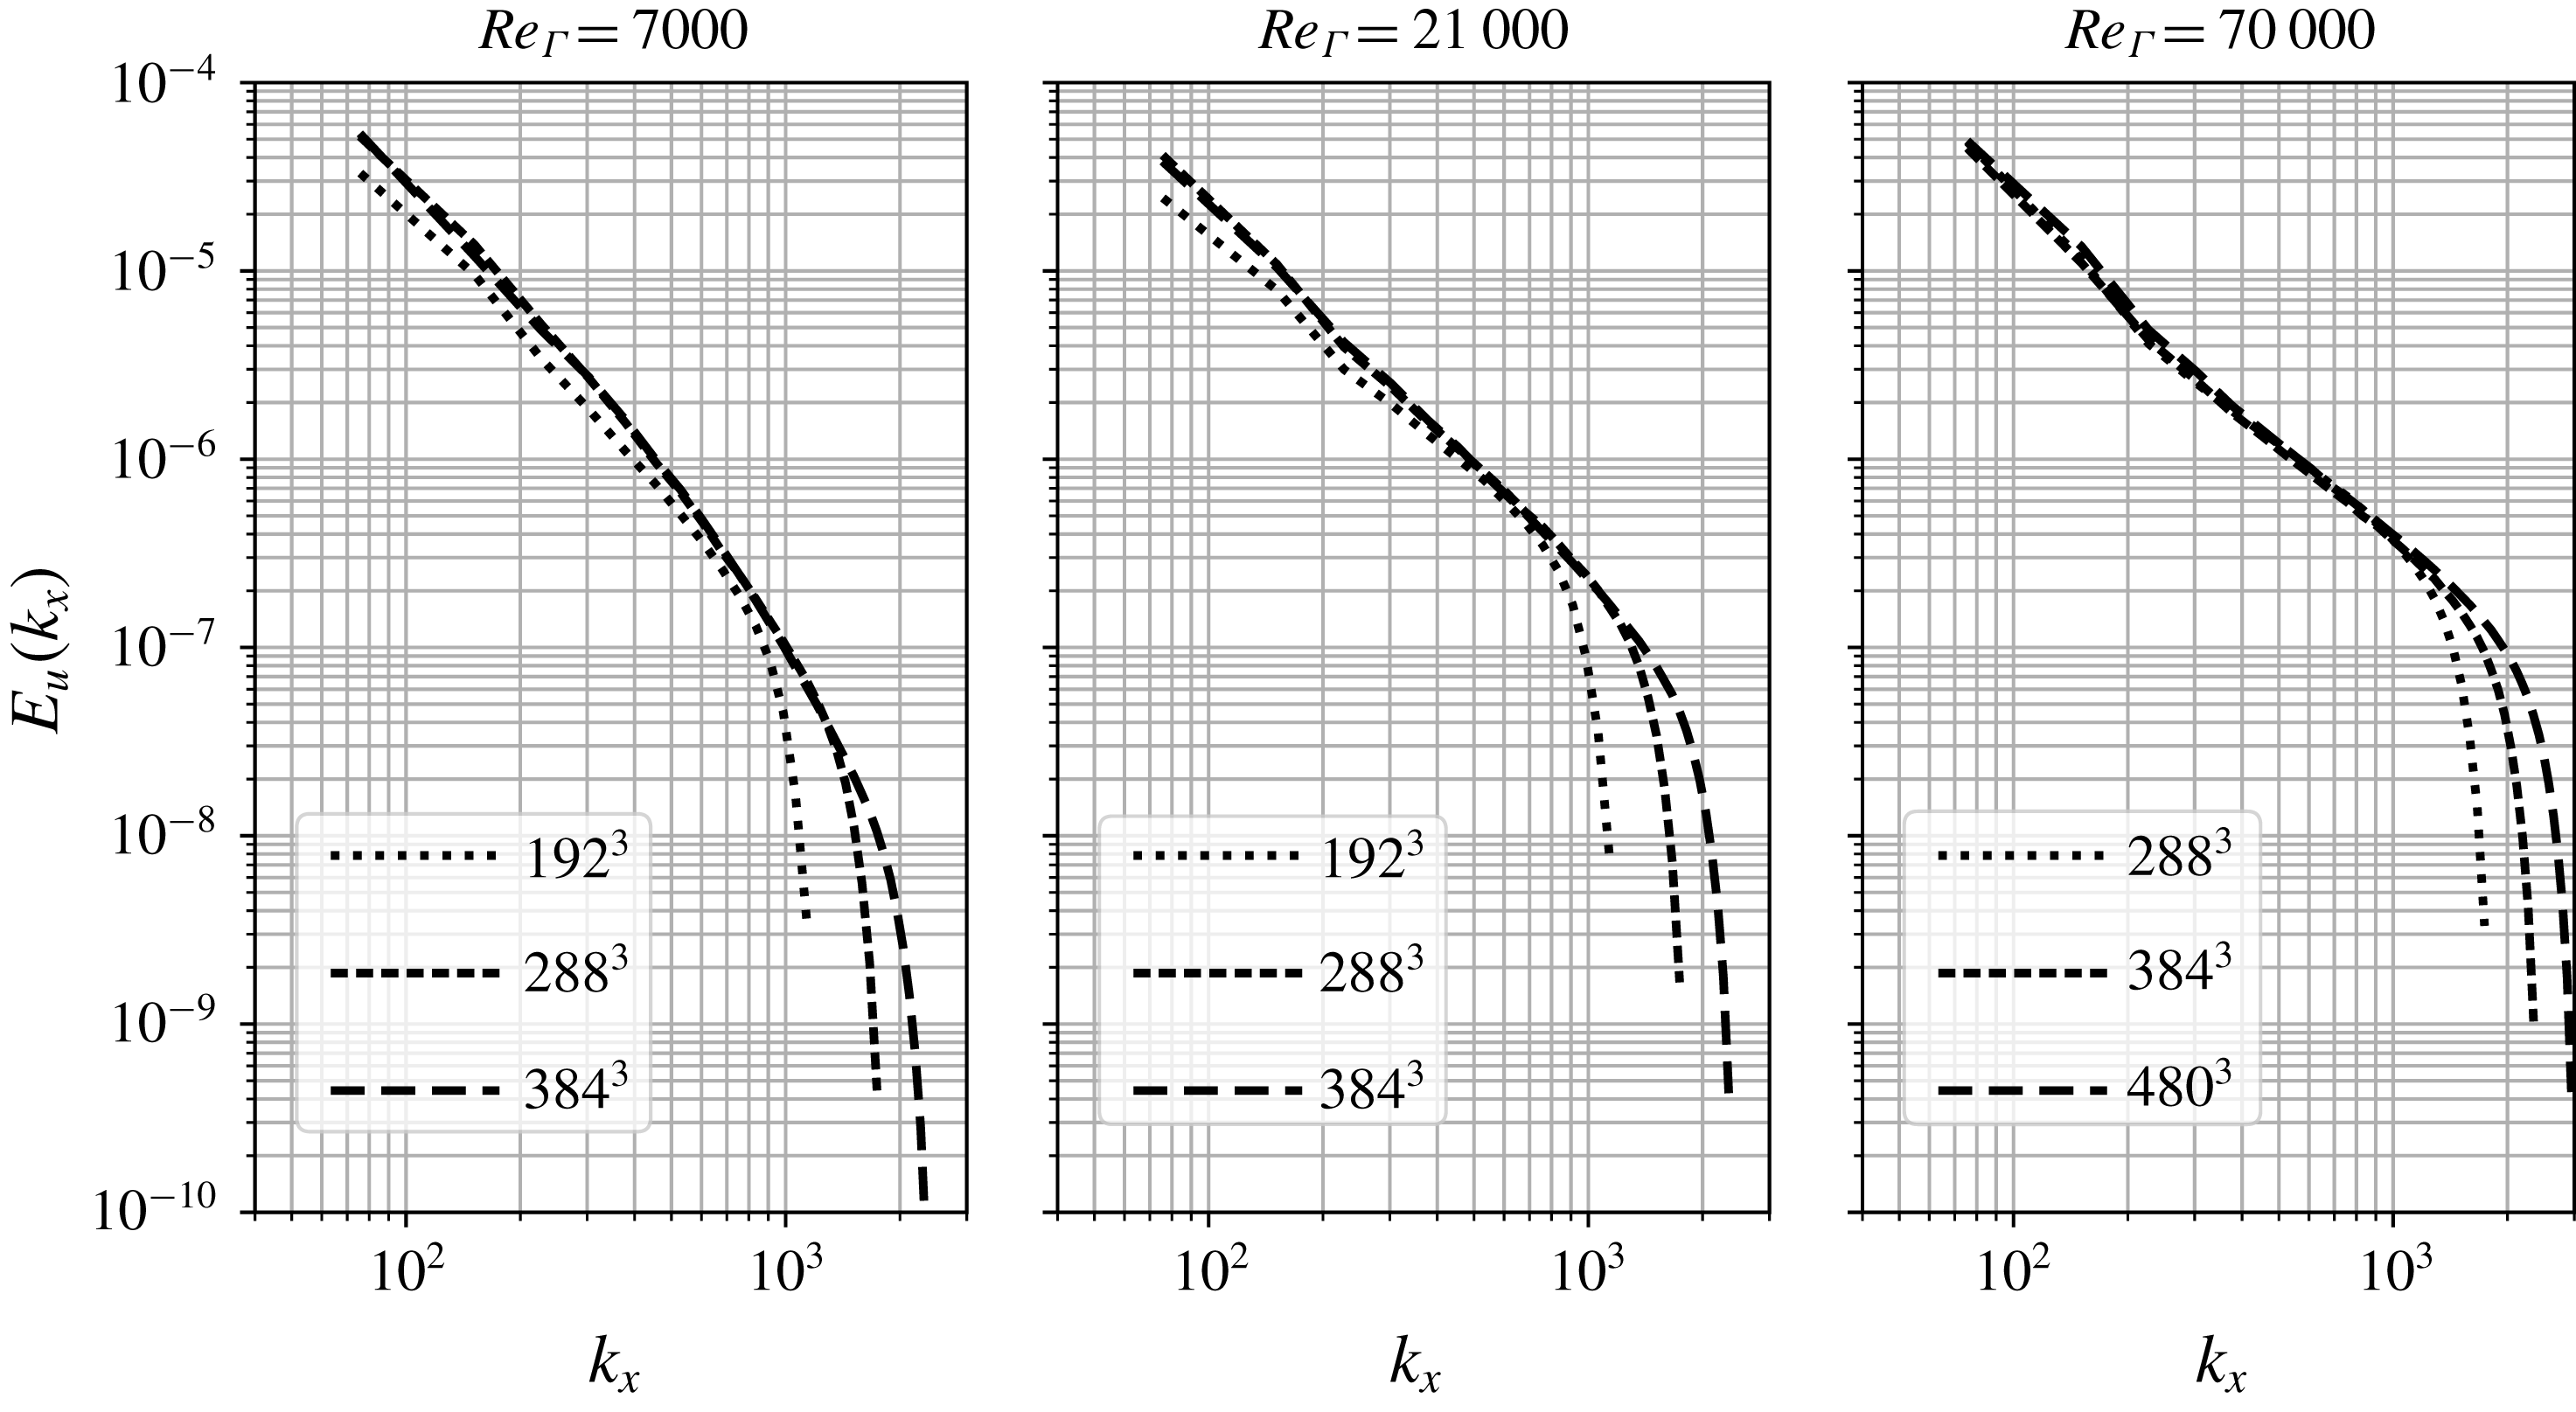
Figure 22. Energy spectra for the grid sensitivity study considering various Reynolds numbers and the case
![]() $h/R=0.36$
and
$h/R=0.36$
and
![]() $r_{c}/h=0.166$
.
$r_{c}/h=0.166$
.
Appendix A. Evaluation of the resolution for the LES computations of the helical vortices
In this appendix, the resolution is assessed for the smallest core radius and helical pitch cases, for all Reynolds numbers.
In order to determine the right resolution for each Reynolds number, the energy spectra are evaluated at the end of computations (
![]() $t^{\star }=30$
) with discretizations featuring various numbers of grid points (namely
$t^{\star }=30$
) with discretizations featuring various numbers of grid points (namely
![]() $192^{3}$
,
$192^{3}$
,
![]() $288^{3}$
,
$288^{3}$
,
![]() $384^{3}$
for
$384^{3}$
for
![]() $Re_{\unicode[STIX]{x1D6E4}}=7000$
and 21 000, and
$Re_{\unicode[STIX]{x1D6E4}}=7000$
and 21 000, and
![]() $288^{3}$
,
$288^{3}$
,
![]() $384^{3}$
,
$384^{3}$
,
![]() $480^{3}$
for
$480^{3}$
for
![]() $Re_{\unicode[STIX]{x1D6E4}}=70\,000$
). The energy spectra are plotted in figure 22, and it is seen that there is an almost perfect collapse of the large-scale energy for the
$Re_{\unicode[STIX]{x1D6E4}}=70\,000$
). The energy spectra are plotted in figure 22, and it is seen that there is an almost perfect collapse of the large-scale energy for the
![]() $288^{3}$
and
$288^{3}$
and
![]() $384^{3}$
cases regarding the
$384^{3}$
cases regarding the
![]() $Re_{\unicode[STIX]{x1D6E4}}=7000$
and 21 000 computations. For the
$Re_{\unicode[STIX]{x1D6E4}}=7000$
and 21 000 computations. For the
![]() $Re_{\unicode[STIX]{x1D6E4}}=70\,000$
computations, the collapse is observed for all grids. This confirms the adequacy of the present approach in capturing accurately the large-scale content of the flow for a range of discretizations. The resolutions chosen for the computations presented in this paper are
$Re_{\unicode[STIX]{x1D6E4}}=70\,000$
computations, the collapse is observed for all grids. This confirms the adequacy of the present approach in capturing accurately the large-scale content of the flow for a range of discretizations. The resolutions chosen for the computations presented in this paper are
![]() $288^{3}$
for Reynolds number
$288^{3}$
for Reynolds number
![]() $Re_{\unicode[STIX]{x1D6E4}}=7000$
,
$Re_{\unicode[STIX]{x1D6E4}}=7000$
,
![]() $384^{3}$
for
$384^{3}$
for
![]() $Re_{\unicode[STIX]{x1D6E4}}=21\,000$
and
$Re_{\unicode[STIX]{x1D6E4}}=21\,000$
and
![]() $480^{3}$
for
$480^{3}$
for
![]() $Re_{\unicode[STIX]{x1D6E4}}=70\,000$
.
$Re_{\unicode[STIX]{x1D6E4}}=70\,000$
.
The resolution is further assessed by computing the evolution of the ratio of the grid size to the Kolmogorov scale, as well as the ratio of subgrid dissipation to total dissipation, which are plotted in figure 23. The isotropic definition of the Kolmogorov length scale is considered:
where
![]() $\unicode[STIX]{x1D700}=\unicode[STIX]{x1D700}_{SGS}+\unicode[STIX]{x1D700}_{vis}$
is the total dissipation,
$\unicode[STIX]{x1D700}=\unicode[STIX]{x1D700}_{SGS}+\unicode[STIX]{x1D700}_{vis}$
is the total dissipation,
![]() $\unicode[STIX]{x1D700}_{vis}=\langle \unicode[STIX]{x1D708}\overline{S}_{ij}\overline{S}_{ij}\rangle$
is the volume-averaged, resolved viscous dissipation and
$\unicode[STIX]{x1D700}_{vis}=\langle \unicode[STIX]{x1D708}\overline{S}_{ij}\overline{S}_{ij}\rangle$
is the volume-averaged, resolved viscous dissipation and
![]() $\unicode[STIX]{x1D700}_{SGS}=\langle \unicode[STIX]{x1D708}_{t}\overline{S}_{ij}\overline{S}_{ij}\rangle$
is the modelled, subgrid one. In this work, we intend to perform LES computations that capture most of the inertial range and confine the unresolved scales to the dissipative range, to ensure that the resolution is sufficient to yield a meaningful physical analysis. In order to assess the quality of resolution, the grid size to Taylor microscale ratio is plotted in figure 23. The isotropic definition of the Taylor microscale is considered:
$\unicode[STIX]{x1D700}_{SGS}=\langle \unicode[STIX]{x1D708}_{t}\overline{S}_{ij}\overline{S}_{ij}\rangle$
is the modelled, subgrid one. In this work, we intend to perform LES computations that capture most of the inertial range and confine the unresolved scales to the dissipative range, to ensure that the resolution is sufficient to yield a meaningful physical analysis. In order to assess the quality of resolution, the grid size to Taylor microscale ratio is plotted in figure 23. The isotropic definition of the Taylor microscale is considered:
where
![]() $rms$
is the root mean square.
$rms$
is the root mean square.
While this definition does not account for the anisotropy of the flow, it still provides a valuable insight into the quality of the resolution for the scales located in the inertial range. The plot confirms that the resolution is indeed sufficient to capture most of the inertial range, as there are at least five grid points per Taylor microscale for every case.

Figure 23. Evolution of grid spacing to Kolmogorov length scale ratio, subgrid dissipation to total dissipation ratio and grid spacing to Taylor microscale ratio for various Reynolds numbers. Case
![]() $r_{c}/h=0.166$
and
$r_{c}/h=0.166$
and
![]() $h/R=0.36$
.
$h/R=0.36$
.
Appendix B. Assessment of initial perturbations of the flow field
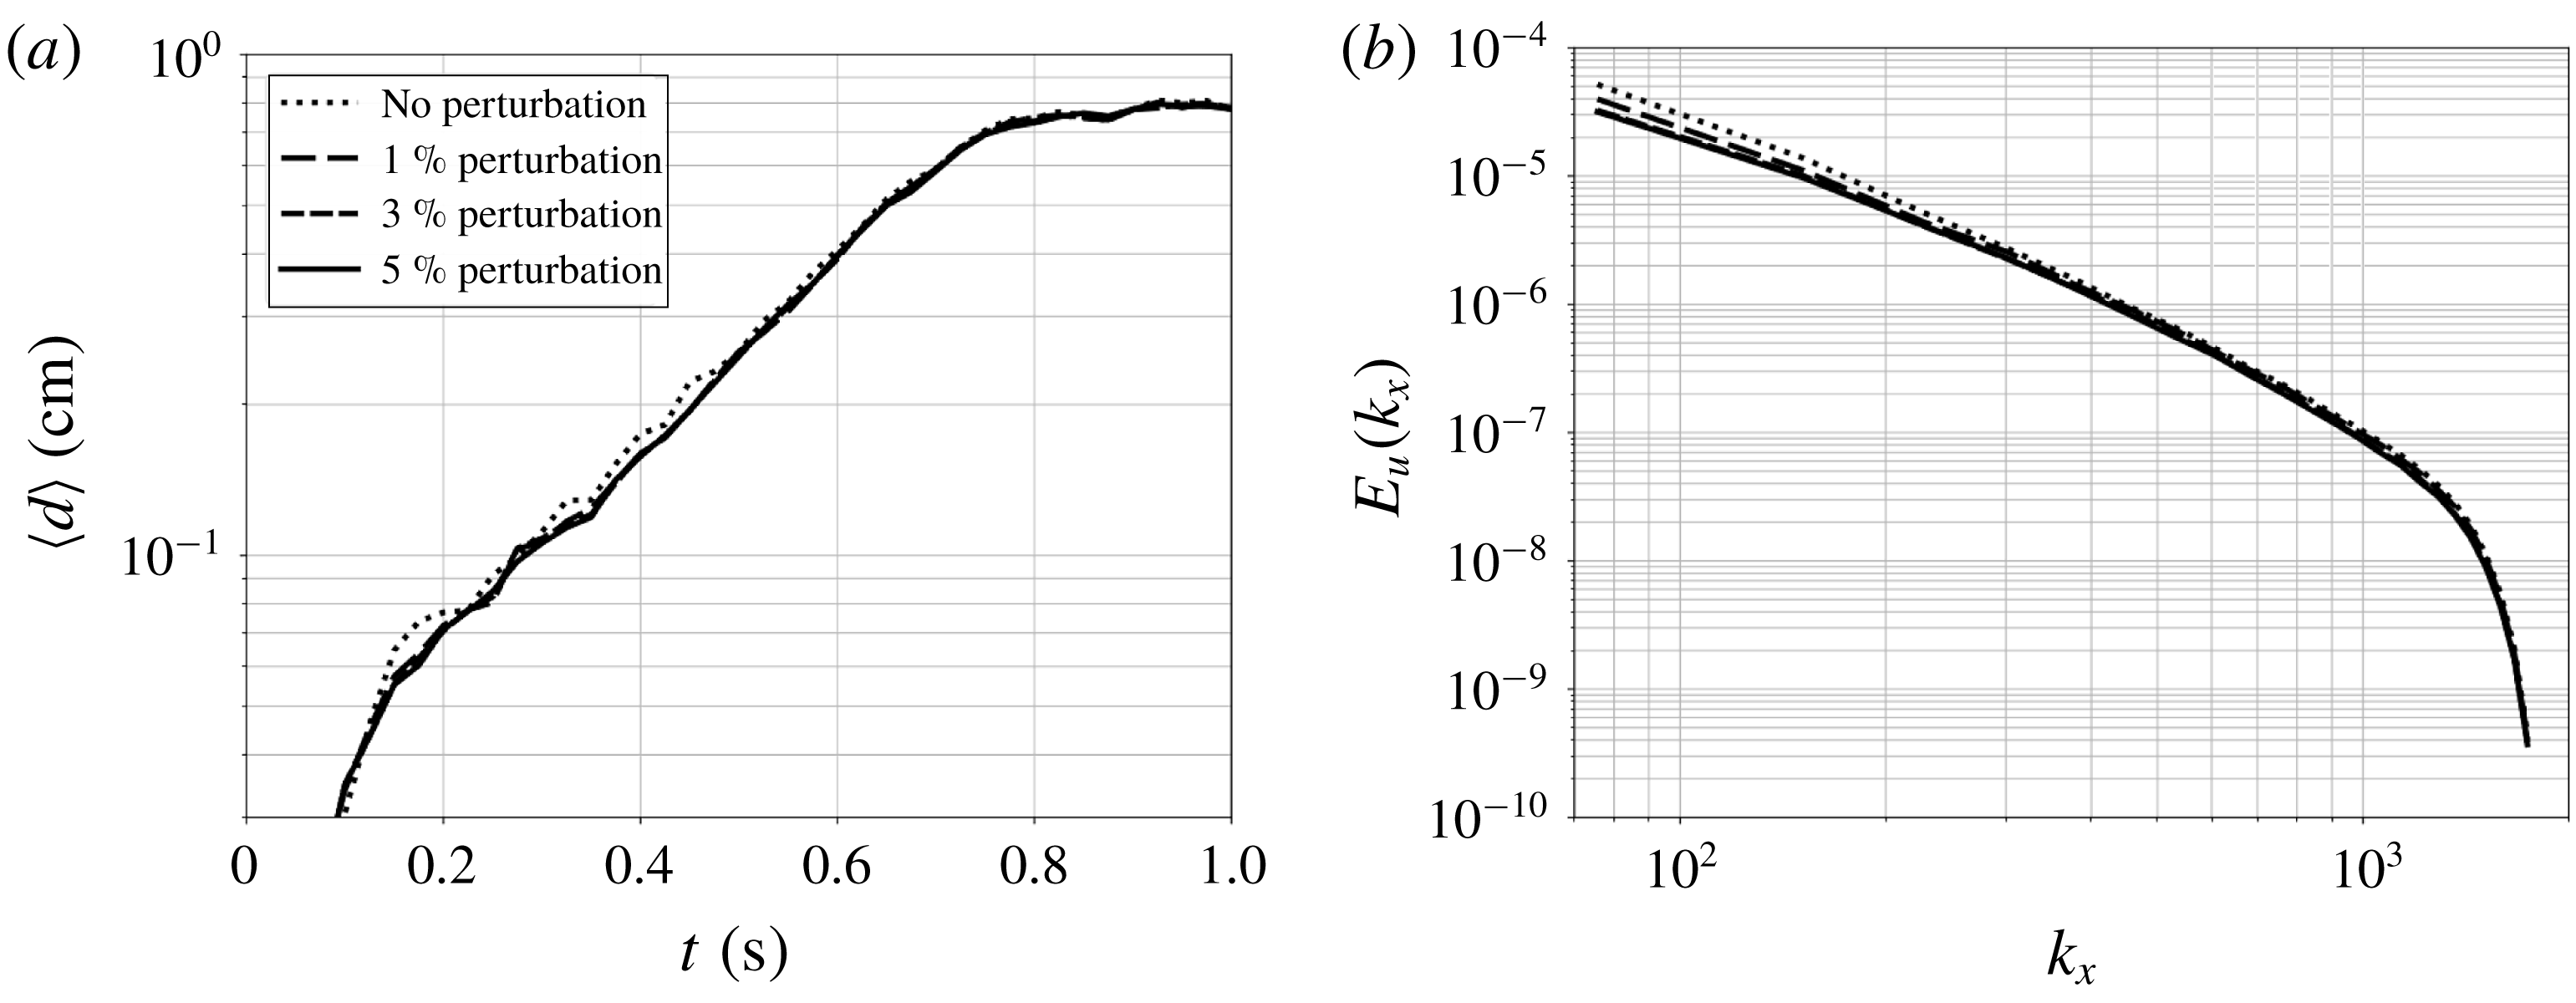
Figure 24. Sensitivity of growth rates (a) and energy spectra at
![]() $t=5~\text{s}$
(b) to initial perturbations for the LES computations of the pair of helical vortices at
$t=5~\text{s}$
(b) to initial perturbations for the LES computations of the pair of helical vortices at
![]() $Re_{\unicode[STIX]{x1D6E4}}=7000$
,
$Re_{\unicode[STIX]{x1D6E4}}=7000$
,
![]() $r_{c}/h=0.166$
and
$r_{c}/h=0.166$
and
![]() $h/R=0.36$
.
$h/R=0.36$
.
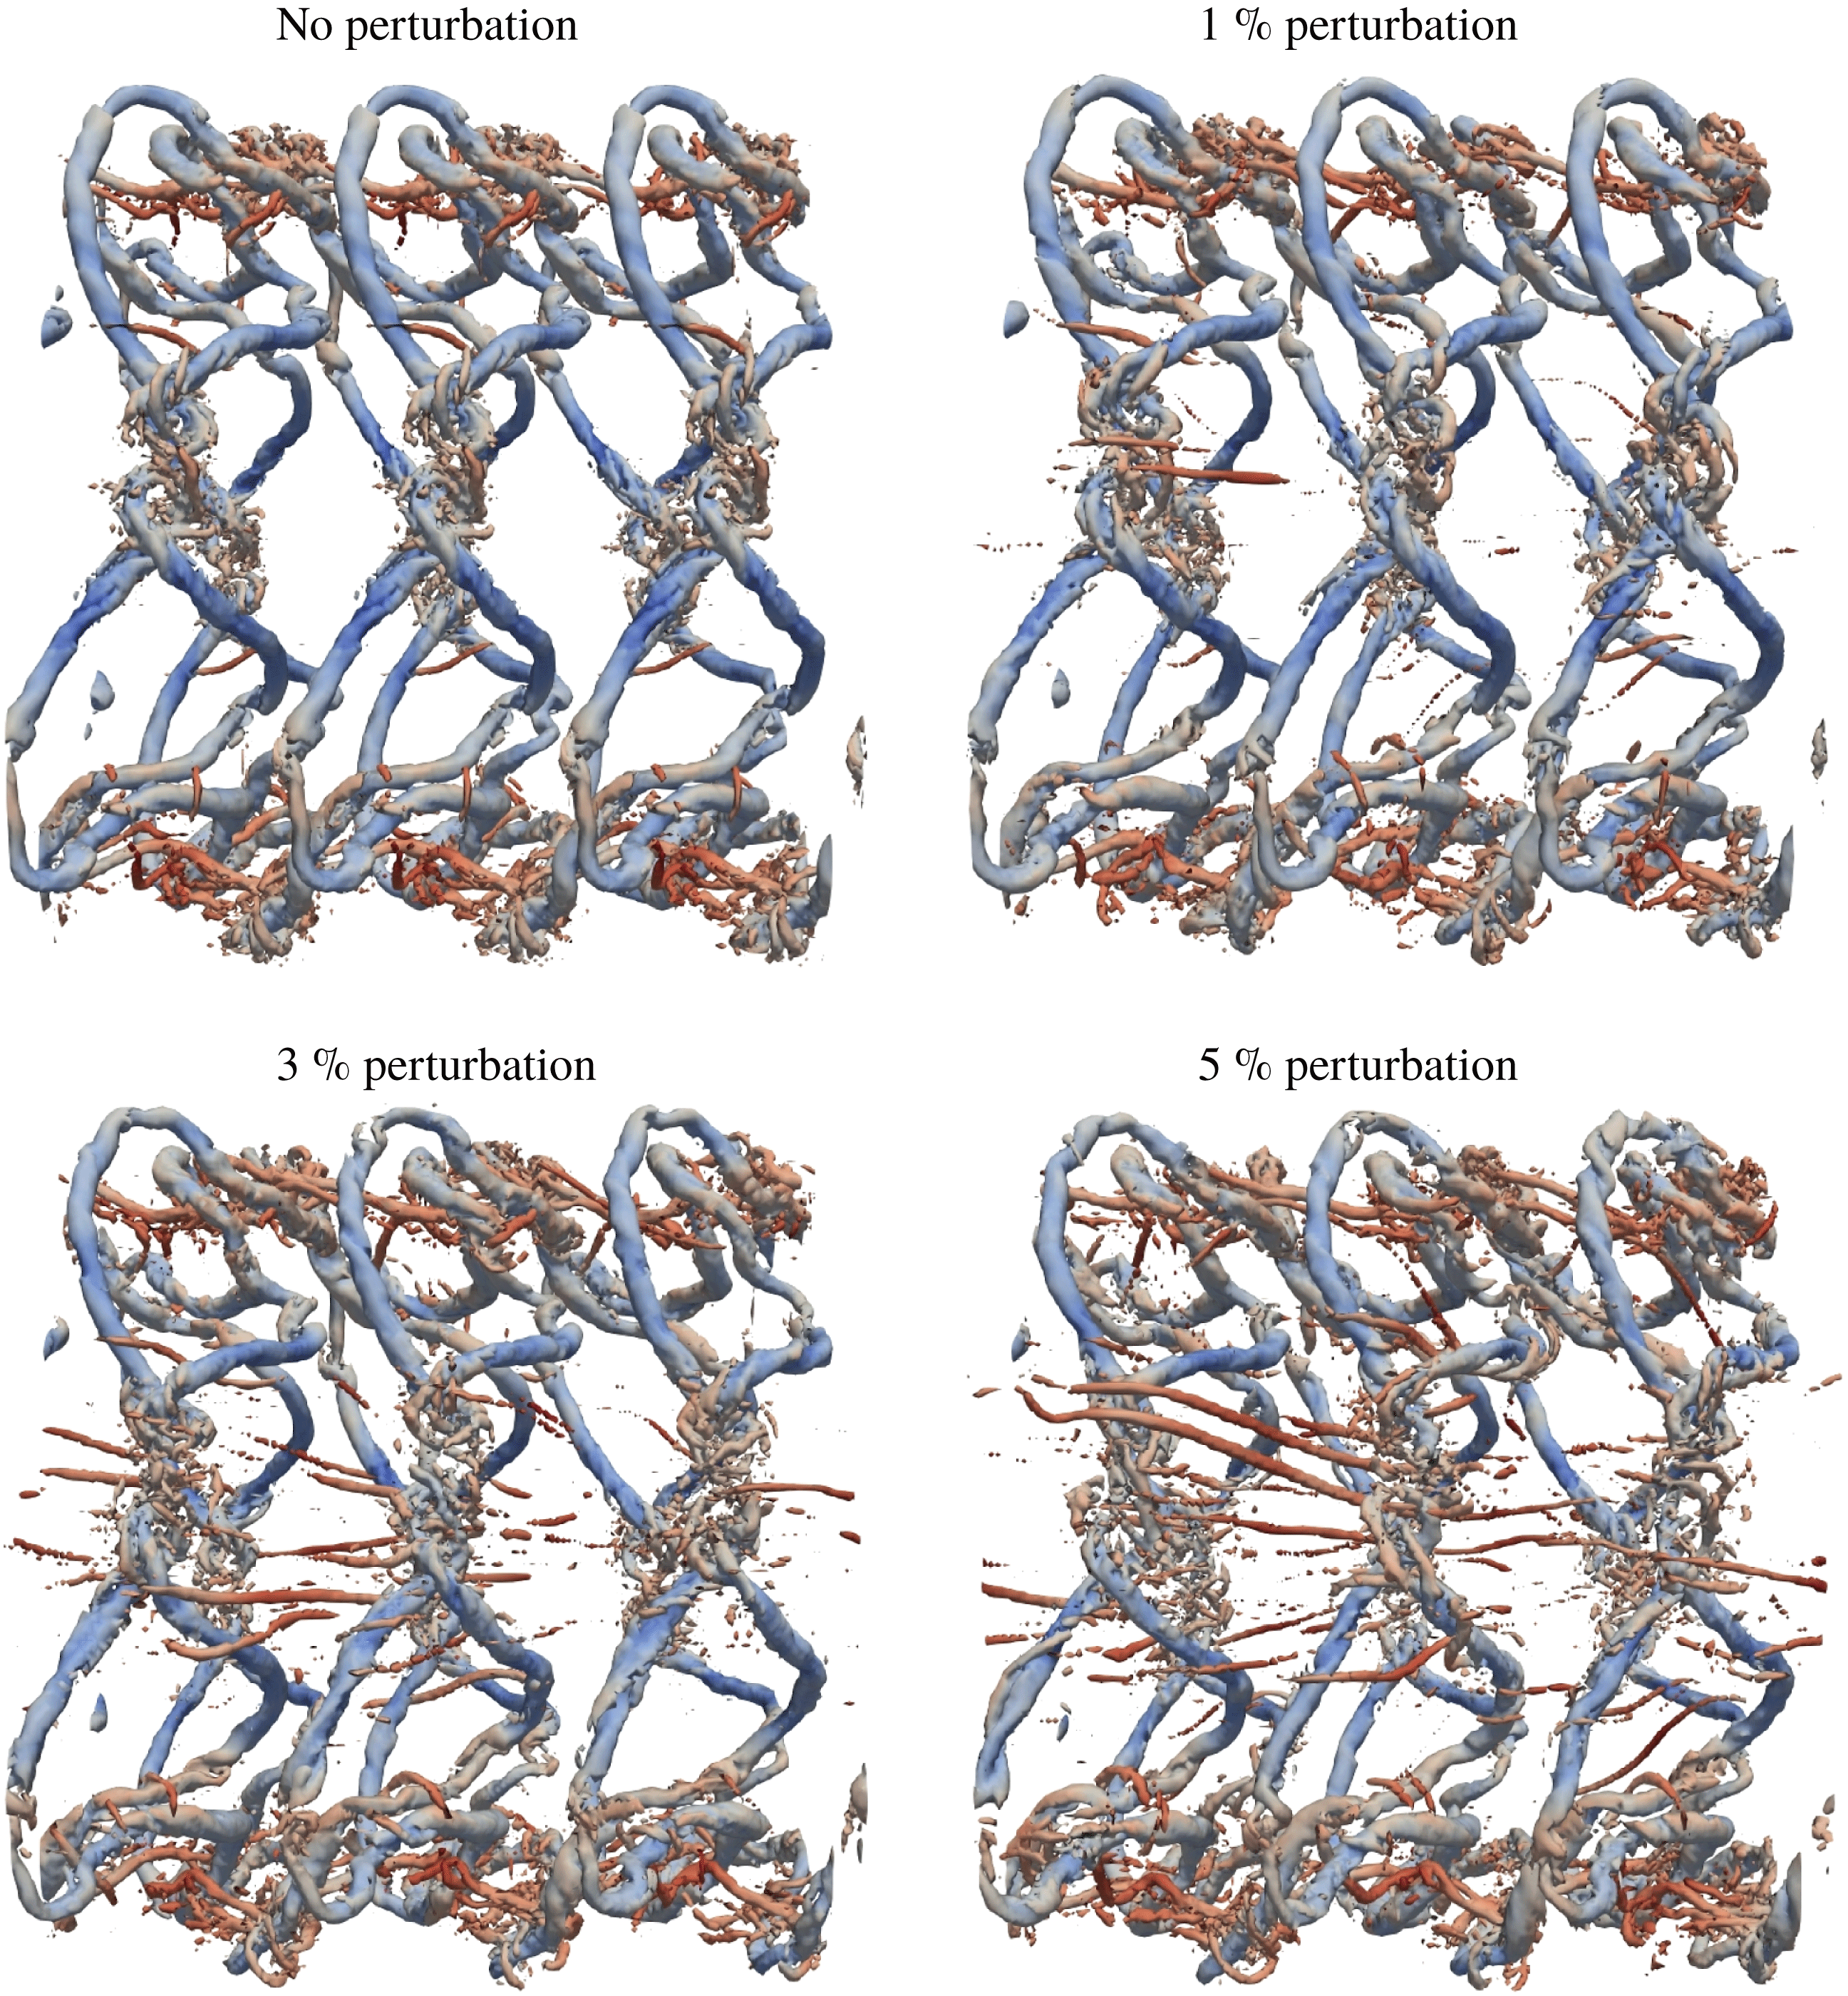
Figure 25. Sensitivity of flow patterns at
![]() $t^{\star }=15$
to initial perturbations for the LES computations of the pair of helical vortices at
$t^{\star }=15$
to initial perturbations for the LES computations of the pair of helical vortices at
![]() $Re_{\unicode[STIX]{x1D6E4}}=7000$
,
$Re_{\unicode[STIX]{x1D6E4}}=7000$
,
![]() $r_{c}/h=0.083$
and
$r_{c}/h=0.083$
and
![]() $h/R=0.36$
.
$h/R=0.36$
.
In this appendix, we assess the influence of perturbations added to the initial velocity. According to Okulov (Reference Okulov2004), the system of infinite double helical vortices for the range of helical pitches considered in the present study is highly unstable, and any shape of perturbation will virtually yield the destabilization of the system. In the present study, the flow field is initially perturbed by low amplitude acoustic waves that are released due to the resolution of the compressible Navier–Stokes equations at low Mach number. This initial perturbation is sufficient to trigger the flow instability, and this section aims at quantifying the response of the flow to added velocity perturbations with a given amplitude. The initial velocity field is perturbed as follows:
where
![]() $\unicode[STIX]{x1D716}$
is the amplitude of the perturbation and
$\unicode[STIX]{x1D716}$
is the amplitude of the perturbation and
![]() $A$
a random number array which values are between
$A$
a random number array which values are between
![]() $-1$
and 1. Figure 24 shows the growth rates and energy spectra at the final time of the computations for one case of the study. It is found that both quantities are mildly impacted by the amount of perturbation considered. To further assess the influence of the initial perturbation on the flow field, the
$-1$
and 1. Figure 24 shows the growth rates and energy spectra at the final time of the computations for one case of the study. It is found that both quantities are mildly impacted by the amount of perturbation considered. To further assess the influence of the initial perturbation on the flow field, the
![]() $Q$
-criterion iso-surfaces are plotted at
$Q$
-criterion iso-surfaces are plotted at
![]() $t^{\star }=15$
(figure 25) for the various amplitudes considered for the perturbation. It is seen that the added perturbations do not modify the large-scale flow features, however, they do impact slightly the development of small scales in the flow, as seen from the elongated streaks observed in the centre of the domain for the highest amplitude of perturbation. Given the relatively weak impact of the added perturbations to the flow field, all computations considered for the present study were performed using only the initial acoustic disturbance as the trigger for instability. In fact, as pointed out by Okulov & Sørensen (Reference Okulov and Sørensen2007), for sufficiently small values of the helical pitch (all of which considered in the present study satisfy this condition), the stability problem of multiple helical vortices does not depend strongly on the type of perturbation added to the system.
$t^{\star }=15$
(figure 25) for the various amplitudes considered for the perturbation. It is seen that the added perturbations do not modify the large-scale flow features, however, they do impact slightly the development of small scales in the flow, as seen from the elongated streaks observed in the centre of the domain for the highest amplitude of perturbation. Given the relatively weak impact of the added perturbations to the flow field, all computations considered for the present study were performed using only the initial acoustic disturbance as the trigger for instability. In fact, as pointed out by Okulov & Sørensen (Reference Okulov and Sørensen2007), for sufficiently small values of the helical pitch (all of which considered in the present study satisfy this condition), the stability problem of multiple helical vortices does not depend strongly on the type of perturbation added to the system.
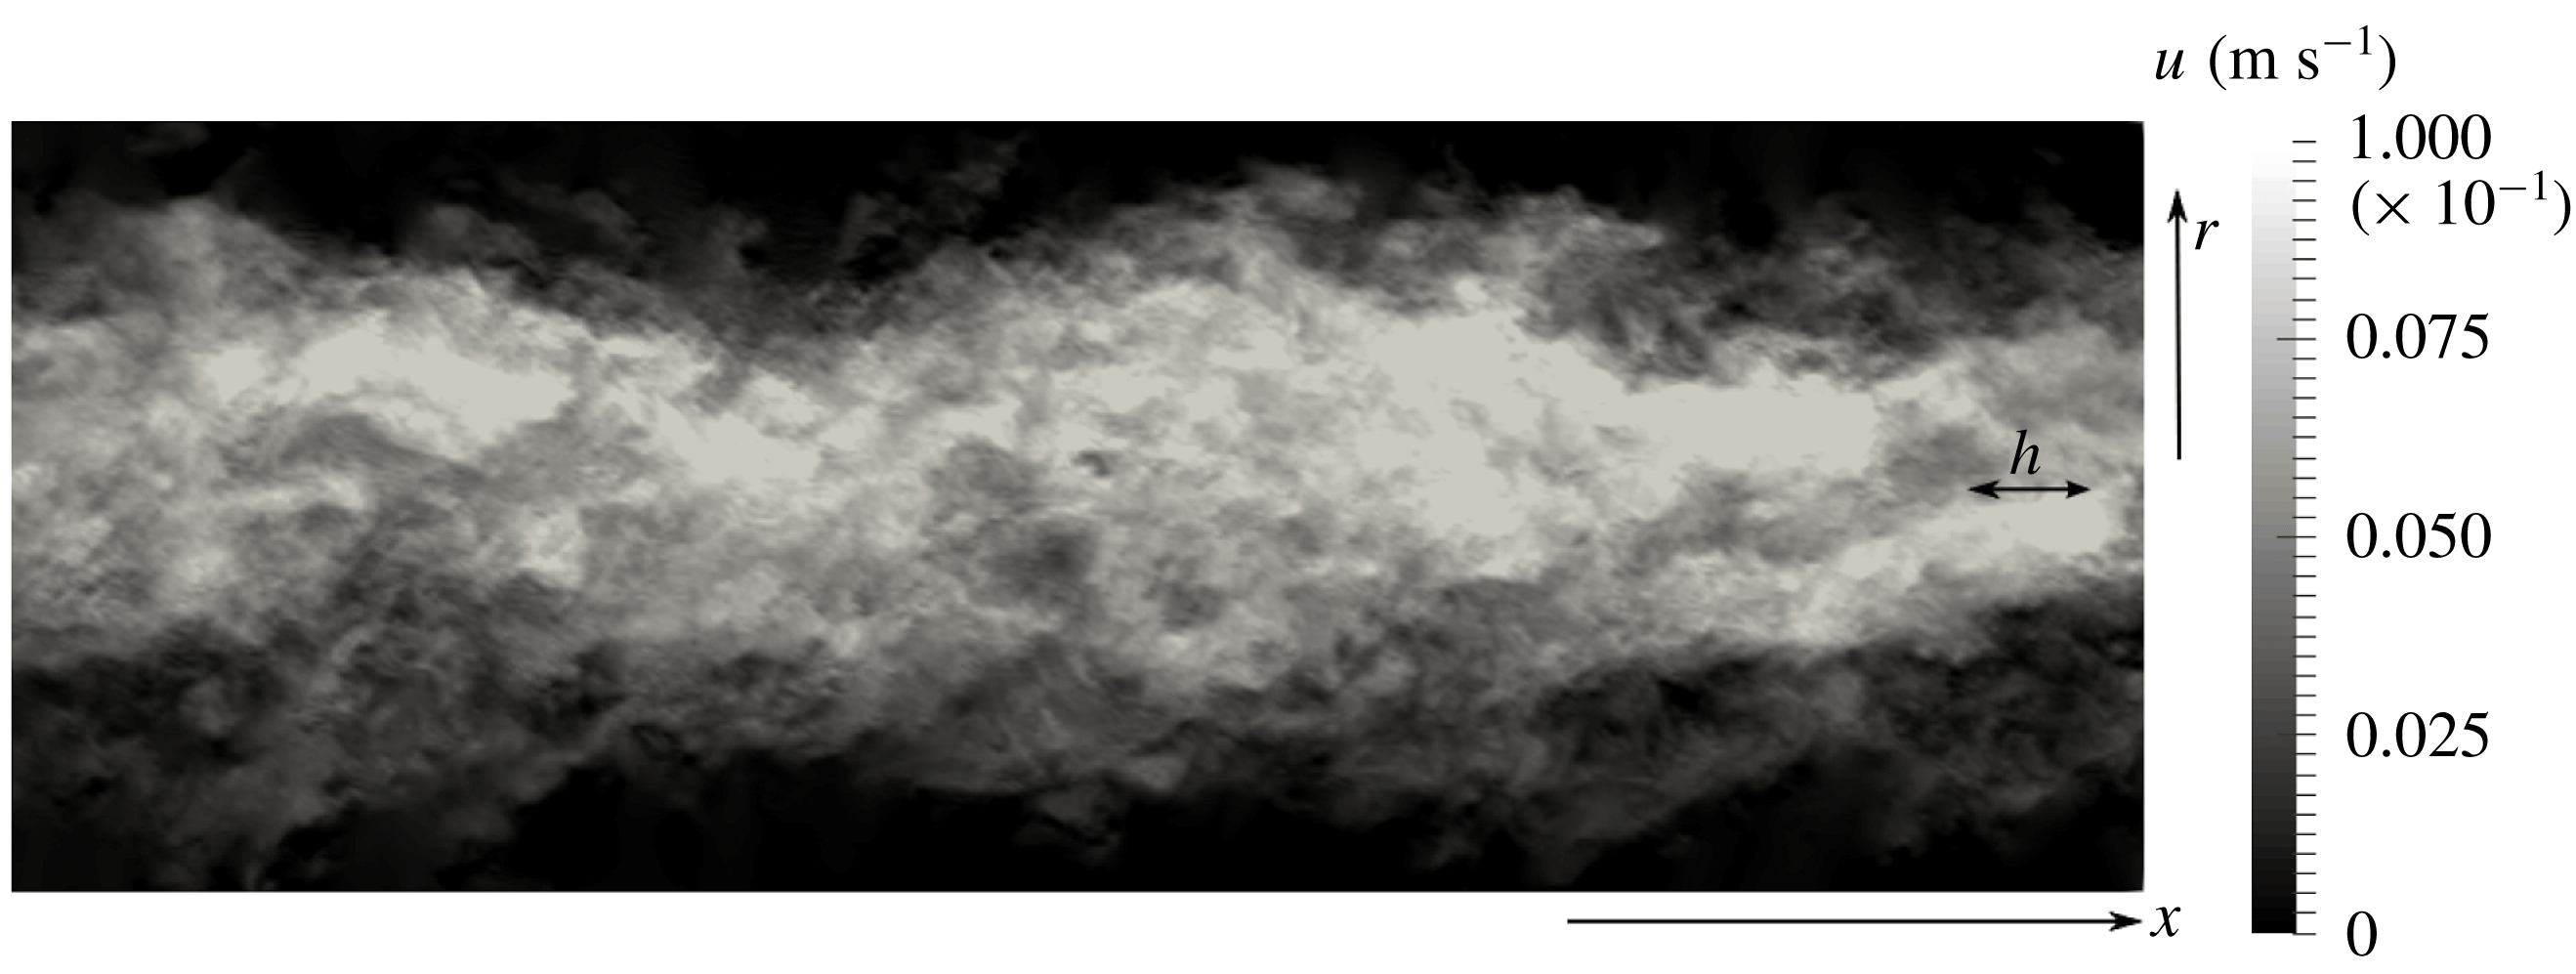
Figure 26. Iso-contours of the axial velocity component in a
![]() $r{-}x$
plane at
$r{-}x$
plane at
![]() $t^{\star }=40$
. Computation with a large box
$t^{\star }=40$
. Computation with a large box
![]() $L_{X}=24h$
in the axial direction, with parameters
$L_{X}=24h$
in the axial direction, with parameters
![]() $h/R=0.61$
,
$h/R=0.61$
,
![]() $Re_{\unicode[STIX]{x1D6E4}}=21\,000$
and
$Re_{\unicode[STIX]{x1D6E4}}=21\,000$
and
![]() $r_{c}/h=0.166$
.
$r_{c}/h=0.166$
.

Figure 27. Energy spectra computed in the axial direction, at the radial location
![]() $r=0.66\,R$
at different times during wake evolution, from computations with an extended computational box
$r=0.66\,R$
at different times during wake evolution, from computations with an extended computational box
![]() $L_{X}=24h$
in the axial direction, for
$L_{X}=24h$
in the axial direction, for
![]() $h/R=0.61$
,
$h/R=0.61$
,
![]() $Re_{\unicode[STIX]{x1D6E4}}=21\,000$
and
$Re_{\unicode[STIX]{x1D6E4}}=21\,000$
and
![]() $r_{c}/h=0.166$
.
$r_{c}/h=0.166$
.
Appendix C. Assessment of large-scale instabilities in the wake
This appendix is dedicated to the identification of the large-scale motion that has been observed in previous experimental works for rotor–wake configurations by Okulov et al. (Reference Okulov, Naumov, Mikkelsen, Kabardin and Sørensen2014), in order to give an additional physical justification to the present methodology. In Okulov et al. (Reference Okulov, Naumov, Mikkelsen, Kabardin and Sørensen2014), temporal energy spectra computed in the vicinity of the helical vortices (i.e.
![]() $r=0.66R$
) have revealed that, as the dominant frequencies in the near wake are related to the rotor characteristics (i.e. the helical pitch), the far-wake frequencies are independent of the rotor features and show a low frequency content associated with a constant Strouhal number
$r=0.66R$
) have revealed that, as the dominant frequencies in the near wake are related to the rotor characteristics (i.e. the helical pitch), the far-wake frequencies are independent of the rotor features and show a low frequency content associated with a constant Strouhal number
![]() $St=fD/U_{\infty }\approx 0.23$
, where
$St=fD/U_{\infty }\approx 0.23$
, where
![]() $f$
is the frequency,
$f$
is the frequency,
![]() $D$
the diameter of the rotor and
$D$
the diameter of the rotor and
![]() $U_{\infty }$
the incident flow speed. In the present work, we try to show the onset of these large-scale events from our temporally developing wake, in order to find an additional correlation between the present methodology and more applied rotor–wake configurations. To be able to detect this large-scale content, a computation with
$U_{\infty }$
the incident flow speed. In the present work, we try to show the onset of these large-scale events from our temporally developing wake, in order to find an additional correlation between the present methodology and more applied rotor–wake configurations. To be able to detect this large-scale content, a computation with
![]() $h/R=0.61$
,
$h/R=0.61$
,
![]() $Re_{\unicode[STIX]{x1D6E4}}=21\,000$
and
$Re_{\unicode[STIX]{x1D6E4}}=21\,000$
and
![]() $r_{c}/h=0.166$
is carried out with
$r_{c}/h=0.166$
is carried out with
![]() $M=12$
turns of the initial helical vortex, using an extended computational box size in the axial direction
$M=12$
turns of the initial helical vortex, using an extended computational box size in the axial direction
![]() $L_{X}=24h$
, which enables larger scales to be represented compared to the box with
$L_{X}=24h$
, which enables larger scales to be represented compared to the box with
![]() $L_{X}=6h$
. This value of helical pitch is close to one of the rotor configurations in the work of Okulov et al. (Reference Okulov, Naumov, Mikkelsen, Kabardin and Sørensen2014). They considered a three-bladed rotor, and the corresponding spacing between two neighbouring helical vortices for their case
$L_{X}=6h$
. This value of helical pitch is close to one of the rotor configurations in the work of Okulov et al. (Reference Okulov, Naumov, Mikkelsen, Kabardin and Sørensen2014). They considered a three-bladed rotor, and the corresponding spacing between two neighbouring helical vortices for their case
![]() $\unicode[STIX]{x1D706}=3$
is
$\unicode[STIX]{x1D706}=3$
is
![]() $h/R=0.7$
, where
$h/R=0.7$
, where
![]() $\unicode[STIX]{x1D706}$
is the rotor tip speed ratio. The axial velocity component iso-contours are first plotted in a
$\unicode[STIX]{x1D706}$
is the rotor tip speed ratio. The axial velocity component iso-contours are first plotted in a
![]() $r{-}x$
plane at
$r{-}x$
plane at
![]() $t^{\star }=40$
, shown in figure 26. Large-scale motions with wavelengths higher than
$t^{\star }=40$
, shown in figure 26. Large-scale motions with wavelengths higher than
![]() $h$
are clearly identified from this visualization which displays interesting similarities with figure 13 of Okulov et al. (Reference Okulov, Naumov, Mikkelsen, Kabardin and Sørensen2014) which shows particle image velocimetry visualizations of the flow past a three-bladed rotor in the far wake. A more precise evaluation of the large-scale content in the wake is obtained by computing the energy spectra in the axial direction at radius
$h$
are clearly identified from this visualization which displays interesting similarities with figure 13 of Okulov et al. (Reference Okulov, Naumov, Mikkelsen, Kabardin and Sørensen2014) which shows particle image velocimetry visualizations of the flow past a three-bladed rotor in the far wake. A more precise evaluation of the large-scale content in the wake is obtained by computing the energy spectra in the axial direction at radius
![]() $r=0.66R$
, which is equivalent to the frequency energy spectra from Okulov et al. (Reference Okulov, Naumov, Mikkelsen, Kabardin and Sørensen2014). The energy spectra in the present simulation are computed in multiple locations
$r=0.66R$
, which is equivalent to the frequency energy spectra from Okulov et al. (Reference Okulov, Naumov, Mikkelsen, Kabardin and Sørensen2014). The energy spectra in the present simulation are computed in multiple locations
![]() $r=0.66R$
and then averaged. It is seen from figure 27 that for early flow evolution, the energy spectra are highly dependent of the initial condition for which the dominant wavelength corresponds to the helical pitch
$r=0.66R$
and then averaged. It is seen from figure 27 that for early flow evolution, the energy spectra are highly dependent of the initial condition for which the dominant wavelength corresponds to the helical pitch
![]() $h$
. Then, harmonics with lower wavenumbers start to appear in the flow, around
$h$
. Then, harmonics with lower wavenumbers start to appear in the flow, around
![]() $t^{\star }=15$
, due to the leap frogging of helical vortices. After the turbulent breakdown, the energy spectra become more broadband towards both higher and lower wavenumbers, with a dominant low wavenumber energy content that is not present for the initial condition, a seen in the plots at
$t^{\star }=15$
, due to the leap frogging of helical vortices. After the turbulent breakdown, the energy spectra become more broadband towards both higher and lower wavenumbers, with a dominant low wavenumber energy content that is not present for the initial condition, a seen in the plots at
![]() $t^{\star }=21$
and
$t^{\star }=21$
and
![]() $t^{\star }=30$
. Then low wavenumber energy becomes more important, as seen from the plots at times
$t^{\star }=30$
. Then low wavenumber energy becomes more important, as seen from the plots at times
![]() $t^{\star }=36$
and
$t^{\star }=36$
and
![]() $t^{\star }=40$
. This correlates to the findings of Okulov et al. (Reference Okulov, Naumov, Mikkelsen, Kabardin and Sørensen2014), who observed the onset of low frequency events in the fully developed wake. By relating the wavenumber to the frequency with the relation
$t^{\star }=40$
. This correlates to the findings of Okulov et al. (Reference Okulov, Naumov, Mikkelsen, Kabardin and Sørensen2014), who observed the onset of low frequency events in the fully developed wake. By relating the wavenumber to the frequency with the relation
![]() $k_{x}/2\unicode[STIX]{x03C0}=f/U_{\infty }$
, it is possible to determine a Strouhal number for the spatial energy spectrum, defined as
$k_{x}/2\unicode[STIX]{x03C0}=f/U_{\infty }$
, it is possible to determine a Strouhal number for the spatial energy spectrum, defined as
![]() $St=k_{max}D/2\unicode[STIX]{x03C0}$
, where
$St=k_{max}D/2\unicode[STIX]{x03C0}$
, where
![]() $k_{max}$
is the wavenumber corresponding to the energy maximum. At
$k_{max}$
is the wavenumber corresponding to the energy maximum. At
![]() $t^{\star }=40$
, the Strouhal corresponding to the most energetic wavenumber is
$t^{\star }=40$
, the Strouhal corresponding to the most energetic wavenumber is
![]() $St=0.26$
, which is close to the value of 0.23 found by Okulov et al. (Reference Okulov, Naumov, Mikkelsen, Kabardin and Sørensen2014). It would however be possible to extend further the size of the box to enable the onset of larger-scale features and future studies could then assess the Strouhal number for longer boxes, various pitches and Reynolds numbers, and also the effect of blade root vortices could be included.
$St=0.26$
, which is close to the value of 0.23 found by Okulov et al. (Reference Okulov, Naumov, Mikkelsen, Kabardin and Sørensen2014). It would however be possible to extend further the size of the box to enable the onset of larger-scale features and future studies could then assess the Strouhal number for longer boxes, various pitches and Reynolds numbers, and also the effect of blade root vortices could be included.


