


1. Introduction
Gas bubbles in a liquid display incredibly rich physics, a remarkable example being their resonant response to oscillating fields (Leighton Reference Leighton2012). Rather than isolated, they tend to appear in complex aggregates like clusters, filaments and clouds, whose structures are dictated by the pressure field in the surrounding fluid (Mettin Reference Mettin2005; Lauterborn & Kurz Reference Lauterborn and Kurz2010). Technological applications span from acoustical oceanography to the materials, food and pharmaceutical industry, to medicine (Leighton Reference Leighton2004). Here, the monitoring and control of bubble ensembles is a crucial point, entailing a proper understanding of the bubble–bubble interaction mechanism.
An extensive amount of literature on the interaction between two or many oscillating bubbles under the effect of an external perturbation has amassed since the pioneering studies by C.A. and V.F.K. Bjerknes (Bjerknes Reference Bjerknes1906, Reference Bjerknes1909, Reference Bjerknes1915). However, a deep understanding of the subject is hampered by the complexity of the non-linear dynamics of these collective systems. Moreover, theoretical and experimental works have generally been conducted separately. From a theoretical standpoint, the literature has focused mainly on two nearby bubbles undergoing radial oscillations excited by a spatially homogeneous field (see e.g. Ida Reference Ida2002; Pelekasis et al. Reference Pelekasis, Gaki, Doinikov and Tsamopoulos2004; Zeravcic, Lohse & Van Saarloos Reference Zeravcic, Lohse and Van Saarloos2011; Doinikov & Bouakaz Reference Doinikov and Bouakaz2015; Doinikov et al. Reference Doinikov, Bienaimé, Gonzalez-Avila, Ohl and Marmottant2019; Pandey Reference Pandey2019). Most models have addressed the case where the distance between the centres of the bubbles significantly exceeds the sum of their radii. More complex is the case of close inter-bubble distances, where the angular dependence in the description of the fluid velocity field cannot be neglected in the calculations. In the works by Maksimov (Maksimov & Yusupov Reference Maksimov and Yusupov2016; Maksimov & Polovinka Reference Maksimov and Polovinka2018), analytic expressions for this regime have been obtained by symmetry approaches (Maksimov Reference Maksimov2018) involving the use of specific (bi-spherical) coordinate systems. In typical experiments, volume modes of micrometre-sized bubbles are excited by high-intensity ultrasound pulses, mimicking the set-ups used in applications. The recorded backscatter waves, extremely sensitive to the interaction forces among the bubbles, provide a ‘fingerprint’ of the interacting system (see, for instance, Foldy Reference Foldy1945; Kapodistrias & Dahl Reference Kapodistrias and Dahl2000; Ma & Zhao Reference Ma and Zhao2021). Excitation frequencies lie in the range of  $10^2$ kHz; detected frequencies decrease with the number of bubbles. The close-distance regime has been addressed by several numerical and experimental studies (Bremond et al. Reference Bremond, Arora, Ohl and Lohse2005, Reference Bremond, Arora, Ohl and Lohse2006; Deane & Stokes Reference Deane and Stokes2008; Manasseh, Riboux & Risso Reference Manasseh, Riboux and Risso2008; Fong et al. Reference Fong, Adhikari, Klaseboer and Khoo2009; Chew et al. Reference Chew, Klaseboer, Ohl and Khoo2011; Wiedemair et al. Reference Wiedemair, Tukovic, Jasak, Poulikakos and Kurtcuoglu2014), including the case of coalescence (Deane & Stokes Reference Deane and Stokes2008; Manasseh et al. Reference Manasseh, Riboux and Risso2008) or the proximity of solid boundaries (Bremond et al. Reference Bremond, Arora, Ohl and Lohse2005, Reference Bremond, Arora, Ohl and Lohse2006; Chew et al. Reference Chew, Klaseboer, Ohl and Khoo2011). Experiments on larger (millimetric) bubbles have been performed as well (Hsiao, Devaud & Bacri Reference Hsiao, Devaud and Bacri2001; Fong et al. Reference Fong, Adhikari, Klaseboer and Khoo2009; Chew et al. Reference Chew, Klaseboer, Ohl and Khoo2011; Combriat et al. Reference Combriat, Rouby-Poizat, Doinikov, Stephan and Marmottant2020). However, well-controlled experiments are difficult to devise. A major pitfall is the lack of control on bubble positions, and hence on inter-bubble distances, as well as geometry of larger ensembles; this issue is generally addressed by tethering the bubbles to solid supports (Hsiao et al. Reference Hsiao, Devaud and Bacri2001; Chew et al. Reference Chew, Klaseboer, Ohl and Khoo2011; Combriat et al. Reference Combriat, Rouby-Poizat, Doinikov, Stephan and Marmottant2020; Boughzala et al. Reference Boughzala, Stephan, Bossy, Dollet and Marmottant2021) or by optical trapping (Garbin et al. Reference Garbin, Dollet, Overvelde, De Jong, Lohse, Versluis, Cojoc, Ferrari and Di Fabrizio2007). In the case of micrometric bubbles, coalescence and/or dissolution are common phenomena, which can be limited, for instance, by stabilising adsorbed shells on the bubbles (Van der Meer et al. Reference Van der Meer, Dollet, Voormolen, Chin, Bouakaz, de Jong, Versluis and Lohse2007). Finally, the pressure fields generally applied for the acoustic/optical detection often lead to shape deformations related to instability phenomena (Versluis et al. Reference Versluis, Goertz, Palanchon, Heitman, van der Meer, Dollet, de Jong and Lohse2010; Guédra et al. Reference Guédra, Inserra, Mauger and Gilles2016).
A thorough understanding of bubble–bubble interactions calls for simple and controlled systems, as well as precise and tunable techniques, thereby enabling direct comparison with theory. In this article we propose a new method for measuring the interactions between two nearby oscillating bubbles of millimetric dimension. Volume modes of nanometric amplitude are excited by an underwater piezoceramic and detected interferometrically. The interaction strength can be evaluated from the variations in the oscillation spectra (especially resonance frequencies) as a function of the inter-bubble distance, enabling comparison with the existing theory (Maksimov & Yusupov Reference Maksimov and Yusupov2016). Our technique allows the detection of bubble oscillations with unprecedented (sub-nanometric) sensitivity, keeping full control of all the physico-chemical parameters of the system, from distances larger than the bubble radii to quasi-contact (see also supplementary material available at https://doi.org/10.1017/jfm.2022.333, § 5). Thanks to the high sensitivity of the interferometric technique, the exciting pressure field can be kept very low, which is an advantage for theoretical comparison.
2. Method
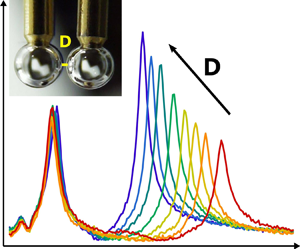
The proposed method is based on the extension of an interferometric technique developed in the framework of studies of single oscillating gas bubbles and drops (Corti, Bonomo & Raudino Reference Corti, Bonomo and Raudino2012; Corti, Pannuzzo & Raudino Reference Corti, Pannuzzo and Raudino2014, Reference Corti, Pannuzzo and Raudino2015; Cantu’, Raudino & Corti Reference Cantu’, Raudino and Corti2017; Raudino, Raciti & Corti Reference Raudino, Raciti and Corti2017; Corti et al. Reference Corti, Raudino, Cantu’, Theisen, Pleines and Zemb2018). While the detection principle remains unaltered, the main novelty is the independent detection of the two bubbles, set at finely regulated mutual distances, whose interactions are evaluated from the variations in the resonance features along the distance. Measurements rely on the property of air–water (or oil–water) interfaces to behave like the mirrors of a confocal Fabry–Perot interferometer, due to the difference in refractive indices between the inner and the outer media. As such, when a Gaussian laser beam is focused on the bubble, an interference pattern is formed in the backward direction, which depends on the optical path length inside the bubble, i.e. on its local radius (Corti et al. Reference Corti, Bonomo and Raudino2012) (see inset of figure 1). In fact, due to the closed geometry of the bubble, a discrete set of vibration modes are excited: in figure 1, the peaks on the left side refer to the shape (non-spherical) modes,  $l$, with typical resonances lying in the range of
  $10^2$ Hz for bubbles of approximately 1 mm in diameter; the higher-frequency mode, falling in the
  $10^3$ Hz range, corresponds to the volume or breathing (spherical,
  $l=0$) mode. While no significant differences arise between volume and shape modes for what concerns their detection, the latter are excited differently and give rise to more complex interacting behaviours. In this article we will focus on the coupling between spherical oscillating bubbles, to provide proof of principle, leaving the shape modes to a future article. Notice that the technique can also be applied to interacting oil drops and to adsorbant-covered (e.g. surfactants, proteins) bubbles/drops, as for the single-bubble case (Corti et al. Reference Corti, Raudino, Cantu’, Theisen, Pleines and Zemb2018; Brocca et al. Reference Brocca, Saponaro, Introini, Rondelli, Pannuzzo, Raciti, Corti and Raudino2019).

Figure 1. Vibrational spectrum of a single bubble (radius: 0.85 mm) in ultra-pure water, showing both shape and volume modes. The spectrum is obtained with a 0.01 V sweeping sine voltage applied to the piezoelectric transducer glued to the cell bottom (vertical oscillation amplitude of the order of 1 nm). The inset summarises the detection principle: a laser beam focused on the bubble undergoes reflections at the curved interfaces (points S1 and S2), which generate an interference pattern in the backward direction.
Air bubbles, of the order of 1 mm in diameter, are formed at the top of a stainless-steel hollow electrode protruding from the bottom of the measurement cell and are subsequently set against an upper, solid gold-plated electrode (see figure 2). The cell, made of polymethyl methacrylate, has a volume of approximately 1 mL and is filled with fresh milli-Q water at 20  $^{\circ }$C. The external pressure is
  $1\times 10^5$ Pa. The distance between the electrodes, and hence the bubbles, is regulated over a range of 5 mm via micrometer screws and a piezoelectric transducer for the shortest distances. Bubble radii are measured from the image formed by a high-resolution digital camera, by comparison with the precisely known upper electrodes diameter, with an accuracy of
  $10\,\mathrm {\mu }$m. Bubble distances
  $D$, as defined in figure 2, are measured with an accuracy of
  $5\,\mathrm {\mu }$m mostly dictated by the difficulty in the experimental determination of the contact position. Volume oscillations of both bubbles are excited by a waterproof piezoelectric transducer (Thorlabs TA0505D024W) set at the bottom of the cell (see figure 2), generating a frequency-swept pressure field in the range of the expected resonances. The driving force of acoustic excitation is related to the compressibility of the gas phase; any surface charge density present on the bubble will only affect its interfacial properties, without entering the excitation process. The amplitude of the applied field is rather uniform along the bubble–bubble distance range (supplementary material, § 2), and low enough to keep the oscillation amplitudes in the range of a few nanometres, well above the sensitivity of the instrument (0.1 nm) and well within the linear range of working conditions. The oscillation amplitudes of the two bubbles are recorded by two independent interferometers, based on a He-Ne laser source (Thorlabs HNL21L, 20 mW), coupled to a single-mode optical fibre (Thorlabs FC632-50B-FC) and split into two fibres delivering approximately 5 mW laser power each. The interferometric patterns are deflected toward two photomultiplier tubes (Hamamatsu R2949), which read the central-fringe intensity through a small aperture. A full cycle in the central-fringe brightness, that is, from bright to dark to bright again, is obtained for an optical path variation of
  $\lambda$ inside the bubble, namely a bubble radius change of
  $\lambda$/4,
  $\lambda =633$ nm being the wavelength of the He-Ne laser. The two photodetected signals are measured synchronously by a two-channel digital signal analyser (SR785) operating in swept-sine mode (see also supplementary material, § 3). The same swept-sine voltage generated by the analyser for the spectra acquisition is used to feed the piezo transducer in the cell. This way, the experimental set-up allows precise control of phase relations among the signals coming from the oscillating bubbles (supplementary material, § 3). At linear working conditions of each interferometer (Corti et al. Reference Corti, Bonomo and Raudino2012), the photomultiplier output voltage is proportional to the bubble's radius as it oscillates about its equilibrium value (supplementary material, § 3). The absolute vibration amplitude is then calculated by comparing the output voltage with the voltage span corresponding to a full bright-to-dark span in the central interference fringe (79.1 nm, equal to
  $\lambda$/8). The so-obtained amplitude-vs-frequency signals represent the oscillation spectra of the interacting bubbles.

Figure 2. View of the measurement cell, with the piezo at the bottom, and detail of the two upper-anchored bubbles. The closest distance between the walls of the bubbles (here, of approximately  $100\,\mathrm {\mu }$m) is denoted as
  $D$.
$D$.
The differential nature of the interferometer allows a sensitivity of 0.1 nm in the oscillation amplitude measurements (Raudino et al. Reference Raudino, Raciti and Corti2017). The optical components are carefully arranged so to avoid beam crossing or spurious reflections. To minimise acoustic noise, the optical system is tightly mounted on a Newport table inside a sound insulating box and stands on a pneumatically stabilised table, whose legs are immersed in sand basins. Presence of contaminants in the cell (or in water) is avoided by accurate cleaning. The bubbles are stable for several hours, well above the time needed for our experiments. Coalescence is not observed in the same time range. Such stability is well reproducible provided pure and dust-free water is used. Bubbles as small as  $200\,\mathrm {\mu }$m can be used with our set-up (supplementary material, § 4). Lastly, measurements were performed with bubbles formed always at the cell mid plane, sufficiently far from the free water surface and from the cell bottom, just to keep control of possible effects of acoustic coupling of the bubble with other interfaces in the cell (Oguz & Prosperetti Reference Oguz and Prosperetti1990, Reference Oguz and Prosperetti1998; Robinson et al. Reference Robinson, Blake, Kodama, Shima and Tomita2001). Experimentally, this effect was found to be small (supplementary material, § 2).
3. Results and discussion
Measurements were taken using bubbles of similar radii, between 0.6 and 0.9 mm. The larger bubble was denoted as Bubble 1 and the smaller as Bubble 2, the size ratio  $R_2/R_1$ (Ri being the static radius of Bubble i) ranging between 0.75 and 1.00. The distance
  $D$ between the bubble walls (defined as in figure 2) was varied from
  $10\,\mathrm {\mu }$m up to
  $4000\,\mathrm {\mu }$m, focusing on the close-distance range. For each distance, the vibrational spectra of both bubbles were acquired over 200 frequency points (each averaged over 20 cycles) and subsequently analysed.
The resonance frequency as a function of  $D$ is a descriptor of the bubble–bubble interactions. In all our experiments, isolated bubbles exhibit a characteristic Lorentzian resonance
  $\nu _{0i}$ (with
  $\nu _{01}\leq \nu _{02}$) inversely proportional to their radii
  $R_i$, close to the natural frequency of a free bubble (Minnaert Reference Minnaert1933). When a second bubble is present in the cell, two resonance peaks are observed, falling at frequencies
  $\nu _- < \nu _{01}$ and
  $\nu _+ > \nu _{02}$, identical for both bubbles (see figure 3a). The values of
  $\nu _\pm$ and their difference
  $\varDelta \nu$ depend on the distance
  $D$: as
  $D$ is increased,
  $\varDelta \nu$ decreases and the values of
  $\nu _\pm$ slowly tend to
  $\nu _{02}$ and
  $\nu _{01}$, respectively. The red shift of
  $\nu _-$ with respect of
  $\nu _{01}$ (of the order of 100 Hz) is much smaller than the blue shift of
  $\nu _+$ with respect to
  $\nu _{02}$ (of the order of 1000 Hz), as can be seen from figure 3(b,d). The absolute amplitude of both peaks increases with the distance and the relative amplitudes depend on both the distance and the size ratio between the bubbles (data not shown here; as an example of amplitude measurements see figure 4S in supplementary material, § 5, and discussion therein). At very large distance (not reached in our experiments due the finite width of the cell, 10 mm) the second peak is expected to disappear, with each bubble oscillating at its own resonant frequency
  $\nu _{0i}$. Finally, at contact distance, whereby the bubbles ‘bounce’ off each other, the observed peaks lose their typical Lorentzian shape (supplementary material, figure 6S).

Figure 3. (a) Vibrational spectra of two interacting bubbles of almost identical radii ( $R_1=770\,\mathrm {\mu }$m,
  $R_2=765\,\mathrm {\mu }$m), set at a face-to-face distance
  $D$ of
  $160\,\mathrm {\mu }$m (sweeping sine voltage 30 mV). The bubbles resonate at the same frequencies,
  $\nu _-$ and
  $\nu _+$, whose separation
  $\varDelta \nu$ is a function of
  $D$. (c) The corresponding relative phase of oscillation between Bubbles 1 and 2. The
  $\nu _-$ peak corresponds to in-phase oscillations (attractive interactions), while the
  $\nu _+$ resonance is out of phase (repulsive interactions). This behaviour was observed for all the size ratios investigated and at any
  $D$ value, from quasi-contact to a couple of millimetres. At larger distances, the frequency splitting vanishes and the two bubbles oscillate at frequencies close to their resonant frequencies
  $\nu _{0i}$ (experimental values:
  $\nu _{01}=3903$ Hz and
  $\nu _{02}=3934$ Hz). (b) Lower-peak
  $\nu _-$ and (d) upper-peak
  $\nu _+$ resonance frequencies of two interacting bubbles (
 $R_1=850\,\mathrm {\mu }$m,
  $R_2=800\,\mathrm {\mu }$m) as a function of distance
  $D$ (measured values:
  $\nu _{01}=3569$ Hz,
  $\nu _{02}=3793$ Hz).
Parallel to the oscillation spectra, the above-described interferometric apparatus allows the measurement of the relative phase of oscillation between the two bubbles, from the ‘cross spectrum’ of the Bubble 1 and Bubble 2 interferometric signals, as calculated by the signal analyser. As an example, the behaviour of the oscillation amplitude and of the relative phase as a function of the excitation frequency is illustrated in figure 3(a,c) for a chosen value of distance  $D$.
$D$.
The data in figure 3 can be qualitatively interpreted in terms of coupled oscillators, where the oscillation frequency is related to the interaction strength, while the relative phase is related to the nature of the interactions (Kuramoto Reference Kuramoto2003). It can be seen how resonance frequencies and relative phases give complementary information on the system under study. In particular, the low-frequency  $\nu _-$ peaks are in phase (attractive interactions) and the high-frequency
  $\nu _+$ peaks are out of phase (repulsive interactions), while the slow decay of resonance frequencies
  $\nu _\pm$ over bubble–bubble distance denotes long-range coupling. However, a rigorous and reliable interpretation of our experiments must take into account the role of the fluid coupling medium in the interactions. The hydrodynamic model of two interacting bubbles undergoing volume oscillations proposed by Maksimov and Yusupov (Maksimov & Yusupov Reference Maksimov and Yusupov2016) is fit for purpose. A remarkable feature of this model resides in the description of the close-distance regime, which is not captured by conventional hydrodynamic models of bubble–bubble interactions (see, for instance, Ida (Reference Ida2002) or the long-distance limit expression in Maksimov & Yusupov (Reference Maksimov and Yusupov2016), equation (22)). Figure 4 reports the comparison between our experimental data (circles) and model predictions (lines) for the case of two bubbles of almost identical radii (Bubble 1,
  $770\,\mathrm {\mu }$m; Bubble 2,
  $765\,\mathrm {\mu }$m). Here,
  $R/h$ is a normalised distance scale (
 $R$ being the average between the two radii and
  $h$ the centre-to-centre distance between the two bubbles), while
  $\varOmega _\pm$ are the averaged resonance frequencies of the upper and lower peaks, normalised to the resonant frequency of the isolated bubbles
  $\nu _0$ (
 $\nu _0=(\nu _{01}+\nu _{02})/2$ for the experimental data). The measured resonances are perfectly reproduced by the close-distance model (full lines), while the long-distance model (dashed lines) starts to deviate from the data already at face-to-face distances of the order of the bubble diameter. The size ratio between the two bubbles has a strong impact on the resonance response, as reported in figure 5. The experimental results are again in rather good agreement with Maksimov and Yusupov's close-distance model; discrepancies can be mostly attributed to the accuracy in the measurement of bubble radii.

Figure 4. Comparison of interferometric data (circles) obtained for two bubbles of almost identical radii ( $R_1=770\,\mathrm {\mu }$m,
  $R_2=765\,\mathrm {\mu }$m) with theoretical models of long-distance (dashed lines) and short-distance (full lines) interactions. Here,
  $R=(R_1+R_2)/2$ is the averaged radius and
  $h=2R+D$ is the centre-to-centre distance between the two bubbles. Resonance frequencies
  $\varOmega _\pm =\nu _\pm /\nu _{0}$ (
 $\varOmega _-$ in red,
  $\varOmega _+$ in blue) are normalised to the average of the measured single-bubble resonant frequencies
  $\nu _0=(\nu _{01}+\nu _{02})/2$. The theoretical curves were calculated as reported in Maksimov & Yusupov (Reference Maksimov and Yusupov2016), applying equation (20) for short-distance interactions and the simplified equation (22) for long-distance interactions.

Figure 5. Normalised resonant frequencies  $\varOmega _\pm =\nu _\pm /\nu _{0i}$ (
 $i=1,2$) vs normalised radius
  $R_1/h$ (
 $h=R_1+R_2+D$ being the centre-to-centre distance) for bubble size ratios
  $R_2/R_1$ around 0.8 and 1.0: (a) low-frequency peaks; (b) high-frequency peaks. Full lines report the theoretical predictions from Maksimov and Yusupov's model (Maksimov & Yusupov Reference Maksimov and Yusupov2016).
It should be noticed that the model refers to unconstrained bubbles, while our experiments were performed on tethered bubbles. However, we hypothesise that the contact line effect is small in the case of acoustic excitation (where no surface charge effects are involved) and bubbles of similar radii (no significant variations in contact angle). Indeed, in all our experiments the single-bubble frequencies are approximately 10 % smaller than the Minnaert frequency for a free bubble ( $\nu _0= \sqrt {3\gamma P_0/\rho _0}/(2{\rm \pi} R)$,
  $\gamma$ being the polytropic exponent of air,
  $P_0$ and
  $\rho _0$ the hydrostatic pressure and the density of water at 20
  $^{\circ }$C), in line with the literature on constrained bubbles (see e.g. Blue Reference Blue1967; Maksimov Reference Maksimov2005), the effect being of similar entity for every bubble radius investigated.
4. Conclusions
We have presented a new interferometric technique to investigate the interactions between two oscillating gas bubbles in a liquid. An important feature of this technique lies in its sensitivity. Oscillation amplitudes of the order of a few nanometres on millimetre-sized bubbles are driven by extremely low pressure fields, yielding very well-resolved and reproducible spectra. Thus nonlinearities can be disregarded, which is desirable for theoretical comparisons. Interestingly, the technique also provides a direct measurement of the relative phase of oscillation of the two bubbles. Two oscillating bubbles approaching up to quasi-contact show a frequency splitting of resonances with respect to the isolated bubbles, whose extent decreases with the bubble–bubble distance. The lower-frequency peak corresponds to in-phase oscillations, while the higher-frequency peak to out-of-phase oscillations. Measurements are in excellent agreement with the predictions of Maksimov's close-distance model, while long-distance models deviate from the experimental data already at a face-to-face distance of the order of the bubble diameters.
The simple case of two interacting bubbles oscillating in their breathing mode provides a proof of concept of the validity of the interferometric technique, besides validating the existing theory. Further applications may be interesting, such as the study of energy dissipation along the interaction (related to the width of the resonance peaks), or of the interaction between bubbles (or drops) oscillating in their surface modes. The latter, in particular, constitutes an open field of research, where the availability of well-controlled model experiments may help understand the mechanical communication between more complex fluid bodies, such as fluctuating cells (Mathijssen et al. Reference Mathijssen, Culver, Bhamla and Prakash2019).
Supplementary material
Supplementary material is available at https://doi.org/10.1017/jfm.2022.333.
Funding
This research received no specific grant from any funding agency, commercial or not-for-profit sectors.
Declaration of interests
The authors report no conflict of interest.
Author contributions
All authors contributed equally to analysing data and reaching conclusions, and in writing the paper.


