1. Introduction
Vortices are a key ingredient of oceanic and atmospheric dynamics (Carton Reference Carton2001). Vortices are horizontally recirculating fluid motions which trap air or water masses characteristic of their region of formation in their core. The combination of relative vorticity, Coriolis effect and local anomaly of stratification, specific to vortices, is best represented via a single scalar variable called potential vorticity. Since Ertel potential vorticity also exists in the absence of vortices, the anomaly of Ertel potential vorticity with respect to its value at rest characterises the vortex. In the absence of forcing and of dissipation, potential vorticity is conserved in a Lagrangian manner by each fluid element. It can also be stated that, even when lateral friction acts between fluid columns, the horizontal integral of the potential vorticity is conserved between two isentropic (atmosphere) or isopycnic (ocean) surfaces (a property called the impermeability principle; Haynes & McIntyre Reference Haynes and McIntyre1990).
For stably stratified rapidly rotating flows, such as large- and mesoscale oceanic flows, the quasi-geostrophic approximation holds (Charney Reference Charney1947). In this case, the potential vorticity can be inverted to obtain the streamfunction, from which all dynamical fields (velocity and density anomaly) can be derived (a property called the invertibility principle). In particular, the streamfunction can be obtained from the distribution of potential vorticity via a convolution product with a Green’s function of
 $1/r$
for continuously stratified quasi-geostrophic flows, where
$1/r$
for continuously stratified quasi-geostrophic flows, where
 $r$
is the 3D distance between the source and the evaluation points, and with other Green’s functions (logarithm and Bessel functions of the horizontal distance) for layerwise flows.
$r$
is the 3D distance between the source and the evaluation points, and with other Green’s functions (logarithm and Bessel functions of the horizontal distance) for layerwise flows.
Vortex dynamics in the oceans and the atmosphere has been investigated for several decades, but in this field two subjects have attracted particular attention: vortex interactions and vortex stability. Vortices can interact in complex ways, and binary interactions have been extensively studied in continuously stratified fluid. Like-signed vortices sharing some common horizontal levels may merge (completely or partially) provided that their separation distance is smaller than a given threshold. This threshold is the margin between regions of stability and instability for the pair of vortices. Examples of studies of such configurations include von Hardenberg et al. (Reference von Hardenberg, McWilliams, Provenzale, Shchpetkin and Weiss2000), Dritschel (Reference Dritschel2002), Reinaud & Dritschel (Reference Reinaud and Dritschel2002, Reference Reinaud and Dritschel2005), Bambrey, Reinaud & Dritschel (Reference Bambrey, Reinaud and Dritschel2007) and Ozurgurlu, Reinaud & Dritschel (Reference Ozurgurlu, Reinaud and Dritschel2008). It should be noted that like-signed vortex interaction has been observed at sea (Carton et al.
Reference Carton, Daniault, Alves, Chérubin and Ambar2010). Two opposite-signed vortices cannot merge but strongly pair as a dipole to propagate away. When the dipole is asymmetric, vortex interaction may lead to the breaking up of the larger pole. Reinaud & Dritschel (Reference Reinaud and Dritschel2009) studied such configurations for unit height-to-diameter aspect ratio vortices, where the vertical direction is rescaled by the ratio
 $N/f$
of the buoyancy to the Coriolis frequencies. Thus, this strong vortex interaction is associated with an instability mode which deforms the vortices. Again, this instability occurs when vortices are closer than a critical distance (Reinaud & Carton Reference Reinaud and Carton2009).
$N/f$
of the buoyancy to the Coriolis frequencies. Thus, this strong vortex interaction is associated with an instability mode which deforms the vortices. Again, this instability occurs when vortices are closer than a critical distance (Reinaud & Carton Reference Reinaud and Carton2009).
Gryanik (Reference Gryanik1983) and Hogg & Stommel (Reference Hogg and Stommel1985) introduced a baroclinic dipolar vortex structure able to self-propagate and to transport scalar properties (salt, heat, energy) across the oceans. These structures, named ‘hetons’, consist of vortices placed at different vertical levels and with opposite polarities. Their first studies of hetonic motion were carried out in the frame of a two-layer quasi-geostrophic model with singular vortices. Flierl (Reference Flierl1988) and Helfrich & Send (Reference Helfrich and Send1988) assessed the stability of such structures when they have a finite extent, and when the two opposite vortices (with uniform potential vorticity) lie on top of each other; they found that finite area hetons may be prone to baroclinic instability. Reinaud & Carton (Reference Reinaud and Carton2009) readdressed the problem introducing a vertical gap between the two poles of the hetons. They used both a continuously stratified model with fine vertical resolution and a three-layer quasi-geostrophic model. In the layered model, the vertical gap was obtained by introducing a layer with zero potential vorticity between the two layers where the vorticity poles were lying.
There are two fundamental differences between the few-layer and many-level continuously stratified models. This first one is the relation between the streamfunction and the potential vorticity (the Green’s functions depend on 2D or 3D distances). The second obviously lies in the possibility to represent the vertical deformation of the vortices. In few-layer models, the vortices are often contained in one or two layers, inside which the horizontal velocity is vertically uniform (Taylor–Proudman theorem); thus vertical deformation can only occur as a horizontal shift of the vortex axis between layers. On the contrary, in a many-level continuously stratified model, the vertical deformation of vortices can be accurately represented. Obviously, many-layer models are equivalent to many-level models in that respect. In particular, tall and thin vortices, in a vertical shear, can break vertically. The model must be able to simulate this process.
Reinaud & Carton (Reference Reinaud and Carton2009) concluded that hetons with large radius-to-height aspect ratios and moderately offset in the vertical may be unstable. This confirmed earlier studies in slightly different contexts, such as in Sokolovskiy (Reference Sokolovskiy1997), where the author studied a three-layer vortex. However, in these studies, the vortices were axisymmetric and aligned along the same vertical axis. This meant that, by symmetry, the vortices were not translating.
To induce a global translation on one another, the poles of the hetons must be offset in the horizontal as well. The stability of hetons with horizontally offset poles has been recently addressed by Reinaud (Reference Reinaud2015). The additional effect of the horizontal offset is first to suppress the baroclinic instability if the offset is larger than a critical value. More interestingly, the offset breaks a symmetry in the system, and the poles become more deformed in the vertical. This has a profound impact on the stability properties of the hetons. Again, these effects can only be seen in a many-level (many-layer) model.
A pair of translating hetons can collide and strongly interact, displacing vorticity poles relative to each other and destabilising them. This destabilisation may have different origins: the baroclinic instability due to the interaction of opposite-signed vortices lying at different levels or other shear-induced effects due to interactions between vortices lying at the same depth (such as merger or straining out). In practice, all of these processes may compete. Baroclinic dipole collision has been observed at sea and is a complex phenomenon (L’Hegaret et al. Reference L’Hegaret, Carton, Ambar, Menesguen, Hua, Chérubin, Aguiar, Le Cann, Daniault and Serra2014).
This paper addresses this issue in a simplified context. We impose many symmetries on the system. The hetons are similar and initially translating along the same axis in opposite directions, leading to a ‘head-on collision’. Despite these symmetries, the dynamics is non-trivial and extremely rich.
Heton interactions were first studied by Valcke & Verron (Reference Valcke and Verron1993). Head-on collision was further studied in a different context by Sokolovskiy & Verron (Reference Sokolovskiy and Verron2000a ,Reference Sokolovskiy and Verron b ) for the symmetric case. Sokolovskiy & Carton (Reference Sokolovskiy and Carton2010) addressed the interaction of two antisymmetric hetons which are initially collinear. These studies used a two-layer model, with no vertical separation between the poles of the hetons, and no vertical deformation of these poles. As explained above, although few-layer and many-level hetonic dynamics may share a few similarities, there are essential differences in their distant interactions and in their vertical evolution, as this paper will show.
This paper is organised as follows. Section 2 introduces the mathematical model used. Section 3 presents our results. These are in two parts. The first part investigates the problem using point vortices. The second part considers deformable finite core vortices. A short § 4 follows addressing the behaviour of very tall hetons. These hetons may behave in a way that cannot be modelled by a three-layer model. Finally, conclusions are drawn in § 5. Appendices A and B complete the paper addressing technical details.
2. The numerical model and basic equations
We present the equations governing a continuously stratified and rapidly rotating flow within the quasi-geostrophic (QG) approximation. We take the buoyancy frequency
 $N$
to be constant. Within the Boussinesq approximation, this means that we assume a linear background stratification of the density. We also take the Coriolis frequency
$N$
to be constant. Within the Boussinesq approximation, this means that we assume a linear background stratification of the density. We also take the Coriolis frequency
 $f$
to be constant, neglecting its background latitudinal variation. These two simplifying assumptions allow us to rescale the problem in the vertical direction by the ratio
$f$
to be constant, neglecting its background latitudinal variation. These two simplifying assumptions allow us to rescale the problem in the vertical direction by the ratio
 $N/f$
, and the linear relation between the streamfunction
$N/f$
, and the linear relation between the streamfunction
 ${\it\psi}$
and the potential vorticity anomaly
${\it\psi}$
and the potential vorticity anomaly
 $q$
is a Poisson’s equation. The full governing equations read
$q$
is a Poisson’s equation. The full governing equations read
 $$\begin{eqnarray}\displaystyle & \displaystyle {\displaystyle \frac{\text{d}q}{\text{d}t}}=0, & \displaystyle\end{eqnarray}$$
 $$\begin{eqnarray}\displaystyle & {\rm\Delta}{\it\psi}=q, & \displaystyle\end{eqnarray}$$
 $$\begin{eqnarray}u=-{\displaystyle \frac{\partial {\it\psi}}{\partial y}}\quad \text{and}\quad v={\displaystyle \frac{\partial {\it\psi}}{\partial x}},\end{eqnarray}$$
where
 $\text{d}/\text{d}t=\partial /\partial t+u\partial /\partial x+v\partial /\partial y$
is the material derivative,
$\text{d}/\text{d}t=\partial /\partial t+u\partial /\partial x+v\partial /\partial y$
is the material derivative,
 $(u,v)$
is the advecting (geostrophic) velocity and
$(u,v)$
is the advecting (geostrophic) velocity and
 ${\it\Delta}$
is the three-dimensional scalar Laplace’s operator
${\it\Delta}$
is the three-dimensional scalar Laplace’s operator
 $\partial ^{2}/\partial x^{2}+\partial ^{2}/\partial y^{2}+\partial ^{2}/\partial z^{2}$
.
$\partial ^{2}/\partial x^{2}+\partial ^{2}/\partial y^{2}+\partial ^{2}/\partial z^{2}$
.
For finite core hetons, the method used to solve these equations is the purely Lagrangian contour advection (see Dritschel Reference Dritschel2002; Reinaud & Dritschel Reference Reinaud and Dritschel2002). Hence, the problem does not suffer from the influence of periodic images of the vortices and the flow is unbounded with
 ${\it\psi}\rightarrow 0$
when
${\it\psi}\rightarrow 0$
when
 $x,y,z\rightarrow \infty$
. The flow velocity is recovered by inversion of (2.2), and by taking explicit derivatives of the streamfunction following (2.3) (see Dritschel Reference Dritschel2002, appendix A). The resulting volume integrals are performed in the vertical by explicitly integrating the Green’s function over the thickness of the horizontal layers spanning the vortices, and the horizontal surface integral is transformed into a contour integral over the nodes discretising the potential vorticity jumps.
$x,y,z\rightarrow \infty$
. The flow velocity is recovered by inversion of (2.2), and by taking explicit derivatives of the streamfunction following (2.3) (see Dritschel Reference Dritschel2002, appendix A). The resulting volume integrals are performed in the vertical by explicitly integrating the Green’s function over the thickness of the horizontal layers spanning the vortices, and the horizontal surface integral is transformed into a contour integral over the nodes discretising the potential vorticity jumps.
Time integration is performed using a fourth-order Runge–Kutta scheme. Contour surgery is applied every 20 time steps to control the number of points used, as well as the accuracy (note that due to the volume integrals, the computational cost grows as the square of the total number of nodes used).
3. Results
3.1. General geometries
We consider the interaction between two hetons which initially move towards one another. Each heton consists of two vortices (poles of the hetons) of equal and opposite strength (
 ${\it\kappa}$
, the volume integral of the potential vorticity (PV)), placed at different depths. Globally the hetons have zero strength, and the velocity field they induce falls off rapidly with the distance. For the sake of simplicity, we consider a number of symmetries in the problem. The four poles defining the two hetons have the same volume and their PV is uniform. The lower poles of the heton centres (respectively upper poles) are placed at the same depth
${\it\kappa}$
, the volume integral of the potential vorticity (PV)), placed at different depths. Globally the hetons have zero strength, and the velocity field they induce falls off rapidly with the distance. For the sake of simplicity, we consider a number of symmetries in the problem. The four poles defining the two hetons have the same volume and their PV is uniform. The lower poles of the heton centres (respectively upper poles) are placed at the same depth
 $z=-z_{init}$
(respectively
$z=-z_{init}$
(respectively
 $z=z_{init}$
). It should be noted that their
$z=z_{init}$
). It should be noted that their
 $z$
positions are time-independent due to the lack of vertical advection. Each individual heton is set up such that it translates along the
$z$
positions are time-independent due to the lack of vertical advection. Each individual heton is set up such that it translates along the
 $x$
direction. One heton is initially placed at
$x$
direction. One heton is initially placed at
 $x=-x_{init}$
and the second one is placed at
$x=-x_{init}$
and the second one is placed at
 $x=x_{init}$
. Moreover, the poles of the hetons are initially placed at
$x=x_{init}$
. Moreover, the poles of the hetons are initially placed at
 $y=\pm y_{init}$
. For the heton placed at
$y=\pm y_{init}$
. For the heton placed at
 $x<0$
(respectively
$x<0$
(respectively
 $x>0$
) to translate with a velocity
$x>0$
) to translate with a velocity
 $u>0$
(respectively
$u>0$
(respectively
 $u<0$
), the negative pole must be placed at
$u<0$
), the negative pole must be placed at
 $y<0$
(respectively
$y<0$
(respectively
 $y>0$
), while the positive pole must be placed at
$y>0$
), while the positive pole must be placed at
 $y>0$
(respectively
$y>0$
(respectively
 $y<0$
). However, we have a choice for the
$y<0$
). However, we have a choice for the
 $z$
location of each pole. There are two possible geometries. If the like-signed poles are placed at the same depth, we call the configuration symmetric. If the opposite-signed poles are at the same depth, we call the configuration antisymmetric. We refer to them as head-on interactions as there is no global
$z$
location of each pole. There are two possible geometries. If the like-signed poles are placed at the same depth, we call the configuration symmetric. If the opposite-signed poles are at the same depth, we call the configuration antisymmetric. We refer to them as head-on interactions as there is no global
 $y$
offset between the two hetons. The general geometry of the problem is shown in figure 1. It should be noted that the time-dependent horizontal separation distances are labelled
$y$
offset between the two hetons. The general geometry of the problem is shown in figure 1. It should be noted that the time-dependent horizontal separation distances are labelled
 ${\rm\Delta}x$
,
${\rm\Delta}x$
,
 ${\rm\Delta}y$
. For consistency we also denote
${\rm\Delta}y$
. For consistency we also denote
 ${\rm\Delta}z=2z_{init}$
.
${\rm\Delta}z=2z_{init}$
.

Figure 1. Geometry for head-on interactions: symmetric configuration (a) and antisymmetric configuration (b). Filled circles indicate the centre the positive pole and unfilled circles indicate the centre of the negative pole;
 ${\rm\Delta}z=2z_{init}$
,
${\rm\Delta}z=2z_{init}$
,
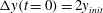 ${\rm\Delta}y(t=0)=2y_{init}$
. The numbers are the pole labels.
${\rm\Delta}y(t=0)=2y_{init}$
. The numbers are the pole labels.
3.2. Point vortices
We first consider point vortices to represent the poles of the hetons. This allows us to have a general view of the problem. It should be noted, however, that there are some fundamental limitations to this approach. The inability of the singularities (point vortices) to deform makes the hetons insensitive to the baroclinic instability or to horizontal-strain-induced deformation. On the other hand, a point vortex approach can still provide some information on how the poles are advected.
The problem has three length scales
 $x_{init}$
,
$x_{init}$
,
 $y_{init}$
and
$y_{init}$
and
 $z_{init}$
, and one time scale implicitly set by the strength of the poles to
$z_{init}$
, and one time scale implicitly set by the strength of the poles to
 $|{\it\kappa}|=4{\rm\pi}$
. Since
$|{\it\kappa}|=4{\rm\pi}$
. Since
 $x$
is the initial direction of the motion for the hetons (at leading order), the choice of
$x$
is the initial direction of the motion for the hetons (at leading order), the choice of
 $x_{init}$
is not important, as long as it is large enough. We take the arbitrary choice of
$x_{init}$
is not important, as long as it is large enough. We take the arbitrary choice of
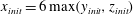 $x_{init}=6\max (y_{init},z_{init})$
. We can now set one of the lengths to non-dimensionalise our problem, and we take
$x_{init}=6\max (y_{init},z_{init})$
. We can now set one of the lengths to non-dimensionalise our problem, and we take
 $z_{init}=1$
. We label the four singularities
$z_{init}=1$
. We label the four singularities
 $i,~1\leqslant i\leqslant 4$
, where 1 is the bottom left (
$i,~1\leqslant i\leqslant 4$
, where 1 is the bottom left (
 $x_{init}<0$
) singularity, 2 is the top left singularity, 3 is the bottom right (
$x_{init}<0$
) singularity, 2 is the top left singularity, 3 is the bottom right (
 $x_{init}>0$
) singularity and 4 is the top right one.
$x_{init}>0$
) singularity and 4 is the top right one.
The velocity field
 $\boldsymbol{u}$
induced at
$\boldsymbol{u}$
induced at
 $\boldsymbol{x}=(x,y,z)$
by the singularity
$\boldsymbol{x}=(x,y,z)$
by the singularity
 $i$
is
$i$
is
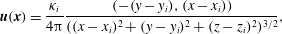 $$\begin{eqnarray}\boldsymbol{u}(\boldsymbol{x})={\displaystyle \frac{{\it\kappa}_{i}}{4{\rm\pi}}}{\displaystyle \frac{(-(y-y_{i}),(x-x_{i}))}{((x-x_{i})^{2}+(y-y_{i})^{2}+(z-z_{i})^{2})^{3/2}}},\end{eqnarray}$$
while the full velocity is the sum of the four induced velocities by linearity of the Poisson’s equations (2.2) and (2.3). This equation comes from the explicit differentiation of the streamfunction, following (2.3). The streamfunction itself is recovered by inverting (2.2),
 $$\begin{eqnarray}{\it\psi}(\boldsymbol{x})=-{\displaystyle \frac{{\it\kappa}_{i}}{4{\rm\pi}|\boldsymbol{x}-\boldsymbol{x}_{i}|}},\end{eqnarray}$$
see, for example, Gryanik (Reference Gryanik1983).
The trajectory of the vortices is determined numerically and the time integration is performed with a fourth-order Runge–Kutta scheme with
 ${\rm\Delta}t=0.01$
.
${\rm\Delta}t=0.01$
.
3.2.1. Symmetric cases
We first examine the symmetric cases where like-signed vortices lie at equal depth. We vary the ratio
 $y_{init}/z_{init}$
and we find a systematic trend. If
$y_{init}/z_{init}$
and we find a systematic trend. If
 $y_{init}/z_{init}<1$
, the poles of each heton reverse their trajectory by exchanging their horizontal location with the second pole within the same heton, as seen in figure 2(a). For
$y_{init}/z_{init}<1$
, the poles of each heton reverse their trajectory by exchanging their horizontal location with the second pole within the same heton, as seen in figure 2(a). For
 $y_{init}=z_{init}=1$
, the vortices (singularities) reach an (unstable) steady state as they reach the vertices of a cube, see figure 2(b). The situation is unstable in the sense that any perturbation in
$y_{init}=z_{init}=1$
, the vortices (singularities) reach an (unstable) steady state as they reach the vertices of a cube, see figure 2(b). The situation is unstable in the sense that any perturbation in
 $y$
imposed on one pole will result in a change of trajectory from reverse (as in
$y$
imposed on one pole will result in a change of trajectory from reverse (as in
 $y_{init}/z_{init}<1$
) to escape at a right angle (as in
$y_{init}/z_{init}<1$
) to escape at a right angle (as in
 $y_{init}/z_{init}>1$
), see figure 2. This statement, based on physical arguments, can be mathematically justified by a linear stability analysis proposed in appendix A. For
$y_{init}/z_{init}>1$
), see figure 2. This statement, based on physical arguments, can be mathematically justified by a linear stability analysis proposed in appendix A. For
 $y_{init}/z_{init}>1$
, the point vortices exchange partners and escape perpendicularly as new hetons, see figure 2(c). To understand this trend, one can look at the velocity
$y_{init}/z_{init}>1$
, the point vortices exchange partners and escape perpendicularly as new hetons, see figure 2(c). To understand this trend, one can look at the velocity
 $v_{1}$
of the point vortex 1, lying at the bottom right initially for
$v_{1}$
of the point vortex 1, lying at the bottom right initially for
 $x<0$
in the symmetric configuration. In the calculation we rescale
$x<0$
in the symmetric configuration. In the calculation we rescale
 ${\rm\Delta}y$
and
${\rm\Delta}y$
and
 ${\rm\Delta}z$
by
${\rm\Delta}z$
by
 ${\rm\Delta}x$
for convenience (and as the discussion is on
${\rm\Delta}x$
for convenience (and as the discussion is on
 ${\rm\Delta}y$
and
${\rm\Delta}y$
and
 ${\rm\Delta}z$
),
${\rm\Delta}z$
),
 $$\begin{eqnarray}v_{1}={\displaystyle \frac{{\it\kappa}}{4{\rm\pi}[(1+{\rm\Delta}y^{2})(1+{\rm\Delta}z^{2})]^{3/2}}}((1+{\rm\Delta}z^{2})^{3/2}-(1+{\rm\Delta}y^{2})^{3/2}).\end{eqnarray}$$

Figure 2. Top view of the trajectories of the ‘symmetric’ vortices for
 $y_{init}/z_{init}=2/3$
(a),
$y_{init}/z_{init}=2/3$
(a),
 $y_{init}/z_{init}=1$
(b) and
$y_{init}/z_{init}=1$
(b) and
 $y_{init}/z_{init}=2$
(c). The square symbols label the time by indicating the location of pole 1 every
$y_{init}/z_{init}=2$
(c). The square symbols label the time by indicating the location of pole 1 every
 ${\rm\Delta}t=1$
.
${\rm\Delta}t=1$
.
We see that the sign of
 $v_{1}$
depends on the sign of
$v_{1}$
depends on the sign of
 $$\begin{eqnarray}(1+{\rm\Delta}z^{2})^{3/2}-(1+{\rm\Delta}y^{2})^{3/2},\end{eqnarray}$$
i.e. only on
 $$\begin{eqnarray}{\it\alpha}={\rm\Delta}y/{\rm\Delta}z.\end{eqnarray}$$
Hence, if
 ${\rm\Delta}y<{\rm\Delta}z$
(
${\rm\Delta}y<{\rm\Delta}z$
(
 ${\it\alpha}<1$
, which means initially
${\it\alpha}<1$
, which means initially
 $y_{init}/z_{init}<1$
), vortex 1 has a velocity
$y_{init}/z_{init}<1$
), vortex 1 has a velocity
 $v_{1}>0$
and tends to move in the positive
$v_{1}>0$
and tends to move in the positive
 $y$
direction. If
$y$
direction. If
 ${\rm\Delta}y={\rm\Delta}z$
,
${\rm\Delta}y={\rm\Delta}z$
,
 $v_{1}=0$
, the vortex does not deviate in the
$v_{1}=0$
, the vortex does not deviate in the
 $y$
direction. It is easy to show that when
$y$
direction. It is easy to show that when
 ${\rm\Delta}x={\rm\Delta}y={\rm\Delta}z$
, i.e. when the point vortices are located at the vertices of a cube,
${\rm\Delta}x={\rm\Delta}y={\rm\Delta}z$
, i.e. when the point vortices are located at the vertices of a cube,
 $u_{1}$
, the velocity of all vortices in the
$u_{1}$
, the velocity of all vortices in the
 $x$
direction, becomes zero as well. We recall that the vertical velocity is zero at all times. Consequently, in this case, the singularities are steady, and the four point vortices are in mutual equilibrium. It should be noted, however, that any perturbation in
$x$
direction, becomes zero as well. We recall that the vertical velocity is zero at all times. Consequently, in this case, the singularities are steady, and the four point vortices are in mutual equilibrium. It should be noted, however, that any perturbation in
 $y$
will make the system bifurcate to one of the two other situations. Finally, if
$y$
will make the system bifurcate to one of the two other situations. Finally, if
 ${\rm\Delta}y>{\rm\Delta}z$
(
${\rm\Delta}y>{\rm\Delta}z$
(
 ${\it\alpha}>1$
),
${\it\alpha}>1$
),
 $v_{1}<0$
, and vortex 1 goes to further negative
$v_{1}<0$
, and vortex 1 goes to further negative
 $y$
values, escaping the initial hetonic configuration.
$y$
values, escaping the initial hetonic configuration.
This velocity
 $v_{1}$
comes from the influence of poles 3 and 4 on pole 1. Pole 2 does not induce a velocity in the
$v_{1}$
comes from the influence of poles 3 and 4 on pole 1. Pole 2 does not induce a velocity in the
 $y$
direction on pole 1 (as 1 and 2 are aligned along the
$y$
direction on pole 1 (as 1 and 2 are aligned along the
 $x$
direction). The sign of
$x$
direction). The sign of
 $v_{1}$
depends on which of the two poles (3 or 4) is closest to pole 1.
$v_{1}$
depends on which of the two poles (3 or 4) is closest to pole 1.
Figure 3 illustrates the streamlines in three configurations, depending on the respective values of
 ${\rm\Delta}y$
and
${\rm\Delta}y$
and
 ${\rm\Delta}z$
. In the first configuration, we take
${\rm\Delta}z$
. In the first configuration, we take
 ${\rm\Delta}y/{\rm\Delta}z=2/3$
, while
${\rm\Delta}y/{\rm\Delta}z=2/3$
, while
 ${\rm\Delta}x=2{\rm\Delta}z=2\max ({\rm\Delta}y,{\rm\Delta}z)$
. In the second, we have
${\rm\Delta}x=2{\rm\Delta}z=2\max ({\rm\Delta}y,{\rm\Delta}z)$
. In the second, we have
 ${\rm\Delta}x={\rm\Delta}y={\rm\Delta}z=1$
. Finally, in the third and last one, we take
${\rm\Delta}x={\rm\Delta}y={\rm\Delta}z=1$
. Finally, in the third and last one, we take
 ${\rm\Delta}y/{\rm\Delta}z=3/2$
, while
${\rm\Delta}y/{\rm\Delta}z=3/2$
, while
 ${\rm\Delta}x=2{\rm\Delta}y=2\max ({\rm\Delta}y,{\rm\Delta}z)$
. We plot the streamlines in two horizontal planes,
${\rm\Delta}x=2{\rm\Delta}y=2\max ({\rm\Delta}y,{\rm\Delta}z)$
. We plot the streamlines in two horizontal planes,
 $z=-2{\rm\Delta}x$
and
$z=-2{\rm\Delta}x$
and
 $z=0$
. In practice, the streamlines are obtained as curves of isovalue of the streamfunction, rather than (equivalently) integrating
$z=0$
. In practice, the streamlines are obtained as curves of isovalue of the streamfunction, rather than (equivalently) integrating
 $\text{d}x/u=\text{d}y/v$
.
$\text{d}x/u=\text{d}y/v$
.

Figure 3. Streamlines for (a,b)
 ${\rm\Delta}x=2,{\rm\Delta}y=1,{\rm\Delta}z=1.5$
and
${\rm\Delta}x=2,{\rm\Delta}y=1,{\rm\Delta}z=1.5$
and
 $-2\leqslant x,y\leqslant 2$
,
$-2\leqslant x,y\leqslant 2$
,
 $z=-2$
(a) and
$z=-2$
(a) and
 $z=0$
(b); (c,d)
$z=0$
(b); (c,d)
 ${\rm\Delta}x=1,{\rm\Delta}y=1,{\rm\Delta}z=1$
and
${\rm\Delta}x=1,{\rm\Delta}y=1,{\rm\Delta}z=1$
and
 $-1\leqslant x,y\leqslant 1$
,
$-1\leqslant x,y\leqslant 1$
,
 $z=-1$
(c) and
$z=-1$
(c) and
 $z=0$
(d); (e,f)
$z=0$
(d); (e,f)
 ${\rm\Delta}x=2,{\rm\Delta}y=1.5,{\rm\Delta}z=1$
and
${\rm\Delta}x=2,{\rm\Delta}y=1.5,{\rm\Delta}z=1$
and
 $-2\leqslant x,y\leqslant 2$
,
$-2\leqslant x,y\leqslant 2$
,
 $z=-2$
(e) and
$z=-2$
(e) and
 $z=0$
(f).
$z=0$
(f).
The bottom cross-section, at
 $z=-2{\rm\Delta}x$
, lies below the hetons. Here, the two bottom singularities have the strongest influence as they are the closest to the cross-section. We recall that the streamfunction is inversely proportional to the distance,
$z=-2{\rm\Delta}x$
, lies below the hetons. Here, the two bottom singularities have the strongest influence as they are the closest to the cross-section. We recall that the streamfunction is inversely proportional to the distance,
 ${\it\psi}\propto 1/r$
, where
${\it\psi}\propto 1/r$
, where
 $r$
is the three-dimensional distance between the source and the evaluation points. Hence, we recover closed streamlines surrounding the two bottom negative poles, each pole belonging to a different heton. This renders a classical pattern for two co-rotating vortices. Moving away from the vortices, the influences of the two vortices combine and the streamlines tend to circles around the pair of vortices. It should be noted that this pattern is still influenced by the positive poles located at
$r$
is the three-dimensional distance between the source and the evaluation points. Hence, we recover closed streamlines surrounding the two bottom negative poles, each pole belonging to a different heton. This renders a classical pattern for two co-rotating vortices. Moving away from the vortices, the influences of the two vortices combine and the streamlines tend to circles around the pair of vortices. It should be noted that this pattern is still influenced by the positive poles located at
 $z>0$
. The second cross-section at
$z>0$
. The second cross-section at
 $z=0$
corresponds to a cross-section lying at the plane of symmetry of the structure. Here, the poles are located at equal vertical distance from the plane
$z=0$
corresponds to a cross-section lying at the plane of symmetry of the structure. Here, the poles are located at equal vertical distance from the plane
 $z=0$
. Hence, the sign of their contribution to the total streamfunction is only set by their strength (we cannot distinguish from the figure alone a pole above or below
$z=0$
. Hence, the sign of their contribution to the total streamfunction is only set by their strength (we cannot distinguish from the figure alone a pole above or below
 $z=0$
). It should be noted than a third cross-section at
$z=0$
). It should be noted than a third cross-section at
 $z=+2{\rm\Delta}x$
would give a picture similar to the one for
$z=+2{\rm\Delta}x$
would give a picture similar to the one for
 $z=-2{\rm\Delta}x$
, symmetric with respect to the plane
$z=-2{\rm\Delta}x$
, symmetric with respect to the plane
 $y=0$
, with opposite sign.
$y=0$
, with opposite sign.
Qualitatively similar trajectories were observed in Sokolovskiy & Verron (Reference Sokolovskiy and Verron2000b ), where the authors varied the internal Rossby radius of deformation. However, these similarities remain qualitative, as the problem is fundamentally different. In the two-layer model, the vortices fill the full depth of the layers and the two layers are adjacent. This translates as a different inversion relation between the PV and the streamfunction.
3.2.2. Antisymmetric cases
We now look at the antisymmetric cases where the vortices that are at the same depth have opposite sign. In each case the vortices escape perpendicularly from their original trajectory. It should be noted that they no longer behave as hetons but as barotropic dipoles. By ‘barotropic dipole’ (hereinafter referred to as dipoles for short) we refer to the situation one may think of as a vortex dipole in two dimensions, i.e. here two opposite-signed vortices at the same depth. This is in contrast to a heton which is a baroclinic structure and consists of two opposite-signed vortices at different depths. The trajectory of the vortices is illustrated for three different cases in figure 4. It is shown that they are qualitatively similar.

Figure 4. Top view of the trajectories of the ‘antisymmetric’ vortices for
 $y_{init}/z_{init}=2/3$
(a),
$y_{init}/z_{init}=2/3$
(a),
 $y_{init}/z_{init}=1$
(b) and
$y_{init}/z_{init}=1$
(b) and
 $y_{init}/z_{init}=2$
(c). The square symbols label the time by indicating the location of pole 1 every
$y_{init}/z_{init}=2$
(c). The square symbols label the time by indicating the location of pole 1 every
 ${\rm\Delta}t=1$
.
${\rm\Delta}t=1$
.
We identify the conditions when the vortices escape by looking at the ‘corner’ in their trajectory. We associate the corner with the condition when
 $|v_{1}/u_{1}|=1$
, i.e. the threshold between a trajectory mostly in the
$|v_{1}/u_{1}|=1$
, i.e. the threshold between a trajectory mostly in the
 $x$
direction and a trajectory mostly along
$x$
direction and a trajectory mostly along
 $y$
. The ratio
$y$
. The ratio
 $v_{1}/u_{1}$
is
$v_{1}/u_{1}$
is
 $$\begin{eqnarray}\left|{\displaystyle \frac{v_{1}}{u_{1}}}\right|=\left|{\displaystyle \frac{{\rm\Delta}x}{{\rm\Delta}y}}{\displaystyle \frac{({\rm\Delta}y^{2}+1)^{3/2}}{{\rm\Delta}x^{3}}}{\displaystyle \frac{{\rm\Delta}x^{3}-({\rm\Delta}x^{2}+{\rm\Delta}y^{2}+1)^{3/2}}{({\rm\Delta}x^{2}+{\rm\Delta}y^{2}+1)^{3/2}-({\rm\Delta}y^{2}+1)^{3/2}}}\right|,\end{eqnarray}$$
where here for convenience the horizontal distances
 ${\rm\Delta}x$
and
${\rm\Delta}x$
and
 ${\rm\Delta}y$
are rescaled by
${\rm\Delta}y$
are rescaled by
 ${\rm\Delta}z$
(i.e.
${\rm\Delta}z$
(i.e.
 ${\rm\Delta}z=1$
). To view the limit separating the regions
${\rm\Delta}z=1$
). To view the limit separating the regions
 $|v_{1}/u_{1}|>$
or
$|v_{1}/u_{1}|>$
or
 ${<}1$
in the plane
${<}1$
in the plane
 ${\rm\Delta}x$
–
${\rm\Delta}x$
–
 ${\rm\Delta}y$
, we plot contours of isovalues of
${\rm\Delta}y$
, we plot contours of isovalues of
 $|v_{1}/u_{1}|$
, see figure 5. The limit can only be obtained from the implicit (3.6). It does not correspond to a simpler relation between
$|v_{1}/u_{1}|$
, see figure 5. The limit can only be obtained from the implicit (3.6). It does not correspond to a simpler relation between
 ${\rm\Delta}x$
and
${\rm\Delta}x$
and
 ${\rm\Delta}y$
. In particular, because of the influence of pole 4, the corner does not correspond to the situation when pole 3 becomes as close to pole 1 as pole 2. Indeed, when poles 2 and 3 are equidistant from pole 1, we have
${\rm\Delta}y$
. In particular, because of the influence of pole 4, the corner does not correspond to the situation when pole 3 becomes as close to pole 1 as pole 2. Indeed, when poles 2 and 3 are equidistant from pole 1, we have
 $s^{2}=({\rm\Delta}y^{2}+1)/{\rm\Delta}x^{2}=1$
and
$s^{2}=({\rm\Delta}y^{2}+1)/{\rm\Delta}x^{2}=1$
and
 $|v_{1}/u_{1}|=|{\rm\Delta}x/{\rm\Delta}y|\neq 1$
.
$|v_{1}/u_{1}|=|{\rm\Delta}x/{\rm\Delta}y|\neq 1$
.

Figure 5. Isovalues of
 $|v_{1}/u_{1}|$
for
$|v_{1}/u_{1}|$
for
 $0.8\leqslant {\rm\Delta}x\leqslant 2.05$
and
$0.8\leqslant {\rm\Delta}x\leqslant 2.05$
and
 $0.2\leqslant {\rm\Delta}y\leqslant 1.45$
.
$0.2\leqslant {\rm\Delta}y\leqslant 1.45$
.
Figure 6 gives an illustration of the topology of the streamlines for antisymmetric pairs of hetons. Here, the pattern is different from the symmetric case. This is due to the fact that the point vortices at the same depth now have opposite sign and behave as vortex dipoles rather than vortex pairs. This topological difference is not apparent in the plane of symmetry
 $z=0$
. This is due to the fact that the streamfunction depends on the polarity of the singularities and the inverse separation distance between them and the evaluation point only, and not on whether the singularities are above or below the plane
$z=0$
. This is due to the fact that the streamfunction depends on the polarity of the singularities and the inverse separation distance between them and the evaluation point only, and not on whether the singularities are above or below the plane
 $z=0$
. However, the topological difference from the symmetric case becomes clear in a plane closer to one of the dipoles, see figure 6(a). Again, we observed nearly circular streamlines in the vicinity of the vertical axes where the singularities lie. However, between the two centres, the streamlines flatten and are nearly parallel, indicating translation of the structure. This is in contrast to the stagnation point observed for the symmetric case. The pattern shown in the figure 6 is generic for all antisymmetric cases investigated.
$z=0$
. However, the topological difference from the symmetric case becomes clear in a plane closer to one of the dipoles, see figure 6(a). Again, we observed nearly circular streamlines in the vicinity of the vertical axes where the singularities lie. However, between the two centres, the streamlines flatten and are nearly parallel, indicating translation of the structure. This is in contrast to the stagnation point observed for the symmetric case. The pattern shown in the figure 6 is generic for all antisymmetric cases investigated.

Figure 6. Streamlines for
 ${\rm\Delta}x=2,{\rm\Delta}y=1,{\rm\Delta}z=1.5$
and
${\rm\Delta}x=2,{\rm\Delta}y=1,{\rm\Delta}z=1.5$
and
 $-2\leqslant x,y\leqslant 2$
,
$-2\leqslant x,y\leqslant 2$
,
 $z=-2$
(a) and
$z=-2$
(a) and
 $z=0$
(b).
$z=0$
(b).
3.3. Hamiltonian
Another way to determine the possible trajectories of the poles of the hetons is to use the conservation of the Hamiltonian of the system,
 $$\begin{eqnarray}H=-{\displaystyle \frac{1}{2}}\iiint q(\boldsymbol{x}){\it\psi}(\boldsymbol{x})\,\text{d}v,\end{eqnarray}$$
where
 $$\begin{eqnarray}{\it\psi}(\boldsymbol{x})=-{\displaystyle \frac{1}{4{\rm\pi}}}\iiint {\displaystyle \frac{q(\boldsymbol{x}^{\prime })}{|\boldsymbol{x}-\boldsymbol{x}^{\prime }|}}\,\text{d}v^{\prime }.\end{eqnarray}$$
It should be noted that the other three invariants of the system which are the linear impulses along
 $x$
and along
$x$
and along
 $y$
together with the angular impulse are zero by symmetry. Possible trajectories must coincide with isovalue lines of
$y$
together with the angular impulse are zero by symmetry. Possible trajectories must coincide with isovalue lines of
 $H$
. In our discrete point vortex approach we plot contours of
$H$
. In our discrete point vortex approach we plot contours of
 $$\begin{eqnarray}\mathscr{H}={\displaystyle \frac{1}{2}}\mathop{\sum }_{i=1}^{4}\mathop{\sum }_{j=1,j\neq i}^{4}{\it\kappa}_{i}{\displaystyle \frac{{\it\kappa}_{j}}{4{\rm\pi}}}{\displaystyle \frac{1}{|\boldsymbol{x}_{i}-\boldsymbol{x}_{j}|}},\end{eqnarray}$$
which is the interaction Hamiltonian. This Hamiltonian may be positive or negative due to the products of the form
 ${\it\kappa}_{i}{\it\kappa}_{j}$
which can be either positive of negative. It should be noted that fundamentally this approach is the same as before as the time-dependent solution found in the two previous subsections derives from the Hamiltonian formulation of the system. Given the location of one of the poles, we can deduce by symmetry the positions of all four poles (this is due to the symmetry of the initial conditions and the fact that the symmetries in the equation ensure that these symmetries are conserved). Therefore, we calculate the Hamiltonian corresponding to this configuration. Thus, we have a simple map of the Hamiltonian values for all values of
${\it\kappa}_{i}{\it\kappa}_{j}$
which can be either positive of negative. It should be noted that fundamentally this approach is the same as before as the time-dependent solution found in the two previous subsections derives from the Hamiltonian formulation of the system. Given the location of one of the poles, we can deduce by symmetry the positions of all four poles (this is due to the symmetry of the initial conditions and the fact that the symmetries in the equation ensure that these symmetries are conserved). Therefore, we calculate the Hamiltonian corresponding to this configuration. Thus, we have a simple map of the Hamiltonian values for all values of
 ${\rm\Delta}x$
and
${\rm\Delta}x$
and
 ${\rm\Delta}y$
. This would not be the case if there was an asymmetry in the initial condition such as a global offset in
${\rm\Delta}y$
. This would not be the case if there was an asymmetry in the initial condition such as a global offset in
 $y$
between the two hetons. In that case, the locations of the four poles can no longer be determined ad hoc using symmetry arguments by the location of pole 1 alone. The positions must be determined by time integration of the system. The other invariants are the two linear impulses
$y$
between the two hetons. In that case, the locations of the four poles can no longer be determined ad hoc using symmetry arguments by the location of pole 1 alone. The positions must be determined by time integration of the system. The other invariants are the two linear impulses
 $$\begin{eqnarray}P_{x}=\iiint x\,q(\boldsymbol{x})\,\text{d}v\quad \text{and}\quad P_{y}=\iiint y\,q(\boldsymbol{x})\,\text{d}v\end{eqnarray}$$
and the angular impulse
 $$\begin{eqnarray}I=\iiint |\boldsymbol{x}|^{2}q(\boldsymbol{x})\,\text{d}v,\end{eqnarray}$$
see, for example, Gryanik (Reference Gryanik1983). By symmetry, these three invariants are all zero in our cases.

Figure 7. Isovalues of
 $\mathscr{H}$
for the ‘symmetric’ hetons. Forty-one isovalue contours are plotted for
$\mathscr{H}$
for the ‘symmetric’ hetons. Forty-one isovalue contours are plotted for
 $1.2\leqslant \mathscr{H}\leqslant 24.6$
and
$1.2\leqslant \mathscr{H}\leqslant 24.6$
and
 $-3\leqslant {\rm\Delta}x,{\rm\Delta}y\leqslant 3$
;
$-3\leqslant {\rm\Delta}x,{\rm\Delta}y\leqslant 3$
;
 ${\rm\Delta}x$
and
${\rm\Delta}x$
and
 ${\rm\Delta}y$
are rescaled by
${\rm\Delta}y$
are rescaled by
 ${\rm\Delta}z$
(i.e.
${\rm\Delta}z$
(i.e.
 ${\rm\Delta}z=1$
).
${\rm\Delta}z=1$
).
Results for the symmetric hetons are presented in figure 7. It should be noted that in the symmetric case,
 $\mathscr{H}$
simplifies to
$\mathscr{H}$
simplifies to
 $$\begin{eqnarray}\mathscr{H}=8{\rm\pi}\left({\displaystyle \frac{1}{\sqrt{{\rm\Delta}x^{2}+{\rm\Delta}y^{2}}}}-{\displaystyle \frac{1}{\sqrt{{\rm\Delta}y^{2}+{\rm\Delta}z^{2}}}}-{\displaystyle \frac{1}{\sqrt{{\rm\Delta}x^{2}+{\rm\Delta}z^{2}}}}\right).\end{eqnarray}$$
We recover both the turning and escaping trajectories as well as the limiting case between the two different kinds of trajectories where the vortices reach an equilibrium at the vertices of a cube. It should be noted that we also find (by symmetry) images of the trajectories for hetons starting from
 ${\rm\Delta}y_{init}>{\rm\Delta}x_{init}$
.
${\rm\Delta}y_{init}>{\rm\Delta}x_{init}$
.
Results for the antisymmetric hetons are presented in figure 8 (for
 $-\mathscr{H}$
). In this case
$-\mathscr{H}$
). In this case
 $$\begin{eqnarray}\mathscr{H}=8{\rm\pi}\left({\displaystyle \frac{1}{\sqrt{{\rm\Delta}x^{2}+{\rm\Delta}y^{2}+{\rm\Delta}z^{2}}}}-{\displaystyle \frac{1}{\sqrt{{\rm\Delta}y^{2}+{\rm\Delta}z^{2}}}}-{\displaystyle \frac{1}{|{\rm\Delta}x|}}\right).\end{eqnarray}$$
We recover the escape trajectories for the poles of the hetons. It should be noted that the trajectories do not share the same level of symmetry as the symmetric case. This is also visible from earlier results, e.g. formula (2.3), where
 ${\rm\Delta}x$
and
${\rm\Delta}x$
and
 ${\rm\Delta}y$
do not appear in a symmetric pattern. It should also be noted that we do not consider situations starting from
${\rm\Delta}y$
do not appear in a symmetric pattern. It should also be noted that we do not consider situations starting from
 ${\rm\Delta}x_{init}<{\rm\Delta}y_{init}$
where we would just have two dipoles moving away from one another (pairs of opposite-signed vortices at the same depth).
${\rm\Delta}x_{init}<{\rm\Delta}y_{init}$
where we would just have two dipoles moving away from one another (pairs of opposite-signed vortices at the same depth).

Figure 8. Isovalues of
 $-\mathscr{H}$
for the ‘antisymmetric’ hetons. Forty-two isovalues of
$-\mathscr{H}$
for the ‘antisymmetric’ hetons. Forty-two isovalues of
 $\mathscr{H}$
are plotted for
$\mathscr{H}$
are plotted for
 $1.8\leqslant \mathscr{H}\leqslant 8$
,
$1.8\leqslant \mathscr{H}\leqslant 8$
,
 $-3\leqslant {\rm\Delta}x,{\rm\Delta}y\leqslant 3$
and
$-3\leqslant {\rm\Delta}x,{\rm\Delta}y\leqslant 3$
and
 ${\rm\Delta}z=1$
.
${\rm\Delta}z=1$
.
3.4. Finite core hetons
We now turn our attention to the more realistic case of finite core vortices. Each pole consists of a cylinder of uniform PV. The dynamics is expected to be richer as the poles of the hetons now have the freedom to deform and therefore may be sensitive to baroclinic instability as well as other shear-induced effects. An individual heton may be baroclinically unstable. This instability affects wide hetons whose poles are not much separated vertically or horizontally. Wider poles are sensitive to higher-wavenumber azimuthal modes.
The wider the poles are, the higher the azimuthal wavenumber associated with the instability is.
When two hetons interact, they can form structures with several poles of PV, which themselves may be barotropically unstable. In the symmetric case for two hetons, their poles lying at the same depth are like-signed. Co-rotating equilibria of like-signed vortices exist, but up to marginal configurations. For vortices closer than a threshold distance, these configurations become unstable. Deformed by the horizontal shear created by the companion vortex, the vortices merge. In the antisymmetric case, the same-depth vortices are opposite-signed. Translating steady states of two opposite-signed vortices at the same depth can exist but again up to a critical distance. When closer, they undergo a destructive process.
The instability of horizontal, like-signed or opposite-signed, vortices can be associated with the phase-locking of Rossby waves along their boundary (PV interface). The phase-locking itself is due to the individual velocity field of each vortex and to the mutual influence of the vortices.
These modes of instability may enter in competition with the behaviour observed from singularities (e.g. poles breaking up or merging before they can evolve as described in the previous section). The geometry of a given heton is described in figure 9. It should be noted also that an extra length scale appears naturally in the problem linked to the size of the poles, for example their horizontal radius
 $r$
. This also means that there is another parameter describing the poles: their aspect ratio
$r$
. This also means that there is another parameter describing the poles: their aspect ratio
 ${\it\varrho}=r/h$
, where
${\it\varrho}=r/h$
, where
 $h$
is the full height of a pole.
$h$
is the full height of a pole.

Figure 9. Geometry of one finite core heton and definition of the main symbols.
It should be noted that we use the full height
 $h$
and the horizontal radius rather than the half-height (to be consistent with the radius) and
$h$
and the horizontal radius rather than the half-height (to be consistent with the radius) and
 $r$
because previous studies made use of layered models where vortices would occupy the full vertical extent of a layer denoted by
$r$
because previous studies made use of layered models where vortices would occupy the full vertical extent of a layer denoted by
 $h$
. Each pole is assigned a PV of
$h$
. Each pole is assigned a PV of
 $q_{i}=\pm 2{\rm\pi}$
and a volume
$q_{i}=\pm 2{\rm\pi}$
and a volume
 $V_{i}={\rm\pi}r^{2}h={\rm\pi}{\it\varrho}^{2}h^{3}$
. The strength of the pole
$V_{i}={\rm\pi}r^{2}h={\rm\pi}{\it\varrho}^{2}h^{3}$
. The strength of the pole
 $i$
is
$i$
is
 ${\it\kappa}_{1}=\iiint _{V_{i}}q_{i}\,\text{d}V=\pm 2{\rm\pi}^{2}{\it\varrho}^{2}h^{3}$
, which is now set by the value of
${\it\kappa}_{1}=\iiint _{V_{i}}q_{i}\,\text{d}V=\pm 2{\rm\pi}^{2}{\it\varrho}^{2}h^{3}$
, which is now set by the value of
 $h$
(given
$h$
(given
 ${\it\varrho}$
). To determine the value of
${\it\varrho}$
). To determine the value of
 $h$
in practice, we set the full extent of the flow in the vertical,
$h$
in practice, we set the full extent of the flow in the vertical,
 $H_{tot}$
, to 1;
$H_{tot}$
, to 1;
 $H_{tot}$
is measured from the bottom of the bottom pole to the top of the top pole. We denote by
$H_{tot}$
is measured from the bottom of the bottom pole to the top of the top pole. We denote by
 $Dz$
the vertical separation between the poles (vertical space with no PV, see figure 9). It should be noted that the vertical distance between the two pole centres is
$Dz$
the vertical separation between the poles (vertical space with no PV, see figure 9). It should be noted that the vertical distance between the two pole centres is
 ${\rm\Delta}z=Dz+h$
or
${\rm\Delta}z=Dz+h$
or
 $h(\ell _{z}+1)$
, where
$h(\ell _{z}+1)$
, where
 $\ell _{z}=Dz/h$
is a specified parameter. Finally, we relate
$\ell _{z}=Dz/h$
is a specified parameter. Finally, we relate
 $h$
to
$h$
to
 $H_{tot}$
, i.e.
$H_{tot}$
, i.e.
 $H_{tot}=Dz+2h=1$
, so
$H_{tot}=Dz+2h=1$
, so
 $h=(\ell _{z}+2)^{-1}$
and
$h=(\ell _{z}+2)^{-1}$
and
 ${\it\kappa}_{i}=\pm 2{\rm\pi}^{2}{\it\varrho}^{2}(\ell _{z}+2)^{-3}$
.
${\it\kappa}_{i}=\pm 2{\rm\pi}^{2}{\it\varrho}^{2}(\ell _{z}+2)^{-3}$
.
The stability of isolated hetons has been studied in the case where the two poles are aligned in Reinaud & Carton (Reference Reinaud and Carton2009) and more recently in Reinaud (Reference Reinaud2015) when the two poles are offset horizontally (as is the case here). The upshot of these studies is as follows. For small aspect ratios, the heton may be stable. On increasing the radius of the poles, we reach the first unstable modes with azimuthal wavenumber
 $l=2$
, then
$l=2$
, then
 $l=3$
, and so on. The instability also depends on the vertical offset between the two hetons. The margins between stability and instability and between the emergence of the various modes
$l=3$
, and so on. The instability also depends on the vertical offset between the two hetons. The margins between stability and instability and between the emergence of the various modes
 $l$
is shifted to wider vortices as the vertical offset is increased. This indicates a weakening of the interaction as the overall distance between the two poles is increased. The influence of a horizontal offset between the poles is somehow similar in the sense that it weakens the instabilities. Modes become stable after the horizontal gap between the poles reaches a marginal value. This value is aspect-ratio-dependent and vertical-offset-dependent. This margin is typically only a fraction of the vortex radii. However, the influence of a horizontal offset is different from that of a vertical one as it breaks some degrees of symmetry in the flow configuration. The equilibria can no longer be axisymmetric. Reinaud (Reference Reinaud2015) has shown that this has a profound impact on the spatial structure of the instability modes and their growth rates. The vortices also need to tilt with respect to the vertical axis to withstand the vertical shear. The vertical shear in the system is discussed in appendix B, using a simplified point vortex model. The conclusion of these studies is that small-aspect-ratio vortices that are well separated in the vertical and/or in the horizontal are expected to be stable while wide vortices with moderate vertical and horizontal separation distances are expected to be unstable.
$l$
is shifted to wider vortices as the vertical offset is increased. This indicates a weakening of the interaction as the overall distance between the two poles is increased. The influence of a horizontal offset between the poles is somehow similar in the sense that it weakens the instabilities. Modes become stable after the horizontal gap between the poles reaches a marginal value. This value is aspect-ratio-dependent and vertical-offset-dependent. This margin is typically only a fraction of the vortex radii. However, the influence of a horizontal offset is different from that of a vertical one as it breaks some degrees of symmetry in the flow configuration. The equilibria can no longer be axisymmetric. Reinaud (Reference Reinaud2015) has shown that this has a profound impact on the spatial structure of the instability modes and their growth rates. The vortices also need to tilt with respect to the vertical axis to withstand the vertical shear. The vertical shear in the system is discussed in appendix B, using a simplified point vortex model. The conclusion of these studies is that small-aspect-ratio vortices that are well separated in the vertical and/or in the horizontal are expected to be stable while wide vortices with moderate vertical and horizontal separation distances are expected to be unstable.
3.4.1. Symmetric hetons
We start the investigation with the symmetric hetons. The parameter space is spanned by
 $d_{y}={\rm\Delta}y/r,\,{\it\varrho}=r/h$
and
$d_{y}={\rm\Delta}y/r,\,{\it\varrho}=r/h$
and
 $\ell _{z}=Dz/h$
. Here,
$\ell _{z}=Dz/h$
. Here,
 ${\rm\Delta}y$
has the same meaning as in the previous sections; it is the distance in the
${\rm\Delta}y$
has the same meaning as in the previous sections; it is the distance in the
 $y$
direction between the pole centres of a heton. For convenience, its non-dimensional form
$y$
direction between the pole centres of a heton. For convenience, its non-dimensional form
 $d_{y}$
is measured as a fraction of the horizontal radius of the pole, hence
$d_{y}$
is measured as a fraction of the horizontal radius of the pole, hence
 $d_{y}\geqslant 2$
would mean that the poles do not overlap. We investigate five values for each of the parameters,
$d_{y}\geqslant 2$
would mean that the poles do not overlap. We investigate five values for each of the parameters,
 $d_{y}=(0.1,\,0.25,\,0.5,\,0.75,\,1)$
,
$d_{y}=(0.1,\,0.25,\,0.5,\,0.75,\,1)$
,
 ${\it\varrho}=(1.5,\,2.5,\,3.5,\,4.5,\,5.5)$
and
${\it\varrho}=(1.5,\,2.5,\,3.5,\,4.5,\,5.5)$
and
 $\ell _{z}=(0.5,\,1,\,1.5,\,2,\,2.5)$
, hence 125 cases in total. For all cases the simulation is started with the poles situated at
$\ell _{z}=(0.5,\,1,\,1.5,\,2,\,2.5)$
, hence 125 cases in total. For all cases the simulation is started with the poles situated at
 $x_{0}=\pm 5r$
at least. There are 100 horizontal layers representing the full vertical extent of the flow (i.e. from the bottom of the bottom pole to the top of the top vortex). This includes also the vertical gap between the two poles. The equations are marched in time with the fourth-order Runge–Kutta scheme and the time step is
$x_{0}=\pm 5r$
at least. There are 100 horizontal layers representing the full vertical extent of the flow (i.e. from the bottom of the bottom pole to the top of the top vortex). This includes also the vertical gap between the two poles. The equations are marched in time with the fourth-order Runge–Kutta scheme and the time step is
 ${\rm\Delta}t=|q|/40$
, where
${\rm\Delta}t=|q|/40$
, where
 $|q|$
is the PV magnitude. These are the standard set-ups of the method.
$|q|$
is the PV magnitude. These are the standard set-ups of the method.
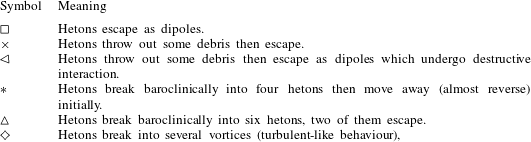
Table 1 defines the symbols used to describe the sort of nonlinear interaction that the symmetric pair of hetons undergoes. The range of potential behaviours is as follows. Three main effects are competing. First, the finite core hetons may reproduce the global behaviour predicted by the point vortices. Second, there is the possibility that the hetons break baroclinically. Third, the poles belonging to different hetons, at the same depth, may strongly interact. Different initial conditions can favour one or a combination of such behaviours. The latter two effects are instabilities and are therefore associated with a time scale over which they can develop during the dynamical process.
Table 1. Meaning of the symbols used to describe the outcome of the interactions between two symmetric hetons.

We know from the point vortex calculation that the global behaviour is influenced by the ratio
 ${\it\alpha}$
of the horizontal offset of the poles within the heton to their vertical offset. This ratio can be evaluated from the parameters
${\it\alpha}$
of the horizontal offset of the poles within the heton to their vertical offset. This ratio can be evaluated from the parameters
 $d_{z},\,{\it\varrho}$
and
$d_{z},\,{\it\varrho}$
and
 $\ell _{z}$
as
$\ell _{z}$
as
 ${\it\alpha}={\it\varrho}(d_{y}/(\ell _{z}+1))$
. Small values of this parameter trigger a reverse motion of the hetons while a large value triggers an escape of the recombined poles perpendicularly to their original trajectory. On the other hand, we know that hetons are more stable when their aspect ratio is small and the poles are separated by either or both large
${\it\alpha}={\it\varrho}(d_{y}/(\ell _{z}+1))$
. Small values of this parameter trigger a reverse motion of the hetons while a large value triggers an escape of the recombined poles perpendicularly to their original trajectory. On the other hand, we know that hetons are more stable when their aspect ratio is small and the poles are separated by either or both large
 $d_{y}$
and large
$d_{y}$
and large
 $\ell _{z}$
. Finally, we know that for two co-rotating vortices, they must be close enough to one another to merge.
$\ell _{z}$
. Finally, we know that for two co-rotating vortices, they must be close enough to one another to merge.
Therefore, in our parameter space, we can expect that for small aspect ratios, large vertical offset (for stability) and moderate horizontal offset
 $d_{y}$
(
$d_{y}$
(
 ${\it\alpha}<1$
) the hetons are likely to reverse trajectory. However, in the symmetric case, since the co-rotating vortices are at the same depth, vortex merger is possible. For larger values of the aspect ratio the vortices may merge during the phase when they approach one another. Larger vortices are able to merge from further apart. To merge, the poles must also remain in the vicinity of one another for a sufficiently long period of time. Indeed, the merger process is fundamentally linked to an instability mode of a pair of co-rotating vortices. This means that the instability must have enough time to develop before the dynamics of the hetons (reverse trajectory) takes over and separates the poles. On the other hand, for large aspect ratio and small
${\it\alpha}<1$
) the hetons are likely to reverse trajectory. However, in the symmetric case, since the co-rotating vortices are at the same depth, vortex merger is possible. For larger values of the aspect ratio the vortices may merge during the phase when they approach one another. Larger vortices are able to merge from further apart. To merge, the poles must also remain in the vicinity of one another for a sufficiently long period of time. Indeed, the merger process is fundamentally linked to an instability mode of a pair of co-rotating vortices. This means that the instability must have enough time to develop before the dynamics of the hetons (reverse trajectory) takes over and separates the poles. On the other hand, for large aspect ratio and small
 $d_{y}$
, the translation velocity bringing the hetons together can be too low to prevent the hetons from becoming baroclinically unstable first. In that case each heton may break before reversing and/or being close enough to experience vortex merger with the poles of the other heton.
$d_{y}$
, the translation velocity bringing the hetons together can be too low to prevent the hetons from becoming baroclinically unstable first. In that case each heton may break before reversing and/or being close enough to experience vortex merger with the poles of the other heton.
For larger values of
 ${\it\alpha}$
, the hetons may recombine and new hetons may escape. However, this also implies that
${\it\alpha}$
, the hetons may recombine and new hetons may escape. However, this also implies that
 ${\it\varrho}$
must be sufficiently large in our parameter space as
${\it\varrho}$
must be sufficiently large in our parameter space as
 $d_{y}$
is taken as a fraction of
$d_{y}$
is taken as a fraction of
 $r$
. Hence, there is a possibility that in these cases the hetons may undergo a baroclinic breakup (albeit partial) in the process. Finally, the hetons may just be strongly unstable and break up before strongly interacting with one another. All of these scenarios are observed in practice. We summarise the general behaviour in figure 10 using the symbols defined in table 1. This table shows that for five nonlinear regimes out of six, finite core effects are essential, and that these regimes cannot be simply reproduced with point vortices.
$r$
. Hence, there is a possibility that in these cases the hetons may undergo a baroclinic breakup (albeit partial) in the process. Finally, the hetons may just be strongly unstable and break up before strongly interacting with one another. All of these scenarios are observed in practice. We summarise the general behaviour in figure 10 using the symbols defined in table 1. This table shows that for five nonlinear regimes out of six, finite core effects are essential, and that these regimes cannot be simply reproduced with point vortices.

Figure 10. Finite core symmetric hetons: regimes in the plane
 ${\it\varrho}{-}\ell _{z}$
for (a)
${\it\varrho}{-}\ell _{z}$
for (a)
 $d_{y}={\rm\Delta}y/r=0.1$
, (b) 0.25, (c) 0.5, (d) 0.75 and (e) 1. The solid lines indicate the threshold
$d_{y}={\rm\Delta}y/r=0.1$
, (b) 0.25, (c) 0.5, (d) 0.75 and (e) 1. The solid lines indicate the threshold
 ${\rm\Delta}y/{\rm\Delta}z=1$
. The axis labels are all identical and are defined in (e). The meaning of all symbols is defined in table 1. An underlined symbol indicates that the vortices produced by the first main interaction experience further strong interaction as they reverse velocity or escape.
${\rm\Delta}y/{\rm\Delta}z=1$
. The axis labels are all identical and are defined in (e). The meaning of all symbols is defined in table 1. An underlined symbol indicates that the vortices produced by the first main interaction experience further strong interaction as they reverse velocity or escape.
We next illustrate examples of the typical evolution of the interacting hetons in each category of behaviour. Figure 11 shows the nonlinear evolution of a symmetric pair of hetons with
 ${\it\varrho}=1.5$
,
${\it\varrho}=1.5$
,
 $d_{y}=0.5$
,
$d_{y}=0.5$
,
 $\ell _{z}=1.5$
, such that
$\ell _{z}=1.5$
, such that
 ${\it\alpha}=0.2<1$
. Equivalent point vortices would reverse trajectory. Moreover, from the stability results in Reinaud (Reference Reinaud2015), each heton should be baroclinically stable in isolation (and if they were at equilibrium). The result first shows that the hetons indeed do not break baroclinically. Moreover, the minimum separation distance reached by two co-rotating poles is
${\it\alpha}=0.2<1$
. Equivalent point vortices would reverse trajectory. Moreover, from the stability results in Reinaud (Reference Reinaud2015), each heton should be baroclinically stable in isolation (and if they were at equilibrium). The result first shows that the hetons indeed do not break baroclinically. Moreover, the minimum separation distance reached by two co-rotating poles is
 $d/r=4.77$
, which is likely to be larger than the margin of stability for vortex merger, even in a static situation. By static situation we refer to an isolated couple of co-rotating poles. In that case, the separation distance is invariant and the instability has all the time to develop. Here, the poles are usually further apart than this minimum distance. For comparison, two spherical vortices only merge (partially) for
$d/r=4.77$
, which is likely to be larger than the margin of stability for vortex merger, even in a static situation. By static situation we refer to an isolated couple of co-rotating poles. In that case, the separation distance is invariant and the instability has all the time to develop. Here, the poles are usually further apart than this minimum distance. For comparison, two spherical vortices only merge (partially) for
 $d/r=2.7$
, see Reinaud & Dritschel (Reference Reinaud and Dritschel2002). This case is representative of all cases indicated by the symbol ◃ in figure 10.
$d/r=2.7$
, see Reinaud & Dritschel (Reference Reinaud and Dritschel2002). This case is representative of all cases indicated by the symbol ◃ in figure 10.

Figure 11. Flow evolution for symmetric finite core hetons with
 ${\it\varrho}=1.5$
,
${\it\varrho}=1.5$
,
 $d_{y}=0.5$
and
$d_{y}=0.5$
and
 $\ell _{z}=1.5$
. The figure is ordered in increasing time (a–d). The times displayed are
$\ell _{z}=1.5$
. The figure is ordered in increasing time (a–d). The times displayed are
 $t=0$
,
$t=0$
,
 $t=50$
,
$t=50$
,
 $t=100$
and
$t=100$
and
 $t=150$
. The vortices are viewed orthographically at an angle of 60° from the vertical. The front and back panels indicate the side of a virtual viewing square box centred around the vortices. The hetons reverse velocity (label ◃ in table 1).
$t=150$
. The vortices are viewed orthographically at an angle of 60° from the vertical. The front and back panels indicate the side of a virtual viewing square box centred around the vortices. The hetons reverse velocity (label ◃ in table 1).

Figure 12. Flow evolution for symmetric finite core hetons with
 ${\it\varrho}=2.5$
,
${\it\varrho}=2.5$
,
 $d_{y}=1$
and
$d_{y}=1$
and
 $\ell _{z}=1.5$
. The times displayed are
$\ell _{z}=1.5$
. The times displayed are
 $t=0$
,
$t=0$
,
 $t=37.5$
,
$t=37.5$
,
 $t=75$
and
$t=75$
and
 $t=100$
. The hetons reverse velocity after temporary merger (label ▹ in table 1).
$t=100$
. The hetons reverse velocity after temporary merger (label ▹ in table 1).
We illustrate in figure 12 the behaviour of the hetons when vorticity poles temporarily merge before the hetons reverse trajectory. Here, the vortices are slightly larger (
 ${\it\varrho}=2.5$
) and we take
${\it\varrho}=2.5$
) and we take
 $d_{y}=1$
while retaining
$d_{y}=1$
while retaining
 $\ell _{z}=1.5$
, so that
$\ell _{z}=1.5$
, so that
 ${\it\alpha}=1$
. In this case the hetons are offset enough in the vertical to be baroclinically stable. However, now the vortices can get closer together, and within a limit in
${\it\alpha}=1$
. In this case the hetons are offset enough in the vertical to be baroclinically stable. However, now the vortices can get closer together, and within a limit in
 $d/r$
where they can merge. The vortex structure thus formed is itself unstable and breaks down back into individual vortices which reverse trajectories. Such behaviour is common for like-signed vortices, see Reinaud & Dritschel (Reference Reinaud and Dritschel2002). These interactions are referred to as partial merger and weak interaction. The breaking up of the vortices formed during the merger process is also forced here by the strain field induced by the opposite-signed vortices at different depths. This is generic to all cases indicated by the symbol ▹ in figure 10.
$d/r$
where they can merge. The vortex structure thus formed is itself unstable and breaks down back into individual vortices which reverse trajectories. Such behaviour is common for like-signed vortices, see Reinaud & Dritschel (Reference Reinaud and Dritschel2002). These interactions are referred to as partial merger and weak interaction. The breaking up of the vortices formed during the merger process is also forced here by the strain field induced by the opposite-signed vortices at different depths. This is generic to all cases indicated by the symbol ▹ in figure 10.
By decreasing
 $d_{y}$
from the previous case and increasing
$d_{y}$
from the previous case and increasing
 ${\it\varrho}$
, we now enter the domain where each heton can destabilise baroclinically. Moreover, small
${\it\varrho}$
, we now enter the domain where each heton can destabilise baroclinically. Moreover, small
 $d_{y}$
means that the translation velocity is small. The baroclinic instability can develop before the two hetons are close to one another. Arguably, one could also start the simulation from hetons at larger separation distances to reach a similar effect. Figure 13 shows the symmetric pair of hetons for
$d_{y}$
means that the translation velocity is small. The baroclinic instability can develop before the two hetons are close to one another. Arguably, one could also start the simulation from hetons at larger separation distances to reach a similar effect. Figure 13 shows the symmetric pair of hetons for
 ${\it\varrho}=3.5$
,
${\it\varrho}=3.5$
,
 $d_{y}=0.1$
and
$d_{y}=0.1$
and
 $\ell _{z}=1.5$
, such that
$\ell _{z}=1.5$
, such that
 ${\it\alpha}=0.14<1$
. For such a large aspect ratio and small horizontal offset, each heton is strongly unstable. The hetons break baroclinically well before getting close enough to strongly interact with the other heton. During the breaking up of the hetons, the poles reorganise into four hetons. The poles of the hetons are placed in such a way that they reverse (at least temporarily) their trajectories and start to move away from one another. It should be noted that each heton breaks into two main secondary hetons (and some debris). This is consistent with a dominant azimuthal mode of instability
${\it\alpha}=0.14<1$
. For such a large aspect ratio and small horizontal offset, each heton is strongly unstable. The hetons break baroclinically well before getting close enough to strongly interact with the other heton. During the breaking up of the hetons, the poles reorganise into four hetons. The poles of the hetons are placed in such a way that they reverse (at least temporarily) their trajectories and start to move away from one another. It should be noted that each heton breaks into two main secondary hetons (and some debris). This is consistent with a dominant azimuthal mode of instability
 $l=2$
. It is also arguable that the shear flow interaction between the two hetons is likely to force a deformation exciting mode 2. The fact that the new hetons move away is probably more related to the nature of their formation rather than the fact that
$l=2$
. It is also arguable that the shear flow interaction between the two hetons is likely to force a deformation exciting mode 2. The fact that the new hetons move away is probably more related to the nature of their formation rather than the fact that
 ${\it\alpha}<1$
for the original hetons, as the four hetons produced are fundamentally different from the original ones. This example illustrates all cases marked by the symbol
${\it\alpha}<1$
for the original hetons, as the four hetons produced are fundamentally different from the original ones. This example illustrates all cases marked by the symbol
 $\times$
in table 1.
$\times$
in table 1.

Figure 13. Flow evolution for symmetric finite core hetons with
 ${\it\varrho}=3.5$
,
${\it\varrho}=3.5$
,
 $d_{y}=0.1$
and
$d_{y}=0.1$
and
 $\ell _{z}=1.5$
. The times displayed are
$\ell _{z}=1.5$
. The times displayed are
 $t=0$
, 17.5, 50 and 87.5. The hetons break into four hetons which reverse trajectory (label
$t=0$
, 17.5, 50 and 87.5. The hetons break into four hetons which reverse trajectory (label
 $\times$
in table 1).
$\times$
in table 1).
We next increase the parameter
 ${\it\alpha}$
with
${\it\alpha}$
with
 ${\it\varrho}=4.5$
,
${\it\varrho}=4.5$
,
 $d_{y}=0.25$
and
$d_{y}=0.25$
and
 $\ell _{z}=1$
. This example illustrates all cases indicated by the symbol ▵ in table 1. Results are presented in figure 14. Obviously,
$\ell _{z}=1$
. This example illustrates all cases indicated by the symbol ▵ in table 1. Results are presented in figure 14. Obviously,
 ${\it\alpha}$
is not sufficient to qualify the behaviour as
${\it\alpha}$
is not sufficient to qualify the behaviour as
 ${\it\alpha}$
alone is not sufficient to determine the stability of the hetons. In this case
${\it\alpha}$
alone is not sufficient to determine the stability of the hetons. In this case
 ${\it\alpha}=0.56$
and is still less than 1, but the hetons are strongly unstable. The hetons break asymmetrically. The mode of instability is likely to be a mixture of azimuthal modes
${\it\alpha}=0.56$
and is still less than 1, but the hetons are strongly unstable. The hetons break asymmetrically. The mode of instability is likely to be a mixture of azimuthal modes
 $l=2$
and
$l=2$
and
 $l=3$
. The nature of the instability modes is important for the evolution of the flow. We saw in the previous example that the azimuthal mode
$l=3$
. The nature of the instability modes is important for the evolution of the flow. We saw in the previous example that the azimuthal mode
 $l=2$
was mainly generating four hetons out of the original two. These hetons were at least initially moving away from one another. Here, more secondary hetons are generated. Six principal hetons can be identified, the larger two near the centre. The new main hetons generated by the destabilisation of the original pair are separated further away in the direction
$l=2$
was mainly generating four hetons out of the original two. These hetons were at least initially moving away from one another. Here, more secondary hetons are generated. Six principal hetons can be identified, the larger two near the centre. The new main hetons generated by the destabilisation of the original pair are separated further away in the direction
 $y$
. Shortly after the breakup the four larger vortices are located at
$y$
. Shortly after the breakup the four larger vortices are located at
 $y\pm 0.8$
and
$y\pm 0.8$
and
 $z\sim \pm 0.3$
, giving
$z\sim \pm 0.3$
, giving
 ${\it\alpha}\sim 2.6>1$
. It should be pointed out that at this stage these vortices are still surrounded by close secondary vortices having a non-negligible influence on the overall dynamics. Nonetheless, the two main hetons eventually escape perpendicularly to their original trajectory.
${\it\alpha}\sim 2.6>1$
. It should be pointed out that at this stage these vortices are still surrounded by close secondary vortices having a non-negligible influence on the overall dynamics. Nonetheless, the two main hetons eventually escape perpendicularly to their original trajectory.

Figure 14. Flow evolution for symmetric finite core hetons with
 ${\it\varrho}=4.5$
,
${\it\varrho}=4.5$
,
 $d_{y}=0.25$
and
$d_{y}=0.25$
and
 $\ell _{z}=1$
at
$\ell _{z}=1$
at
 $t=0$
, 15, 50 and 162.5. The hetons break into more than four hetons. The main two hetons escape (label ▵ in table 1).
$t=0$
, 15, 50 and 162.5. The hetons break into more than four hetons. The main two hetons escape (label ▵ in table 1).
We now consider a situation where the parameter
 ${\it\alpha}$
is larger while keeping
${\it\alpha}$
is larger while keeping
 ${\it\varrho}$
as small as reasonably possible and both
${\it\varrho}$
as small as reasonably possible and both
 $d_{y}$
and
$d_{y}$
and
 $\ell _{z}$
reasonably large. We consider
$\ell _{z}$
reasonably large. We consider
 ${\it\varrho}=2.5$
,
${\it\varrho}=2.5$
,
 $d_{y}=1$
and
$d_{y}=1$
and
 $\ell _{z}=1$
. This example illustrates all cases denoted by the symbol ▫ in table 1. This set-up has
$\ell _{z}=1$
. This example illustrates all cases denoted by the symbol ▫ in table 1. This set-up has
 ${\it\alpha}=1.25>1$
and keeps the hetons in a region of only weak instability in the parameter space. Results are shown in figure 15. Here, as expected, the hetons only shed a small amount of debris before escaping as hetons in a way rather similar to what equivalent point vortices would do.
${\it\alpha}=1.25>1$
and keeps the hetons in a region of only weak instability in the parameter space. Results are shown in figure 15. Here, as expected, the hetons only shed a small amount of debris before escaping as hetons in a way rather similar to what equivalent point vortices would do.

Figure 15. Flow evolution for symmetric finite core hetons with
 ${\it\varrho}=2.5$
,
${\it\varrho}=2.5$
,
 $d_{y}=1$
and
$d_{y}=1$
and
 $\ell _{z}=1$
at
$\ell _{z}=1$
at
 $t=0$
, 17.5, 40 and 62.5. The hetons shed some debris and escape (label ▫ in table 1).
$t=0$
, 17.5, 40 and 62.5. The hetons shed some debris and escape (label ▫ in table 1).
The four previous examples have illustrated what could be considered as a generic behaviour in the range of parameters investigated. However, due to the richness and complexity of the various effects in competition, the dynamics of a pair of symmetric hetons may prove to be far more complex. This is in particular the case when the original hetons are so strongly unstable that their mutual interaction is no longer one that can be associated with a pair of hetons.
For example, we present the case for
 ${\it\varrho}=5.5$
,
${\it\varrho}=5.5$
,
 $d_{y}=0.1$
and
$d_{y}=0.1$
and
 $d_{z}=0.5$
in figure 16. This corresponds to the largest aspect ratio investigated with smaller vertical and horizontal offset considered, and corresponds to the most baroclinically unstable set-up investigated here. In this case the hetons break violently into many secondary structures. It should be noted that in this context not only are the hetons very strongly unstable but they are only very slowly translating towards each other. By the time some of the PV reaches the centre of the domain nothing really resembles hetonic structures, and the flow is mostly turbulent.
$d_{z}=0.5$
in figure 16. This corresponds to the largest aspect ratio investigated with smaller vertical and horizontal offset considered, and corresponds to the most baroclinically unstable set-up investigated here. In this case the hetons break violently into many secondary structures. It should be noted that in this context not only are the hetons very strongly unstable but they are only very slowly translating towards each other. By the time some of the PV reaches the centre of the domain nothing really resembles hetonic structures, and the flow is mostly turbulent.

Figure 16. Flow evolution for symmetric finite core hetons with
 ${\it\varrho}=5.5$
,
${\it\varrho}=5.5$
,
 $d_{y}=0.1$
and
$d_{y}=0.1$
and
 $\ell _{z}=0.5$
at
$\ell _{z}=0.5$
at
 $t=0$
, 50, 125, 200 (label ♢ in table 1).
$t=0$
, 50, 125, 200 (label ♢ in table 1).
We next propose a general comment on the flow evolution, considering the parameter
 ${\it\alpha}={\it\varrho}d_{y}/(1+\ell _{z})$
. Large values of
${\it\alpha}={\it\varrho}d_{y}/(1+\ell _{z})$
. Large values of
 $\ell _{z}$
with small values of
$\ell _{z}$
with small values of
 ${\it\varrho}d_{y}$
may favour reversal of the heton trajectories. However, small values of the product of
${\it\varrho}d_{y}$
may favour reversal of the heton trajectories. However, small values of the product of
 ${\it\varrho}$
and
${\it\varrho}$
and
 $d_{y}$
may be obtained by two limits. Taking
$d_{y}$
may be obtained by two limits. Taking
 $d_{y}$
fixed and making
$d_{y}$
fixed and making
 ${\it\varrho}$
smaller increases the stability of the hetons. In this case, the hetons may remain compact and behave in a way that is consistent with the point vortex calculation. On the other hand, setting
${\it\varrho}$
smaller increases the stability of the hetons. In this case, the hetons may remain compact and behave in a way that is consistent with the point vortex calculation. On the other hand, setting
 ${\it\varrho}$
and decreasing
${\it\varrho}$
and decreasing
 $d_{y}$
tends to increase the baroclinic instability (as the growth rate of the instabilities is maximum for
$d_{y}$
tends to increase the baroclinic instability (as the growth rate of the instabilities is maximum for
 $d_{y}=0$
). The subsequent development of the flow may depend on the dominant mode of instability, in particular the number of secondary hetons generated and their locations. The azimuthal mode
$d_{y}=0$
). The subsequent development of the flow may depend on the dominant mode of instability, in particular the number of secondary hetons generated and their locations. The azimuthal mode
 $l=2$
may favour the formation of four hetons which initially escape. A combination of azimuthal modes
$l=2$
may favour the formation of four hetons which initially escape. A combination of azimuthal modes
 $l=2$
and
$l=2$
and
 $l=3$
may favour the formation of six strongly asymmetric hetons. Two of them may remain central in
$l=3$
may favour the formation of six strongly asymmetric hetons. Two of them may remain central in
 $x$
and escape along
$x$
and escape along
 $y$
.
$y$
.
On the other hand, large values of
 ${\it\alpha}$
mean large values for the product
${\it\alpha}$
mean large values for the product
 ${\it\varrho}d_{y}$
and small values for
${\it\varrho}d_{y}$
and small values for
 $\ell _{z}$
. The smaller
$\ell _{z}$
. The smaller
 $\ell _{z}$
is, the more unstable the hetons are. To reach large values of the product of
$\ell _{z}$
is, the more unstable the hetons are. To reach large values of the product of
 ${\it\varrho}\,d_{y}$
we can increase each of them with different effects as discussed above, large
${\it\varrho}\,d_{y}$
we can increase each of them with different effects as discussed above, large
 ${\it\varrho}$
favouring instability while large
${\it\varrho}$
favouring instability while large
 $d_{y}$
favours stability.
$d_{y}$
favours stability.
We finally compute the volumes (
 $V_{1}\geqslant V_{2}\geqslant V_{3}\geqslant V_{4}$
) of the four largest vortices present in the flow at the end of the simulation (
$V_{1}\geqslant V_{2}\geqslant V_{3}\geqslant V_{4}$
) of the four largest vortices present in the flow at the end of the simulation (
 $t=400$
), and compare them with the initial volume of the poles (all identical initially). The results are presented for
$t=400$
), and compare them with the initial volume of the poles (all identical initially). The results are presented for
 $d_{y}=0.1$
in figure 17.
$d_{y}=0.1$
in figure 17.

Figure 17. Ratio of the volumes of the four largest vortices at
 $t=400$
to the initial volume for
$t=400$
to the initial volume for
 $d_{y}=0.1$
,
$d_{y}=0.1$
,
 $1.5\leqslant {\it\varrho}\leqslant 5.5$
and
$1.5\leqslant {\it\varrho}\leqslant 5.5$
and
 $\ell _{z}=0.5$
(
$\ell _{z}=0.5$
(
 $+$
), 1 (
$+$
), 1 (
 $\star$
), 1.5 (●), 2 (▪), 2.5 (♦). The figure is organised as follows: (a) largest vortex; (b) second largest vortex; (c) third largest vortex; (d) fourth largest vortex.
$\star$
), 1.5 (●), 2 (▪), 2.5 (♦). The figure is organised as follows: (a) largest vortex; (b) second largest vortex; (c) third largest vortex; (d) fourth largest vortex.
Qualitatively, the behaviour is similar for all four vortices, and we can clearly see the influence of the baroclinic instability of the poles. In figure 17,
 $d_{y}=0.1$
is fixed, and the varying parameters are
$d_{y}=0.1$
is fixed, and the varying parameters are
 $r/h$
and
$r/h$
and
 $\ell _{z}$
. The regions where the vortices lose the most of their volume correspond to the regions in the parameter space where they are expected to experience strong baroclinic instability: large values of
$\ell _{z}$
. The regions where the vortices lose the most of their volume correspond to the regions in the parameter space where they are expected to experience strong baroclinic instability: large values of
 ${\it\varrho}$
and small vertical offset
${\it\varrho}$
and small vertical offset
 $\ell _{z}$
. On the other hand, for small aspect ratio and large vertical offset, the vortices are expected to be only marginally if even affected by the baroclinic instability and the vortices retain most of their PV.
$\ell _{z}$
. On the other hand, for small aspect ratio and large vertical offset, the vortices are expected to be only marginally if even affected by the baroclinic instability and the vortices retain most of their PV.
3.4.2. Antisymmetric hetons
We next turn our attention to antisymmetric pairs of hetons. In this case opposite-signed vortices are at the same depth. The first main difference from the symmetric pair is that we have seen that the point vortices always have qualitatively the same behaviour. The poles of the hetons recombine as dipolar structures. Each dipole consists of the two vortices located at the same depth from the original hetons. Now, the parameter
 ${\it\alpha}$
no longer segregates two different regimes, one for
${\it\alpha}$
no longer segregates two different regimes, one for
 ${\it\alpha}<1$
and one for
${\it\alpha}<1$
and one for
 ${\it\alpha}>1$
. The second main difference is that vortex merger is no longer possible. Indeed the like-signed vortices are located at different depths and do not share any common horizontal cross-section on which they could touch to merge. However, Reinaud & Dritschel (Reference Reinaud and Dritschel2009) showed that the interaction between counter-rotating vortices could lead to destructive interactions where the vortices break into secondary vortices. Finally, as before, the hetons themselves can be subject to the baroclinic instability provided that the poles are wide enough and their horizontal and/or vertical separation is small enough.
${\it\alpha}>1$
. The second main difference is that vortex merger is no longer possible. Indeed the like-signed vortices are located at different depths and do not share any common horizontal cross-section on which they could touch to merge. However, Reinaud & Dritschel (Reference Reinaud and Dritschel2009) showed that the interaction between counter-rotating vortices could lead to destructive interactions where the vortices break into secondary vortices. Finally, as before, the hetons themselves can be subject to the baroclinic instability provided that the poles are wide enough and their horizontal and/or vertical separation is small enough.
Table 2 summarises the types of interactions observed. As in the previous section, a summary of the evolution is provided in the graphs presented in figure 18.
Table 2. Meaning of the symbols used to describe the outcome of the interactions between two antisymmetric hetons.


Figure 18. Finite core antisymmetric hetons: regimes in the plane
 ${\it\varrho}$
–
${\it\varrho}$
–
 $\ell _{z}$
for (a)
$\ell _{z}$
for (a)
 $d_{y}={\rm\Delta}y/r=0.1$
, (b) 0.25, (c) 0.5, (d) 0.75 and (e) 1. The meaning of all symbols is defined in table 2. An underlined symbol indicates that the vortices produced by the first main interaction experience further strong interaction as they escape. A barred symbol indicates that the original baroclinic instability only produces a small amount of debris.
$d_{y}={\rm\Delta}y/r=0.1$
, (b) 0.25, (c) 0.5, (d) 0.75 and (e) 1. The meaning of all symbols is defined in table 2. An underlined symbol indicates that the vortices produced by the first main interaction experience further strong interaction as they escape. A barred symbol indicates that the original baroclinic instability only produces a small amount of debris.
For small aspect ratios
 ${\it\varrho}$
and large vertical offsets
${\it\varrho}$
and large vertical offsets
 $\ell _{z}$
and/or large horizontal offsets
$\ell _{z}$
and/or large horizontal offsets
 $d_{y}$
the hetons are again expected to be stable to baroclinic modes. They are therefore expected to remain compact and, at least at the beginning, act in a way similar to point vortices. For larger values of the aspect ratio
$d_{y}$
the hetons are again expected to be stable to baroclinic modes. They are therefore expected to remain compact and, at least at the beginning, act in a way similar to point vortices. For larger values of the aspect ratio
 ${\it\varrho}$
and/or smaller values of the separation distances
${\it\varrho}$
and/or smaller values of the separation distances
 $\ell _{z}$
and
$\ell _{z}$
and
 $d_{y}$
the hetons may be unstable. If the instability is weak, the hetons are likely to only shed some debris instead of breaking into two main secondary hetons. The poles of the hetons may recombine as dipoles which may break into further secondary structures. In the case of strongly unstable hetons, the evolution of the flow is likely to be linked to the spatial structure of the dominant azimuthal mode (mode
$d_{y}$
the hetons may be unstable. If the instability is weak, the hetons are likely to only shed some debris instead of breaking into two main secondary hetons. The poles of the hetons may recombine as dipoles which may break into further secondary structures. In the case of strongly unstable hetons, the evolution of the flow is likely to be linked to the spatial structure of the dominant azimuthal mode (mode
 $l=2$
or
$l=2$
or
 $l=3$
in the present study). The azimuthal mode
$l=3$
in the present study). The azimuthal mode
 $l=2$
may break each heton into two main secondary hetons, which may translate away (as seen in the previous case). Mode 3 may break each heton into three structures which would lead to an overall different distribution of PV. Two of the hetons may remain close to the centre of the domain and later escape as dipoles. These dipoles may be unstable and further break as they move away. Finally, in the most unstable configuration, the heton may break baroclinically in such a complex way that the subsequent evolution is turbulent-like, as was observed for the symmetric pair of hetons. We now illustrate all of these cases in our parameter space.
$l=2$
may break each heton into two main secondary hetons, which may translate away (as seen in the previous case). Mode 3 may break each heton into three structures which would lead to an overall different distribution of PV. Two of the hetons may remain close to the centre of the domain and later escape as dipoles. These dipoles may be unstable and further break as they move away. Finally, in the most unstable configuration, the heton may break baroclinically in such a complex way that the subsequent evolution is turbulent-like, as was observed for the symmetric pair of hetons. We now illustrate all of these cases in our parameter space.
We start with a case where we expect the hetons to be stable. For this we consider a small value for the aspect ratio with
 ${\it\varrho}=1.5$
and a large value of the vertical separation
${\it\varrho}=1.5$
and a large value of the vertical separation
 $\ell _{z}=1$
. Here, we take
$\ell _{z}=1$
. Here, we take
 $d_{y}=0.1$
which is the smallest value considered. The results show that, of course, increasing
$d_{y}=0.1$
which is the smallest value considered. The results show that, of course, increasing
 $d_{y}$
goes in favour of the stability of hetons, hence the same behaviour is observed. The flow evolution is presented in figure 19. The hetons get close enough and the interaction between the vortices at the same depth becomes stronger. The poles of the hetons recombine as same-depth dipoles. The dipoles formed move away perpendicularly from the original trajectory. At
$d_{y}$
goes in favour of the stability of hetons, hence the same behaviour is observed. The flow evolution is presented in figure 19. The hetons get close enough and the interaction between the vortices at the same depth becomes stronger. The poles of the hetons recombine as same-depth dipoles. The dipoles formed move away perpendicularly from the original trajectory. At
 $t=50$
, the poles of the dipoles are offset by a distance
$t=50$
, the poles of the dipoles are offset by a distance
 ${\rm\Delta}x/r\simeq 1.58$
. Similar cases are indicated by the symbol ▫ in figure 18. This behaviour appears to be generic to small values of
${\rm\Delta}x/r\simeq 1.58$
. Similar cases are indicated by the symbol ▫ in figure 18. This behaviour appears to be generic to small values of
 ${\it\varrho}$
and large values of
${\it\varrho}$
and large values of
 $\ell _{z}$
, i.e. the left top corners of each graph in figure 18.
$\ell _{z}$
, i.e. the left top corners of each graph in figure 18.

Figure 19. Flow evolution for antisymmetric finite core hetons with
 ${\it\varrho}=1.5$
,
${\it\varrho}=1.5$
,
 $d_{y}=0.1$
and
$d_{y}=0.1$
and
 $\ell _{z}=1$
at
$\ell _{z}=1$
at
 $t=0$
,
$t=0$
,
 $t=95$
, 110 and 120. The hetons interact and the poles escape as dipoles (label ▫ in table 2).
$t=95$
, 110 and 120. The hetons interact and the poles escape as dipoles (label ▫ in table 2).
Increasing the aspect ratio to
 ${\it\varrho}=5$
makes the heton more unstable. However, compensating this by an increase of the horizontal offset to
${\it\varrho}=5$
makes the heton more unstable. However, compensating this by an increase of the horizontal offset to
 $d_{y}=1$
we find a case where the hetons are only weakly unstable. The flow evolution is presented in figure 20 (here
$d_{y}=1$
we find a case where the hetons are only weakly unstable. The flow evolution is presented in figure 20 (here
 $\ell _{z}=1$
as previously). The poles of the hetons shed a small amount of debris but the two hetons start to interact and recombine as same-depth dipoles before the hetons have the time to fully destabilise. In other words, the time scale associated with the baroclinic instability is very large compared with the time scale associated with the motion of the poles. At
$\ell _{z}=1$
as previously). The poles of the hetons shed a small amount of debris but the two hetons start to interact and recombine as same-depth dipoles before the hetons have the time to fully destabilise. In other words, the time scale associated with the baroclinic instability is very large compared with the time scale associated with the motion of the poles. At
 $t=125$
, the poles of the dipoles are at a distance of
$t=125$
, the poles of the dipoles are at a distance of
 ${\rm\Delta}x/r\simeq 1.06$
and the dipoles do not strongly destabilise. Such an interaction is referred to by the symbol
${\rm\Delta}x/r\simeq 1.06$
and the dipoles do not strongly destabilise. Such an interaction is referred to by the symbol
 $\times$
in figure 18 and is found for large values of
$\times$
in figure 18 and is found for large values of
 $d_{y}$
only.
$d_{y}$
only.

Figure 20. Flow evolution for antisymmetric finite core hetons with
 ${\it\varrho}=2.5$
,
${\it\varrho}=2.5$
,
 $d_{y}=1$
and
$d_{y}=1$
and
 $\ell _{z}=1$
at
$\ell _{z}=1$
at
 $t=0$
, 20, 30 and 45. The hetons shed some debris and recombine as dipoles which escape (label
$t=0$
, 20, 30 and 45. The hetons shed some debris and recombine as dipoles which escape (label
 $\times$
in table 2).
$\times$
in table 2).
For smaller values of
 $d_{y}$
but retaining
$d_{y}$
but retaining
 ${\it\varrho}$
small enough and
${\it\varrho}$
small enough and
 $\ell _{z}$
large enough, we remain in a region of the parameter space where the hetons are either stable or only weakly unstable. However, the dipolar structures generated by the recombination of the poles of the hetons are now unstable. From the point vortex calculation, and in particular figure 8, we see that a decrease in the original horizontal separation distance between the poles of the hetons denoted there
$\ell _{z}$
large enough, we remain in a region of the parameter space where the hetons are either stable or only weakly unstable. However, the dipolar structures generated by the recombination of the poles of the hetons are now unstable. From the point vortex calculation, and in particular figure 8, we see that a decrease in the original horizontal separation distance between the poles of the hetons denoted there
 ${\rm\Delta}y$
induces a decrease of the distance
${\rm\Delta}y$
induces a decrease of the distance
 ${\rm\Delta}x$
separating the two poles of the dipolar structures in the late evolution of the flow. The smaller this distance is the more likely the dipoles are to be unstable. Indeed, the destructive interaction between two counter-rotating vortices is associated with a critical separation distance between the poles, as discussed in Reinaud & Dritschel (Reference Reinaud and Dritschel2009). Such a type of flow behaviour is indicated by the symbol ◃ in figure 18. This regime is typically found along the diagonal region (or upper band for small
${\rm\Delta}x$
separating the two poles of the dipolar structures in the late evolution of the flow. The smaller this distance is the more likely the dipoles are to be unstable. Indeed, the destructive interaction between two counter-rotating vortices is associated with a critical separation distance between the poles, as discussed in Reinaud & Dritschel (Reference Reinaud and Dritschel2009). Such a type of flow behaviour is indicated by the symbol ◃ in figure 18. This regime is typically found along the diagonal region (or upper band for small
 $d_{y}$
) in the graphs of figure 18. A typical example is for
$d_{y}$
) in the graphs of figure 18. A typical example is for
 ${\it\varrho}=3.5$
,
${\it\varrho}=3.5$
,
 $d_{y}=0.75$
and
$d_{y}=0.75$
and
 $\ell _{z}=2$
, and is presented in figure 21. The beginning of the flow evolution is similar to the case ▫; however, the two dipoles consist of two close highly deformed vortices which break asymmetrically, producing further tertiary dipolar structures. Just before breaking, the dipoles are closer than in the previous case shown with
$\ell _{z}=2$
, and is presented in figure 21. The beginning of the flow evolution is similar to the case ▫; however, the two dipoles consist of two close highly deformed vortices which break asymmetrically, producing further tertiary dipolar structures. Just before breaking, the dipoles are closer than in the previous case shown with
 ${\rm\Delta}x/r\simeq 0.99$
at
${\rm\Delta}x/r\simeq 0.99$
at
 $t=60$
.
$t=60$
.

Figure 21. Flow evolution for antisymmetric finite core hetons with
 ${\it\varrho}=3.5$
,
${\it\varrho}=3.5$
,
 $d_{y}=0.75$
and
$d_{y}=0.75$
and
 $\ell _{z}=2$
at
$\ell _{z}=2$
at
 $t=0$
, 50, 100 and 125. The hetons interact and the poles escape as dipoles which undergo a destructive interaction (label
$t=0$
, 50, 100 and 125. The hetons interact and the poles escape as dipoles which undergo a destructive interaction (label
 $\bar{{\vartriangleleft}}$
in table 2).
$\bar{{\vartriangleleft}}$
in table 2).
By increasing the value of
 ${\it\varrho}$
we reach regions of the parameter space where the hetons are more unstable. For intermediate values of
${\it\varrho}$
we reach regions of the parameter space where the hetons are more unstable. For intermediate values of
 ${\it\varrho}$
and
${\it\varrho}$
and
 $\ell _{z}$
the dominant mode of the baroclinic instability has an azimuthal wavenumber
$\ell _{z}$
the dominant mode of the baroclinic instability has an azimuthal wavenumber
 $l=2$
, as expected. In this case the original hetons break into two secondary hetons, in a similar way to how the symmetric pair of hetons does. The newly generated secondary hetons move away (at least initially) from the centre of the domain. An example of such behaviour is presented in figure 22 for
$l=2$
, as expected. In this case the original hetons break into two secondary hetons, in a similar way to how the symmetric pair of hetons does. The newly generated secondary hetons move away (at least initially) from the centre of the domain. An example of such behaviour is presented in figure 22 for
 ${\it\varrho}=5.5$
,
${\it\varrho}=5.5$
,
 $\ell _{z}=2.5$
and
$\ell _{z}=2.5$
and
 $d_{y}=0.1$
. Such cases are observed in the diagonal region in the graphs of figure 18 for small
$d_{y}=0.1$
. Such cases are observed in the diagonal region in the graphs of figure 18 for small
 $d_{y}$
only and are indicated by the symbol *. For larger values of
$d_{y}$
only and are indicated by the symbol *. For larger values of
 $d_{y}$
the configuration is either not unstable enough or the azimuthal mode
$d_{y}$
the configuration is either not unstable enough or the azimuthal mode
 $l=3$
becomes dominant (cases discussed below). It should be noted that the subsequent evolution (not shown) can be more complex, with the hetons eventually changing trajectory and strongly interacting with one another. Similar late behaviours are observed in the case of the symmetric pair of hetons.
$l=3$
becomes dominant (cases discussed below). It should be noted that the subsequent evolution (not shown) can be more complex, with the hetons eventually changing trajectory and strongly interacting with one another. Similar late behaviours are observed in the case of the symmetric pair of hetons.

Figure 22. Flow evolution for antisymmetric finite core hetons with
 ${\it\varrho}=5.5$
,
${\it\varrho}=5.5$
,
 $d_{y}=0.1$
and
$d_{y}=0.1$
and
 $\ell _{z}=2.5$
at
$\ell _{z}=2.5$
at
 $t=0$
, 50, 100, 150. The hetons break baroclinically into four hetons then move away (label * in table 2).
$t=0$
, 50, 100, 150. The hetons break baroclinically into four hetons then move away (label * in table 2).
By taking
 $\ell _{z}$
smaller than in the last case, the mode with azimuthal wavenumber
$\ell _{z}$
smaller than in the last case, the mode with azimuthal wavenumber
 $l=3$
becomes stronger and each heton initially breaks into three secondary hetons, that is six hetons overall. Two of them (the largest ones) remain at the centre of the domain and recombine as dipoles which move away as point vortices would do. An example is provided in figure 23 with
$l=3$
becomes stronger and each heton initially breaks into three secondary hetons, that is six hetons overall. Two of them (the largest ones) remain at the centre of the domain and recombine as dipoles which move away as point vortices would do. An example is provided in figure 23 with
 ${\it\varrho}=5.5$
,
${\it\varrho}=5.5$
,
 $\ell _{z}=0.5$
and
$\ell _{z}=0.5$
and
 $d_{y}=0.25$
. The original pair of hetons has broken into six hetons by
$d_{y}=0.25$
. The original pair of hetons has broken into six hetons by
 $t=50$
. The two central ones exhibit poles well separated in the horizontal. They first converge towards one another until the poles at the same depth recombine as dipolar structures which move away mostly in the
$t=50$
. The two central ones exhibit poles well separated in the horizontal. They first converge towards one another until the poles at the same depth recombine as dipolar structures which move away mostly in the
 $y$
direction. The secondary hetons originally move away from the centre but exhibit a more complex later evolution. These interactions are indicated by the symbol ▵ in figure 18 and are generic to small
$y$
direction. The secondary hetons originally move away from the centre but exhibit a more complex later evolution. These interactions are indicated by the symbol ▵ in figure 18 and are generic to small
 $\ell _{z}$
and large
$\ell _{z}$
and large
 ${\it\varrho}$
, i.e. the bottom right corner of the graphs of figure 18. The loss of symmetry in
${\it\varrho}$
, i.e. the bottom right corner of the graphs of figure 18. The loss of symmetry in
 $x$
and
$x$
and
 $y$
comes from the low-amplitude numerical noise and the development of turbulence.
$y$
comes from the low-amplitude numerical noise and the development of turbulence.

Figure 23. Flow evolution for antisymmetric finite core hetons with
 ${\it\varrho}=5$
,
${\it\varrho}=5$
,
 $d_{y}=0.25$
and
$d_{y}=0.25$
and
 $\ell _{z}=0.5$
at
$\ell _{z}=0.5$
at
 $t=0$
, 12.5, 25, 50, 75, 100, 135.5 and 190. The hetons break baroclinically into two dipoles and four hetons. The dipoles eventually escape (label
$t=0$
, 12.5, 25, 50, 75, 100, 135.5 and 190. The hetons break baroclinically into two dipoles and four hetons. The dipoles eventually escape (label
 $\bar{\triangle }$
in table 2).
$\bar{\triangle }$
in table 2).
Finally, as was the case for the symmetric pair of hetons, the case with
 ${\it\varrho}=5.5$
,
${\it\varrho}=5.5$
,
 $d_{y}=0.1$
and
$d_{y}=0.1$
and
 $\ell _{z}=0.5$
(not presented), corresponding to the most baroclinic unstable configuration, exhibits a turbulent-like behaviour and is indicated by a ♢ in figure 18.
$\ell _{z}=0.5$
(not presented), corresponding to the most baroclinic unstable configuration, exhibits a turbulent-like behaviour and is indicated by a ♢ in figure 18.
It should be noted that, in several simulations, the poles of the hetons become tilted vertically, or elongated asymmetrically at the upper and lower surfaces, and that finally, via filamentation, many fragments are shed from these poles. These fragments not only have smaller horizontal size than the original hetons, but also shorter vertical scales.
3.5. Comparison between models
We offer here a brief comparison between the results obtained with the point vortex model and the finite core model. As stated before, the point vortex model is a simple and computationally efficient model to describe at leading order the trajectory of the poles of the hetons. The relevance of the point vortex model is all the better as the poles can be accurately represented by singularities, and therefore are not prone to deformation modes (Rossby waves travelling on PV contours). Therefore, we cannot expect the point vortex model to represent any behaviour observed for the finite core model when baroclinic modes or horizontal-shear-induced deformations have a dominant influence. We will not therefore perform a quantitative comparison for such cases.
On the other hand, when the poles are robust and retain their shape, the point vortex model may provide a good prediction of the behaviour of the poles. We have indeed observed behaviour for finite core hetons such as pole escape or reverse, predicted by the calculation based on the singularities. We know then that qualitatively the point vortex model is an efficient way to understand the flow behaviour even in the complex case of finite core vortices. The limits of the point vortex model reside then essentially in its capacity to model quantitatively the flow induced by the poles. In the same way that the external flow induced by a Rankine vortex (cylinder of uniform vorticity) matches exactly the flow induced by a singularity of the same circulation in two dimensions, one can show that the external flow induced by a uniform sphere of PV is the same as the one induced by a singularity of the same strength located at its centre (by means of Gauss’ theorem). If the poles were non-deforming spheres, their trajectory obtained by the point vortex calculation would match exactly the trajectory of the finite cores. In this paper we are interested in the behaviour of hetons in regions of the parameter space where such global behaviour enters in competition with instabilities. This means in practice that we focus on wide vortices, with width-to-height aspect ratios typically larger than one (or
 ${\it\rho}>0.5$
). Such vortices are not well represented by a single singularity. The influence of the shape of a vortex on the flow it induces is a non-trivial problem. At leading order, the first effects of the deformation of a vortex from a spherical shape can be captured by modelling the vortex by a best fitted ellipsoid. The velocity field associated with the ellipsoidal volume of the PV is known and is complex. This topic is addressed in detail in Dritschel, Reinaud & McKiver (Reference Dritschel, Reinaud and McKiver2004) and further consideration is included in Reinaud & Dritschel (Reference Reinaud and Dritschel2005) and references therein. Reinaud (Reference Reinaud2015) indeed compared the translation velocity of hetons at equilibrium with the velocity obtained from equivalent singular hetons (point vortices of the same strength located at the centre of the poles). It was shown that the two calculations agree quantitatively, as expected, when the poles have an aspect ratio close to
${\it\rho}>0.5$
). Such vortices are not well represented by a single singularity. The influence of the shape of a vortex on the flow it induces is a non-trivial problem. At leading order, the first effects of the deformation of a vortex from a spherical shape can be captured by modelling the vortex by a best fitted ellipsoid. The velocity field associated with the ellipsoidal volume of the PV is known and is complex. This topic is addressed in detail in Dritschel, Reinaud & McKiver (Reference Dritschel, Reinaud and McKiver2004) and further consideration is included in Reinaud & Dritschel (Reference Reinaud and Dritschel2005) and references therein. Reinaud (Reference Reinaud2015) indeed compared the translation velocity of hetons at equilibrium with the velocity obtained from equivalent singular hetons (point vortices of the same strength located at the centre of the poles). It was shown that the two calculations agree quantitatively, as expected, when the poles have an aspect ratio close to
 ${\it\rho}=0.5$
. In this case indeed the poles are well represented by the singularities. However, the point vortex approximation overestimates the translation velocity for flatter poles.
${\it\rho}=0.5$
. In this case indeed the poles are well represented by the singularities. However, the point vortex approximation overestimates the translation velocity for flatter poles.
We present in figure 24 four results in which we compare the trajectories of finite core hetons and their equivalent point vortex representation. We only focus on the situation where the hetons are not subjected to any strong instability. For poles that are as high as they are wide, which corresponds to
 ${\it\rho}=0.5$
, the poles are compact and are well represented by singularities. Trajectories are presented for both a symmetric case and an antisymmetric case (figure 24
a,c). Not only are the trajectories almost exactly superimposed but the time-dependent locations of the poles are the same. For wider vortices (two cases with
${\it\rho}=0.5$
, the poles are compact and are well represented by singularities. Trajectories are presented for both a symmetric case and an antisymmetric case (figure 24
a,c). Not only are the trajectories almost exactly superimposed but the time-dependent locations of the poles are the same. For wider vortices (two cases with
 ${\it\rho}=1.5$
), the quantitative comparison between the trajectories shows that the point vortices have higher velocities then the wider finite core hetons. Moreover, although the trajectories of the vortices are qualitatively similar (the vortices indeed escape for the antisymmetric case or reverse for the symmetric case), we observe a deviation of the trajectories. This difference is due to the influence of the initial shape of the vortices, as well as the time-dependent deformation of the finite core poles. In conclusion, the point vortex approximation is an efficient and accurate tool to predict the qualitative behaviour of the hetons when the hetons are not subjected to strong deformation associated with vortex instabilities. It can also predict qualitatively accurately the trajectories of hetons with stable compact (vortices as wide as tall) cores. However, as expected from previous studies of vortices with different aspect ratios, the point vortex model fails to capture accurately the translation velocities, and, as a consequence, the exact trajectories of finite core hetons for deformed vortices. Nonetheless, the point vortex approximation remains an extremely powerful (and fast) tool to investigate the trends for the heton behaviour, at virtually no numerical cost compared with the finite core analysis.
${\it\rho}=1.5$
), the quantitative comparison between the trajectories shows that the point vortices have higher velocities then the wider finite core hetons. Moreover, although the trajectories of the vortices are qualitatively similar (the vortices indeed escape for the antisymmetric case or reverse for the symmetric case), we observe a deviation of the trajectories. This difference is due to the influence of the initial shape of the vortices, as well as the time-dependent deformation of the finite core poles. In conclusion, the point vortex approximation is an efficient and accurate tool to predict the qualitative behaviour of the hetons when the hetons are not subjected to strong deformation associated with vortex instabilities. It can also predict qualitatively accurately the trajectories of hetons with stable compact (vortices as wide as tall) cores. However, as expected from previous studies of vortices with different aspect ratios, the point vortex model fails to capture accurately the translation velocities, and, as a consequence, the exact trajectories of finite core hetons for deformed vortices. Nonetheless, the point vortex approximation remains an extremely powerful (and fast) tool to investigate the trends for the heton behaviour, at virtually no numerical cost compared with the finite core analysis.

Figure 24. Top view of the trajectory of the pole centres for finite core hetons (●) and point vortices (solid line): (a) symmetric case with
 ${\it\rho}=0.5$
,
${\it\rho}=0.5$
,
 $\ell _{z}=1.5$
and
$\ell _{z}=1.5$
and
 $d_{y}=1$
; (b) symmetric case with
$d_{y}=1$
; (b) symmetric case with
 ${\it\rho}=1.5$
,
${\it\rho}=1.5$
,
 $\ell _{z}=1$
and
$\ell _{z}=1$
and
 $d_{y}=0.5$
; (c) antisymmetric case with
$d_{y}=0.5$
; (c) antisymmetric case with
 ${\it\rho}=0.5$
,
${\it\rho}=0.5$
,
 $\ell _{z}=1.5$
and
$\ell _{z}=1.5$
and
 $d_{y}=1$
; (d) antisymmetric case with
$d_{y}=1$
; (d) antisymmetric case with
 ${\it\rho}=1.5$
,
${\it\rho}=1.5$
,
 $\ell _{z}=1$
and
$\ell _{z}=1$
and
 $d_{y}=0.1$
.
$d_{y}=0.1$
.
4. Tall hetons
Reinaud & Carton (Reference Reinaud and Carton2009) showed that in the continuous stratification case where many vertical modes are allowed, the azimuthal mode
 $l=1$
could be unstable for an isolated vertically aligned heton. This instability only exists in a small area of the parameter space, for very small aspect ratio
$l=1$
could be unstable for an isolated vertically aligned heton. This instability only exists in a small area of the parameter space, for very small aspect ratio
 ${\it\varrho}$
and small vertical offsets. The instability is related to the tall-column instability discussed by Dritschel & de la Torre Juárez (Reference Dritschel1996). The mode
${\it\varrho}$
and small vertical offsets. The instability is related to the tall-column instability discussed by Dritschel & de la Torre Juárez (Reference Dritschel1996). The mode
 $l=1$
makes the columnar vortex bend and oscillate, by horizontally shifting sections of the vortices. This is especially true in the region where the two poles are close together. The amplitude of the horizontal shifting motion is depth-dependent, deforming the vortex in the vertical. In this section we illustrate the influence of this instability on the fate of the hetons.
$l=1$
makes the columnar vortex bend and oscillate, by horizontally shifting sections of the vortices. This is especially true in the region where the two poles are close together. The amplitude of the horizontal shifting motion is depth-dependent, deforming the vortex in the vertical. In this section we illustrate the influence of this instability on the fate of the hetons.
We first consider symmetric pairs of hetons. To be unstable to the mode with an azimuthal wavenumber
 $l=1$
the poles of the hetons must be reasonably close together, and hence have small
$l=1$
the poles of the hetons must be reasonably close together, and hence have small
 $d_{y}$
and small
$d_{y}$
and small
 $\ell _{z}$
. Because the hetons are very tall,
$\ell _{z}$
. Because the hetons are very tall,
 ${\it\varrho}\ll 1$
, and typical values of
${\it\varrho}\ll 1$
, and typical values of
 ${\it\alpha}\propto {\it\varrho}$
are small. Hence, the expected behaviour is that the hetons reverse trajectories. The instability makes the horizontal cross-sections of the poles shift in a non-uniform way along the vertical. The vortices strongly undulate. An example of such behaviour is presented in figure 25 with
${\it\alpha}\propto {\it\varrho}$
are small. Hence, the expected behaviour is that the hetons reverse trajectories. The instability makes the horizontal cross-sections of the poles shift in a non-uniform way along the vertical. The vortices strongly undulate. An example of such behaviour is presented in figure 25 with
 ${\it\varrho}=0.1$
,
${\it\varrho}=0.1$
,
 $d_{y}=0.1$
and
$d_{y}=0.1$
and
 $\ell _{z}=0.1$
. During the interaction the poles only shed a small amount of debris. In that sense, the interaction is not destructive. However, the oscillations of the poles are extremely large.
$\ell _{z}=0.1$
. During the interaction the poles only shed a small amount of debris. In that sense, the interaction is not destructive. However, the oscillations of the poles are extremely large.

Figure 25. Flow evolution for symmetric finite core hetons with
 ${\it\varrho}=0.1$
,
${\it\varrho}=0.1$
,
 $d_{y}=0.1$
and
$d_{y}=0.1$
and
 $\ell _{z}=0.1$
at
$\ell _{z}=0.1$
at
 $t=0$
, 10, 15 and 25.
$t=0$
, 10, 15 and 25.
All antisymmetric pairs of hetons recombine as expected and the same-depth dipoles formed escape perpendicularly. This remains the case for very tall vortices. However, again these can be unstable to the azimuthal mode
 $l=1$
. The case
$l=1$
. The case
 ${\it\varrho}=0.1$
,
${\it\varrho}=0.1$
,
 $d_{y}=0.1$
and
$d_{y}=0.1$
and
 $\ell _{z}=0.1$
is illustrated in figure 26. The poles of the hetons move as the dipoles oscillate from their vertical axis. After separation, the two poles undulate quasi-periodically. Again, the interaction is not destructive but induces an oscillating deformation on the vortices. These two cases appear to be generic in this region of the parameter space.
$\ell _{z}=0.1$
is illustrated in figure 26. The poles of the hetons move as the dipoles oscillate from their vertical axis. After separation, the two poles undulate quasi-periodically. Again, the interaction is not destructive but induces an oscillating deformation on the vortices. These two cases appear to be generic in this region of the parameter space.

Figure 26. Flow evolution for antisymmetric finite core hetons with
 ${\it\varrho}=0.1$
,
${\it\varrho}=0.1$
,
 $d_{y}=0.1$
and
$d_{y}=0.1$
and
 $\ell _{z}=0.1$
, at
$\ell _{z}=0.1$
, at
 $t=0$
, 10, 15 and 40.
$t=0$
, 10, 15 and 40.
5. Conclusion
The paper has addressed the head-on collision between two continuously stratified quasi-geostrophic hetons. The hetons are baroclinic structures consisting of two opposite strength vortices lying at different depths. The hetons are initialised such that they initially translate towards each other. Two cases are possible depending on the vertical locations of the different poles: the poles of the different hetons lying at the same depth being of the same sign or of opposite sign. We referred to the first case as symmetric hetons and the latter case as antisymmetric hetons. We first investigated the flow using the simplified point vortex approach. In the symmetric case the behaviour depends of the ratio of the vertical separation distance
 ${\rm\Delta}y$
to the vertical one
${\rm\Delta}y$
to the vertical one
 ${\rm\Delta}z$
through the influence of the two poles of one heton on the poles of the other. If
${\rm\Delta}z$
through the influence of the two poles of one heton on the poles of the other. If
 ${\rm\Delta}y<{\rm\Delta}z$
, the hetons reverse trajectory by reversing their poles. In the other case, the poles of the hetons recombine and two new hetons are formed escaping almost perpendicularly. In the case of an antisymmetric pair of point vortex hetons, the global behaviour no longer depends on the distance ratio. In all cases, the poles of the original hetons recombine as horizontal dipoles consisting of the opposite vortices of the hetons lying at the same depth. We confronted this simplified dynamics to the one of more realistic finite core hetons, in particular in terms of vortex trajectories. When the hetons have a finite volume, they may be sensitive to instabilities. First, an isolated heton may be baroclinically unstable in isolation. This instability affects wide hetons whose poles are not much separated in either the vertical or the horizontal. The azimuthal wavenumber of the most unstable mode depends on the pole aspect ratio and separation, wider vortices favouring higher modes. This is not the only instability that can affect the flow. The poles of the different hetons can strongly interact with one another. In the case of symmetric hetons, because the poles of the hetons lying at the same depth have the same PV they may merge (at least temporarily). On the other hand, in the antisymmetric case, the poles of the hetons lying at the same depth have opposite sign. While they cannot merge, the dipoles can undergo a destructive interaction. All of these effects compete in the actual time evolution of the flow. We were able to characterise the evolution in each case and to explain the various behaviours in the different regions of the parameter space investigated. The finite core hetons only act in a way similar to point vortices if they are not affected by instabilities. For baroclinically unstable hetons, the outcome of any further interaction depends on the mode of instability breaking the hetons (mode with azimuthal wavenumber
${\rm\Delta}y<{\rm\Delta}z$
, the hetons reverse trajectory by reversing their poles. In the other case, the poles of the hetons recombine and two new hetons are formed escaping almost perpendicularly. In the case of an antisymmetric pair of point vortex hetons, the global behaviour no longer depends on the distance ratio. In all cases, the poles of the original hetons recombine as horizontal dipoles consisting of the opposite vortices of the hetons lying at the same depth. We confronted this simplified dynamics to the one of more realistic finite core hetons, in particular in terms of vortex trajectories. When the hetons have a finite volume, they may be sensitive to instabilities. First, an isolated heton may be baroclinically unstable in isolation. This instability affects wide hetons whose poles are not much separated in either the vertical or the horizontal. The azimuthal wavenumber of the most unstable mode depends on the pole aspect ratio and separation, wider vortices favouring higher modes. This is not the only instability that can affect the flow. The poles of the different hetons can strongly interact with one another. In the case of symmetric hetons, because the poles of the hetons lying at the same depth have the same PV they may merge (at least temporarily). On the other hand, in the antisymmetric case, the poles of the hetons lying at the same depth have opposite sign. While they cannot merge, the dipoles can undergo a destructive interaction. All of these effects compete in the actual time evolution of the flow. We were able to characterise the evolution in each case and to explain the various behaviours in the different regions of the parameter space investigated. The finite core hetons only act in a way similar to point vortices if they are not affected by instabilities. For baroclinically unstable hetons, the outcome of any further interaction depends on the mode of instability breaking the hetons (mode with azimuthal wavenumber
 $l=2$
or
$l=2$
or
 $l=3$
in the present study). Occurrences of vortex merger (for the symmetric case) and opposite-signed destructive interaction (for the antisymmetric case) have been observed. These are made possible if the vortices lying at the same depth can get close enough and for long enough. That is, if the underlying dynamics associated with the global motion of the poles does not make the poles move apart too rapidly or if the poles are not still part of a baroclinically unstable heton. Finally, we recover that tall hetons are sensitive to the baroclinic mode corresponding to the azimuthal wavenumber
$l=3$
in the present study). Occurrences of vortex merger (for the symmetric case) and opposite-signed destructive interaction (for the antisymmetric case) have been observed. These are made possible if the vortices lying at the same depth can get close enough and for long enough. That is, if the underlying dynamics associated with the global motion of the poles does not make the poles move apart too rapidly or if the poles are not still part of a baroclinically unstable heton. Finally, we recover that tall hetons are sensitive to the baroclinic mode corresponding to the azimuthal wavenumber
 $l=1$
. This instability would not be observed in a three-layer model as it requires deformation in the vertical of the poles of the hetons. Although the instability does not lead to destruction of the poles, it induces on them a large-amplitude undulation motion with respect to the vertical axis.
$l=1$
. This instability would not be observed in a three-layer model as it requires deformation in the vertical of the poles of the hetons. Although the instability does not lead to destruction of the poles, it induces on them a large-amplitude undulation motion with respect to the vertical axis.
Now, drawing general conclusions from this study, we see that first, the point vortex approach, which is computationally cheap, is accurate for distant and small hetons. This method can predict the trajectory of such hetons. Second, we note that interacting hetons can break horizontally or vertically; these processes are well simulated here due to the high 3D resolution. Thus, heton interaction can transfer not only enstrophy (via filaments) but also energy (via vortices) towards smaller scales. Furthermore, when smaller hetons are formed, they appear robust (contrary to filaments which usually dissipate). Therefore, energy can remain at these smaller scales. Further studies would be necessary to see whether these small hetons can further interact, and how. Moreover, the number of small hetons formed is often dictated by the most unstable contour mode on the original hetons. Vertically, tall hetons can break, and therefore transfer energy towards more isotropic structures (contrary to the usual barotropisation of vortices, which dominates the final stages of free decay, geostrophic turbulence on the
 $f$
plane and over a flat bottom). Clearly, the problem investigated has a large number of symmetries. Not only do the hetons consist of equal volume opposite PV vortices but they initially translate along the same axis. Bringing asymmetries to the problem, adding more parameters, will permit us to exhibit richer and more complex global behaviour. For example, a simple offset between the two hetons, while even retaining their translation axis parallel, brings a large number of different possible trajectories for the individual poles. The addition of a beta effect is also important for geophysical applications. It should be noted that simple simulations of heton collision on the beta plane have been performed to analyse observations at sea (L’Hegaret et al.
Reference L’Hegaret, Carton, Ambar, Menesguen, Hua, Chérubin, Aguiar, Le Cann, Daniault and Serra2014).
$f$
plane and over a flat bottom). Clearly, the problem investigated has a large number of symmetries. Not only do the hetons consist of equal volume opposite PV vortices but they initially translate along the same axis. Bringing asymmetries to the problem, adding more parameters, will permit us to exhibit richer and more complex global behaviour. For example, a simple offset between the two hetons, while even retaining their translation axis parallel, brings a large number of different possible trajectories for the individual poles. The addition of a beta effect is also important for geophysical applications. It should be noted that simple simulations of heton collision on the beta plane have been performed to analyse observations at sea (L’Hegaret et al.
Reference L’Hegaret, Carton, Ambar, Menesguen, Hua, Chérubin, Aguiar, Le Cann, Daniault and Serra2014).
Obviously, a comprehensive study of heton interaction is out of reach; however, some specific regions of the parameter space may be of particular interest. This will be the subject of a forthcoming study.
Appendix A. Stability of the four-point vortex equilibrium
Consider the equilibrium for the symmetric case where
 $-{\it\kappa}_{1}=-{\it\kappa}_{4}={\it\kappa}_{2}={\it\kappa}_{3}=4{\rm\pi}$
and
$-{\it\kappa}_{1}=-{\it\kappa}_{4}={\it\kappa}_{2}={\it\kappa}_{3}=4{\rm\pi}$
and
 ${\rm\Delta}x={\rm\Delta}y={\rm\Delta}z$
. We can set
${\rm\Delta}x={\rm\Delta}y={\rm\Delta}z$
. We can set
 ${\rm\Delta}z=1$
without loss of generality. We analyse the behaviour of infinitesimal perturbations on the location of each of the point vortices
${\rm\Delta}z=1$
without loss of generality. We analyse the behaviour of infinitesimal perturbations on the location of each of the point vortices
 $i$
in the horizontal direction. The perturbations are taken in the form
$i$
in the horizontal direction. The perturbations are taken in the form
 $(x_{i}^{\prime },y_{i}^{\prime })=\text{Re}((\hat{x}_{i},{\hat{y}}_{i})\text{e}^{lt})$
, where
$(x_{i}^{\prime },y_{i}^{\prime })=\text{Re}((\hat{x}_{i},{\hat{y}}_{i})\text{e}^{lt})$
, where
 $\text{Re}$
stands for the real part and
$\text{Re}$
stands for the real part and
 $l$
is a complex number. The real part corresponds to a growth rate and the imaginary part to a frequency. We linearise the equation of motion of each singularity,
$l$
is a complex number. The real part corresponds to a growth rate and the imaginary part to a frequency. We linearise the equation of motion of each singularity,
 $$\begin{eqnarray}{\displaystyle \frac{\text{d}\boldsymbol{x}_{i}}{\text{d}t}}=\boldsymbol{u}_{i}=\mathop{\sum }_{j\neq i}{\displaystyle \frac{{\it\kappa}_{j}}{4{\rm\pi}|\boldsymbol{x}_{i}-\boldsymbol{x}_{j}|^{3}}}\left(\begin{array}{@{}c@{}}-(y_{i}-y_{j})\\ x_{i}-x_{j}\end{array}\right),\end{eqnarray}$$
about the equilibrium, giving
 $$\begin{eqnarray}l\left(\begin{array}{@{}c@{}}\hat{x}_{1}\\ \hat{x}_{2}\\ \hat{x}_{3}\\ \hat{x}_{4}\\ {\hat{y}}_{1}\\ {\hat{y}}_{1}\\ {\hat{y}}_{2}\\ {\hat{y}}_{3}\\ {\hat{y}}_{4}\end{array}\right)={\displaystyle \frac{1}{2\sqrt{2}}}\left(\begin{array}{@{}cccccccc@{}}-\frac{3}{2} & 0 & 0 & \frac{3}{2} & -1 & -\frac{1}{2} & 1 & \frac{1}{2}\\ 0 & -\frac{3}{2} & \frac{3}{2} & 0 & \frac{1}{2} & 1 & -\frac{1}{2} & -1\\ 0 & \frac{3}{2} & -\frac{3}{2} & 0 & -1 & \frac{1}{2} & 1 & \frac{1}{2}\\ \frac{3}{2} & 0 & 0 & -\frac{3}{2} & \frac{1}{2} & 1 & -\frac{3}{2} & -1\\ 1 & -1 & \frac{1}{2} & -\frac{1}{2} & \frac{3}{2} & 0 & 0 & -\frac{3}{2}\\ 1 & -1 & \frac{1}{2} & -\frac{1}{2} & 0 & \frac{3}{2} & -\frac{3}{2} & 0\\ -\frac{1}{2} & \frac{1}{2} & -1 & 1 & 0 & -\frac{3}{2} & \frac{3}{2} & 0\\ -\frac{1}{2} & \frac{1}{2} & -1 & 1 & -\frac{3}{2} & 0 & 0 & \frac{3}{2}\end{array}\right)\left(\begin{array}{@{}c@{}}\hat{x}_{1}\\ \hat{x}_{2}\\ \hat{x}_{3}\\ \hat{x}_{4}\\ {\hat{y}}_{1}\\ {\hat{y}}_{1}\\ {\hat{y}}_{2}\\ {\hat{y}}_{3}\\ {\hat{y}}_{4}\end{array}\right).\end{eqnarray}$$
The modes
 $l$
are solutions of the characteristic equation for the eigenvalues,
$l$
are solutions of the characteristic equation for the eigenvalues,
 $$\begin{eqnarray}l^{6}(l^{2}-9)=0.\end{eqnarray}$$
There is therefore one real positive eigenvalue (
 $l=3$
) corresponding to an unstable mode.
$l=3$
) corresponding to an unstable mode.
Appendix B. Vertical shear
In this appendix, we analyse the vertical shear induced by the vortices
 $j=2,3,4$
at the location of the pole
$j=2,3,4$
at the location of the pole
 $i=1$
within the point vortex approximation. For the shear induced by a vortex
$i=1$
within the point vortex approximation. For the shear induced by a vortex
 $j$
on
$j$
on
 $i$
and denoting
$i$
and denoting
 $\text{d}\boldsymbol{x}_{ij}=(\text{d}x_{ij},~\text{d}y_{ij},~\text{d}z_{ij})=(x_{i}-x_{j},y_{i},y_{j},z_{i}-z_{j})$
and
$\text{d}\boldsymbol{x}_{ij}=(\text{d}x_{ij},~\text{d}y_{ij},~\text{d}z_{ij})=(x_{i}-x_{j},y_{i},y_{j},z_{i}-z_{j})$
and
 $r_{ij}=|\text{d}\boldsymbol{x}_{ij}|$
we have
$r_{ij}=|\text{d}\boldsymbol{x}_{ij}|$
we have
 $$\begin{eqnarray}\displaystyle & \displaystyle \frac{\partial u_{ij}}{\partial z_{i}}=-3\frac{{\it\kappa}_{j}}{4{\rm\pi}}\frac{\text{d}y_{ij}\,\text{d}z_{ij}}{r_{ij}^{5}}, & \displaystyle\end{eqnarray}$$
 $$\begin{eqnarray}\displaystyle & \displaystyle \frac{\partial v_{ij}}{\partial z_{i}}=3\frac{{\it\kappa}_{j}}{4{\rm\pi}}\frac{\text{d}x_{ij}\,\text{d}z_{ij}}{r_{ij}^{5}}. & \displaystyle\end{eqnarray}$$
B.1. Symmetric case
By summing and keeping only non-zero terms, and with
 ${\it\kappa}=\pm 4{\rm\pi}$
we obtain
${\it\kappa}=\pm 4{\rm\pi}$
we obtain
 $$\begin{eqnarray}\frac{\partial u}{\partial {\rm\Delta}z}(\boldsymbol{x}_{1})=-3\frac{{\rm\Delta}y{\rm\Delta}z}{({\rm\Delta}y^{2}+{\rm\Delta}z^{2})^{5/2}},\end{eqnarray}$$
where the vertical shear along
 $x$
induced on pole 1 is solely generated by pole 2, and
$x$
induced on pole 1 is solely generated by pole 2, and
 $$\begin{eqnarray}\frac{\partial v}{\partial {\rm\Delta}z}(\boldsymbol{x}_{1})=3\frac{{\rm\Delta}x{\rm\Delta}z}{({\rm\Delta}x^{2}+{\rm\Delta}z^{2})^{5/2}},\end{eqnarray}$$
where the vertical shear along
 $y$
is generated by pole 4 alone. Here,
$y$
is generated by pole 4 alone. Here,
 ${\rm\Delta}x$
,
${\rm\Delta}x$
,
 ${\rm\Delta}y$
and
${\rm\Delta}y$
and
 ${\rm\Delta}z$
are as defined in figure 1.
${\rm\Delta}z$
are as defined in figure 1.
Because of the singularity at the origin, the only extremum is at the origin, which is meaningless. There are no other local extrema. However, one may look at extrema with a given constraint. For example, for
 ${\rm\Delta}z$
fixed, the function becomes one of one variable with local extrema at
${\rm\Delta}z$
fixed, the function becomes one of one variable with local extrema at
 ${\rm\Delta}x,{\rm\Delta}y=\pm {\rm\Delta}z/2$
. Indeed,
${\rm\Delta}x,{\rm\Delta}y=\pm {\rm\Delta}z/2$
. Indeed,
 $$\begin{eqnarray}\displaystyle \frac{\partial }{\partial {\rm\Delta}x}\left(\frac{{\rm\Delta}x{\rm\Delta}z}{({\rm\Delta}x^{2}+{\rm\Delta}z^{2})^{5/2}}\right) & = & \displaystyle {\rm\Delta}z\left(\frac{1}{({\rm\Delta}x^{2}+{\rm\Delta}z^{2})^{5/2}}-\frac{5}{2}\frac{2{\rm\Delta}x^{2}}{({\rm\Delta}x^{2}+{\rm\Delta}z^{2})^{7/2}}\right)=0\nonumber\\ \displaystyle & \Rightarrow & \displaystyle {\rm\Delta}z^{2}-4{\rm\Delta}x^{2}=0.\end{eqnarray}$$
Since
 ${\rm\Delta}z$
is fixed during the time evolution of hetons, this provides an upper bound for the maximum shear accessible in the flow. It does not imply that such a shear is reached in practice.
${\rm\Delta}z$
is fixed during the time evolution of hetons, this provides an upper bound for the maximum shear accessible in the flow. It does not imply that such a shear is reached in practice.
On the other hand, letting
 ${\it\theta}=\tan ^{-1}({\rm\Delta}z/{\rm\Delta}x)$
and
${\it\theta}=\tan ^{-1}({\rm\Delta}z/{\rm\Delta}x)$
and
 ${\it\rho}=\sqrt{{\rm\Delta}x^{2}+{\rm\Delta}z^{2}}$
, so that
${\it\rho}=\sqrt{{\rm\Delta}x^{2}+{\rm\Delta}z^{2}}$
, so that
 $x={\it\rho}\cos {\it\theta}$
,
$x={\it\rho}\cos {\it\theta}$
,
 $z={\it\rho}\sin {\it\theta}$
, we obtain
$z={\it\rho}\sin {\it\theta}$
, we obtain
 $$\begin{eqnarray}\frac{\partial u}{\partial {\rm\Delta}z}(\boldsymbol{x}_{1})=-3\frac{{\rm\Delta}x{\rm\Delta}z}{({\rm\Delta}x^{2}+{\rm\Delta}z^{2})^{5/2}}=-{\displaystyle \frac{3}{2}}\frac{\sin 2{\it\theta}}{{\it\rho}^{3}}.\end{eqnarray}$$
For
 ${\it\rho}$
fixed, the maximum is for
${\it\rho}$
fixed, the maximum is for
 ${\it\theta}={\rm\pi}/4$
, hence
${\it\theta}={\rm\pi}/4$
, hence
 ${\rm\Delta}z={\rm\Delta}x$
, and similarly for
${\rm\Delta}z={\rm\Delta}x$
, and similarly for
 $\partial v/\partial z$
.
$\partial v/\partial z$
.
Dynamically, the maximum vertical shear would be experienced with the constraint that the Hamiltonian of the system
 $\mathscr{H}=\text{const.}$
, which simplifies as
$\mathscr{H}=\text{const.}$
, which simplifies as
 $$\begin{eqnarray}\frac{1}{\sqrt{{\rm\Delta}x^{2}+{\rm\Delta}y^{2}}}-\frac{1}{\sqrt{{\rm\Delta}x^{2}+{\rm\Delta}z^{2}}}-\frac{1}{\sqrt{{\rm\Delta}y^{2}+{\rm\Delta}x^{2}}}=\text{const}.\end{eqnarray}$$
The extremum could be determined using Lagrange multipliers, or alternatively the value can be monitored during the time-dependent evolution of the point vortices. In that case the initial conditions set the constant value of the Hamiltonian. An example of shear values versus time is presented in figure 27. The figure shows the time-dependent shear around vortex 1. We ignore the sign of the shear and only focus on the magnitude in all cases but one. Indeed, the sign of the shear is constant except for
 $\partial u/\partial z$
in the trajectory reversal scenario. In that case
$\partial u/\partial z$
in the trajectory reversal scenario. In that case
 ${\rm\Delta}y$
changes sign during the reversal. The thin solid line represents
${\rm\Delta}y$
changes sign during the reversal. The thin solid line represents
 $\partial u/\partial z$
while the thick solid line represents
$\partial u/\partial z$
while the thick solid line represents
 $\partial v/\partial z$
. We illustrate the evolution for two cases. One corresponds to a reversal of trajectory, the other one to an escape of the hetons. For the reversal we take at
$\partial v/\partial z$
. We illustrate the evolution for two cases. One corresponds to a reversal of trajectory, the other one to an escape of the hetons. For the reversal we take at
 $t=0$
,
$t=0$
,
 ${\rm\Delta}x=5$
,
${\rm\Delta}x=5$
,
 ${\rm\Delta}y=0.75$
and
${\rm\Delta}y=0.75$
and
 ${\rm\Delta}z=1$
(
${\rm\Delta}z=1$
(
 ${\it\alpha}=0.75<1$
). This case is illustrated in figure 27(a). Here,
${\it\alpha}=0.75<1$
). This case is illustrated in figure 27(a). Here,
 $\partial u/\partial z$
becomes zero then the two poles overlap during their reversal (
$\partial u/\partial z$
becomes zero then the two poles overlap during their reversal (
 ${\rm\Delta}y=0$
). This also corresponds to the smallest value of
${\rm\Delta}y=0$
). This also corresponds to the smallest value of
 ${\rm\Delta}x$
reached. This value is
${\rm\Delta}x$
reached. This value is
 ${\rm\Delta}x\simeq 1.2$
. In this case we are in the part of the curve
${\rm\Delta}x\simeq 1.2$
. In this case we are in the part of the curve
 $\partial v/\partial {\rm\Delta}z$
for
$\partial v/\partial {\rm\Delta}z$
for
 ${\rm\Delta}z$
fixed where the function increases as
${\rm\Delta}z$
fixed where the function increases as
 ${\rm\Delta}x$
decreases. The critical point for
${\rm\Delta}x$
decreases. The critical point for
 $\partial v/\partial {\rm\Delta}z$
, a maximum, corresponds to a critical value of
$\partial v/\partial {\rm\Delta}z$
, a maximum, corresponds to a critical value of
 ${\rm\Delta}x$
,
${\rm\Delta}x$
,
 ${\rm\Delta}x_{c}=0.5{\rm\Delta}z$
, far smaller than what can be reached in this situation. Hence, the extremum observed corresponds to the minimum value of
${\rm\Delta}x_{c}=0.5{\rm\Delta}z$
, far smaller than what can be reached in this situation. Hence, the extremum observed corresponds to the minimum value of
 ${\rm\Delta}x$
rather than a critical point for the function
${\rm\Delta}x$
rather than a critical point for the function
 $\partial v/\partial {\rm\Delta}z$
. On the other hand, we see that the shear
$\partial v/\partial {\rm\Delta}z$
. On the other hand, we see that the shear
 $\partial u/\partial x$
reaches local extrema at the critical points
$\partial u/\partial x$
reaches local extrema at the critical points
 ${\rm\Delta}y_{c}=\pm {\rm\Delta}z/2$
, as expected for
${\rm\Delta}y_{c}=\pm {\rm\Delta}z/2$
, as expected for
 ${\rm\Delta}z$
fixed. Indeed, here we start the simulation from
${\rm\Delta}z$
fixed. Indeed, here we start the simulation from
 ${\rm\Delta}y(t=0)>{\rm\Delta}y_{c}=0.5{\rm\Delta}_{z}$
and
${\rm\Delta}y(t=0)>{\rm\Delta}y_{c}=0.5{\rm\Delta}_{z}$
and
 ${\rm\Delta}y$
decreases monotonically during the flow evolution. This means that we do reach the critical point for the shear as
${\rm\Delta}y$
decreases monotonically during the flow evolution. This means that we do reach the critical point for the shear as
 ${\rm\Delta}y$
decreases. First we reach it at
${\rm\Delta}y$
decreases. First we reach it at
 ${\rm\Delta}y=0.5={\rm\Delta}z/2$
, then we reach the second extremum at
${\rm\Delta}y=0.5={\rm\Delta}z/2$
, then we reach the second extremum at
 ${\rm\Delta}y=-0.5=-{\rm\Delta}z/2$
.
${\rm\Delta}y=-0.5=-{\rm\Delta}z/2$
.

Figure 27. The shear experienced by pole 1 versus time for a symmetric pair of point vortex hetons with, at
 $t=0$
, (a)
$t=0$
, (a)
 ${\rm\Delta}x=5,\,{\rm\Delta}y=0.75$
,
${\rm\Delta}x=5,\,{\rm\Delta}y=0.75$
,
 ${\rm\Delta}z=1$
and (b)
${\rm\Delta}z=1$
and (b)
 ${\rm\Delta}x=5,\,{\rm\Delta}y=1,\,{\rm\Delta}z=0.5$
. The thin solid line represents
${\rm\Delta}x=5,\,{\rm\Delta}y=1,\,{\rm\Delta}z=0.5$
. The thin solid line represents
 $\partial u/\partial z$
while the thick solid line represents
$\partial u/\partial z$
while the thick solid line represents
 $\partial v/\partial z$
.
$\partial v/\partial z$
.
Figure 27(b) illustrates the case starting from
 ${\rm\Delta}x=5$
,
${\rm\Delta}x=5$
,
 ${\rm\Delta}y=1$
and
${\rm\Delta}y=1$
and
 ${\rm\Delta}z=0.5$
(
${\rm\Delta}z=0.5$
(
 ${\it\alpha}=2>1$
), where the hetons recombine and escape. In this case,
${\it\alpha}=2>1$
), where the hetons recombine and escape. In this case,
 ${\rm\Delta}y(t=0)>{\rm\Delta}y_{c}={\rm\Delta}z/2$
, and the dynamics of the hetons makes them separate further apart in the
${\rm\Delta}y(t=0)>{\rm\Delta}y_{c}={\rm\Delta}z/2$
, and the dynamics of the hetons makes them separate further apart in the
 $y$
direction. Therefore, the critical point for
$y$
direction. Therefore, the critical point for
 $\partial u/\partial z$
is never reached. Moreover, in this case,
$\partial u/\partial z$
is never reached. Moreover, in this case,
 ${\rm\Delta}x$
,
${\rm\Delta}x$
,
 ${\rm\Delta}y$
and
${\rm\Delta}y$
and
 ${\rm\Delta}z$
are never zero, hence the shear never exactly equals zero. However, the limit of the shear
${\rm\Delta}z$
are never zero, hence the shear never exactly equals zero. However, the limit of the shear
 $\partial u/\partial z$
when
$\partial u/\partial z$
when
 ${\rm\Delta}y\rightarrow 0$
is 0. The same is true for
${\rm\Delta}y\rightarrow 0$
is 0. The same is true for
 $\partial v/\partial z$
and
$\partial v/\partial z$
and
 ${\rm\Delta}x$
. The two other finite non-zero limits correspond to finite non-zero limits for
${\rm\Delta}x$
. The two other finite non-zero limits correspond to finite non-zero limits for
 ${\rm\Delta}x$
and
${\rm\Delta}x$
and
 ${\rm\Delta}y$
and are not associated with critical points. In this case, the maximum vertical shear is obtained within each heton, the hetons being well separated from one another.
${\rm\Delta}y$
and are not associated with critical points. In this case, the maximum vertical shear is obtained within each heton, the hetons being well separated from one another.
B.2. Antisymmetric case
We next turn our attention to the shear about pole 1 for the asymmetric case. We obtain
 $$\begin{eqnarray}\frac{\partial u}{\partial z}(\boldsymbol{x}_{1})=3{\rm\Delta}y{\rm\Delta}z\left(-\frac{1}{({\rm\Delta}y^{2}+{\rm\Delta}z^{2})^{5/2}}+\frac{1}{({\rm\Delta}x^{2}+{\rm\Delta}y^{2}+{\rm\Delta}z^{2})^{5/2}}\right),\end{eqnarray}$$
which stems from the mutual influence of vortices 2 and 4, and
 $$\begin{eqnarray}\frac{\partial v}{\partial z}(\boldsymbol{x}_{1})=-3\frac{{\rm\Delta}x{\rm\Delta}z}{({\rm\Delta}x^{2}+{\rm\Delta}y^{2}+{\rm\Delta}z^{2})^{5/2}},\end{eqnarray}$$
which comes from vortex 4 solely.
Now, both functions are functions of three variables. Again, dynamically the maximum shear experienced by the vortex would be with the constraint
 $\mathscr{H}=\text{const}.$
, which simplifies to
$\mathscr{H}=\text{const}.$
, which simplifies to
 $$\begin{eqnarray}\frac{1}{\sqrt{{\rm\Delta}x^{2}+{\rm\Delta}y^{2}+{\rm\Delta}z^{2}}}-\frac{1}{|x|}-\frac{1}{\sqrt{{\rm\Delta}y^{2}+{\rm\Delta}z^{2}}}=\text{const}.\end{eqnarray}$$
The time evolution of the shear in the case
 ${\rm\Delta}x=5$
,
${\rm\Delta}x=5$
,
 ${\rm\Delta}y=1$
and
${\rm\Delta}y=1$
and
 ${\rm\Delta}z=0.5$
is shown in figure 28(a) and for
${\rm\Delta}z=0.5$
is shown in figure 28(a) and for
 ${\rm\Delta}x=5$
,
${\rm\Delta}x=5$
,
 ${\rm\Delta}y=0.5$
and
${\rm\Delta}y=0.5$
and
 ${\rm\Delta}z=0.5$
in figure 28(b). The initial value of the shear is set by the initial separations between the poles. For very large values of
${\rm\Delta}z=0.5$
in figure 28(b). The initial value of the shear is set by the initial separations between the poles. For very large values of
 ${\rm\Delta}x$
,
${\rm\Delta}x$
,
 $\partial v/\partial {\rm\Delta}z$
is very small (as it is divided by a term of order
$\partial v/\partial {\rm\Delta}z$
is very small (as it is divided by a term of order
 ${\rm\Delta}x^{4}$
). In the late evolution of the flow, the hetons have recombined into two dipoles at the same depth. The dipole itself does not induce a vertical shear on itself as the poles are aligned horizontally. The shear still comes from the poles of the other dipole at a different depth but these poles are moving away. Moreover, the global strength of the dipole is zero, hence the influence decreases rapidly. As a consequence, both shears tend to zero as
${\rm\Delta}x^{4}$
). In the late evolution of the flow, the hetons have recombined into two dipoles at the same depth. The dipole itself does not induce a vertical shear on itself as the poles are aligned horizontally. The shear still comes from the poles of the other dipole at a different depth but these poles are moving away. Moreover, the global strength of the dipole is zero, hence the influence decreases rapidly. As a consequence, both shears tend to zero as
 ${\rm\Delta}y\rightarrow \infty$
. We see that the shear
${\rm\Delta}y\rightarrow \infty$
. We see that the shear
 $\partial v/\partial {\rm\Delta}z$
reaches a local maximum in both cases. We recall that this maximum is subject to the constraint that the Hamiltonian is conserved and is not necessarily a critical point for the shear. In particular, we note that
$\partial v/\partial {\rm\Delta}z$
reaches a local maximum in both cases. We recall that this maximum is subject to the constraint that the Hamiltonian is conserved and is not necessarily a critical point for the shear. In particular, we note that
 $\partial v/\partial z$
is monotonically decreasing with
$\partial v/\partial z$
is monotonically decreasing with
 ${\rm\Delta}y$
. The maximum in the first case (a) is obtained at
${\rm\Delta}y$
. The maximum in the first case (a) is obtained at
 $t=5.09$
with
$t=5.09$
with
 ${\rm\Delta}x\simeq 1.51$
,
${\rm\Delta}x\simeq 1.51$
,
 ${\rm\Delta}y\simeq 0.94$
and
${\rm\Delta}y\simeq 0.94$
and
 ${\rm\Delta}z=1$
, while for the second case (b) it is for
${\rm\Delta}z=1$
, while for the second case (b) it is for
 $t=2.81$
,
$t=2.81$
,
 ${\rm\Delta}x\simeq 1.51$
,
${\rm\Delta}x\simeq 1.51$
,
 ${\rm\Delta}y\simeq 1.28$
and
${\rm\Delta}y\simeq 1.28$
and
 ${\rm\Delta}z=0.5$
. For
${\rm\Delta}z=0.5$
. For
 $\partial ^{2}u/\partial {\rm\Delta}x\partial {\rm\Delta}z=0$
, we have
$\partial ^{2}u/\partial {\rm\Delta}x\partial {\rm\Delta}z=0$
, we have
 ${\rm\Delta}y^{2}-4{\rm\Delta}x^{2}+{\rm\Delta}z^{2}=0$
. This is not true for both cases. Hence, the maximum reached does not coincide with a critical point in these cases, but is only the maximum value reached along this particular trajectory (set by the value of
${\rm\Delta}y^{2}-4{\rm\Delta}x^{2}+{\rm\Delta}z^{2}=0$
. This is not true for both cases. Hence, the maximum reached does not coincide with a critical point in these cases, but is only the maximum value reached along this particular trajectory (set by the value of
 $\mathscr{H}$
). Again, the maximum shear is obtained for well separated hetons.
$\mathscr{H}$
). Again, the maximum shear is obtained for well separated hetons.

Figure 28. The shear experienced by pole 1 versus time for an antisymmetric pair of point vortex hetons with, at
 $t=0$
, (a)
$t=0$
, (a)
 ${\rm\Delta}x=5$
,
${\rm\Delta}x=5$
,
 ${\rm\Delta}y=0.5$
,
${\rm\Delta}y=0.5$
,
 ${\rm\Delta}z=1$
and (b)
${\rm\Delta}z=1$
and (b)
 ${\rm\Delta}x=5$
,
${\rm\Delta}x=5$
,
 ${\rm\Delta}y=1$
,
${\rm\Delta}y=1$
,
 ${\rm\Delta}z=0.5$
. The thin solid line represents
${\rm\Delta}z=0.5$
. The thin solid line represents
 $\partial u/\partial z$
while the thick solid line represents
$\partial u/\partial z$
while the thick solid line represents
 $\partial v/\partial z$
.
$\partial v/\partial z$
.