


1. Introduction
The Marangoni convection in liquid layers has been studied extensively in the past few decades, due to its importance in microgravity engineering and microfluidics (for a review, see Simanovskii & Nepomnyashchy Reference Simanovskii and Nepomnyashchy1993; Colinet, Legros & Velarde Reference Colinet, Legros and Velarde2001; Nepomnyashchy, Simanovskii & Legros Reference Nepomnyashchy, Simanovskii and Legros2012). Two basic cases have been studied in detail: (i) the case where a temperature gradient is applied along the layer; (ii) the case where a temperature gradient is applied across the layer.
In the former case, a thermocapillary flow is generated by the applied temperature gradient. A simple parallel ‘return flow’ (Birikh Reference Birikh1966) with a flat surface does not actually satisfy the physical boundary condition for normal stresses; it is valid only in the limit of an infinitely strong surface tension. If the surface tension is finite, the thickness of the layer is not uniform: in the ‘hot part’ of the layer it is smaller than in the ‘cold part’ of the layer (Sen & Davis Reference Sen and Davis1982; Pshenichnikov & Tokmenina Reference Pshenichnikov and Tokmenina1983; Floryan & Chen Reference Floryan and Chen1994; Hamed & Floryan Reference Hamed and Floryan2000). Moreover, a ‘dry spot’ can appear in a sufficiently long layer (Zuev & Pshenichnikov Reference Zuev and Pshenichnikov1987; Floryan & Chen Reference Floryan and Chen1994).
In the latter case, the Marangoni convection is developed due to the instability of an equilibrium state. The early works on the development of Marangoni convection in a liquid layer heated from below have revealed two basic modes of Marangoni instabilities: (i) ‘the Pearson’s mode’ of cellular convection with a negligible deformation of the interface (Pearson Reference Pearson1958); (ii) ‘the Scriven–Sternling’s mode’ which manifests itself through a longwave interface deformation leading to the layer rupture (Scriven & Sternling Reference Scriven and Sternling1964). The former instability mechanism prevails in relatively thick layers, while the latter is observed only in very thin layers (Van Hook et al. Reference Van Hook, Schatz, McCormick, Swift and Swinney1995, Reference Van Hook, Schatz, Swift, McCormick and Swinney1997) or under microgravity conditions. The separation of ‘non-deformational’ and ‘deformational’ types of instabilities is essential also in the case of a thermocapillary flow generated by a temperature gradient applied along the layer. The non-deformational type of instabilities creates hydrothermal waves (Smith & Davis Reference Smith and Davis1983a ; Madruga et al. 2003), while the deformational type is responsible for the development of long surface waves (Smith & Davis Reference Smith and Davis1983b ); the interplay of both instability mechanisms was considered by Czechowsky & Floryan (Reference Czechowsky and Floryan2001).
An efficient method of excitation and control of instabilities is the modulation of parameters. In order to influence the development of the Marangoni instability, one can apply alternating electric and magnetic fields, oscillatory shear, vibrations or heating modulations. Vibration is the most well-explored example of the parameter modulation. Its studying was started by the famous work of Kapitza (Reference Kapitza1951) and continued in numerous works, including a monograph devoted to the vibrational convection (Gershuni & Lyubimov Reference Gershuni and Lyubimov1998).
Another important method of stability control, which can be more easily implemented, is the modulation of heating. While the influence of the thermal modulation on the buoyancy convection has been studied in detail (Gershuni & Zhukhovitsky Reference Gershuni and Zhukhovitsky1963; Venezian Reference Venezian1969; Gershuni, Zhukhovitsky & Yurkov Reference Gershuni, Zhukhovitsky and Yurkov1970; Rosenblat & Tanaka Reference Rosenblat and Tanaka1971; Yih & Li Reference Yih and Li1972; Smorodin & Lüecke Reference Smorodin and Lüecke2009, Reference Smorodin and Lüecke2010), the effect of the heat flux modulation on the Marangoni convection is still less explored. Gershuni, Nepomnyashchy & Velarde (Reference Gershuni, Nepomnyashchy and Velarde1992) and Gershuni et al. (Reference Gershuni, Nepomnyashchy, Smorodin and Velarde1994, Reference Gershuni, Nepomnyashchy, Smorodin and Velarde1996) have investigated the excitation of Marangoni instability in a semi-infinite liquid layer by the modulation of the heat flux on the free surface. The investigation revealed a competition between subharmonic and synchronous instability modes. The longwave Marangoni instability in a thin layer under the action of a temperature modulation or a heat-flux modulation at the layer bottom has been studied by Or & Kelly (Reference Or and Kelly2002). Smorodin et al. (Reference Smorodin, Mikishev, Nepomnyashchy and Myznikova2009) have found that the modulation of the heat flux at the liquid surface is a more effective way to generate a parametric Marangoni instability than that at the bottom of the layer. All of the investigations mentioned above have been devoted to systems where the primary instability is monotonic. Those studies have been carried out in the framework of the linear stability theory.
However, there exist physical systems where both monotonic and oscillatory Marangoni instabilities are possible. The presence of a primary oscillatory instability can be an origin of a specific kind of parametric excitation of waves. As an example, let us mention the Marangoni instability in binary mixtures with the Soret effect, first studied by Castillo & Velarde (Reference Castillo and Velarde1978, Reference Castillo and Velarde1980). The linear stability analysis of the heated binary liquid layer under the action of vibrations has been carried out by Fayzrakhmanova, Shklyaev & Nepomnyashchy (Reference Fayzrakhmanova, Shklyaev and Nepomnyashchy2013a ). The influence of heat flux modulation on the Marangoni instability in binary mixtures with Soret effect has been studied in the framework of the linear stability theory by Fayzrakhmanova, Shklyaev & Nepomnyashchy (Reference Fayzrakhmanova, Shklyaev, Nepomnyashchy and Rubio2013b ). The weakly nonlinear theory describing the excitation of a synchronous mode by a modulated heat flux was developed by Fayzrakhmanova, Shklyaev & Nepomnyashchy (Reference Fayzrakhmanova, Shklyaev and Nepomnyashchy2014).
Another example of a system where both monotonic and oscillatory Marangoni instabilities are possible, is a two-layer liquid film with deformable interfaces (Nepomnyashchy & Simanovskii Reference Nepomnyashchy and Simanovskii2007). The advantage of that physical system is the possibility to apply a longwave asymptotic approach (‘lubrication approximation’) which allows to reduce the full non-stationary three-dimensional problem to a system of strongly nonlinear two-dimensional evolution equations that governs longwave deformations of interfaces. It is significant that in a contradistinction to the monotonic deformational mode which leads typically to the layer rupture, the oscillatory deformational mode generates finite-amplitude, two-dimensional and three-dimensional patterns (Nepomnyashchy & Simanovskii Reference Nepomnyashchy and Simanovskii2007, Reference Nepomnyashchy and Simanovskii2012). This circumstance gives a unique opportunity to describe three-dimensional finite-amplitude wavy motions generated by parameter modulation. Nepomnyashchy & Simanovskii (Reference Nepomnyashchy and Simanovskii2013) have applied the above-mentioned system for the simulation of nonlinear resonant wavy patterns generated by vibrations. The excitation of diverse nonlinear waves was observed when the ratio of the modulated frequency to the eigenfrequency of Marangoni waves was close to two or four.
In the present paper, we consider the generation of long nonlinear Marangoni waves in a two-layer liquid film by a slow heating modulation. The mathematical model is formulated in § 2. In the framework of the approximation used, the problems with temperature modulation and heat flux modulations are equivalent. Section 3 contains a brief description of instabilities in the case of a constant substrate temperature; the oscillatory instability boundary is presented. In § 4, results of the numerical investigation of the problem are described. Section 5 contains concluding remarks.
2. Formulation of the problem
2.1. Longwave equations
Consider a system of two superposed layers of immiscible liquids with different physical properties (see figure 1). The bottom layer rests on a solid substrate, the top layer is in contact with the adjacent gas phase. The temperature of the gas
 $T_{g}$
is constant, while the temperature of the solid substrate is changed periodically in time,
$T_{g}$
is constant, while the temperature of the solid substrate is changed periodically in time,
 $T_{s}(t)=T_{s}^{0}+{\it\Theta}\sin {\it\omega}t$
. All of the variables referring to the bottom layer are marked by subscript 1, and all of the variables referring to the top layer are marked by subscript 2. The coordinates of the interfaces in a quiescent state are
$T_{s}(t)=T_{s}^{0}+{\it\Theta}\sin {\it\omega}t$
. All of the variables referring to the bottom layer are marked by subscript 1, and all of the variables referring to the top layer are marked by subscript 2. The coordinates of the interfaces in a quiescent state are
 $H_{m}^{0},~m=1,2$
. The deformable interfaces are described by equations
$H_{m}^{0},~m=1,2$
. The deformable interfaces are described by equations
 $z=H_{1}(x,y,t)$
(liquid–liquid interface) and
$z=H_{1}(x,y,t)$
(liquid–liquid interface) and
 $z=H_{2}(x,y,t)$
(liquid–gas interface). The
$z=H_{2}(x,y,t)$
(liquid–gas interface). The
 $m$
th fluid has density
$m$
th fluid has density
 ${\it\rho}_{m}$
, kinematic viscosity
${\it\rho}_{m}$
, kinematic viscosity
 ${\it\nu}_{m}$
, dynamic viscosity
${\it\nu}_{m}$
, dynamic viscosity
 ${\it\eta}_{m}={\it\rho}_{m}{\it\nu}_{m}$
, thermal diffusivity
${\it\eta}_{m}={\it\rho}_{m}{\it\nu}_{m}$
, thermal diffusivity
 ${\it\chi}_{m}$
and heat conductivity
${\it\chi}_{m}$
and heat conductivity
 ${\it\kappa}_{m}$
. The surface tension coefficients on the lower and upper interfaces,
${\it\kappa}_{m}$
. The surface tension coefficients on the lower and upper interfaces,
 ${\it\sigma}_{1}$
and
${\it\sigma}_{1}$
and
 ${\it\sigma}_{2}$
, are linear functions of temperature
${\it\sigma}_{2}$
, are linear functions of temperature
 $T$
:
$T$
:
 ${\it\sigma}_{1}={\it\sigma}_{1}^{0}-{\it\alpha}_{1}T$
,
${\it\sigma}_{1}={\it\sigma}_{1}^{0}-{\it\alpha}_{1}T$
,
 ${\it\sigma}_{2}={\it\sigma}_{2}^{0}-{\it\alpha}_{2}T$
. The gravity acceleration is
${\it\sigma}_{2}={\it\sigma}_{2}^{0}-{\it\alpha}_{2}T$
. The gravity acceleration is
 $g$
.
$g$
.
The complete system of nonlinear equations governing the Marangoni convection is written in the following form (Simanovskii & Nepomnyashchy Reference Simanovskii and Nepomnyashchy1993):
 $$\begin{eqnarray}\displaystyle & \displaystyle \frac{\partial \boldsymbol{v}_{m}}{\partial t}+(\boldsymbol{v}_{m}\boldsymbol{\cdot }\boldsymbol{{\rm\nabla}})\boldsymbol{v}_{m}=-\frac{1}{{\it\rho}_{m}}\boldsymbol{{\rm\nabla}}P_{m}+{\it\nu}_{m}{\rm\Delta}\boldsymbol{v}_{m}, & \displaystyle\end{eqnarray}$$
 $$\begin{eqnarray}\displaystyle & \displaystyle \frac{\partial T_{m}}{\partial t}+\boldsymbol{v}_{m}\boldsymbol{\cdot }\boldsymbol{{\rm\nabla}}T_{m}={\it\chi}_{m}{\rm\Delta}T_{m}, & \displaystyle\end{eqnarray}$$
 $$\begin{eqnarray}\displaystyle & \boldsymbol{{\rm\nabla}}\boldsymbol{\cdot }\boldsymbol{v}_{m}=0,\quad m=1,2. & \displaystyle\end{eqnarray}$$

Figure 1. Geometric configuration of the region and coordinate axes.
Here
 $\boldsymbol{v}_{m}$
and
$\boldsymbol{v}_{m}$
and
 $P_{m}$
are the velocity and the difference between the overall pressure and the atmospheric pressure in the
$P_{m}$
are the velocity and the difference between the overall pressure and the atmospheric pressure in the
 $m$
th liquid, correspondingly. The boundary conditions on the rigid boundary are
$m$
th liquid, correspondingly. The boundary conditions on the rigid boundary are
 $$\begin{eqnarray}\boldsymbol{v}_{1}=0,\quad T_{1}=T_{s}(t);\quad \text{at}~z=0.\end{eqnarray}$$
On the deformable interface
 $z=H_{1}$
, the following boundary conditions hold: the balance of normal stresses,
$z=H_{1}$
, the following boundary conditions hold: the balance of normal stresses,
 $$\begin{eqnarray}P_{2}-P_{1}+2{\it\sigma}_{1}K_{1}=\left[-{\it\eta}_{1}\left(\frac{\partial v_{1i}}{\partial x_{k}}+\frac{\partial v_{1k}}{\partial x_{i}}\right)+{\it\eta}_{2}\left(\frac{\partial v_{2i}}{\partial x_{k}}+\frac{\partial v_{2k}}{\partial x_{i}}\right)\right]n_{1i}n_{1k};\quad i,k=1,2,3;\end{eqnarray}$$
the balance of tangential stresses,
 $$\begin{eqnarray}\displaystyle & & \displaystyle \left[-{\it\eta}_{1}\left(\frac{\partial v_{1i}}{\partial x_{k}}+\frac{\partial v_{1k}}{\partial x_{i}}\right)+{\it\eta}_{2}\left(\frac{\partial v_{2i}}{\partial x_{k}}+\frac{\partial v_{2k}}{\partial x_{i}}\right)\right]{\it\tau}_{1i}^{(l)}n_{1k}-{\it\alpha}_{1}{\it\tau}_{1i}^{(l)}\frac{\partial T_{1}}{\partial x_{i}}=0,\nonumber\\ \displaystyle & & \displaystyle \quad l=1,2;~i,k=1,2,3;\end{eqnarray}$$
the continuity of the velocity field,
 $$\begin{eqnarray}\boldsymbol{v}_{1}=\boldsymbol{v}_{2};\end{eqnarray}$$
the kinematic equation for the interface motion,
 $$\begin{eqnarray}\frac{\partial H_{1}}{\partial t}+v_{1x}\frac{\partial H_{1}}{\partial x}+v_{1y}\frac{\partial H_{1}}{\partial y}=v_{1z};\end{eqnarray}$$
the continuity of the temperature field,
 $$\begin{eqnarray}T_{1}=T_{2};\end{eqnarray}$$
and the balance of normal heat fluxes,
 $$\begin{eqnarray}\left({\it\kappa}_{1}\frac{\partial T_{1}}{\partial x_{i}}-{\it\kappa}_{2}\frac{\partial T_{2}}{\partial x_{i}}\right)n_{1i}=0.\end{eqnarray}$$
Similar boundary conditions are imposed on the deformable interface
 $z=H_{2}$
:
$z=H_{2}$
:
 $$\begin{eqnarray}\displaystyle & \displaystyle -P_{2}+2{\it\sigma}_{2}K_{2}=-{\it\eta}_{2}\left(\frac{\partial v_{2i}}{\partial x_{k}}+\frac{\partial v_{2k}}{\partial x_{i}}\right)n_{2i}n_{2k}, & \displaystyle\end{eqnarray}$$
 $$\begin{eqnarray}\displaystyle & \displaystyle -{\it\eta}_{2}\left(\frac{\partial v_{2i}}{\partial x_{k}}+\frac{\partial v_{2k}}{\partial x_{i}}\right){\it\tau}_{2i}^{(l)}n_{2k}-{\it\alpha}_{2}{\it\tau}_{2i}^{(l)}\frac{\partial T_{3}}{\partial x_{i}}=0,\quad l=1,2,~i,k=1,2,3, & \displaystyle\end{eqnarray}$$
 $$\begin{eqnarray}\displaystyle & \displaystyle \frac{\partial H_{2}}{\partial t}+v_{2x}\frac{\partial H_{2}}{\partial x}+v_{2y}\frac{\partial H_{2}}{\partial y}=v_{2z}. & \displaystyle\end{eqnarray}$$
 $K_{1}$
and
$K_{1}$
and
 $K_{2}$
are the mean curvatures,
$K_{2}$
are the mean curvatures,
 $\boldsymbol{n}_{\mathbf{1}}$
and
$\boldsymbol{n}_{\mathbf{1}}$
and
 $\boldsymbol{n}_{\mathbf{2}}$
are the normal vectors and
$\boldsymbol{n}_{\mathbf{2}}$
are the normal vectors and
 ${\bf\tau}_{1}^{(l)}$
and
${\bf\tau}_{1}^{(l)}$
and
 ${\bf\tau}_{2}^{(l)}$
are the tangential vectors of the lower and upper interfaces. In the quantities with two subscripts, the first subscript corresponds to the number of the liquid (
${\bf\tau}_{2}^{(l)}$
are the tangential vectors of the lower and upper interfaces. In the quantities with two subscripts, the first subscript corresponds to the number of the liquid (
 $m=1,2$
) and the second subscript determines the number of the Cartesian coordinate (
$m=1,2$
) and the second subscript determines the number of the Cartesian coordinate (
 $i,k=1,2,3$
;
$i,k=1,2,3$
;
 $x_{1}=x$
,
$x_{1}=x$
,
 $x_{2}=y$
,
$x_{2}=y$
,
 $x_{3}=z$
). The usual summation convention is applied. Later on, we disregard the dependences of the surface tension coefficients
$x_{3}=z$
). The usual summation convention is applied. Later on, we disregard the dependences of the surface tension coefficients
 ${\it\sigma}_{1}$
,
${\it\sigma}_{1}$
,
 ${\it\sigma}_{2}$
on the temperature in the boundary conditions corresponding to normal stresses, i.e. we take
${\it\sigma}_{2}$
on the temperature in the boundary conditions corresponding to normal stresses, i.e. we take
 ${\it\sigma}_{1}={\it\sigma}_{1}^{0}$
,
${\it\sigma}_{1}={\it\sigma}_{1}^{0}$
,
 ${\it\sigma}_{2}={\it\sigma}_{2}^{0}$
in (2.5) and (2.11).
${\it\sigma}_{2}={\it\sigma}_{2}^{0}$
in (2.5) and (2.11).
For a heat flux on the liquid–gas interface we use an empirical condition,
 $$\begin{eqnarray}{\it\kappa}_{2}\frac{\partial T_{2}}{\partial x_{i}}n_{2i}=-q(T_{2}-T_{g}),\end{eqnarray}$$
where
 $q$
is the heat exchange coefficient which is assumed to be constant.
$q$
is the heat exchange coefficient which is assumed to be constant.
In the case of thin film flows, when the fluid system is thin in one direction and extended in other directions, a long-wavelength expansion is used as a powerful tool for solving the problem. The leading order of this expansion is known as the lubrication approximation. The longwave approach is based on the assumption that the characteristic spatial scales in the directions
 $x$
and
$x$
and
 $y$
are much larger than that in the direction
$y$
are much larger than that in the direction
 $z$
. It is assumed that the solution of the problem depends on the scaled horizontal coordinates
$z$
. It is assumed that the solution of the problem depends on the scaled horizontal coordinates
 $X={\it\epsilon}x$
and
$X={\it\epsilon}x$
and
 $Y={\it\epsilon}y$
,
$Y={\it\epsilon}y$
,
 ${\it\epsilon}\ll 1$
, rather than on
${\it\epsilon}\ll 1$
, rather than on
 $x$
and
$x$
and
 $y$
. Also, it is assumed that the solution depends on the scaled time variable
$y$
. Also, it is assumed that the solution depends on the scaled time variable
 ${\it\tau}={\it\epsilon}t$
. Let us emphasize that the application of the longwave approach allows us to consider finite (not small) deformations of interfaces. A comprehensive description of the longwave approach can be found in the review papers of Davis (Reference Davis1987) and Oron, Davis & Bankoff (Reference Oron, Davis and Bankoff1997).
${\it\tau}={\it\epsilon}t$
. Let us emphasize that the application of the longwave approach allows us to consider finite (not small) deformations of interfaces. A comprehensive description of the longwave approach can be found in the review papers of Davis (Reference Davis1987) and Oron, Davis & Bankoff (Reference Oron, Davis and Bankoff1997).
In the present paper, we consider slow modulations of the substrate temperature,
 ${\it\omega}={\it\epsilon}{\it\omega}_{1}$
,
${\it\omega}={\it\epsilon}{\it\omega}_{1}$
,
 ${\it\omega}_{1}=O(1)$
. At the leading order, the temperature fields in both layers are determined by the following system of equations and boundary conditions:
${\it\omega}_{1}=O(1)$
. At the leading order, the temperature fields in both layers are determined by the following system of equations and boundary conditions:
 $$\begin{eqnarray}T_{1zz}=0;~0<z<H_{1};\quad T_{2zz}=0;~H_{1}<z<H_{2};\end{eqnarray}$$
 $$\begin{eqnarray}z=0:\quad T_{1}=T_{s}({\it\tau});\end{eqnarray}$$
 $$\begin{eqnarray}z=H_{1}:\quad T_{1}=T_{2};\quad {\it\kappa}_{1}T_{1z}={\it\kappa}_{2}T_{2z};\end{eqnarray}$$
 $$\begin{eqnarray}z=H_{2}:\quad {\it\kappa}_{2}T_{2z}=-q(T_{2}-T_{g}),\end{eqnarray}$$
where
 $$\begin{eqnarray}T_{s}({\it\tau})=T_{s}^{0}+{\it\Theta}\sin ({\it\omega}_{1}{\it\tau}).\end{eqnarray}$$
Solving problem (2.15a,b )–(2.19), we find
 $$\begin{eqnarray}\displaystyle & T_{1}(z,{\it\tau})=T_{s}({\it\tau})-(T_{s}({\it\tau})-T_{g})Dq{\it\kappa}_{2}z; & \displaystyle\end{eqnarray}$$
 $$\begin{eqnarray}\displaystyle & T_{2}(z,{\it\tau})=T_{s}({\it\tau})-(T_{s}({\it\tau})-T_{g})Dq[({\it\kappa}_{2}-{\it\kappa}_{1})H_{1}+{\it\kappa}_{1}z], & \displaystyle\end{eqnarray}$$
 $$\begin{eqnarray}D=[{\it\kappa}_{1}{\it\kappa}_{2}+q({\it\kappa}_{2}-{\it\kappa}_{1})H_{1}+q{\it\kappa}_{1}H_{2}]^{-1}.\end{eqnarray}$$
Thus, in the limit of slow temperature modulation, the temperature profiles can be obtained from those in the absence of temperature modulation by the replacement of
 $T_{s}^{0}$
by
$T_{s}^{0}$
by
 $T_{s}({\it\tau})$
.
$T_{s}({\it\tau})$
.
Note that the heat flux across the layers,
 $$\begin{eqnarray}j({\it\tau})=-{\it\kappa}_{1}T_{1z}=-{\it\kappa}_{2}T_{2z}=-[T_{s}({\it\tau})-T_{g})Dq{\it\kappa}_{1}{\it\kappa}_{2},\end{eqnarray}$$
does not depend on the vertical coordinate
 $z$
. The same temperature profile (2.20) and (2.21) can be obtained in the case where the heat flux
$z$
. The same temperature profile (2.20) and (2.21) can be obtained in the case where the heat flux
 $$\begin{eqnarray}j({\it\tau})=[T_{s}^{0}-T_{g}+{\it\Theta}\cos ({\it\omega}_{1}{\it\tau})]Dq{\it\kappa}_{1}{\it\kappa}_{2},\end{eqnarray}$$
rather than the temperature (2.19), is prescribed on the boundary with the solid substrate, i.e. the boundary condition (2.16) is replaced by
 $$\begin{eqnarray}z=0:\quad -{\it\kappa}_{1}T_{1z}=j({\it\tau}).\end{eqnarray}$$
Thus, the problems with boundary temperature modulation and heat flux modulation are equivalent in the framework of the approximation used.
The derivation of the longwave equations is similar to that given by Nepomnyashchy & Simanovskii (Reference Nepomnyashchy and Simanovskii2007) (see also Fisher & Golovin Reference Fisher and Golovin2005). In order to transform them to a non-dimensional form, we choose the mean thickness of the lower layer,
 $H_{1}^{0}$
, as the vertical length scale. The choice of the horizontal scale
$H_{1}^{0}$
, as the vertical length scale. The choice of the horizontal scale
 $L^{\ast }$
is arbitrary (see Nepomnyashchy & Simanovskii Reference Nepomnyashchy and Simanovskii2012),
$L^{\ast }$
is arbitrary (see Nepomnyashchy & Simanovskii Reference Nepomnyashchy and Simanovskii2012),
 $$\begin{eqnarray}{\it\tau}^{\ast }=\frac{{\it\eta}_{1}(L^{\ast })^{4}}{{\it\sigma}_{1}^{0}(H_{1}^{0})^{3}}\end{eqnarray}$$
is a time scale and
 $$\begin{eqnarray}p^{\ast }=\frac{{\it\sigma}_{1}^{0}H_{1}^{0}}{(L^{\ast })^{2}}\end{eqnarray}$$
is a pressure scale.
The non-dimensional parameters of the problem are as follows:
 $$\begin{eqnarray}M=\frac{{\it\alpha}_{1}(T_{s}^{0}-T_{g})}{{\it\sigma}_{1}^{0}}\left(\frac{L^{\ast }}{H_{1}^{0}}\right)^{2}\end{eqnarray}$$
is the modified Marangoni number,
 $$\begin{eqnarray}A=\frac{{\it\Theta}}{T_{s}^{0}-T_{g}}\end{eqnarray}$$
is the modulation amplitude,
 $$\begin{eqnarray}\mathit{Bi}=\frac{qH_{1}^{0}}{{\it\kappa}_{2}}\end{eqnarray}$$
is the Biot number,
 $$\begin{eqnarray}d=[{\it\kappa}+\mathit{Bi}(1-{\it\kappa})h_{1}+\mathit{Bi}\,{\it\kappa}h_{2}]^{-1},\end{eqnarray}$$
 ${\it\eta}={\it\eta}_{1}/{\it\eta}_{2}$
,
${\it\eta}={\it\eta}_{1}/{\it\eta}_{2}$
,
 ${\it\kappa}={\it\kappa}_{1}/{\it\kappa}_{2}$
,
${\it\kappa}={\it\kappa}_{1}/{\it\kappa}_{2}$
,
 ${\it\sigma}={\it\sigma}_{2}^{0}/{\it\sigma}_{1}^{0}$
,
${\it\sigma}={\it\sigma}_{2}^{0}/{\it\sigma}_{1}^{0}$
,
 ${\it\alpha}={\it\alpha}_{2}/{\it\alpha}_{1}$
,
${\it\alpha}={\it\alpha}_{2}/{\it\alpha}_{1}$
,
 ${\it\rho}={\it\rho}_{2}/{\it\rho}_{1}$
,
${\it\rho}={\it\rho}_{2}/{\it\rho}_{1}$
,
 ${\it\Omega}={\it\omega}_{1}{\it\tau}^{\ast }$
and
${\it\Omega}={\it\omega}_{1}{\it\tau}^{\ast }$
and
 $$\begin{eqnarray}\mathit{Ga}=\frac{g{\it\rho}_{1}(L^{\ast })^{2}}{{\it\sigma}_{1}^{0}}\end{eqnarray}$$
is the modified Galileo number, which characterizes the relative strength of the gravity with respect to capillary forces. Let us emphasize that the capillary forces are assumed to be sufficiently strong, so that they are relevant even for longwaves.
Finally, we arrive at the following mathematical model:
 $$\begin{eqnarray}h_{1{\it\tau}}+\boldsymbol{{\rm\nabla}}\boldsymbol{\cdot }\boldsymbol{q}_{1}=0,\quad h_{2{\it\tau}}+\boldsymbol{{\rm\nabla}}\boldsymbol{\cdot }\boldsymbol{q}_{2}=0,\end{eqnarray}$$
 $$\begin{eqnarray}\boldsymbol{q}_{1}=f_{11}\boldsymbol{{\rm\nabla}}p_{1}+f_{12}\boldsymbol{{\rm\nabla}}p_{2}+\boldsymbol{q}_{1}^{T},\quad \boldsymbol{q}_{2}=f_{21}\boldsymbol{{\rm\nabla}}p_{1}+f_{22}\boldsymbol{{\rm\nabla}}p_{2}+\boldsymbol{q}_{2}^{T};\end{eqnarray}$$
where
 $h_{j}=H_{j}/H_{1}^{0}$
,
$h_{j}=H_{j}/H_{1}^{0}$
,
 $p_{j}=P_{j}/p^{\ast }$
,
$p_{j}=P_{j}/p^{\ast }$
,
 $j=1,2$
,
$j=1,2$
,
 $$\begin{eqnarray}f_{11}=-{\textstyle \frac{1}{3}}h_{1}^{3},\quad f_{12}=-{\textstyle \frac{1}{2}}h_{1}^{2}(h_{2}-h_{1}),\end{eqnarray}$$
 $$\begin{eqnarray}\displaystyle & \displaystyle f_{21}=\frac{1}{6}h_{1}^{3}-\frac{1}{2}h_{1}^{2}h_{2},\quad f_{22}=(h_{2}-h_{1})\left[h_{1}^{2}\left(\frac{1}{2}-\frac{{\it\eta}}{3}\right)+h_{1}h_{2}\left(-1+\frac{2{\it\eta}}{3}\right)-\frac{{\it\eta}}{3}h_{2}^{2}\right]; & \displaystyle \nonumber\\ \displaystyle & & \displaystyle\end{eqnarray}$$
 $$\begin{eqnarray}\displaystyle & p_{1}=-{\rm\nabla}^{2}h_{1}-{\it\sigma}{\rm\nabla}^{2}h_{2}+\mathit{Ga}h_{1}+\mathit{Ga}{\it\rho}(h_{2}-h_{1}), & \displaystyle\end{eqnarray}$$
 $$\begin{eqnarray}\displaystyle & p_{2}=-{\it\sigma}{\rm\nabla}^{2}h_{2}+\mathit{Ga}{\it\rho}h_{2}. & \displaystyle\end{eqnarray}$$
Recall that the deformations of interfaces are not assumed to be small. The modulation of the substrate temperature influences the non-dimensional expressions for the fluxes generated by the thermocapillary effect:
 $$\begin{eqnarray}\displaystyle & \displaystyle \boldsymbol{q}_{1}^{T}=\frac{M}{2}(1+A\sin {\it\Omega}{\it\tau})h_{1}^{2}\boldsymbol{{\rm\nabla}}[d(\mathit{Bi}h_{1}-{\it\alpha}{\it\kappa})], & \displaystyle\end{eqnarray}$$
 $$\begin{eqnarray}\displaystyle & \displaystyle \boldsymbol{q}_{2}^{T}=\frac{M}{2}(1+A\sin {\it\Omega}{\it\tau})\{-h_{2}^{2}\boldsymbol{{\rm\nabla}}(\text{d}{\it\eta}{\it\alpha}{\it\kappa})+(2h_{2}-h_{1})h_{1}\boldsymbol{{\rm\nabla}}\{d[\mathit{Bi}h_{1}-{\it\alpha}{\it\kappa}(1-{\it\eta})]\}\}.\qquad & \displaystyle\end{eqnarray}$$
2.2. Boundary conditions
In order to carry out the computations in a finite region, we have to impose definite boundary conditions on lateral boundaries. To the best of the authors’ knowledge, such boundary conditions have never been systematically derived for the longwave system of (2.33). For the analysis of pattern formation, spatially periodic boundary conditions,
 $$\begin{eqnarray}h_{m}(X+L,Y,{\it\tau})=h_{m}(X,Y,{\it\tau}),\quad h_{m}(X,Y+L,{\it\tau})=h_{m}(X,Y,{\it\tau}),\quad m=1,2,\end{eqnarray}$$
are typically used, which allow the implementation of efficient integration methods based on the Fourier expansions. These boundary conditions have been applied for system (2.33), starting with the basic paper by Fisher & Golovin (Reference Fisher and Golovin2005). It is assumed implicitly that the influence of the boundaries is negligible when the period
 $L$
is large with respect to the characteristic scale of patterns. In the matter of fact, even in the case of stationary shortwave patterns, the boundary conditions are significant for the pattern wavenumber selection (Cross et al.
Reference Cross, Daniels, Hohenberg and Siggia1980; Zaleski Reference Zaleski1984). In the problem under consideration, the influence of boundary conditions is crucial, because of the following reasons. First, in the case of an oscillatory instability, one cannot ignore the reflection of waves on the distant boundaries, because a reflected wave returns. Second, the scale of patterns generated by the longwave instability near the threshold is of the same order as the size of the region. Therefore, it is desirable to replace the formal, mathematically convenient boundary conditions (2.41) by physically relevant ones.
$L$
is large with respect to the characteristic scale of patterns. In the matter of fact, even in the case of stationary shortwave patterns, the boundary conditions are significant for the pattern wavenumber selection (Cross et al.
Reference Cross, Daniels, Hohenberg and Siggia1980; Zaleski Reference Zaleski1984). In the problem under consideration, the influence of boundary conditions is crucial, because of the following reasons. First, in the case of an oscillatory instability, one cannot ignore the reflection of waves on the distant boundaries, because a reflected wave returns. Second, the scale of patterns generated by the longwave instability near the threshold is of the same order as the size of the region. Therefore, it is desirable to replace the formal, mathematically convenient boundary conditions (2.41) by physically relevant ones.
Partial differential equations (2.33), which contain fourth-order derivatives of
 $h_{1}$
and
$h_{1}$
and
 $h_{2}$
, have to be supplemented by two pairs of conditions on the lateral boundary. Assume that the boundary is impenetrable for liquids; then
$h_{2}$
, have to be supplemented by two pairs of conditions on the lateral boundary. Assume that the boundary is impenetrable for liquids; then
 $$\begin{eqnarray}\boldsymbol{q}_{m}\boldsymbol{\cdot }\boldsymbol{n}=0,\quad m=1,2,\end{eqnarray}$$
where
 $\boldsymbol{n}$
is the normal to the boundary. The second pair of boundary conditions is determined by the type of the contact of the interfaces at the lateral walls (Sen & Davis Reference Sen and Davis1982). The contacts can be pinned (
$\boldsymbol{n}$
is the normal to the boundary. The second pair of boundary conditions is determined by the type of the contact of the interfaces at the lateral walls (Sen & Davis Reference Sen and Davis1982). The contacts can be pinned (
 $h_{m},m=1,2$
, are fixed), or contact angles can be prescribed (
$h_{m},m=1,2$
, are fixed), or contact angles can be prescribed (
 $\boldsymbol{n}\boldsymbol{\cdot }\boldsymbol{{\rm\nabla}}h_{m},m=1,2$
, are fixed). Later on, for the sake of simplicity, we assume that the lateral walls are vertical and the contact angle is equal to
$\boldsymbol{n}\boldsymbol{\cdot }\boldsymbol{{\rm\nabla}}h_{m},m=1,2$
, are fixed). Later on, for the sake of simplicity, we assume that the lateral walls are vertical and the contact angle is equal to
 ${\rm\pi}/2$
for each interface, thus
${\rm\pi}/2$
for each interface, thus
 $$\begin{eqnarray}\boldsymbol{n}\boldsymbol{\cdot }\boldsymbol{{\rm\nabla}}h_{m}=0,\quad m=1,2.\end{eqnarray}$$
Specifically, in a finite cavity of a square shape,
 $0\leqslant X\leqslant \tilde{L}$
,
$0\leqslant X\leqslant \tilde{L}$
,
 $0\leqslant Y\leqslant \tilde{L}$
, conditions (2.42) and (2.43) become symmetry conditions,
$0\leqslant Y\leqslant \tilde{L}$
, conditions (2.42) and (2.43) become symmetry conditions,
 $$\begin{eqnarray}\displaystyle & h_{mX}=h_{mXXX}=0\quad \text{at}~X=0,0<Y<\tilde{L}\text{ and }X=\tilde{L},0<Y<\tilde{L}, & \displaystyle\end{eqnarray}$$
 $$\begin{eqnarray}\displaystyle & h_{mY}=h_{mYYY}=0\quad \text{at}~Y=0,0<X<\tilde{L}\text{ and }Y=\tilde{L},0<X<\tilde{L}. & \displaystyle\end{eqnarray}$$
Note that in the case
 $\tilde{L}=L/2$
, a symmetric continuation of a solution satisfying boundary conditions (2.44) and (2.45) into the infinite region gives a spatially periodic solution satisfying conditions (2.41). Thus, the set of solutions of the problem with boundary conditions (2.44) and (2.45) is a subset of the set of solutions satisfying the boundary conditions (2.41). However, solutions that are stable in the framework of the symmetric boundary conditions (2.44) and (2.45) may be unstable in the framework of the periodic boundary conditions (2.41) with respect to disturbances violating the symmetry conditions. Therefore, one can expect that for the same values of other parameters of the problem, the nonlinear dynamics of the system with boundary conditions (2.41) is richer than that with boundary conditions (2.44) and (2.45),
$\tilde{L}=L/2$
, a symmetric continuation of a solution satisfying boundary conditions (2.44) and (2.45) into the infinite region gives a spatially periodic solution satisfying conditions (2.41). Thus, the set of solutions of the problem with boundary conditions (2.44) and (2.45) is a subset of the set of solutions satisfying the boundary conditions (2.41). However, solutions that are stable in the framework of the symmetric boundary conditions (2.44) and (2.45) may be unstable in the framework of the periodic boundary conditions (2.41) with respect to disturbances violating the symmetry conditions. Therefore, one can expect that for the same values of other parameters of the problem, the nonlinear dynamics of the system with boundary conditions (2.41) is richer than that with boundary conditions (2.44) and (2.45),
 $\tilde{L}=L/2$
.
$\tilde{L}=L/2$
.
For any type of boundary conditions, evolution equations (2.33) have to be solved for
 $t>0$
with some initial conditions
$t>0$
with some initial conditions
 $h_{1}(X,Y,0)$
and
$h_{1}(X,Y,0)$
and
 $h_{2}(X,Y,0)$
such that the mean value of
$h_{2}(X,Y,0)$
such that the mean value of
 $h_{1}(X,Y,0)$
is equal to 1 and the mean value of
$h_{1}(X,Y,0)$
is equal to 1 and the mean value of
 $h_{2}(X,Y,0)$
is equal to
$h_{2}(X,Y,0)$
is equal to
 $h=H_{2}^{0}/H_{1}^{0}$
, where
$h=H_{2}^{0}/H_{1}^{0}$
, where
 $h>1$
.
$h>1$
.
In the present paper, we perform computations for the system of fluorinert FC70 (liquid 1) and silicon oil 10 (liquid 2). This system of liquids was used in microgravity experiments (see, e.g., Géoris et al.
Reference Géoris, Hennenberg, Lebon and Legros1999), and its physical parameters are well-known:
 ${\it\eta}_{1}=2.55\times 10^{-2}~\text{kg}~\text{m}^{-1}~\text{s}^{-1}$
,
${\it\eta}_{1}=2.55\times 10^{-2}~\text{kg}~\text{m}^{-1}~\text{s}^{-1}$
,
 ${\it\eta}_{2}=8.40\times 10^{-3}~\text{kg}~\text{m}^{-1}~\text{s}^{-1}$
,
${\it\eta}_{2}=8.40\times 10^{-3}~\text{kg}~\text{m}^{-1}~\text{s}^{-1}$
,
 ${\it\kappa}_{1}=7.00\times 10^{-2}~\text{J}~\text{m}^{-1}~\text{s}^{-1}~\text{K}^{-1}$
,
${\it\kappa}_{1}=7.00\times 10^{-2}~\text{J}~\text{m}^{-1}~\text{s}^{-1}~\text{K}^{-1}$
,
 ${\it\kappa}_{2}=0.134~\text{J}~\text{m}^{-1}~\text{s}^{-1}~\text{K}^{-1}$
,
${\it\kappa}_{2}=0.134~\text{J}~\text{m}^{-1}~\text{s}^{-1}~\text{K}^{-1}$
,
 ${\it\rho}_{1}=1.94\times 10^{3}~\text{kg}~\text{m}^{-3}$
,
${\it\rho}_{1}=1.94\times 10^{3}~\text{kg}~\text{m}^{-3}$
,
 ${\it\rho}_{2}=0.935\times 10^{3}~\text{kg}~\text{m}^{-3}$
,
${\it\rho}_{2}=0.935\times 10^{3}~\text{kg}~\text{m}^{-3}$
,
 ${\it\sigma}_{1}^{0}=7.6\times 10^{-3}~\text{N}~\text{m}^{-1}$
,
${\it\sigma}_{1}^{0}=7.6\times 10^{-3}~\text{N}~\text{m}^{-1}$
,
 ${\it\sigma}_{2}^{0}=1.97\times 10^{-2}~\text{N}~\text{m}^{-1}$
,
${\it\sigma}_{2}^{0}=1.97\times 10^{-2}~\text{N}~\text{m}^{-1}$
,
 ${\it\alpha}_{1}=3\times 10^{-5}~\text{N}~\text{m}^{-1}~\text{K}^{-1}$
,
${\it\alpha}_{1}=3\times 10^{-5}~\text{N}~\text{m}^{-1}~\text{K}^{-1}$
,
 ${\it\alpha}_{2}=6\times 10^{-5}~\text{N}~\text{m}^{-1}~\text{K}^{-1}$
(see Prakash & Koster Reference Prakash and Koster1994; Géoris et al.
Reference Géoris, Hennenberg, Lebon and Legros1999; Zhou, Liu & Tang Reference Zhou, Liu and Tang2004). The non-dimensional parameters are as follows:
${\it\alpha}_{2}=6\times 10^{-5}~\text{N}~\text{m}^{-1}~\text{K}^{-1}$
(see Prakash & Koster Reference Prakash and Koster1994; Géoris et al.
Reference Géoris, Hennenberg, Lebon and Legros1999; Zhou, Liu & Tang Reference Zhou, Liu and Tang2004). The non-dimensional parameters are as follows:
 ${\it\eta}=3.04$
,
${\it\eta}=3.04$
,
 ${\it\kappa}=0.522$
,
${\it\kappa}=0.522$
,
 ${\it\alpha}=2$
,
${\it\alpha}=2$
,
 ${\it\rho}=0.482$
and
${\it\rho}=0.482$
and
 ${\it\sigma}=2.6$
.
${\it\sigma}=2.6$
.
3. The case of constant substrate temperature
Let us discuss briefly the case of a constant substrate temperature
 $T_{s}({\it\tau})=T_{s}^{0}$
(Nepomnyashchy & Simanovskii Reference Nepomnyashchy and Simanovskii2012). Depending on the value of
$T_{s}({\it\tau})=T_{s}^{0}$
(Nepomnyashchy & Simanovskii Reference Nepomnyashchy and Simanovskii2012). Depending on the value of
 $\mathit{Bi}$
, the instability of the mechanical equilibrium state can be monotonic or oscillatory. While the monotonic instability typically leads to a rupture of the film (Van Hook et al.
Reference Van Hook, Schatz, Swift, McCormick and Swinney1997), the longwave oscillatory instability, which is developed in two-layer films, creates wavy patterns (Nepomnyashchy & Simanovskii Reference Nepomnyashchy and Simanovskii2007, Reference Nepomnyashchy and Simanovskii2012).
$\mathit{Bi}$
, the instability of the mechanical equilibrium state can be monotonic or oscillatory. While the monotonic instability typically leads to a rupture of the film (Van Hook et al.
Reference Van Hook, Schatz, Swift, McCormick and Swinney1997), the longwave oscillatory instability, which is developed in two-layer films, creates wavy patterns (Nepomnyashchy & Simanovskii Reference Nepomnyashchy and Simanovskii2007, Reference Nepomnyashchy and Simanovskii2012).
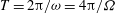
The oscillatory instability with a frequency
 ${\it\omega}_{o}(k)$
, where
${\it\omega}_{o}(k)$
, where
 $k$
is the wavenumber of the disturbance, is developed by heating from below (
$k$
is the wavenumber of the disturbance, is developed by heating from below (
 $M>0$
) if
$M>0$
) if
 $\mathit{Bi}<\mathit{Bi}_{c}$
, and by heating from above (
$\mathit{Bi}<\mathit{Bi}_{c}$
, and by heating from above (
 $M<0$
) if
$M<0$
) if
 $\mathit{Bi}>\mathit{Bi}_{c}$
, where
$\mathit{Bi}>\mathit{Bi}_{c}$
, where
 $$\begin{eqnarray}\mathit{Bi}_{c}=\frac{1+{\it\alpha}(1+{\it\eta}{\it\kappa}a^{2}+2{\it\kappa}a)}{a},\quad a=h-1.\end{eqnarray}$$
The oscillatory neutral curve is determined by the following expression:
 $$\begin{eqnarray}\displaystyle M_{o}(k) & = & \displaystyle \frac{2({\it\kappa}+\mathit{Bi}+\mathit{Bi}\,{\it\kappa}a)^{2}}{\mathit{Bi}\,{\it\kappa}a(\mathit{Bi}_{c}-\mathit{Bi})}\left\{\left[\frac{1}{3}+\left[a(a+1)+\frac{1}{3}{\it\eta}a^{3}\right]{\it\rho}\right]\mathit{Ga}\right.\nonumber\\ \displaystyle & & \displaystyle \left.+\,k^{2}\left[\frac{1}{3}+{\it\sigma}\left[a(a+1)+\frac{1}{3}(1+{\it\eta}a^{3})\right]\right]\right\}.\end{eqnarray}$$
Later on, we take
 $L=240$
,
$L=240$
,
 $h=2.5,~\mathit{Bi}=10$
. For the system of fluorinert FC70 and silicon oil 10,
$h=2.5,~\mathit{Bi}=10$
. For the system of fluorinert FC70 and silicon oil 10,
 $\mathit{Bi}_{c}\approx 8.85$
. Therefore, an oscillatory instability appears by heating from above (
$\mathit{Bi}_{c}\approx 8.85$
. Therefore, an oscillatory instability appears by heating from above (
 $M<0$
). At a fixed value of
$M<0$
). At a fixed value of
 $\mathit{Ga}$
, the instability takes place in the region
$\mathit{Ga}$
, the instability takes place in the region
 $M<M_{o}(k)$
. For the above-mentioned liquid system,
$M<M_{o}(k)$
. For the above-mentioned liquid system,
 $$\begin{eqnarray}M_{o}(k)=-283\mathit{Ga}-1.48\times 10^{3}k^{2}.\end{eqnarray}$$
Let us emphasize that the problem under consideration is a typical example of a longwave pattern formation. There is a significant difference between the developments of shortwave and longwave instabilities. In the former case, the critical wavenumber
 $k_{c}\neq 0$
has a crucial role. The patterns created by instabilities have a characteristic spatial period
$k_{c}\neq 0$
has a crucial role. The patterns created by instabilities have a characteristic spatial period
 ${\it\Lambda}_{c}=2{\rm\pi}/k_{c}$
, which does not depend on the size of the region
${\it\Lambda}_{c}=2{\rm\pi}/k_{c}$
, which does not depend on the size of the region
 $L$
, if
$L$
, if
 $L\gg {\it\Lambda}_{c}$
. In the latter case, the critical wavenumber
$L\gg {\it\Lambda}_{c}$
. In the latter case, the critical wavenumber
 $k_{c}=0$
, therefore the only spatial scale of patterns is
$k_{c}=0$
, therefore the only spatial scale of patterns is
 $L$
, which is one of the problem parameters. The composition of a pattern is determined by the discrete set
$L$
, which is one of the problem parameters. The composition of a pattern is determined by the discrete set
 $\{(m,n)\}$
of admissible wavevectors with positive growth rates
$\{(m,n)\}$
of admissible wavevectors with positive growth rates
 $\mathit{Re}\,{\it\lambda}(mk_{0},nk_{0})$
.
$\mathit{Re}\,{\it\lambda}(mk_{0},nk_{0})$
.
For instance, in the case of a computational region
 $0\leqslant X\leqslant L$
,
$0\leqslant X\leqslant L$
,
 $0\leqslant Y\leqslant L$
with periodic boundary conditions, the set of admissible wavevectors is discrete:
$0\leqslant Y\leqslant L$
with periodic boundary conditions, the set of admissible wavevectors is discrete:
 $$\begin{eqnarray}k_{x}=mk_{0},\quad k_{y}=nk_{0},\quad k_{0}=2{\rm\pi}/L,\end{eqnarray}$$
where
 $m$
,
$m$
,
 $n$
are integer numbers. Therefore,
$n$
are integer numbers. Therefore,
 $$\begin{eqnarray}k^{2}=(m^{2}+n^{2})k_{0}^{2}.\end{eqnarray}$$
Owing to the conservation of liquid volumes, the Fourier components of
 $h_{j}(X,Y)$
with
$h_{j}(X,Y)$
with
 $m=n=0$
do not change in time. For unstable modes, the minimum value of the wavevector compatible with the periodic boundary conditions is
$m=n=0$
do not change in time. For unstable modes, the minimum value of the wavevector compatible with the periodic boundary conditions is
 $k_{0}$
. The corresponding modes (
$k_{0}$
. The corresponding modes (
 $m=\pm 1$
,
$m=\pm 1$
,
 $n=0$
) and (
$n=0$
) and (
 $m=0$
,
$m=0$
,
 $n=\pm 1$
) describe waves with the isolines of
$n=\pm 1$
) describe waves with the isolines of
 $h_{j}$
parallel to axes
$h_{j}$
parallel to axes
 $X$
,
$X$
,
 $Y$
. The next admissible wavevector,
$Y$
. The next admissible wavevector,
 $k_{1}=k_{0}\sqrt{2}$
, is characteristic for modes with
$k_{1}=k_{0}\sqrt{2}$
, is characteristic for modes with
 $|m|=|n|=1$
,
$|m|=|n|=1$
,
 $m=\pm n$
, which correspond to waves with isolines parallel to the diagonals of the square computational region.
$m=\pm n$
, which correspond to waves with isolines parallel to the diagonals of the square computational region.
Let us consider now the case of symmetric boundary conditions (2.44) and (2.45) with
 $\tilde{L}=L/2$
. The eigenmodes of the linear stability problem satisfying the imposed boundary conditions have the spatial structure
$\tilde{L}=L/2$
. The eigenmodes of the linear stability problem satisfying the imposed boundary conditions have the spatial structure
 $\cos (mk_{0}X)\cos (nk_{0}Y)$
, where
$\cos (mk_{0}X)\cos (nk_{0}Y)$
, where
 $k_{0}$
is determined by relation (3.4),
$k_{0}$
is determined by relation (3.4),
 $m$
and
$m$
and
 $n$
are integers. Therefore, the set of admissible wavenumbers coincides with (3.5). Note that continuations of these eigenmodes to the full plane
$n$
are integers. Therefore, the set of admissible wavenumbers coincides with (3.5). Note that continuations of these eigenmodes to the full plane
 $(X,Y)$
satisfy the periodic boundary conditions (2.41). Thus, the set of eigenfunctions with symmetric boundary conditions (2.44) and (2.45),
$(X,Y)$
satisfy the periodic boundary conditions (2.41). Thus, the set of eigenfunctions with symmetric boundary conditions (2.44) and (2.45),
 $\tilde{L}=L/2$
is a subset of those with periodic boundary conditions (2.41).
$\tilde{L}=L/2$
is a subset of those with periodic boundary conditions (2.41).
For a square region, the eigenmodes with the spatial structure
 $\cos (mk_{0}X)\cos (nk_{0}Y)$
and
$\cos (mk_{0}X)\cos (nk_{0}Y)$
and
 $\cos (mk_{0}Y)\cos (nk_{0}X)$
have the same growth rates (for
$\cos (mk_{0}Y)\cos (nk_{0}X)$
have the same growth rates (for
 $m\neq n$
). That degeneracy may lead to a richer nonlinear dynamics than in the case of a rectangular region, where such a degeneracy is absent.
$m\neq n$
). That degeneracy may lead to a richer nonlinear dynamics than in the case of a rectangular region, where such a degeneracy is absent.
If we apply the symmetric boundary conditions with
 $\tilde{L}=L$
, the eigenmodes are
$\tilde{L}=L$
, the eigenmodes are
 $\cos (mk_{0}X/2)\cos (nk_{0}Y/2)$
, where
$\cos (mk_{0}X/2)\cos (nk_{0}Y/2)$
, where
 $k_{0}$
is determined by relation (3.4),
$k_{0}$
is determined by relation (3.4),
 $m$
and
$m$
and
 $n$
are integer. The set of eigenmodes in that case does not coincide with the set of eigenmodes in the case of boundary conditions (2.41), therefore we can expect that nonlinear structures in both cases will be significantly different.
$n$
are integer. The set of eigenmodes in that case does not coincide with the set of eigenmodes in the case of boundary conditions (2.41), therefore we can expect that nonlinear structures in both cases will be significantly different.
Let us emphasize that for any shape of the region and any boundary conditions, the near-threshold instability patterns are determined by a discrete set of large-scale unstable modes that depend significantly on the boundary conditions.
In the present paper, the simulations have been carried out for
 $\mathit{Ga}=0.025$
and
$\mathit{Ga}=0.025$
and
 $M=-8$
. Note that for
$M=-8$
. Note that for
 $k_{0}=2{\rm\pi}/L$
,
$k_{0}=2{\rm\pi}/L$
,
 $L=240$
, the critical Marangoni number
$L=240$
, the critical Marangoni number
 $M_{0}(k_{0})=-8.09$
, hence in the absence of modulation the quiescent state is stable. For
$M_{0}(k_{0})=-8.09$
, hence in the absence of modulation the quiescent state is stable. For
 $M=-8$
, the linear stability theory predicts the following values of the complex growth rates for admissible disturbances:
$M=-8$
, the linear stability theory predicts the following values of the complex growth rates for admissible disturbances:
 ${\it\lambda}(k_{0})\approx -4.32\times 10^{-7}\pm 0.696\times 10^{-3}\text{i}$
;
${\it\lambda}(k_{0})\approx -4.32\times 10^{-7}\pm 0.696\times 10^{-3}\text{i}$
;
 ${\it\lambda}(k_{1})\approx -1.02\times 10^{-5}\pm 1.40\times 10^{-3}\text{i}$
.
${\it\lambda}(k_{1})\approx -1.02\times 10^{-5}\pm 1.40\times 10^{-3}\text{i}$
.
4. Nonlinear simulations
Equations (2.33)–(2.38) have been discretized by central differences for spatial derivatives. Evolution equations (2.33) have been solved using an explicit scheme. Appropriate boundary conditions have been applied on the boundaries of the computational region. For any set of parameters, the evolution equations have been solved for two kinds of initial conditions
 $h_{j}(X,Y,0)$
: either (i) the initial conditions were chosen as their mean values plus small random deviations imposed using a code creating pseudo-random numbers, or (ii) they have been adopted from the simulations formerly carried out for another set of parameters.
$h_{j}(X,Y,0)$
: either (i) the initial conditions were chosen as their mean values plus small random deviations imposed using a code creating pseudo-random numbers, or (ii) they have been adopted from the simulations formerly carried out for another set of parameters.
4.1. Periodic boundary conditions
4.1.1. Methodology
The computations have been performed in the square region
 $0\leqslant X\leqslant L$
,
$0\leqslant X\leqslant L$
,
 $0\leqslant Y\leqslant L$
,
$0\leqslant Y\leqslant L$
,
 $L=240$
using the grids
$L=240$
using the grids
 $60\times 60$
,
$60\times 60$
,
 $80\times 80$
, and
$80\times 80$
, and
 $100\times 100$
. The time step was changed in the interval between 0.0005 and 0.005.
$100\times 100$
. The time step was changed in the interval between 0.0005 and 0.005.
The primary analysis of the obtained nonlinear regimes has been done using snapshots of the fields of
 $h_{j}(X,Y,{\it\tau})$
,
$h_{j}(X,Y,{\it\tau})$
,
 $j=1,2$
. Note that in all of the figures demonstrating these snapshots, the
$j=1,2$
. Note that in all of the figures demonstrating these snapshots, the
 $X$
-axis is horizontal and the
$X$
-axis is horizontal and the
 $Y$
-axis is vertical. The snapshot analysis has been supplemented by studying the time dependence of the maximum values of variables
$Y$
-axis is vertical. The snapshot analysis has been supplemented by studying the time dependence of the maximum values of variables
 $h_{j}$
,
$h_{j}$
,
 $$\begin{eqnarray}h_{max,j}({\it\tau})=\max h_{j}(X,Y,{\it\tau}),\end{eqnarray}$$
and Fourier components
 $$\begin{eqnarray}\displaystyle & \displaystyle a_{c}({\it\tau})=\frac{2}{L^{2}}\int _{0}^{L}\int _{0}^{L}h_{1}(X,Y,{\it\tau})\cos \frac{2{\rm\pi}X}{L}\text{d}X\text{d}Y, & \displaystyle\end{eqnarray}$$
 $$\begin{eqnarray}\displaystyle & \displaystyle a_{s}({\it\tau})=\frac{2}{L^{2}}\int _{0}^{L}\int _{0}^{L}h_{1}(X,Y,{\it\tau})\sin \frac{2{\rm\pi}X}{L}\text{d}X\text{d}Y, & \displaystyle\end{eqnarray}$$
 $$\begin{eqnarray}\displaystyle & \displaystyle b_{c}({\it\tau})=\frac{2}{L^{2}}\int _{0}^{L}\int _{0}^{L}h_{1}(X,Y,{\it\tau})\cos \frac{2{\rm\pi}Y}{L}\text{d}X\text{d}Y, & \displaystyle\end{eqnarray}$$
 $$\begin{eqnarray}\displaystyle & \displaystyle b_{s}({\it\tau})=\frac{2}{L^{2}}\int _{0}^{L}\int _{0}^{L}h_{1}(X,Y,{\it\tau})\sin \frac{2{\rm\pi}Y}{L}\text{d}X\text{d}Y, & \displaystyle\end{eqnarray}$$
 $$\begin{eqnarray}\displaystyle & \displaystyle \tilde{a}_{c}({\it\tau})=\frac{2}{L^{2}}\int _{0}^{L}\int _{0}^{L}h_{1}(X,Y,{\it\tau})\cos \frac{2{\rm\pi}(X+Y)}{L}\text{d}X\text{d}Y, & \displaystyle\end{eqnarray}$$
 $$\begin{eqnarray}\displaystyle & \displaystyle \tilde{a}_{s}({\it\tau})=\frac{2}{L^{2}}\int _{0}^{L}\int _{0}^{L}h_{1}(X,Y,{\it\tau})\sin \frac{2{\rm\pi}(X+Y)}{L}\text{d}X\text{d}Y, & \displaystyle\end{eqnarray}$$
 $$\begin{eqnarray}\displaystyle & \displaystyle \tilde{b}_{c}({\it\tau})=\frac{2}{L^{2}}\int _{0}^{L}\int _{0}^{L}h_{1}(X,Y,{\it\tau})\cos \frac{2{\rm\pi}(X-Y)}{L}\text{d}X\text{d}Y, & \displaystyle\end{eqnarray}$$
 $$\begin{eqnarray}\displaystyle & \displaystyle \tilde{b}_{s}({\it\tau})=\frac{2}{L^{2}}\int _{0}^{L}\int _{0}^{L}h_{1}(X,Y,{\it\tau})\sin \frac{2{\rm\pi}(X-Y)}{L}\text{d}X\text{d}Y. & \displaystyle\end{eqnarray}$$
We have used also quantities
 $$\begin{eqnarray}r({\it\tau})=\sqrt{a_{c}^{2}({\it\tau})+a_{s}^{2}({\it\tau})},\quad q({\it\tau})=\sqrt{b_{c}^{2}({\it\tau})+b_{s}^{2}({\it\tau})},\end{eqnarray}$$
 $$\begin{eqnarray}\tilde{r}({\it\tau})=\sqrt{\tilde{a}_{c}^{2}({\it\tau})+\tilde{a}_{s}^{2}({\it\tau})},\quad \tilde{q}({\it\tau})=\sqrt{\tilde{b}_{c}^{2}({\it\tau})+\tilde{b}_{s}^{2}({\it\tau})},\end{eqnarray}$$
which characterize the amplitudes of corresponding complex Fourier harmonics.
4.1.2. Subharmonic waves parallel to
 $X$
- or
$Y$
-axes
$X$
- or
$Y$
-axes


It is natural to expect that the modulation of the Marangoni number with frequency
 ${\it\Omega}$
will create waves periodic in time with the period equal to
${\it\Omega}$
will create waves periodic in time with the period equal to
 $T=2{\rm\pi}/{\it\omega}$
,
$T=2{\rm\pi}/{\it\omega}$
,
 ${\it\omega}={\it\Omega}/2$
, when
${\it\omega}={\it\Omega}/2$
, when
 ${\it\omega}$
is close to the critical eigenfrequency
${\it\omega}$
is close to the critical eigenfrequency
 ${\it\omega}_{o}={\it\omega}_{o}(k_{0})\approx 0.696\times 10^{-3}$
. Indeed, a parametric excitation of waves due to the gravity modulation has been found in a certain region of parameters
${\it\omega}_{o}={\it\omega}_{o}(k_{0})\approx 0.696\times 10^{-3}$
. Indeed, a parametric excitation of waves due to the gravity modulation has been found in a certain region of parameters
 $({\it\Omega},A)$
around the value
$({\it\Omega},A)$
around the value
 ${\it\Omega}=2{\it\omega}_{o}(k_{0})$
(see figure 2). Typically, a two-dimensional ‘roll-like’ wavy regime with spatial period
${\it\Omega}=2{\it\omega}_{o}(k_{0})$
(see figure 2). Typically, a two-dimensional ‘roll-like’ wavy regime with spatial period
 $L$
is generated (see figure 3).
$L$
is generated (see figure 3).

Figure 2. The diagram of flow regimes in the plane
 $({\it\Omega},A)$
for
$({\it\Omega},A)$
for
 ${\it\Omega}$
close to
${\it\Omega}$
close to
 $2{\it\omega}_{o}(k_{0})$
.Triangles, equilibrium; squares, two-dimensional waves; asterisks, time-periodic three-dimensional waves; circles, non-periodic three-dimensional waves.
$2{\it\omega}_{o}(k_{0})$
.Triangles, equilibrium; squares, two-dimensional waves; asterisks, time-periodic three-dimensional waves; circles, non-periodic three-dimensional waves.

Figure 3. (a) A snapshot of isolines of
 $h_{2}(X,Y,{\it\tau})-h$
; (b) a snapshot of isolines of
$h_{2}(X,Y,{\it\tau})-h$
; (b) a snapshot of isolines of
 $h_{1}(X,Y,{\it\tau})-1$
. Here
$h_{1}(X,Y,{\it\tau})-1$
. Here
 ${\it\Omega}=1.392\times 10^{-3}$
,
${\it\Omega}=1.392\times 10^{-3}$
,
 $A=1$
and
$A=1$
and
 ${\it\tau}=8\times 10^{5}$
.
${\it\tau}=8\times 10^{5}$
.

Figure 4. The dependences of
 $h_{max,2}({\it\tau})$
obtained using the grid
$h_{max,2}({\it\tau})$
obtained using the grid
 $60\times 60$
(line 1),
$60\times 60$
(line 1),
 $80\times 80$
(line 2),
$80\times 80$
(line 2),
 $100\times 100$
(line 3). Here
$100\times 100$
(line 3). Here
 ${\it\Omega}=1.392\times 10^{-3}$
and
${\it\Omega}=1.392\times 10^{-3}$
and
 $A=1$
.
$A=1$
.

Figure 5. The dependences of
 $a_{s}({\it\tau})$
(solid line) and
$a_{s}({\it\tau})$
(solid line) and
 $a_{c}({\it\tau})$
(dashed line). Here
$a_{c}({\it\tau})$
(dashed line). Here
 ${\it\Omega}=1.392\times 10^{-3}$
and
${\it\Omega}=1.392\times 10^{-3}$
and
 $A=1$
.
$A=1$
.
Examples of the obtained dependences
 $h_{max,2}({\it\tau})$
are shown in figure 4. One can see that the lines for different grids are almost indistinguishable. The maximum values of
$h_{max,2}({\it\tau})$
are shown in figure 4. One can see that the lines for different grids are almost indistinguishable. The maximum values of
 $h_{max,2}({\it\tau})$
obtained using the grids
$h_{max,2}({\it\tau})$
obtained using the grids
 $60\times 60$
,
$60\times 60$
,
 $80\times 80$
, and
$80\times 80$
, and
 $100\times 100$
, are 3.874, 3.886 and 3.888, correspondingly. The main computations have been done using the grid
$100\times 100$
, are 3.874, 3.886 and 3.888, correspondingly. The main computations have been done using the grid
 $80\times 80$
. The change of the time step in a wide interval did not lead to any visible changes of the results.
$80\times 80$
. The change of the time step in a wide interval did not lead to any visible changes of the results.
The stripes can be parallel (i) to the
 $X$
-axis or (ii) to the
$X$
-axis or (ii) to the
 $Y$
-axis. In the latter case, the Fourier components
$Y$
-axis. In the latter case, the Fourier components
 $b_{c}=b_{s}=0$
(see (4.4) and (4.5)), while the Fourier components
$b_{c}=b_{s}=0$
(see (4.4) and (4.5)), while the Fourier components
 $a_{c}$
and
$a_{c}$
and
 $a_{s}$
defined by formulas (4.2) and (4.3) oscillate with the period
$a_{s}$
defined by formulas (4.2) and (4.3) oscillate with the period
 $T=2{\rm\pi}/{\it\omega}=4{\rm\pi}/{\it\Omega}$
. In the course of oscillations,
$T=2{\rm\pi}/{\it\omega}=4{\rm\pi}/{\it\Omega}$
. In the course of oscillations,
 $a_{c}$
and
$a_{c}$
and
 $a_{s}$
are perfectly proportional to each other (see figure 5), which are characteristic for standing waves. This wavy pattern can be considered as a superposition of two travelling waves with equal amplitudes moving to the left and to the right.
$a_{s}$
are perfectly proportional to each other (see figure 5), which are characteristic for standing waves. This wavy pattern can be considered as a superposition of two travelling waves with equal amplitudes moving to the left and to the right.

Figure 6. The dependence of
 $r({\it\tau})$
. Here
$r({\it\tau})$
. Here
 ${\it\Omega}=1.392\times 10^{-3}$
and
${\it\Omega}=1.392\times 10^{-3}$
and
 $A=1$
.
$A=1$
.

Figure 7. The dependences of
 $h_{max,2}({\it\tau})$
(solid line) and
$h_{max,2}({\it\tau})$
(solid line) and
 $F({\it\tau})\equiv 2+(1/2)\sin ({\it\Omega}{\it\tau})$
(dashed line). Here
$F({\it\tau})\equiv 2+(1/2)\sin ({\it\Omega}{\it\tau})$
(dashed line). Here
 ${\it\Omega}=1.392\times 10^{-3}$
and
${\it\Omega}=1.392\times 10^{-3}$
and
 $A=1$
.
$A=1$
.

Figure 8. The phase trajectory in the plane (
 $h_{max,2}$
,
$h_{max,2}$
,
 $a_{s}$
). Here
$a_{s}$
). Here
 ${\it\Omega}=1.392\times 10^{-3}$
and
${\it\Omega}=1.392\times 10^{-3}$
and
 $A=1$
.
$A=1$
.

Figure 9. The dependence of
 $r({\it\tau})=q({\it\tau})$
. Here
$r({\it\tau})=q({\it\tau})$
. Here
 ${\it\Omega}=1.435\times 10^{-3}$
and
${\it\Omega}=1.435\times 10^{-3}$
and
 $A=0.5$
.
$A=0.5$
.

Figure 10. The dependences of
 $h_{max,2}({\it\tau})$
(solid line) and
$h_{max,2}({\it\tau})$
(solid line) and
 $F({\it\tau})\equiv 2+(1/2)\sin ({\it\Omega}{\it\tau})$
(dashed line). Here
$F({\it\tau})\equiv 2+(1/2)\sin ({\it\Omega}{\it\tau})$
(dashed line). Here
 ${\it\Omega}=1.435\times 10^{-3}$
and
${\it\Omega}=1.435\times 10^{-3}$
and
 $A=0.5$
.
$A=0.5$
.

Figure 11. Snapshots of the isolines of
 $h_{2}(X,Y,{\it\tau})-h$
; (a)
$h_{2}(X,Y,{\it\tau})-h$
; (a)
 ${\it\tau}=2302\,500$
; (b)
${\it\tau}=2302\,500$
; (b)
 ${\it\tau}=2303\,750$
; (c)
${\it\tau}=2303\,750$
; (c)
 ${\it\tau}=2304\,000$
; (d)
${\it\tau}=2304\,000$
; (d)
 ${\it\tau}=2304\,500$
. Here
${\it\tau}=2304\,500$
. Here
 ${\it\Omega}=1.435\times 10^{-3}$
and
${\it\Omega}=1.435\times 10^{-3}$
and
 $A=0.5$
.
$A=0.5$
.

Figure 12. Snapshots of the isolines of
 $h_{1}(X,Y,{\it\tau})-1$
; (a)
$h_{1}(X,Y,{\it\tau})-1$
; (a)
 ${\it\tau}=2302\,500$
; (b)
${\it\tau}=2302\,500$
; (b)
 ${\it\tau}=2303\,750$
; (c)
${\it\tau}=2303\,750$
; (c)
 ${\it\tau}=2304\,000$
; (d)
${\it\tau}=2304\,000$
; (d)
 ${\it\tau}=2304\,500$
. Here
${\it\tau}=2304\,500$
. Here
 ${\it\Omega}=1.435\times 10^{-3}$
and
${\it\Omega}=1.435\times 10^{-3}$
and
 $A=0.5$
.
$A=0.5$
.

Figure 13. The dependences of
 $r({\it\tau})$
(solid line) and
$r({\it\tau})$
(solid line) and
 $q({\it\tau})$
(dashed line). Here
$q({\it\tau})$
(dashed line). Here
 ${\it\Omega}=1.45\times 10^{-3}$
and
${\it\Omega}=1.45\times 10^{-3}$
and
 $A=1$
.
$A=1$
.
The quantity
 $r({\it\tau})$
is exactly equal to zero at some time instants (figure 6). Standing waves on both interfaces oscillate in phase. The amplitude of the liquid–gas interface oscillations is significantly larger than that of the liquid–liquid interface oscillations (cf. figure 3
a,b). Note that the maximum values of variables
$r({\it\tau})$
is exactly equal to zero at some time instants (figure 6). Standing waves on both interfaces oscillate in phase. The amplitude of the liquid–gas interface oscillations is significantly larger than that of the liquid–liquid interface oscillations (cf. figure 3
a,b). Note that the maximum values of variables
 $h_{m}~(m=1,2)$
determined by (4.1) oscillate with the period
$h_{m}~(m=1,2)$
determined by (4.1) oscillate with the period
 $T/2$
equal to the period of temperature modulation (see figure 7). The phase trajectory in the plane
$T/2$
equal to the period of temperature modulation (see figure 7). The phase trajectory in the plane
 $(h_{max,2},a_{s})$
illustrates the 1:2 relation between the oscillation periods of
$(h_{max,2},a_{s})$
illustrates the 1:2 relation between the oscillation periods of
 $h_{max,2}({\it\tau})$
and
$h_{max,2}({\it\tau})$
and
 $a_{s}({\it\tau})$
(see figure 8).
$a_{s}({\it\tau})$
(see figure 8).
In a definite region of parameters (see figure 2), three-dimensional flow regimes are generated. For those regimes, all of the Fourier components
 $a_{c}$
,
$a_{c}$
,
 $a_{s}$
,
$a_{s}$
,
 $b_{c}$
,
$b_{c}$
,
 $b_{s}$
are non-zero.
$b_{s}$
are non-zero.

Figure 14. Snapshots of the isolines of
 $h_{2}(X,Y,{\it\tau})-h$
; (a)
$h_{2}(X,Y,{\it\tau})-h$
; (a)
 ${\it\tau}=2200\,000$
;(b)
${\it\tau}=2200\,000$
;(b)
 ${\it\tau}=2200\,750$
; (c)
${\it\tau}=2200\,750$
; (c)
 ${\it\tau}=2201\,000$
; (d)
${\it\tau}=2201\,000$
; (d)
 ${\it\tau}=2201\,180$
. Here
${\it\tau}=2201\,180$
. Here
 ${\it\Omega}=1.45\times 10^{-3}$
and
${\it\Omega}=1.45\times 10^{-3}$
and
 $A=1$
.
$A=1$
.

Figure 15. Snapshots of the isolines of
 $h_{1}(X,Y,{\it\tau})-1$
; (a)
$h_{1}(X,Y,{\it\tau})-1$
; (a)
 ${\it\tau}=2200\,000$
;(b)
${\it\tau}=2200\,000$
;(b)
 ${\it\tau}=2200\,750$
; (c)
${\it\tau}=2200\,750$
; (c)
 ${\it\tau}=2201\,000$
; (d)
${\it\tau}=2201\,000$
; (d)
 ${\it\tau}=2201\,180$
. Here
${\it\tau}=2201\,180$
. Here
 ${\it\Omega}=1.45\times 10^{-3}$
and
${\it\Omega}=1.45\times 10^{-3}$
and
 $A=1$
.
$A=1$
.
One of these regimes is periodic in time: all of the above-mentioned Fourier components oscillate synchronously with period
 $T=2{\rm\pi}/{\it\omega}=4{\rm\pi}/{\it\Omega}$
. The quantities
$T=2{\rm\pi}/{\it\omega}=4{\rm\pi}/{\it\Omega}$
. The quantities
 $r({\it\tau})$
and
$r({\it\tau})$
and
 $q({\it\tau})$
are exactly equal to each other, and they oscillate with period
$q({\it\tau})$
are exactly equal to each other, and they oscillate with period
 $2{\rm\pi}/{\it\Omega}$
(figure 9).
$2{\rm\pi}/{\it\Omega}$
(figure 9).
The quantities
 $h_{max,j},~j=1,2$
, oscillate with the same period as
$h_{max,j},~j=1,2$
, oscillate with the same period as
 $r$
and
$r$
and
 $q$
(figure 10). Snapshots of time-periodic oscillatory patterns are presented in figures 11 and 12. The pattern has four symmetry axes; two of them are parallel to axes
$q$
(figure 10). Snapshots of time-periodic oscillatory patterns are presented in figures 11 and 12. The pattern has four symmetry axes; two of them are parallel to axes
 $X$
or
$X$
or
 $Y$
, and the other two axes are parallel to diagonals of the computational region.
$Y$
, and the other two axes are parallel to diagonals of the computational region.
The regime described above is obtained using three-dimensional initial conditions. In the case of two-dimensional initial conditions, a motionless state is established at the same values of parameters, i.e. a bistability takes place.
Another regime is quasiperiodic in time. The oscillations of
 $r({\it\tau})$
and
$r({\it\tau})$
and
 $q({\it\tau})$
are similar to those observed in the case of the periodic regime, but for the present regime
$q({\it\tau})$
are similar to those observed in the case of the periodic regime, but for the present regime
 $r({\it\tau})$
and
$r({\it\tau})$
and
 $q({\it\tau})$
are not equal to each other (figure 13), and the amplitude of their oscillations is slowly changed in a rather wide interval with the period which is much larger than the period of modulations. For instance, for the set of parameters corresponding to figure 13, the period of the amplitude modulation is
$q({\it\tau})$
are not equal to each other (figure 13), and the amplitude of their oscillations is slowly changed in a rather wide interval with the period which is much larger than the period of modulations. For instance, for the set of parameters corresponding to figure 13, the period of the amplitude modulation is
 ${\sim}2.5\times 10^{5}$
, while the period of substrate temperature modulation is
${\sim}2.5\times 10^{5}$
, while the period of substrate temperature modulation is
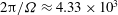 $2{\rm\pi}/{\it\Omega}\approx 4.33\times 10^{3}$
. The spatial structure of patterns is similar to that in the periodic regime, but it is less symmetric: there are no axes of symmetry parallel to the diagonals (see figures 14 and15).
$2{\rm\pi}/{\it\Omega}\approx 4.33\times 10^{3}$
. The spatial structure of patterns is similar to that in the periodic regime, but it is less symmetric: there are no axes of symmetry parallel to the diagonals (see figures 14 and15).

Figure 16. The dependences of
 $r({\it\tau})$
(solid line) and
$r({\it\tau})$
(solid line) and
 $q({\it\tau})$
(dashed line). Here
$q({\it\tau})$
(dashed line). Here
 ${\it\Omega}=2.922\times 10^{-3}$
and
${\it\Omega}=2.922\times 10^{-3}$
and
 $A=1$
.
$A=1$
.

Figure 17. The dependences of
 $\tilde{a}_{s}({\it\tau})$
(line 1),
$\tilde{a}_{s}({\it\tau})$
(line 1),
 $\tilde{a}_{c}({\it\tau})$
(line 2),
$\tilde{a}_{c}({\it\tau})$
(line 2),
 $\tilde{b}_{s}({\it\tau})$
(line 3),
$\tilde{b}_{s}({\it\tau})$
(line 3),
 $\tilde{b}_{c}({\it\tau})$
(line 4). Here
$\tilde{b}_{c}({\it\tau})$
(line 4). Here
 ${\it\Omega}=2.922\times 10^{-3}$
and
${\it\Omega}=2.922\times 10^{-3}$
and
 $A=1$
.
$A=1$
.
Note that wavy regimes described above are quite similar to those observed in the case of gravity modulation (Nepomnyashchy & Simanovskii Reference Nepomnyashchy and Simanovskii2013).
4.1.3. Nonlinear resonant wavy patterns
A number of wavy regimes have been observed for modulation frequencies around
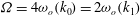 ${\it\Omega}=4{\it\omega}_{o}(k_{0})=2{\it\omega}_{o}(k_{1})$
. It should be emphasized that the observed waves are not just subharmonic waves with basic wavevectors
${\it\Omega}=4{\it\omega}_{o}(k_{0})=2{\it\omega}_{o}(k_{1})$
. It should be emphasized that the observed waves are not just subharmonic waves with basic wavevectors
 $(\pm k_{0},\pm k_{0})$
, which are characterized by the Fourier amplitudes
$(\pm k_{0},\pm k_{0})$
, which are characterized by the Fourier amplitudes
 $\tilde{a}_{s}({\it\tau})$
,
$\tilde{a}_{s}({\it\tau})$
,
 $\tilde{a}_{c}({\it\tau})$
,
$\tilde{a}_{c}({\it\tau})$
,
 $\tilde{b}_{s}({\it\tau})$
and
$\tilde{b}_{s}({\it\tau})$
and
 $\tilde{b}_{c}({\it\tau})$
. For all of the observed regimes, the Fourier amplitudes
$\tilde{b}_{c}({\it\tau})$
. For all of the observed regimes, the Fourier amplitudes
 $a_{s}({\it\tau})$
,
$a_{s}({\it\tau})$
,
 $a_{c}({\it\tau})$
,
$a_{c}({\it\tau})$
,
 $b_{s}({\it\tau})$
,
$b_{s}({\it\tau})$
,
 $b_{c}({\it\tau})$
, which correspond to wavevectors
$b_{c}({\it\tau})$
, which correspond to wavevectors
 $(\pm k_{0},0)$
and
$(\pm k_{0},0)$
and
 $(0,\pm k_{0})$
, are also present. The interaction of both systems of waves creates a plethora of different dynamical regimes. Let us list some of them.
$(0,\pm k_{0})$
, are also present. The interaction of both systems of waves creates a plethora of different dynamical regimes. Let us list some of them.
Symmetric wavy patterns. The simplest dynamical regime has been found for
 ${\it\Omega}=2.922\times 10^{-3}$
and
${\it\Omega}=2.922\times 10^{-3}$
and
 $A=1$
. This regime is periodic in time. The Fourier components
$A=1$
. This regime is periodic in time. The Fourier components
 $a_{s}({\it\tau})$
,
$a_{s}({\it\tau})$
,
 $a_{c}({\it\tau})$
,
$a_{c}({\it\tau})$
,
 $b_{s}({\it\tau})$
,
$b_{s}({\it\tau})$
,
 $b_{c}({\it\tau})$
oscillate with the period
$b_{c}({\it\tau})$
oscillate with the period
 $8{\rm\pi}/{\it\Omega}$
as ‘alternating rolls’, i.e.
$8{\rm\pi}/{\it\Omega}$
as ‘alternating rolls’, i.e.
 $a_{s}({\it\tau})$
is proportional to
$a_{s}({\it\tau})$
is proportional to
 $a_{c}({\it\tau})$
, and
$a_{c}({\it\tau})$
, and
 $b_{s}({\it\tau})$
is proportional to
$b_{s}({\it\tau})$
is proportional to
 $b_{c}({\it\tau})$
, but the standing waves
$b_{c}({\it\tau})$
, but the standing waves
 $(a_{s}({\it\tau}),a_{c}({\it\tau}))$
and
$(a_{s}({\it\tau}),a_{c}({\it\tau}))$
and
 $(b_{s}({\it\tau}),b_{c}({\it\tau}))$
oscillate with a phase shift;
$(b_{s}({\it\tau}),b_{c}({\it\tau}))$
oscillate with a phase shift;
 $r({\it\tau})$
and
$r({\it\tau})$
and
 $q({\it\tau})$
oscillate with the period
$q({\it\tau})$
oscillate with the period
 $4{\rm\pi}/{\it\Omega}$
(see figure 16). Note that the Fourier amplitudes
$4{\rm\pi}/{\it\Omega}$
(see figure 16). Note that the Fourier amplitudes
 $\tilde{a}_{s}({\it\tau})$
,
$\tilde{a}_{s}({\it\tau})$
,
 $\tilde{a}_{c}({\it\tau})$
,
$\tilde{a}_{c}({\it\tau})$
,
 $\tilde{b}_{s}({\it\tau})$
and
$\tilde{b}_{s}({\it\tau})$
and
 $\tilde{b}_{c}({\it\tau})$
oscillate synchronously with the period
$\tilde{b}_{c}({\it\tau})$
oscillate synchronously with the period
 $4{\rm\pi}/{\it\Omega}$
(see figure 17). The quantities
$4{\rm\pi}/{\it\Omega}$
(see figure 17). The quantities
 $\tilde{r}({\it\tau})$
and
$\tilde{r}({\it\tau})$
and
 $\tilde{q}({\it\tau})$
are exactly equal to each other, and they oscillate with the period
$\tilde{q}({\it\tau})$
are exactly equal to each other, and they oscillate with the period
 $2{\rm\pi}/{\it\Omega}$
.
$2{\rm\pi}/{\it\Omega}$
.
Thus, the regime is a synchronized superposition of alternating rolls with wavevectors
 $(\pm k_{0},0)$
,
$(\pm k_{0},0)$
,
 $(0,\pm k_{0})$
, which oscillate with the period
$(0,\pm k_{0})$
, which oscillate with the period
 $8{\rm\pi}/{\it\Omega}$
and pulsating squares with wavevectors
$8{\rm\pi}/{\it\Omega}$
and pulsating squares with wavevectors
 $(\pm k_{0},\pm k_{0})$
, which oscillate with the period
$(\pm k_{0},\pm k_{0})$
, which oscillate with the period
 $4{\rm\pi}/{\it\Omega}$
. Snapshots of the motion are shown in figure 18. One can see that the patterns are symmetric with respect to reflection axes parallel to the boundaries of the computational region. Note that two-dimensional disturbances decay for this choice of parameters.
$4{\rm\pi}/{\it\Omega}$
. Snapshots of the motion are shown in figure 18. One can see that the patterns are symmetric with respect to reflection axes parallel to the boundaries of the computational region. Note that two-dimensional disturbances decay for this choice of parameters.

Figure 18. Snapshots of the isolines of
 $h_{2}(X,Y,{\it\tau})-h$
: (a)
$h_{2}(X,Y,{\it\tau})-h$
: (a)
 ${\it\tau}=2400\,000$
; (b)
${\it\tau}=2400\,000$
; (b)
 ${\it\tau}=2400\,500$
; (c)
${\it\tau}=2400\,500$
; (c)
 ${\it\tau}=2401\,000$
; (d)
${\it\tau}=2401\,000$
; (d)
 ${\it\tau}=2401\,500$
. Here
${\it\tau}=2401\,500$
. Here
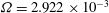 ${\it\Omega}=2.922\times 10^{-3}$
and
${\it\Omega}=2.922\times 10^{-3}$
and
 $A=1$
.
$A=1$
.

Figure 19. The snapshots of the isolines of
 $h_{2}(X,Y,{\it\tau})-h$
: (a)
$h_{2}(X,Y,{\it\tau})-h$
: (a)
 ${\it\tau}=2400\,000$
; (b)
${\it\tau}=2400\,000$
; (b)
 ${\it\tau}=2400\,250$
; (c)
${\it\tau}=2400\,250$
; (c)
 ${\it\tau}=2400\,750$
; (d)
${\it\tau}=2400\,750$
; (d)
 ${\it\tau}=2401\,750$
. Here
${\it\tau}=2401\,750$
. Here
 ${\it\Omega}=2.87\times 10^{-3}$
and
${\it\Omega}=2.87\times 10^{-3}$
and
 $A=0.75$
.
$A=0.75$
.

Figure 20. The phase trajectory in the plane
 $(a_{s},a_{c})$
. Here
$(a_{s},a_{c})$
. Here
 ${\it\Omega}=2.87\times 10^{-3}$
and
${\it\Omega}=2.87\times 10^{-3}$
and
 $A=1$
.
$A=1$
.
Asymmetric wavy patterns. The regime observed at
 ${\it\Omega}=2.87\times 10^{-3}$
and
${\it\Omega}=2.87\times 10^{-3}$
and
 $A=0.75$
is rather similar to that described above, but now the standing waves
$A=0.75$
is rather similar to that described above, but now the standing waves
 $(\tilde{a}_{s}({\it\tau}),\tilde{a}_{c}({\it\tau}))$
and
$(\tilde{a}_{s}({\it\tau}),\tilde{a}_{c}({\it\tau}))$
and
 $(\tilde{b}_{s}({\it\tau}),\tilde{b}_{c}({\it\tau}))$
have different amplitudes. The quantities
$(\tilde{b}_{s}({\it\tau}),\tilde{b}_{c}({\it\tau}))$
have different amplitudes. The quantities
 $\tilde{r}({\it\tau})$
,
$\tilde{r}({\it\tau})$
,
 $\tilde{q}({\it\tau})$
are different, and they oscillate with a phase shift. The pairs of Fourier components
$\tilde{q}({\it\tau})$
are different, and they oscillate with a phase shift. The pairs of Fourier components
 $(a_{s}({\it\tau}),a_{c}({\it\tau}))$
and
$(a_{s}({\it\tau}),a_{c}({\it\tau}))$
and
 $(b_{s}({\it\tau}),b_{c}({\it\tau}))$
form alternating rolls, as in the regime described in the previous subsection. Snapshots for this regime are shown in figure 19. While the wavy regimes mentioned above are superpositions of standing waves, the dynamics in the point
$(b_{s}({\it\tau}),b_{c}({\it\tau}))$
form alternating rolls, as in the regime described in the previous subsection. Snapshots for this regime are shown in figure 19. While the wavy regimes mentioned above are superpositions of standing waves, the dynamics in the point
 ${\it\Omega}=2.87\times 10^{-3}$
,
${\it\Omega}=2.87\times 10^{-3}$
,
 $A=1$
is more complex. The pair
$A=1$
is more complex. The pair
 $(\tilde{b}_{s}({\it\tau}),\tilde{b}_{c}({\it\tau}))$
forms a perfect standing wave with
$(\tilde{b}_{s}({\it\tau}),\tilde{b}_{c}({\it\tau}))$
forms a perfect standing wave with
 $\tilde{b}_{s}({\it\tau})$
and
$\tilde{b}_{s}({\it\tau})$
and
 $\tilde{b}_{c}({\it\tau})$
mutually proportional. The oscillations of
$\tilde{b}_{c}({\it\tau})$
mutually proportional. The oscillations of
 $\tilde{a}_{s}({\it\tau})$
and
$\tilde{a}_{s}({\it\tau})$
and
 $\tilde{a}_{c}({\it\tau})$
are periodic, but these functions are not proportional to each other, i.e. the wave resembles a standing wave but it is not ‘perfectly standing’. The oscillations of
$\tilde{a}_{c}({\it\tau})$
are periodic, but these functions are not proportional to each other, i.e. the wave resembles a standing wave but it is not ‘perfectly standing’. The oscillations of
 $a_{s}({\it\tau})$
,
$a_{s}({\it\tau})$
,
 $a_{c}({\it\tau})$
are quasiperiodic (see figure 20); they correspond to pulsating travelling waves. Therefore, the fields of
$a_{c}({\it\tau})$
are quasiperiodic (see figure 20); they correspond to pulsating travelling waves. Therefore, the fields of
 $h_{m}(X,Y,{\it\tau})$
,
$h_{m}(X,Y,{\it\tau})$
,
 $m=1,2$
, are quasiperiodic in
$m=1,2$
, are quasiperiodic in
 ${\it\tau}$
. Note that the global quantities
${\it\tau}$
. Note that the global quantities
 $h_{m,max}({\it\tau})$
and the combinations
$h_{m,max}({\it\tau})$
and the combinations
 $\tilde{r}({\it\tau})$
,
$\tilde{r}({\it\tau})$
,
 $\tilde{q}({\it\tau})$
,
$\tilde{q}({\it\tau})$
,
 $r({\it\tau})$
,
$r({\it\tau})$
,
 $q({\it\tau})$
, which do not include phases of waves, are periodic in time (see figure 21). Snapshots of height isolines for that regime are shown in figure 22.
$q({\it\tau})$
, which do not include phases of waves, are periodic in time (see figure 21). Snapshots of height isolines for that regime are shown in figure 22.

Figure 21. The dependences of
 $r({\it\tau})$
(solid line) and
$r({\it\tau})$
(solid line) and
 $q({\it\tau})$
(dashed line). Here
$q({\it\tau})$
(dashed line). Here
 ${\it\Omega}=2.87\times 10^{-3}$
and
${\it\Omega}=2.87\times 10^{-3}$
and
 $A=1$
.
$A=1$
.

Figure 22. The snapshots of the isolines of
 $h_{2}(X,Y,{\it\tau})-h$
: (a)
$h_{2}(X,Y,{\it\tau})-h$
: (a)
 ${\it\tau}=2200\,000$
; (b)
${\it\tau}=2200\,000$
; (b)
 ${\it\tau}=2201\,000$
; (c)
${\it\tau}=2201\,000$
; (c)
 ${\it\tau}=2201\,500$
; (d)
${\it\tau}=2201\,500$
; (d)
 ${\it\tau}=2202\,000$
. Here
${\it\tau}=2202\,000$
. Here
 ${\it\Omega}=2.87\times 10^{-3}$
and
${\it\Omega}=2.87\times 10^{-3}$
and
 $A=1$
.
$A=1$
.
As an example of a quasiperiodic regime, let us describe the wavy regime at
 ${\it\Omega}=2.83\times 10^{-3}$
,
${\it\Omega}=2.83\times 10^{-3}$
,
 $A=0.75$
. Figure 23 shows the temporal evolution of
$A=0.75$
. Figure 23 shows the temporal evolution of
 $\tilde{r}$
and
$\tilde{r}$
and
 $\tilde{q}$
. While the evolution of the larger quantity
$\tilde{q}$
. While the evolution of the larger quantity
 $\tilde{r}({\it\tau})$
looks periodic, the smaller quantity
$\tilde{r}({\it\tau})$
looks periodic, the smaller quantity
 $\tilde{q}({\it\tau})$
is not periodic. That is especially clear from the phase trajectory on the plane
$\tilde{q}({\it\tau})$
is not periodic. That is especially clear from the phase trajectory on the plane
 $(\tilde{b}_{s}({\it\tau}),\tilde{b}_{c}({\it\tau}))$
(see figure 24; recall that
$(\tilde{b}_{s}({\it\tau}),\tilde{b}_{c}({\it\tau}))$
(see figure 24; recall that
 $\tilde{q}({\it\tau})=\sqrt{\tilde{b}_{s}^{2}({\it\tau})+\tilde{b}_{c}^{2}({\it\tau})}$
).
$\tilde{q}({\it\tau})=\sqrt{\tilde{b}_{s}^{2}({\it\tau})+\tilde{b}_{c}^{2}({\it\tau})}$
).

Figure 23. The dependences of
 $\tilde{r}({\it\tau})$
(solid line) and
$\tilde{r}({\it\tau})$
(solid line) and
 $\tilde{q}({\it\tau})$
(dashed line). Here
$\tilde{q}({\it\tau})$
(dashed line). Here
 ${\it\Omega}=2.83\times 10^{-3}$
and
${\it\Omega}=2.83\times 10^{-3}$
and
 $A=0.75$
.
$A=0.75$
.

Figure 24. The phase trajectory in the plane
 $(\tilde{b}_{s},\tilde{b}_{c})$
. Here
$(\tilde{b}_{s},\tilde{b}_{c})$
. Here
 ${\it\Omega}=2.83\times 10^{-3}$
and
${\it\Omega}=2.83\times 10^{-3}$
and
 $A=0.75$
.
$A=0.75$
.
The diagram of periodic and non-periodic regimes for
 ${\it\Omega}$
around
${\it\Omega}$
around
 $2{\it\omega}_{0}(k_{1})$
is shown in figure 25.
$2{\it\omega}_{0}(k_{1})$
is shown in figure 25.

Figure 25. The diagram of the flow regimes in the plane
 $({\it\Omega},A)$
for
$({\it\Omega},A)$
for
 ${\it\Omega}$
close to
${\it\Omega}$
close to
 $4{\it\omega}_{o}(k_{0})$
; periodic boundary conditions. Triangles, equilibrium; asterisks, symmetric patterns; diamonds, asymmetric patterns.
$4{\it\omega}_{o}(k_{0})$
; periodic boundary conditions. Triangles, equilibrium; asterisks, symmetric patterns; diamonds, asymmetric patterns.
Note that the nonlinear resonant wavy regimes in the region around
 ${\it\Omega}=2{\it\omega}_{0}(k_{1})$
obtained in the case of the substrate temperature modulation, are strongly different from those obtained in the case of vibrations (see Nepomnyashchy & Simanovskii Reference Nepomnyashchy and Simanovskii2013).
${\it\Omega}=2{\it\omega}_{0}(k_{1})$
obtained in the case of the substrate temperature modulation, are strongly different from those obtained in the case of vibrations (see Nepomnyashchy & Simanovskii Reference Nepomnyashchy and Simanovskii2013).
4.2. Symmetric boundary conditions with
$\tilde{L}=L/2$

As explained in § 2, solutions of problem (2.33) with symmetric boundary conditions (2.44), (2.45),
 $\tilde{L}=L/2$
, form a subset of the set of solutions with periodic boundary conditions (2.41). Thus, not all of the nonlinear regimes described in § 4.1 survive under the symmetric boundary conditions.
$\tilde{L}=L/2$
, form a subset of the set of solutions with periodic boundary conditions (2.41). Thus, not all of the nonlinear regimes described in § 4.1 survive under the symmetric boundary conditions.
The following definitions of Fourier components are used in the present section:
 $$\begin{eqnarray}\displaystyle & \displaystyle a_{c}({\it\tau})=\frac{2}{L^{2}}\int _{0}^{L/2}\int _{0}^{L/2}h_{1}(X,Y,{\it\tau})\cos \frac{2{\rm\pi}X}{L}\text{d}X\text{d}Y, & \displaystyle\end{eqnarray}$$
 $$\begin{eqnarray}\displaystyle & \displaystyle b_{c}({\it\tau})=\frac{2}{L^{2}}\int _{0}^{L/2}\int _{0}^{L/2}h_{1}(X,Y,{\it\tau})\cos \frac{2{\rm\pi}Y}{L}\text{d}X\text{d}Y. & \displaystyle\end{eqnarray}$$
 $a_{c}$
,
$a_{c}$
,
 $b_{c}$
, we have calculated the quantities
$b_{c}$
, we have calculated the quantities  $$\begin{eqnarray}\displaystyle & \displaystyle \bar{b}_{c}({\it\tau})=\frac{2}{L^{2}}\int _{0}^{L/2}\int _{0}^{L/2}h_{1}(X,Y,{\it\tau})\cos \frac{4{\rm\pi}Y}{L}\text{d}X\text{d}Y, & \displaystyle\end{eqnarray}$$
 $$\begin{eqnarray}\displaystyle & \displaystyle \hat{b}_{c}({\it\tau})=\frac{2}{L^{2}}\int _{0}^{L/2}\int _{0}^{L/2}h_{2}(X,Y,{\it\tau})\cos \frac{4{\rm\pi}Y}{L}\text{d}X\text{d}Y. & \displaystyle\end{eqnarray}$$
4.2.1. Region of
${\it\Omega}$
around
$2{\it\omega}_{0}(k_{0})$


First, let us consider the region of subharmonic waves (
 ${\it\Omega}$
around
${\it\Omega}$
around
 $2{\it\omega}_{0}(k_{0})$
) and examine whether nonlinear regimes described above satisfy conditions (2.44) and (2.45) for an appropriate location of the origin
$2{\it\omega}_{0}(k_{0})$
) and examine whether nonlinear regimes described above satisfy conditions (2.44) and (2.45) for an appropriate location of the origin
 $X=0$
,
$X=0$
,
 $Y=0$
.
$Y=0$
.
The two-dimensional subharmonic waves shown in figure 3 satisfy boundary conditions (2.44), (2.45) if the origin
 $X=0$
,
$X=0$
,
 $Y=0$
is fixed in such a way that
$Y=0$
is fixed in such a way that
 $a_{s}=0$
. The fields of isolines (figure 26) and the dependence
$a_{s}=0$
. The fields of isolines (figure 26) and the dependence
 $h_{2,max}({\it\tau})$
(figure 27) obtained by numerical simulations with symmetric boundary conditions are identical to those obtained with periodic boundary conditions (recall that stripes parallel to
$h_{2,max}({\it\tau})$
(figure 27) obtained by numerical simulations with symmetric boundary conditions are identical to those obtained with periodic boundary conditions (recall that stripes parallel to
 $X$
-axis and to
$X$
-axis and to
 $Y$
-axis are equivalent).
$Y$
-axis are equivalent).

Figure 26. (a) A snapshot of isolines of
 $h_{2}(X,Y,{\it\tau})-h$
; (b) a snapshot of isolines of
$h_{2}(X,Y,{\it\tau})-h$
; (b) a snapshot of isolines of
 $h_{1}(X,Y,{\it\tau})-1$
for symmetric boundary conditions with
$h_{1}(X,Y,{\it\tau})-1$
for symmetric boundary conditions with
 $\tilde{L}=120$
. Here
$\tilde{L}=120$
. Here
 ${\it\Omega}=1.392\times 10^{-3}$
,
${\it\Omega}=1.392\times 10^{-3}$
,
 $A=1$
and
$A=1$
and
 ${\it\tau}=2\times 10^{6}$
.
${\it\tau}=2\times 10^{6}$
.

Figure 27. The dependence of
 $h_{max,2}({\it\tau})$
obtained for symmetric boundary conditions with
$h_{max,2}({\it\tau})$
obtained for symmetric boundary conditions with
 $\tilde{L}=120$
,
$\tilde{L}=120$
,
 ${\it\Omega}=1.392\times 10^{-3}$
and
${\it\Omega}=1.392\times 10^{-3}$
and
 $A=1$
.
$A=1$
.

Figure 28. The phase trajectory in the plane (
 $a_{c}$
,
$a_{c}$
,
 $b_{c}$
). Symmetric boundary conditions,
$b_{c}$
). Symmetric boundary conditions,
 $\tilde{L}=120$
,
$\tilde{L}=120$
,
 ${\it\Omega}=2.922\times 10^{-3}$
and
${\it\Omega}=2.922\times 10^{-3}$
and
 $A=1$
.
$A=1$
.

Figure 29. The dependences of
 $b_{c}({\it\tau})$
,
$b_{c}({\it\tau})$
,
 $\hat{b}_{c}({\it\tau})$
obtained for symmetric boundary conditions with
$\hat{b}_{c}({\it\tau})$
obtained for symmetric boundary conditions with
 $\tilde{L}=120$
,
$\tilde{L}=120$
,
 ${\it\Omega}=2.87\times 10^{-3}$
and
${\it\Omega}=2.87\times 10^{-3}$
and
 $A=1$
.
$A=1$
.

Figure 30. The diagram of flow regimes in the plane
 $({\it\Omega},A)$
for
$({\it\Omega},A)$
for
 ${\it\Omega}$
close to
${\it\Omega}$
close to
 $4{\it\omega}_{o}(k_{0})$
. Triangles, equilibrium; squares, two-dimensional waves; asterisks, time-periodic three-dimensional waves; circles, quasiperiodic three-dimensional waves.
$4{\it\omega}_{o}(k_{0})$
. Triangles, equilibrium; squares, two-dimensional waves; asterisks, time-periodic three-dimensional waves; circles, quasiperiodic three-dimensional waves.

Figure 31. The dependences of
 $a_{c}({\it\tau})$
(solid line) and
$a_{c}({\it\tau})$
(solid line) and
 $b_{c}({\it\tau})$
(dashed line) for symmetric boundary conditions with
$b_{c}({\it\tau})$
(dashed line) for symmetric boundary conditions with
 $\tilde{L}=120$
,
$\tilde{L}=120$
,
 ${\it\Omega}=2.83\times 10^{-3}$
and
${\it\Omega}=2.83\times 10^{-3}$
and
 $A=0.5$
.
$A=0.5$
.

Figure 32. The dependences of
 $a_{c}({\it\tau})$
(solid line) and
$a_{c}({\it\tau})$
(solid line) and
 $b_{c}({\it\tau})$
(dashed line) for symmetric boundary conditions with
$b_{c}({\it\tau})$
(dashed line) for symmetric boundary conditions with
 $\tilde{L}=240$
,
$\tilde{L}=240$
,
 ${\it\Omega}=2.83\times 10^{-3}$
and
${\it\Omega}=2.83\times 10^{-3}$
and
 $A=1$
.
$A=1$
.
The three-dimensional waves shown in figures 11 and 12 have symmetry axes parallel to axes
 $X$
and
$X$
and
 $Y$
. Therefore, this kind of structures is also retained. Note that for the same values of parameters two-dimensional disturbances decay, i.e. a motionless state is stable as well. Another kind of bistability has been revealed for
$Y$
. Therefore, this kind of structures is also retained. Note that for the same values of parameters two-dimensional disturbances decay, i.e. a motionless state is stable as well. Another kind of bistability has been revealed for
 ${\it\Omega}=1.435\times 10^{-3}$
and
${\it\Omega}=1.435\times 10^{-3}$
and
 $A=1$
. Depending on the initial conditions, one obtains either a periodic two-dimensional wave or quasiperiodic three-dimensional oscillations.
$A=1$
. Depending on the initial conditions, one obtains either a periodic two-dimensional wave or quasiperiodic three-dimensional oscillations.
The quasiperiodic regime shown in figures 14 and 15 is also retained for symmetric boundary conditions.
4.2.2. Region of
${\it\Omega}$
around
$4{\it\omega}_{0}(k_{0})$


In that region, as a rule, a multistability of regimes has been observed.
For
 ${\it\Omega}=2.922\times 10^{-3}$
,
${\it\Omega}=2.922\times 10^{-3}$
,
 $A=1$
, the pattern found in the case of periodic boundary conditions is symmetric to reflections. Therefore, one can expect that this pattern will be retained under symmetric boundary conditions. Indeed, three-dimensional initial disturbances generate a three-dimensional oscillatory regime of alternating rolls similar to that observed in the case of periodic boundary conditions. In figure 28, a trajectory in the phase plane
$A=1$
, the pattern found in the case of periodic boundary conditions is symmetric to reflections. Therefore, one can expect that this pattern will be retained under symmetric boundary conditions. Indeed, three-dimensional initial disturbances generate a three-dimensional oscillatory regime of alternating rolls similar to that observed in the case of periodic boundary conditions. In figure 28, a trajectory in the phase plane
 $(a_{c},b_{c})$
is shown. The trajectory is closed, hence the oscillations are strictly periodic in time. If the initial disturbances are two-dimensional, they decay and a motionless state is established. Thus, we have found that both the three-dimensional regime and the motionless state are stable.
$(a_{c},b_{c})$
is shown. The trajectory is closed, hence the oscillations are strictly periodic in time. If the initial disturbances are two-dimensional, they decay and a motionless state is established. Thus, we have found that both the three-dimensional regime and the motionless state are stable.
Another kind of bistability has been observed for
 ${\it\Omega}=2.87\times 10^{-3}$
and
${\it\Omega}=2.87\times 10^{-3}$
and
 $A=1$
. Using two-dimensional initial conditions, we obtain a two-dimensional periodic standing wave, which is characterized by non-zero values of the Fourier components
$A=1$
. Using two-dimensional initial conditions, we obtain a two-dimensional periodic standing wave, which is characterized by non-zero values of the Fourier components
 $\bar{b}_{c}({\it\tau})$
,
$\bar{b}_{c}({\it\tau})$
,
 $\hat{b}_{c}({\it\tau})$
. The dependences
$\hat{b}_{c}({\it\tau})$
. The dependences
 $\bar{b}_{c}({\it\tau})$
,
$\bar{b}_{c}({\it\tau})$
,
 $\hat{b}_{c}({\it\tau})$
are shown in figure 29. The period of oscillations is equal to the modulation period. Three-dimensional initial conditions generate a three-dimensional oscillatory regime of alternating rolls similar to the regime found for
$\hat{b}_{c}({\it\tau})$
are shown in figure 29. The period of oscillations is equal to the modulation period. Three-dimensional initial conditions generate a three-dimensional oscillatory regime of alternating rolls similar to the regime found for
 ${\it\Omega}=2.922\times 10^{-3}$
and
${\it\Omega}=2.922\times 10^{-3}$
and
 $A=1$
. Note that the regime obtained in the case of symmetric boundary conditions is simpler than that observed in the case of periodic boundary conditions. The simplification of the pattern dynamics is due to the following reason. The stripes with the axes directed along the diagonals of the computational region play an important role in the dynamics of patterns under the periodic boundary conditions. In the case of symmetry conditions (2.44) and (2.45), the stripes of this kind do not appear.
$A=1$
. Note that the regime obtained in the case of symmetric boundary conditions is simpler than that observed in the case of periodic boundary conditions. The simplification of the pattern dynamics is due to the following reason. The stripes with the axes directed along the diagonals of the computational region play an important role in the dynamics of patterns under the periodic boundary conditions. In the case of symmetry conditions (2.44) and (2.45), the stripes of this kind do not appear.

Figure 33. Snapshots of the isolines of
 $h_{1}(X,Y,{\it\tau})-1$
for symmetric boundary conditions with
$h_{1}(X,Y,{\it\tau})-1$
for symmetric boundary conditions with
 $\tilde{L}=240$
,
$\tilde{L}=240$
,
 ${\it\Omega}=2.83\times 10^{-3}$
and
${\it\Omega}=2.83\times 10^{-3}$
and
 $A=1$
: (a)
$A=1$
: (a)
 ${\it\tau}=616\,695$
; (b)
${\it\tau}=616\,695$
; (b)
 ${\it\tau}=616\,990$
; (c)
${\it\tau}=616\,990$
; (c)
 ${\it\tau}=617\,017$
; (d)
${\it\tau}=617\,017$
; (d)
 ${\it\tau}=617\,651$
.
${\it\tau}=617\,651$
.

Figure 34. Snapshots of the isolines of
 $h_{1}(X,Y,{\it\tau})-1$
for symmetric boundary conditions with
$h_{1}(X,Y,{\it\tau})-1$
for symmetric boundary conditions with
 $\tilde{L}=240$
,
$\tilde{L}=240$
,
 ${\it\Omega}=2.87\times 10^{-3}$
and
${\it\Omega}=2.87\times 10^{-3}$
and
 $A=1$
: (a)
$A=1$
: (a)
 ${\it\tau}=633\,415$
; (b)
${\it\tau}=633\,415$
; (b)
 ${\it\tau}=633\,559$
; (c)
${\it\tau}=633\,559$
; (c)
 ${\it\tau}=633\,565$
; (d)
${\it\tau}=633\,565$
; (d)
 ${\it\tau}=633\,605$
.
${\it\tau}=633\,605$
.
In general, periodic oscillations in the form of alternating rolls are typical in the case of symmetric boundary conditions (see figure 30). Nevertheless, a quasiperiodic temporal evolution is also possible, even with a simplified spatial structure (see figure 30). An example of quasiperiodic oscillations is shown in figure 31. Three-dimensional quasiperiodic oscillations in the form of alternating rolls look like periodic ones (with the period about
 $4{\rm\pi}/{\it\Omega}\approx 4.4\times 10^{3}$
) during relatively short time intervals, but those oscillations are modulated with the long period (about
$4{\rm\pi}/{\it\Omega}\approx 4.4\times 10^{3}$
) during relatively short time intervals, but those oscillations are modulated with the long period (about
 $8\times 10^{5}$
).
$8\times 10^{5}$
).
4.3. Symmetric boundary conditions with
$\tilde{L}=L$

We return to definitions (4.2) and (4.4). As explained in § 2, solutions of problem (2.33) with symmetric boundary conditions (2.44) and (2.45),
 $\tilde{L}=L$
, generally can be extended as functions satisfying spatially periodic boundary conditions with periods
$\tilde{L}=L$
, generally can be extended as functions satisfying spatially periodic boundary conditions with periods
 $2L$
in both variables
$2L$
in both variables
 $X$
,
$X$
,
 $Y$
. Nevertheless, we observe solutions with periods smaller than
$Y$
. Nevertheless, we observe solutions with periods smaller than
 $2L$
in some simulations.
$2L$
in some simulations.
For instance, we obtain quasiperiodic oscillations of the type of alternating rolls at
 ${\it\Omega}=0.00283$
and
${\it\Omega}=0.00283$
and
 $A=1$
(see figure 32). The spatial structure of pattern is periodic with period
$A=1$
(see figure 32). The spatial structure of pattern is periodic with period
 $L$
(figure 33). For
$L$
(figure 33). For
 ${\it\Omega}=0.00287$
and
${\it\Omega}=0.00287$
and
 $A=1$
we obtain periodic standing waves with the spatial period
$A=1$
we obtain periodic standing waves with the spatial period
 $L/2$
(see figure 34); the period of oscillation is equal to the period of the parameter modulation
$L/2$
(see figure 34); the period of oscillation is equal to the period of the parameter modulation
 $2{\rm\pi}/{\it\Omega}$
.
$2{\rm\pi}/{\it\Omega}$
.
Note that the above-mentioned structures are not observed, when periodic boundary conditions with periods
 $L$
are imposed, because in the latter case they are unstable with respect to disturbances violating symmetry conditions.
$L$
are imposed, because in the latter case they are unstable with respect to disturbances violating symmetry conditions.
5. Conclusions
We have investigated Marangoni waves generated in a two-layer film by the modulation of a temperature or a heat flux at the solid substrate. The analysis has been carried out using a closed system of strongly nonlinear equations, which allows us to calculate parametrically excited waves far from the instability threshold. The major attention has been paid to waves excited parametrically in two intervals of frequencies
 ${\it\Omega}$
, around
${\it\Omega}$
, around
 $2{\it\omega}_{o}(k_{0})$
and around
$2{\it\omega}_{o}(k_{0})$
and around
 $4{\it\omega}_{o}(k_{0})$
. The first interval corresponds to stripes parallel to the boundaries of the computational region, while the second interval corresponds to stripes parallel to the diagonals of the computational region. Two types of lateral boundary conditions, periodic and symmetric ones, have been used. While the linear mechanism of the excitation is identical for both types of waves, the dynamics of nonlinear waves in both cases turns out to be different.
$4{\it\omega}_{o}(k_{0})$
. The first interval corresponds to stripes parallel to the boundaries of the computational region, while the second interval corresponds to stripes parallel to the diagonals of the computational region. Two types of lateral boundary conditions, periodic and symmetric ones, have been used. While the linear mechanism of the excitation is identical for both types of waves, the dynamics of nonlinear waves in both cases turns out to be different.
In the former case, for both kinds of boundary conditions the dynamics is determined by the nonlinear interaction of two standing waves, corresponding to stripes parallel to the
 $X$
-axis and
$X$
-axis and
 $Y$
-axis. These waves either compete or coexist. If the waves compete, two-dimensional patterns are generated. In the case of the coexistence, both waves can oscillate in a synchronous or asynchronous way. The multistability of regimes is observed.
$Y$
-axis. These waves either compete or coexist. If the waves compete, two-dimensional patterns are generated. In the case of the coexistence, both waves can oscillate in a synchronous or asynchronous way. The multistability of regimes is observed.
In the latter case, a much more extensive set of regimes has been observed for periodic boundary conditions, where a nonlinear resonant interaction of waves with orientations parallel to axes and to diagonals takes place. Depending on the modulation parameters, one can obtain structures with different degrees of synchronization, from a full synchronization of pulsating squares and alternating rolls to a desynchronized nonlinear superposition of pulsating travelling waves. These novel three-dimensional flows have never been described formerly, and they are significantly different from those obtained in the case of vibration. The patterns observed in the case of symmetric boundary conditions, are strongly different from those found for periodic boundary conditions, because the waves with orientation parallel to diagonals are not allowed. Due to the latter circumstance, one can observe some new symmetric patterns that are unstable in the case of periodic boundary conditions.
Let us discuss the possibility of the experimental observation of the phenomena described in the paper. In general, the deformational longwave mode of Marangoni instability is developed only in sufficiently thin films. For instance, the monotonic deformational longwave instability was observed by Van Hook et al. (Reference Van Hook, Schatz, Swift, McCormick and Swinney1997) in films with the thickness of the order of
 $100~{\rm\mu}\text{m}$
and the characteristic temperature difference about 5 K. The computations carried out in the present paper correspond to even thinner films (
$100~{\rm\mu}\text{m}$
and the characteristic temperature difference about 5 K. The computations carried out in the present paper correspond to even thinner films (
 $H_{1}^{0}$
is about
$H_{1}^{0}$
is about
 $10~{\rm\mu}\text{m}$
) and larger temperature differences (about 20 K). The value
$10~{\rm\mu}\text{m}$
) and larger temperature differences (about 20 K). The value
 $\mathit{Ga}=0.025$
used in the computations corresponds to
$\mathit{Ga}=0.025$
used in the computations corresponds to
 $L^{\ast }=0.1~\text{mm}$
, thus the lateral size of the film
$L^{\ast }=0.1~\text{mm}$
, thus the lateral size of the film
 $L^{\ast }=24~\text{mm}$
is large with respect to the film thickness. The parametric excitation of Marangoni waves is expected for the temperature modulation with the frequency 0.03–0.06 Hz.
$L^{\ast }=24~\text{mm}$
is large with respect to the film thickness. The parametric excitation of Marangoni waves is expected for the temperature modulation with the frequency 0.03–0.06 Hz.
In conclusion, let us note that another interesting method of convection stability control is the spatial modulation of the temperature along the layer. Until now, that method of control have been studied only for buoyancy convection (for a review, see Freund, Pesch & Zimmerman Reference Freund, Pesch and Zimmerman2011; Hossain & Floryan Reference Hossain and Floryan2013). The development of a corresponding theory for the Marangoni convection is beyond the scope of this paper.


