1 Introduction
Flow-induced vibrations (FIV) of elastic bodies occur somewhat frequently. They take place in a large variety of physical and biological systems, like airplane wings, leaves of trees, long-span bridges, tall buildings, heat exchange devices, clarinet reeds or offshore structures, to name only a few. Such FIV can cause both severe (even destructive) vibrations and beneficial motions. The fluid flow and the elastic response of the body are coupled, since the fluid force causes the body to deform and, as the body deforms, its orientation to the flow changes and so does the fluid force. The interaction between the moving body and the fluid flow is very complex and depends on a large number of parameters related to the fluid flow characteristics (among them flow velocity, fluid density and viscosity, turbulence of the inflow), structural (mechanical) properties of the body (mass, stiffness and mechanical damping) and geometry (shape of the body, surface roughness, etc.). Understanding the fluid–elastic coupling is of interest from both the scientific and the practical sides. Regarding the practical side, a new field of interest has recently emerged since FIV are being considered as a means to extract energy from fluid flows. As proposed by Bernitsas et al. (Reference Bernitsas, Raghavan, Ben-Simon and Garcia2008), a device called VIVACE (acronym for vortex-induced vibration aquatic clean energy) was developed to extract energy from water currents by oscillations induced by vortex shedding from a spring-mounted circular cylinder. Additional efforts have been made later in this direction, namely, Sanchez-Sanz, Fernandez & Velazquez (Reference Sanchez-Sanz, Fernandez and Velazquez2009), Barrero-Gil, Pindado & Avila (Reference Barrero-Gil, Pindado and Avila2012), or Grouthier, Michelin & de Langre (Reference Grouthier, Michelin and de Langre2013). There have been other initiatives to extract energy efficiently, taking advantage of other FIV phenomena, like galloping (Barrero-Gil, Sanz-Andres & Alonso Reference Barrero-Gil, Sanz-Andres and Alonso2010; Abdelkefi, Hajj & Nayfeh Reference Abdelkefi, Hajj and Nayfeh2012, Reference Abdelkefi, Hajj and Nayfeh2013; Vicente-Ludlam, Barrero-Gil & Velazquez Reference Vicente-Ludlam, Barrero-Gil and Velazquez2014), wake galloping (Jung & Lee Reference Jung and Lee2011) or flutter (Doaré & Michelin Reference Doaré and Michelin2011; Singh, Michelin & De Langre Reference Singh, Michelin and De Langre2012).
There is a large variety of FIV phenomena but, broadly speaking, two different classes constitute the basis for the analysis of many related problems. The first one is vortex-induced vibration (VIV), which is caused by a nonlinear resonance phenomenon. For Reynolds number
 $Re$
high enough (say, larger than 50), the flow separates from the body surface, generating an unsteady broad wake, where large-scale vortices are shed periodically from the body surface, leading to an alternating fluid force on the body. The shedding frequency of the vortices is related to the undisturbed flow speed and the size and shape of the body as shown by Strouhal (Reference Strouhal1878). When the frequency of the vortex shedding is close enough to the natural frequency of oscillation of the elastic body, a close-to-resonance condition is achieved and significant oscillations in the body can appear when the mechanical properties of the body (such as damping) are appropriate. VIV has been widely investigated, both experimentally and numerically, mainly through the canonical problem of a spring-mounted rigid circular cylinder under the action of a uniform fluid flow. Usually, the main interest has been focused on assessing the effect of different mechanical and fluid parameters on the VIV response: steady-state oscillations (amplitude and frequency), fluid forces on the cylinder, or flow pattern in the wake. For a detailed review, the reader is referred to Blevins (Reference Blevins1990), Sarpkaya (Reference Sarpkaya2004, Reference Sarpkaya2010), Williamson & Govardhan (Reference Williamson and Govardhan2004), Bearman (Reference Bearman2011) or Paidoussis, Stuart & De Langre (Reference Paidoussis, Stuart and De Langre2011).
$Re$
high enough (say, larger than 50), the flow separates from the body surface, generating an unsteady broad wake, where large-scale vortices are shed periodically from the body surface, leading to an alternating fluid force on the body. The shedding frequency of the vortices is related to the undisturbed flow speed and the size and shape of the body as shown by Strouhal (Reference Strouhal1878). When the frequency of the vortex shedding is close enough to the natural frequency of oscillation of the elastic body, a close-to-resonance condition is achieved and significant oscillations in the body can appear when the mechanical properties of the body (such as damping) are appropriate. VIV has been widely investigated, both experimentally and numerically, mainly through the canonical problem of a spring-mounted rigid circular cylinder under the action of a uniform fluid flow. Usually, the main interest has been focused on assessing the effect of different mechanical and fluid parameters on the VIV response: steady-state oscillations (amplitude and frequency), fluid forces on the cylinder, or flow pattern in the wake. For a detailed review, the reader is referred to Blevins (Reference Blevins1990), Sarpkaya (Reference Sarpkaya2004, Reference Sarpkaya2010), Williamson & Govardhan (Reference Williamson and Govardhan2004), Bearman (Reference Bearman2011) or Paidoussis, Stuart & De Langre (Reference Paidoussis, Stuart and De Langre2011).
The other canonical problem that should be cited here is galloping (Parkinson Reference Parkinson1989). This is a motion-induced instability that appears in elastic bluff bodies with certain geometrical shapes – non-axisymmetric cross-sections like square, D-section, triangular or H-type (Naudascher & Rockwell Reference Naudascher and Rockwell1994) – when the velocity of the incident flow exceeds a critical value. Then, a small transverse displacement of the body induces an angle of attack relative to the incoming flow and an asymmetric pressure distribution, so that fluid force appears in the direction of the displacement in such a way that energy is transferred from the flow to the body and oscillatory motion (mainly transversely to the unperturbed flow) develops. Unlike VIV, which typically occurs only in a certain range of flow velocities and with self-limited amplitude, galloping takes place for any value of the flow velocity higher than the critical value and has a monotonic increase of amplitude with flow velocity. Galloping is mainly driven by the instantaneous angle of attack between the body and the incoming flow and does not necessarily need a synchronization between the oscillations and vortex formation and shedding.
As said earlier, VIV of a circular cylinder has been much studied in the past, due to the extensive use of cylindrical elements in structures and engineering systems as well as its interest from the scientific side. Most of these studies considered the conceptually simple case of an elastically mounted rigid cylinder (Sarpkaya Reference Sarpkaya2010). Recently, an imposed asymmetry effect in the VIV of a spring-mounted circular cylinder was numerically studied at
 $Re=100$
by Bourguet & Jacono (Reference Bourguet and Jacono2014). The cylinder was free to oscillate transversely to the flow over a wide range of reduced velocities. In addition, rotation of the cylinder around its axis, with fixed direction of rotation and fixed rotation rate, was imposed. The cylinder was subject to VIV-type vibrations up to rotation rates of
$Re=100$
by Bourguet & Jacono (Reference Bourguet and Jacono2014). The cylinder was free to oscillate transversely to the flow over a wide range of reduced velocities. In addition, rotation of the cylinder around its axis, with fixed direction of rotation and fixed rotation rate, was imposed. The cylinder was subject to VIV-type vibrations up to rotation rates of
 $\unicode[STIX]{x1D6FC}=4$
(
$\unicode[STIX]{x1D6FC}=4$
(
 $\unicode[STIX]{x1D6FC}$
is the non-dimensional rotation rate, defined as the ratio of rotational velocity at the cylinder’s surface to the unperturbed flow velocity). Oscillations increase with
$\unicode[STIX]{x1D6FC}$
is the non-dimensional rotation rate, defined as the ratio of rotational velocity at the cylinder’s surface to the unperturbed flow velocity). Oscillations increase with
 $\unicode[STIX]{x1D6FC}$
as well as the region of synchronization where oscillations are significant up to a non-dimensional rotation rate close to
$\unicode[STIX]{x1D6FC}$
as well as the region of synchronization where oscillations are significant up to a non-dimensional rotation rate close to
 $\unicode[STIX]{x1D6FC}=4$
. Notoriously, they also reported a wake mode composed of a triplet of vortices and a single vortex per cycle (T
$\unicode[STIX]{x1D6FC}=4$
. Notoriously, they also reported a wake mode composed of a triplet of vortices and a single vortex per cycle (T
 $+$
S wake mode) for some specific non-dimensional rotation rates and reduced velocity, which had not been previously reported in the literature on non-rotating cylinders in VIV. Seyed-Aghazadeh & Modarres-Sadeghi (Reference Seyed-Aghazadeh and Modarres-Sadeghi2015) experimentally studied this same problem for Reynolds number between 350 and 1000, concluding that the lock-in regime got narrower at high rotation rates and oscillations ceased beyond
$+$
S wake mode) for some specific non-dimensional rotation rates and reduced velocity, which had not been previously reported in the literature on non-rotating cylinders in VIV. Seyed-Aghazadeh & Modarres-Sadeghi (Reference Seyed-Aghazadeh and Modarres-Sadeghi2015) experimentally studied this same problem for Reynolds number between 350 and 1000, concluding that the lock-in regime got narrower at high rotation rates and oscillations ceased beyond
 $\unicode[STIX]{x1D6FC}=2.4$
. When the cylinder is also allowed to oscillate along the in-line direction, Stansby & Rainey (Reference Stansby and Rainey2001) reported large oscillations with amplitudes higher than 10 diameters, with low-frequency galloping-like responses occurring without lock-in.
$\unicode[STIX]{x1D6FC}=2.4$
. When the cylinder is also allowed to oscillate along the in-line direction, Stansby & Rainey (Reference Stansby and Rainey2001) reported large oscillations with amplitudes higher than 10 diameters, with low-frequency galloping-like responses occurring without lock-in.
Another category deals with imposed combined translational and rotational oscillation. Blackburn, Elston & Sheridan (Reference Blackburn, Elston and Sheridan1999) were able to generate thrust in quiescent fluid by imposing combined translational and rotational oscillation. Nazarinia et al. (Reference Nazarinia, Lo Jacono, Thompson and Sheridan2009a ,Reference Nazarinia, Lo Jacono, Thompson and Sheridan b ) extended this study and experimentally characterized the flow around a circular cylinder undergoing imposed combined translational and rotational motion in a free stream, obtaining new interesting wake modes. Al-Mdallal (Reference Al-Mdallal2004), Kocabiyik & Al-Mdallal (Reference Kocabiyik and Al-Mdallal2005) and Nazarinia et al. (Reference Nazarinia, Lo Jacono, Thompson and Sheridan2009a ) showed the possibility of reducing the synchronization region of the cylinder’s motion in the near wake through the effect of the phase shift, velocity ratios and motion frequency of the translational and rotational modes. Finally, cited here should be experiments made considering rotational oscillations of a circular cylinder at rest in order to avoid vortex shedding using flow velocity in the wake as a feedback control variable (Fujisawa, Kawaji & Ikemoto Reference Fujisawa, Kawaji and Ikemoto2001). More recently, Lu et al. (Reference Lu, Qin, Teng and Li2011) linked the rotary oscillation of the cylinder to the fluctuating lift fluid force coefficient as an active control strategy for lift force reduction.
In the above-mentioned studies, the rotation imposed to the cylinder is not linked to the dynamics of the cylinder, and therefore is not coupled with the result of the fluid–elastic interaction. Recently, we thought that it could be of interest to link the rotation direction and rate to the oscillating cylinder dynamics, to see if this could be a method to reduce or enhance oscillations. Note that this is a full active control technique where imposed rotation takes the cylinder dynamics as a feedback. To study this question, we carried out two-dimensional (2D) numerical simulations at low Reynolds number (Vicente-Ludlam et al. 2017) and investigated how the selected strategy for the cylinder’s rotation, proportional to either the cylinder’s transverse displacement (with respect to the static, without flow, cylinder position) or its velocity, affects the cylinder’s response. It was found that, depending on the law of rotation, oscillations could be significantly increased or decreased with respect to the non-rotating cylinder. This result can be of applied interest, either to protect cylindrical structures (by diminishing oscillations) or to extract energy from the fluid flow (by enhancing oscillations). It was also found that, for certain cases of the rotating law proportional to the cylinder’s displacement, a galloping-type response was observed, and a quasi-steady theoretical model can reasonably predict the amplitude of oscillation for these cases.
The Reynolds number in the numerical simulations that we carried out was 100. However, in many actual applications, 2D numerical simulations at
 $Re=100$
might not be accurate enough and significant differences may appear for higher Reynolds numbers. The VIV response at low Reynolds numbers (laminar flow regime) is characterized by a two-branch curve, which presents a maximum amplitude of non-dimensional oscillations of
$Re=100$
might not be accurate enough and significant differences may appear for higher Reynolds numbers. The VIV response at low Reynolds numbers (laminar flow regime) is characterized by a two-branch curve, which presents a maximum amplitude of non-dimensional oscillations of
 $A^{\ast }\approx 0.6$
. The branches appearing are usually classified as the initial branch and the lower branch. The initial branch corresponds to the initial reduced velocities where oscillations start. The vortex pattern in the near wake is characterized by a 2S mode (single vortex being shed per half-cycle of oscillations). After the initial-to-lower branch transitions, the maximum amplitude is obtained. The lower branch exhibits a C (2S) mode of vortex emission, where single vortices are shed per half-cycle and downstream they appear to coalesce (Prasnath & Mittal Reference Prasnath and Mittal2008; Vicente-Ludlam et al. 2017). On the other hand, for larger Reynolds numbers, the response is characterized by a three-branch curve. They are classified as the initial, upper and lower branches (Williamson & Govardhan Reference Williamson and Govardhan2004). The upper branch appears in the transition between the initial and lower branches and is the region within the VIV curve with largest amplitude of oscillation. With respect to the modes of vortex emission, similarly to the low-Reynolds-number regime, the initial branch is composed of a 2S mode of vortex emission. Alternatively, the lower branch presents a 2P mode of vortex emission where a pair of vortices (with opposite rotation direction) is shed per half-cycle of oscillation. The upper branch presents a
$A^{\ast }\approx 0.6$
. The branches appearing are usually classified as the initial branch and the lower branch. The initial branch corresponds to the initial reduced velocities where oscillations start. The vortex pattern in the near wake is characterized by a 2S mode (single vortex being shed per half-cycle of oscillations). After the initial-to-lower branch transitions, the maximum amplitude is obtained. The lower branch exhibits a C (2S) mode of vortex emission, where single vortices are shed per half-cycle and downstream they appear to coalesce (Prasnath & Mittal Reference Prasnath and Mittal2008; Vicente-Ludlam et al. 2017). On the other hand, for larger Reynolds numbers, the response is characterized by a three-branch curve. They are classified as the initial, upper and lower branches (Williamson & Govardhan Reference Williamson and Govardhan2004). The upper branch appears in the transition between the initial and lower branches and is the region within the VIV curve with largest amplitude of oscillation. With respect to the modes of vortex emission, similarly to the low-Reynolds-number regime, the initial branch is composed of a 2S mode of vortex emission. Alternatively, the lower branch presents a 2P mode of vortex emission where a pair of vortices (with opposite rotation direction) is shed per half-cycle of oscillation. The upper branch presents a
 $2\text{P}_{0}$
mode, where a pair of vortices is shed per half-cycle, but the secondary vortex is much smaller than the primary one (Morse & Williamson Reference Morse and Williamson2009).
$2\text{P}_{0}$
mode, where a pair of vortices is shed per half-cycle, but the secondary vortex is much smaller than the primary one (Morse & Williamson Reference Morse and Williamson2009).
The Reynolds number, in addition to determining whether the upper branch appears or not, also influences the maximum amplitude of oscillations, which increases with Reynolds number as shown by Govardhan & Williamson (Reference Govardhan and Williamson2006). They found that the maximum amplitude of oscillations appears to be governed by the mass-damping parameter as well as the Reynolds number. The differences found in classic (non-rotating) VIV of a circular cylinder due to Reynolds number encourage us to extend the numerical simulations presented in Vicente-Ludlam et al. (2017), and to see the extent to which the results found in the idealized numerical simulations (2D flow, uniform incoming flow, pure transverse motion of the cylinder, fixed Reynolds number) occur in experiments, in a larger Reynolds-number regime and with an experimental set-up closer to potential applications. Therefore, we have experimentally studied the idea of imposing a rotation in the cylinder axis (linked to its dynamics), with a Reynolds number in the range of 1500–10 000 (between one and two orders of magnitude higher than the computational studies we presented in Vicente-Ludlam et al. (2017)). During experiments, an active control of cylinder rotation in real time, with low enough time lag, that closely follows the cylinder transverse position/velocity was implemented. When rotation was proportional to the cylinder’s transverse displacement, significant changes in the response were found with respect to the non-rotating case. Depending on the sign of the constant of proportionality between rotation and cylinder displacement, the oscillations were diminished or significantly enhanced. In the latter case, even a galloping-type response appeared when the forced rotation is greater than a certain level. When the cylinder rotates proportionally to the cylinder’s transverse velocity, it is possible to increase or diminish oscillations but the response always has a vortex-induced type (resonant) character.
This article is organized as follows. In § 2, the experimental set-up is described, including a description of the recirculating water channel where experiments have been performed as well as a description of the particle image velocimetry (PIV) set-up used to characterize the flow field of the near wake of the oscillating cylinder. Also, validation tests of the water channel are given by comparing VIV results of a non-rotating circular cylinder to similar ones published in the literature. In § 3, flow-induced vibration results for the cylinder with prescribed rotatory law proportional to the cylinder’s position are presented first. A quasi-steady theoretical model has been developed and presented which can reasonably predict the amplitude of oscillation for these cases (galloping-type response). Afterwards, the results for the cylinder with a rotation law proportional to the cylinder’s velocity are presented. The quasi-steady model helps to explain why a galloping-type response is not expected to occur in this case. For each of the rotation laws investigated, vorticity contour maps obtained through PIV measurements have been presented and discussed. Finally, concluding remarks are presented in § 4. Additionally, in the supplementary material associated with this article, movies displaying oscillations in experiments with different rotating laws are presented at https://doi.org/10.1017/jfm.2018.332.
2 Experimental set-up and validation
2.1 Experimental set-up
The experiments were carried out in a free-surface recirculating water channel with controlled inflow conditions at the test section in terms of mean speed, uniformity and low turbulence. A sketch of the water channel is given in figure 1. The water current is driven by two axial pumps manufactured by ABS, model RCP 500. The rotation speed of the pumps is regulated by a variable-frequency drive from Power Electronics, model SD503942. Guide vanes are placed in the corners of the water channel to guide the flow and reduce pressure losses. To improve flow quality in the test section, a honeycomb (hexagonally shaped cells with diameter 4.5 mm and a length-to-diameter ratio of 12) and a fine screen are located before the entrance of the test section. As is known, the honeycomb is a very effective flow-straightening device (as shown by Bradshaw & Pankhurst (Reference Bradshaw and Pankhurst1964)) and the screen is effective to reduce mean non-uniformities and fluctuations of the streamwise component. During experiments, the flow speed
 $U$
at the test section was varied between 75 and
$U$
at the test section was varied between 75 and
 $480~\text{mm}~\text{s}^{-1}$
, which gives a Reynolds-number range of
$480~\text{mm}~\text{s}^{-1}$
, which gives a Reynolds-number range of
 $Re=UD/\unicode[STIX]{x1D708}\approx 1500{-}10\,000$
,
$Re=UD/\unicode[STIX]{x1D708}\approx 1500{-}10\,000$
,
 $\unicode[STIX]{x1D708}$
being the kinematic viscosity of the water and
$\unicode[STIX]{x1D708}$
being the kinematic viscosity of the water and
 $D$
the cylinder diameter. With respect to the inflow conditions, the turbulence intensity was lower than 1.5 % and the velocity uniformity presented variations lower than 5 % throughout the test section studied. Further details regarding the water channel can be found in Xu-Xu, Barrero-Gil & Velazquez (Reference Xu-Xu, Barrero-Gil and Velazquez2016).
$D$
the cylinder diameter. With respect to the inflow conditions, the turbulence intensity was lower than 1.5 % and the velocity uniformity presented variations lower than 5 % throughout the test section studied. Further details regarding the water channel can be found in Xu-Xu, Barrero-Gil & Velazquez (Reference Xu-Xu, Barrero-Gil and Velazquez2016).
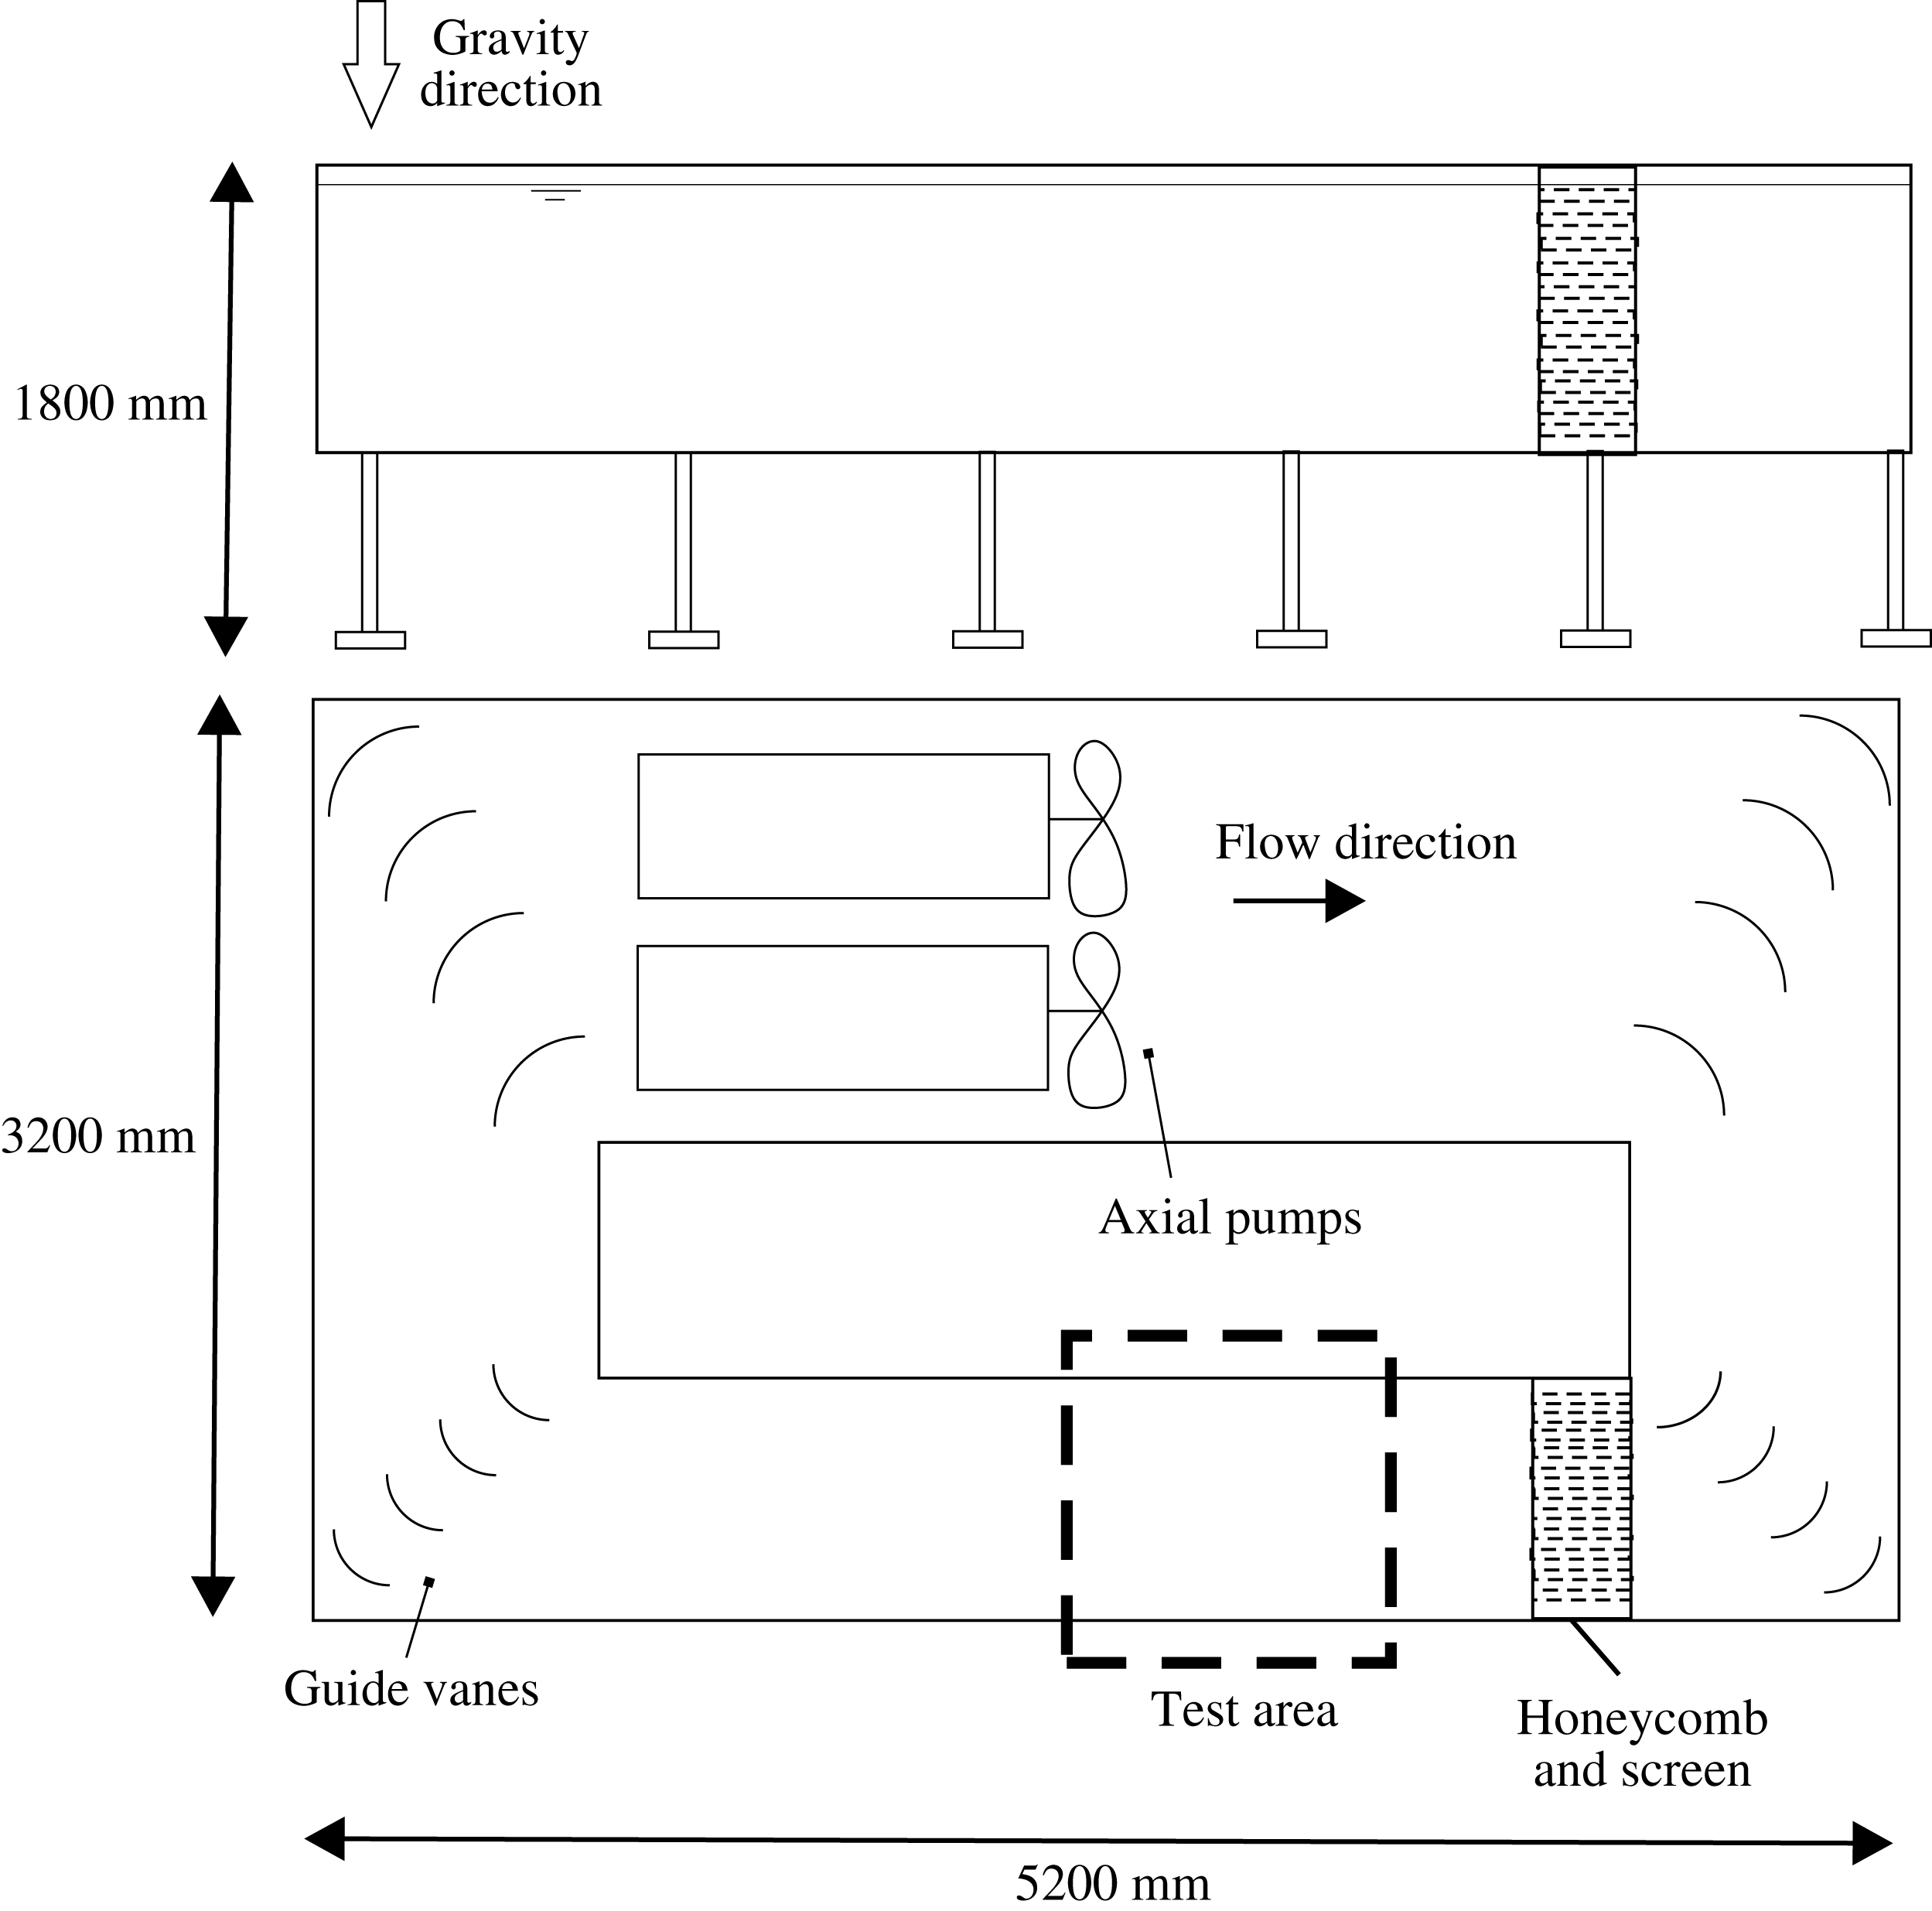
Figure 1. Schematic elevation and plan of the free-surface water channel.
The test section is 3000 mm in length, 900 mm in width and the working depth is 830 mm (A; see figure 2
a). The test section is made of glass, which allows the flow to be viewed from either side, as well as from the bottom, allowing one to perform flow visualizations through PIV measurements. A circular cylinder (B), made of aluminium, of diameter
 $D=25~\text{mm}$
and immersed length
$D=25~\text{mm}$
and immersed length
 $L=430~\text{mm}$
, was attached through a bearing (C) to the shaft of a servomotor (D) fixed to the free end of a double-blade elastic system. The elastic system, which follows the arrangement introduced in Assi et al. (Reference Assi, Meneghini, Aranha, Bearman and Casaprima2006), was made up of two parallel rigid aluminium blocks (E), coupled to a pair of thin spring-steel flexor blades (F). The elastic system not only acts as the cylinder support, but also provides the linear restoration response. In this way, the cylinder is restricted to oscillate in the transverse direction to the flow (
$L=430~\text{mm}$
, was attached through a bearing (C) to the shaft of a servomotor (D) fixed to the free end of a double-blade elastic system. The elastic system, which follows the arrangement introduced in Assi et al. (Reference Assi, Meneghini, Aranha, Bearman and Casaprima2006), was made up of two parallel rigid aluminium blocks (E), coupled to a pair of thin spring-steel flexor blades (F). The elastic system not only acts as the cylinder support, but also provides the linear restoration response. In this way, the cylinder is restricted to oscillate in the transverse direction to the flow (
 $y$
) with low mechanical damping. Figure 2(b) presents a detailed view of the flexors and elastic system, including the servomotor attached to it. The transverse displacement and acceleration of the circular cylinder were measured by a non-contact laser vibrometer (G) from Aquity AR500-500 (range 500 mm, resolution 0.05 mm) and by an accelerometer (H) from Measuring Specialities (range
$y$
) with low mechanical damping. Figure 2(b) presents a detailed view of the flexors and elastic system, including the servomotor attached to it. The transverse displacement and acceleration of the circular cylinder were measured by a non-contact laser vibrometer (G) from Aquity AR500-500 (range 500 mm, resolution 0.05 mm) and by an accelerometer (H) from Measuring Specialities (range
 $\pm 2~\text{g}$
, resolution 2 mg).
$\pm 2~\text{g}$
, resolution 2 mg).
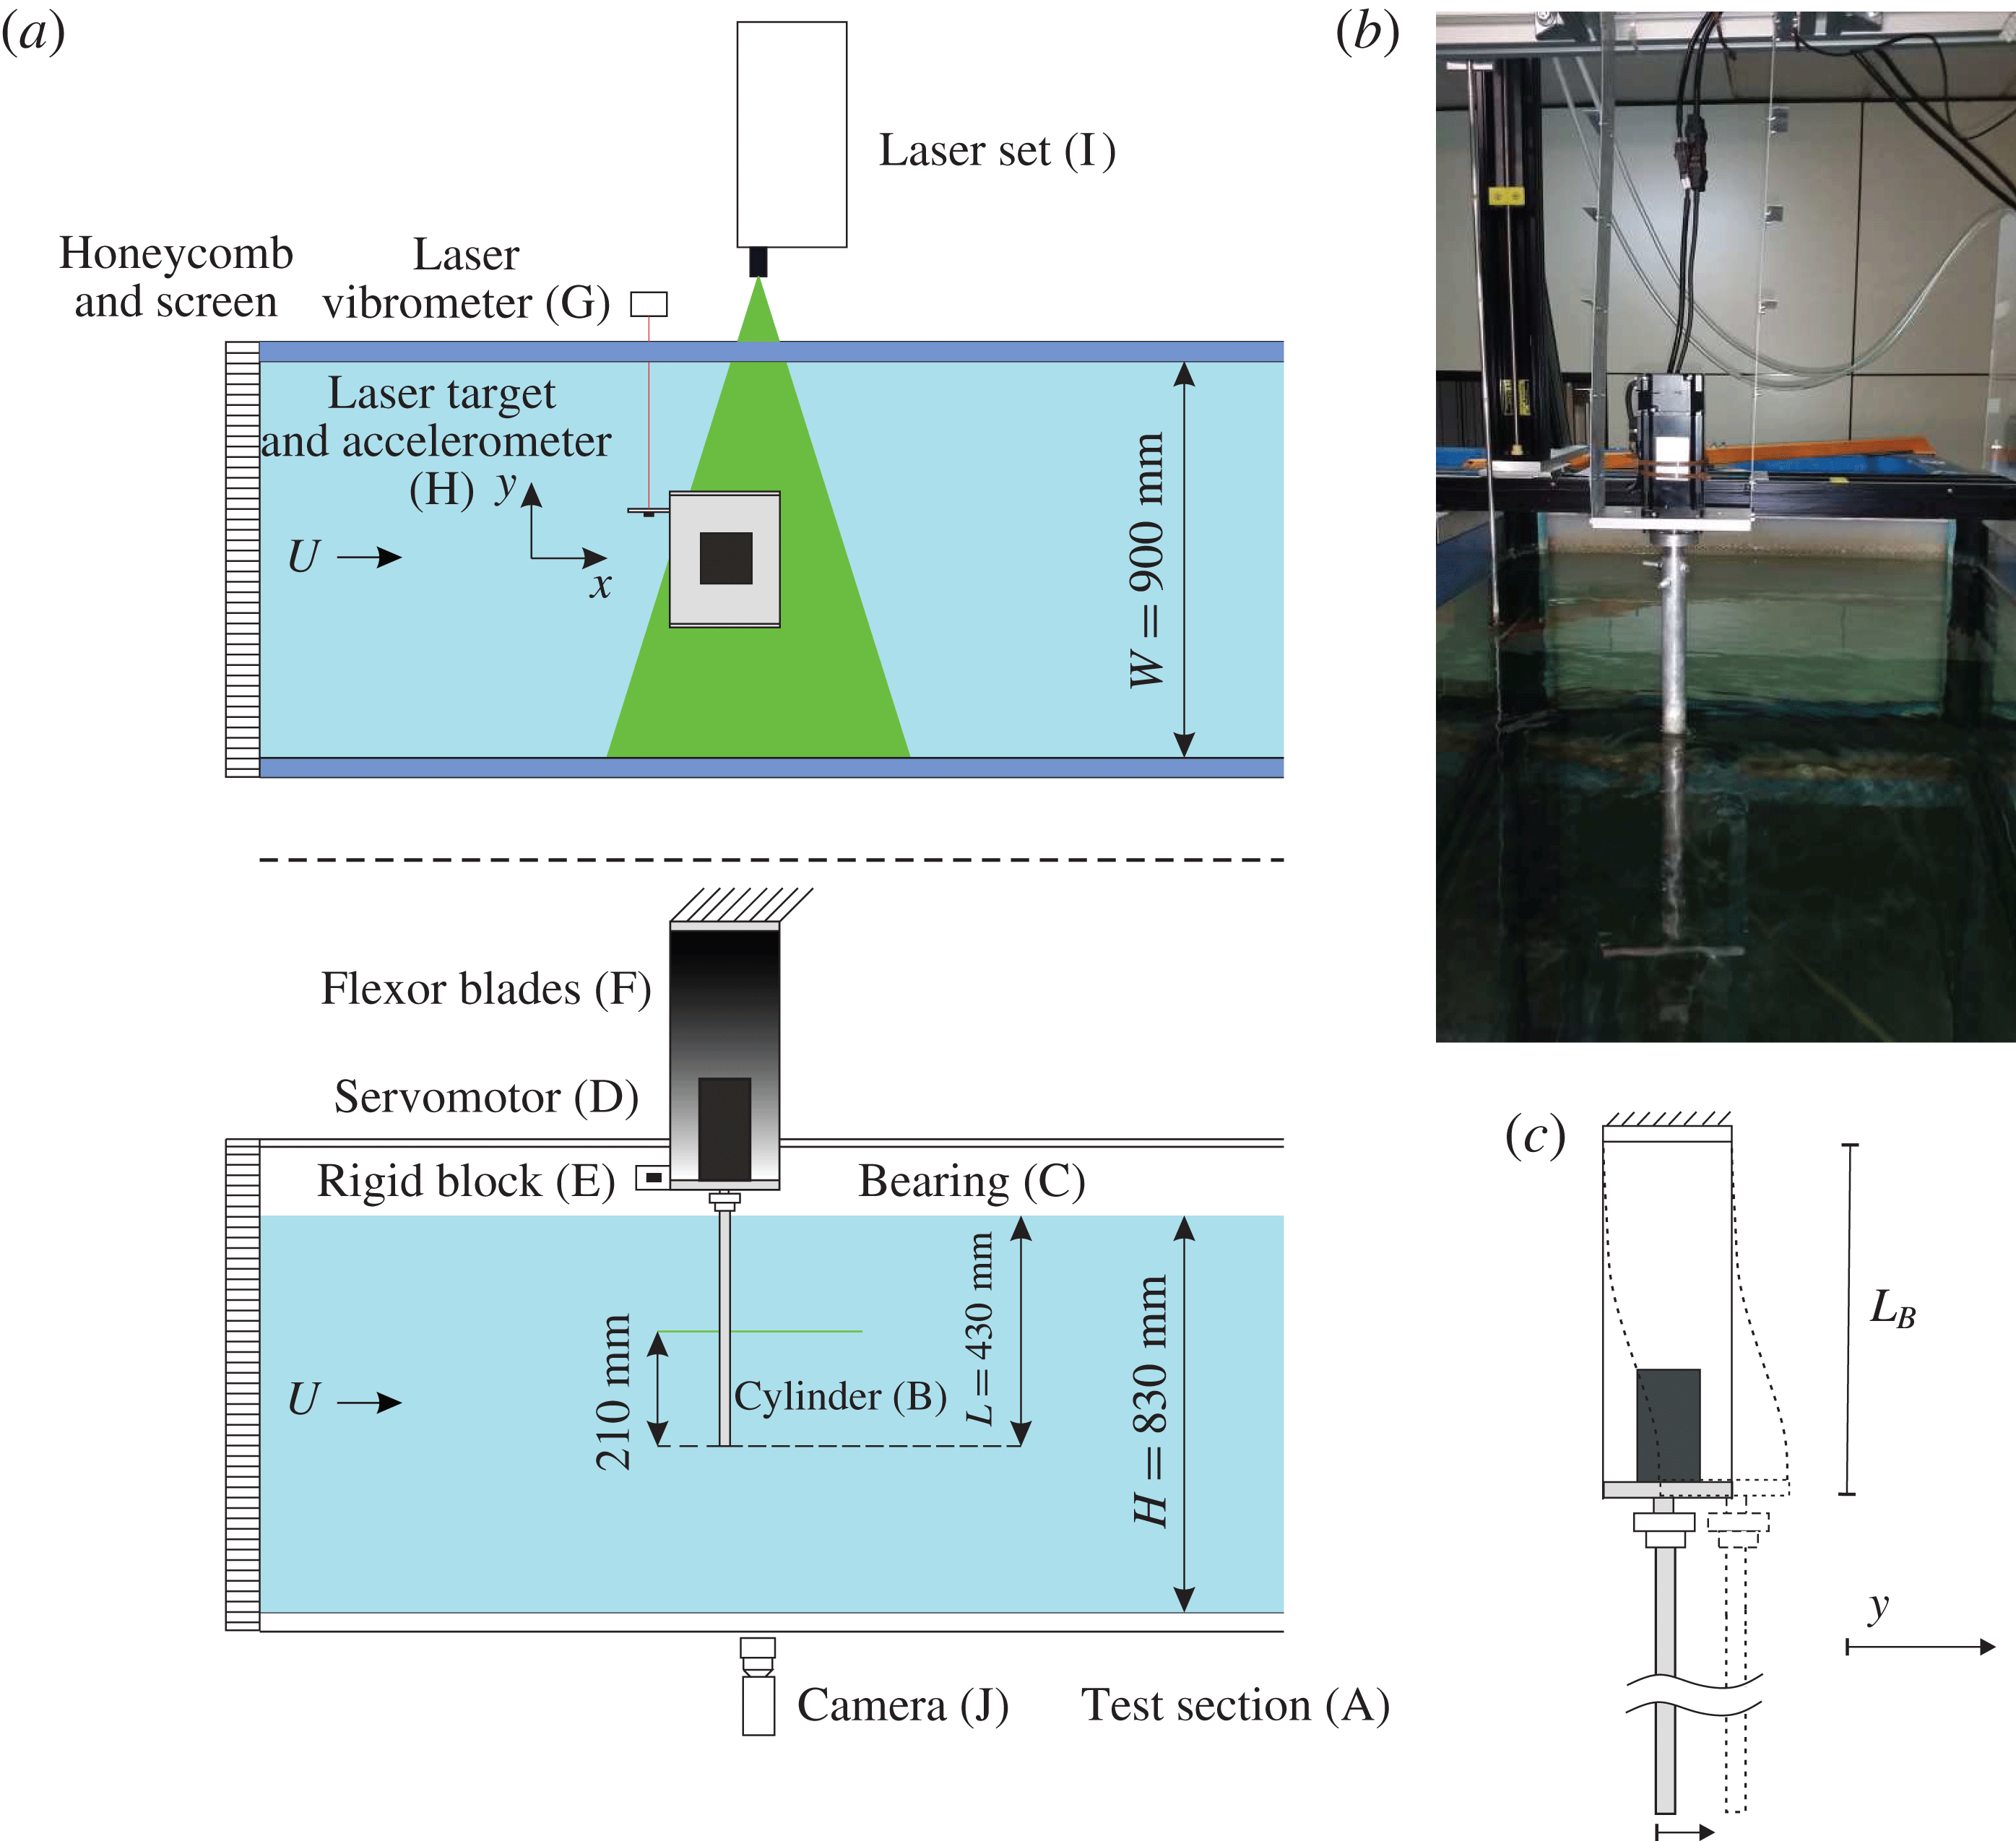
Figure 2. Sketch of the experimental set-up (dimensions are in millimetres) of the water channel. (a) Schematic top view and side view of the water channel. (b) Photograph of a close view of the elastic system. (c) Detail of the elastic system’s deformation when a translation in the transverse direction is applied.
An AC servomotor, 60ST-M013330C from MIGE, with a peak torque of 3.9 N m and a maximum rated speed of 3000 r.p.m., was used. To measure the angle of rotation, the servomotor includes a photoelectric encoder with resolution of
 $0.036^{\circ }$
. To impose the rotation law, a signal command was sent to the servomotor controller. Depending on the rotation law, this signal command was proportional either to the cylinder’s position (measured with the laser vibrometer) or to the cylinder’s velocity (obtained by integration of the accelerometer’s signal). The time delay between the servomotor response and the signal command was under 5 ms, which is much smaller than the characteristic oscillation times during the experiments (a maximum phase lag of
$0.036^{\circ }$
. To impose the rotation law, a signal command was sent to the servomotor controller. Depending on the rotation law, this signal command was proportional either to the cylinder’s position (measured with the laser vibrometer) or to the cylinder’s velocity (obtained by integration of the accelerometer’s signal). The time delay between the servomotor response and the signal command was under 5 ms, which is much smaller than the characteristic oscillation times during the experiments (a maximum phase lag of
 $1.5^{\circ }$
was observed). The cylinder was connected to the shaft of the servomotor through a bearing manufactured at our installations. Before each run, parallelism of the cylinder as well as dynamic balancing was checked through measurements of the accelerometer installed.
$1.5^{\circ }$
was observed). The cylinder was connected to the shaft of the servomotor through a bearing manufactured at our installations. Before each run, parallelism of the cylinder as well as dynamic balancing was checked through measurements of the accelerometer installed.
All data (position, acceleration, rotation angle) were recorded and registered using a Compact-Rio microprocessor from National Instruments (NI cRio-9024) and an analogue input module from National Instruments (
 $\pm 10$
V, NI-9201) with a sampling frequency of 200 Hz for each parameter combination of flow velocity and prescribed rotation law for a total of 16 minutes. The first 6 minutes were spent achieving steady-state conditions while the remaining 10 minutes were used for recording. After that, the water speed was increased and the measurement procedure repeated.
$\pm 10$
V, NI-9201) with a sampling frequency of 200 Hz for each parameter combination of flow velocity and prescribed rotation law for a total of 16 minutes. The first 6 minutes were spent achieving steady-state conditions while the remaining 10 minutes were used for recording. After that, the water speed was increased and the measurement procedure repeated.
2.2 Data reduction and rotation laws evaluated
For each run, the instantaneous transverse position
 $y(t)$
around the static (no-flow) position, acceleration
$y(t)$
around the static (no-flow) position, acceleration
 $\ddot{y} (t)$
and rotation angle
$\ddot{y} (t)$
and rotation angle
 $\unicode[STIX]{x1D703}(t)$
of the cylinder were directly measured and registered. The dynamical equation of the cylinder and the rotation laws employed are, respectively,
$\unicode[STIX]{x1D703}(t)$
of the cylinder were directly measured and registered. The dynamical equation of the cylinder and the rotation laws employed are, respectively,
 $$\begin{eqnarray}\displaystyle m\ddot{y} +c{\dot{y}}+ky=-m_{A}\ddot{y} +{\textstyle \frac{1}{2}}\unicode[STIX]{x1D70C}U^{2}DLC_{y}, & & \displaystyle\end{eqnarray}$$
 $$\begin{eqnarray}\displaystyle \unicode[STIX]{x1D703}=k_{1}y\quad \text{or}\quad \unicode[STIX]{x1D703}=k_{2}{\dot{y}}, & & \displaystyle\end{eqnarray}$$
where
 $m$
is the total oscillating mass,
$m$
is the total oscillating mass,
 $c$
is the mechanical damping constant,
$c$
is the mechanical damping constant,
 $k$
is the stiffness of the system, and
$k$
is the stiffness of the system, and
 $k_{1}$
and
$k_{1}$
and
 $k_{2}$
are feedback constants, which relate the rotation to be imposed on the cylinder and the displacement/velocity of the cylinder, respectively. Both
$k_{2}$
are feedback constants, which relate the rotation to be imposed on the cylinder and the displacement/velocity of the cylinder, respectively. Both
 $c$
and
$c$
and
 $k$
were measured in free decay tests in still air. Regarding the right-hand side of (2.1a
), note that the fluid force has been split into two terms, a potential added-mass term (
$k$
were measured in free decay tests in still air. Regarding the right-hand side of (2.1a
), note that the fluid force has been split into two terms, a potential added-mass term (
 $-m_{A}\ddot{y}$
) and a viscous one (
$-m_{A}\ddot{y}$
) and a viscous one (
 $\unicode[STIX]{x1D70C}U^{2}DLC_{Y}/2$
), as suggested in Govardhan & Williamson (Reference Govardhan and Williamson2000);
$\unicode[STIX]{x1D70C}U^{2}DLC_{Y}/2$
), as suggested in Govardhan & Williamson (Reference Govardhan and Williamson2000);
 $\unicode[STIX]{x1D70C}$
is the fluid density, and
$\unicode[STIX]{x1D70C}$
is the fluid density, and
 $C_{y}$
is a dimensionless fluid force coefficient.
$C_{y}$
is a dimensionless fluid force coefficient.
Equation (2.1b,c ) shows the two rotation laws that have been tested in order to determine how such rotation affects the VIV response of the cylinder; in particular, (i) the cylinder is rotated proportionally to its transverse displacement and (ii) the cylinder is rotated proportionally to its transverse velocity.
The equation of motion of the cylinder and the rotation laws prescribed can be made dimensionless by introducing
 $D$
and
$D$
and
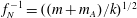 $f_{N}^{-1}=((m+m_{A})/k)^{1/2}$
as reference length and time scales. This gives
$f_{N}^{-1}=((m+m_{A})/k)^{1/2}$
as reference length and time scales. This gives
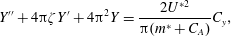 $$\begin{eqnarray}\displaystyle Y^{\prime \prime }+4\unicode[STIX]{x03C0}\unicode[STIX]{x1D701}Y^{\prime }+4\unicode[STIX]{x03C0}^{2}Y=\frac{2U^{\ast 2}}{\unicode[STIX]{x03C0}(m^{\ast }+C_{A})}C_{y}, & & \displaystyle\end{eqnarray}$$
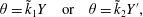 $$\begin{eqnarray}\displaystyle \unicode[STIX]{x1D703}=\tilde{k}_{1}Y\quad \text{or}\quad \unicode[STIX]{x1D703}=\tilde{k}_{2}Y^{\prime }, & & \displaystyle\end{eqnarray}$$
where
 $Y=y/D$
,
$Y=y/D$
,
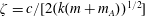 $\unicode[STIX]{x1D701}=c/[2(k(m+m_{A}))^{1/2}]$
is the damping ratio,
$\unicode[STIX]{x1D701}=c/[2(k(m+m_{A}))^{1/2}]$
is the damping ratio,
 $m^{\ast }=m/(\unicode[STIX]{x1D70C}D^{2}L)$
is the mass ratio,
$m^{\ast }=m/(\unicode[STIX]{x1D70C}D^{2}L)$
is the mass ratio,
 $C_{A}$
is the potential added-mass coefficient (
$C_{A}$
is the potential added-mass coefficient (
 $C_{A}=1.0$
for a circular cylinder),
$C_{A}=1.0$
for a circular cylinder),
 $\tilde{k}_{1}=Dk_{1}$
and
$\tilde{k}_{1}=Dk_{1}$
and
 $\tilde{k}_{2}=f_{N}Dk_{2}$
are the non-dimensional feedback constants, and the prime stands for differentiation with respect to non-dimensional time
$\tilde{k}_{2}=f_{N}Dk_{2}$
are the non-dimensional feedback constants, and the prime stands for differentiation with respect to non-dimensional time
 $t^{\ast }=f_{N}t$
.
$t^{\ast }=f_{N}t$
.
A standard method of analysis employed for the study of FIV problems is based on the introduction of time-averaged quantities (Sarpkaya Reference Sarpkaya2004). The following variables were computed from each run: (i) the steady-state normalized maximum amplitude of oscillation
 $A^{\ast }=A_{10}/D$
, where
$A^{\ast }=A_{10}/D$
, where
 $A_{10}$
denotes the maximum 10 % peaks of oscillation for each run; (ii) the normalized frequency of oscillations
$A_{10}$
denotes the maximum 10 % peaks of oscillation for each run; (ii) the normalized frequency of oscillations
 $f^{\ast }=f/f_{N}$
, where the frequency of oscillations
$f^{\ast }=f/f_{N}$
, where the frequency of oscillations
 $f$
was computed from the fast Fourier transform of
$f$
was computed from the fast Fourier transform of
 $y(t)$
.
$y(t)$
.
2.3 Particle image velocimetry measurements
The PIV set used to characterize the flow field of the near wake of the cylinder was from Dantec Dynamics. Flow illumination was provided by a pulsed Nd:YAG 800 mJ laser. Each laser pulse lasted for
 $5~\unicode[STIX]{x03BC}\text{s}$
. Images were taken using a Dantec Dynamics Flow Sense 2ME camera with a resolution of
$5~\unicode[STIX]{x03BC}\text{s}$
. Images were taken using a Dantec Dynamics Flow Sense 2ME camera with a resolution of
 $1600~\text{pixels}\times 1200~\text{pixels}$
. Data transmission was made directly to the PC RAM via a PCIe-1427 image acquisition board, which allows for an information transfer greater than 200 MB per second. The camera lens was a Zeiss Makro-Planar T
$1600~\text{pixels}\times 1200~\text{pixels}$
. Data transmission was made directly to the PC RAM via a PCIe-1427 image acquisition board, which allows for an information transfer greater than 200 MB per second. The camera lens was a Zeiss Makro-Planar T
 $2/50$
mm ZF. The laser sheet intercepts the circular cylinder perpendicular to its axis at a height of 210 mm from its bottom end. After passing through the sidewalls, it was verified that the thickness of the laser sheet was smaller than 1 mm. The camera was set under the water channel perpendicular to the laser sheet. The flow was seeded with hollow glass spheres having a diameter of
$2/50$
mm ZF. The laser sheet intercepts the circular cylinder perpendicular to its axis at a height of 210 mm from its bottom end. After passing through the sidewalls, it was verified that the thickness of the laser sheet was smaller than 1 mm. The camera was set under the water channel perpendicular to the laser sheet. The flow was seeded with hollow glass spheres having a diameter of
 $10~\unicode[STIX]{x03BC}\text{m}$
(HGS-10). Synchronization between image capturing and flow illumination and the analysis was carried out using the Dynamic Studio Dantec software.
$10~\unicode[STIX]{x03BC}\text{m}$
(HGS-10). Synchronization between image capturing and flow illumination and the analysis was carried out using the Dynamic Studio Dantec software.
PIV measurements were carried out with the laser sheet perpendicular to the circular cylinder at a constant height of 210 mm from the bottom end of the cylinder with the camera situated under the water channel (oriented perpendicular to the laser sheet; see figure 2
a). The field of view of the camera corresponds approximately to a rectangle of
 $9D\times 6.75D$
that has physical dimensions of
$9D\times 6.75D$
that has physical dimensions of
 $225~\text{mm}\times 169~\text{mm}$
containing
$225~\text{mm}\times 169~\text{mm}$
containing
 $1600~\text{pixels}\times 1200~\text{pixels}$
and focuses on the near wake after the circular cylinder.
$1600~\text{pixels}\times 1200~\text{pixels}$
and focuses on the near wake after the circular cylinder.
Sampling of the flow field was carried out at a frequency of 15 Hz. Each sample of the flow field was generated through an adaptive cross-correlation from the images obtained from two consecutive laser pulses separated by 3 ms in time. For the case of highest reduced velocity analysed (
 $U^{\ast }=15$
), the mean flow velocity was
$U^{\ast }=15$
), the mean flow velocity was
 $0.38~\text{m}~\text{s}^{-1}$
. Thus, a particle would travel around 1 mm between two consecutive laser pulses (which is much less than the characteristic length of the problem,
$0.38~\text{m}~\text{s}^{-1}$
. Thus, a particle would travel around 1 mm between two consecutive laser pulses (which is much less than the characteristic length of the problem,
 $D=25~\text{mm}$
). Each PIV area was divided into smaller sub-interrogation areas of
$D=25~\text{mm}$
). Each PIV area was divided into smaller sub-interrogation areas of
 $128~\text{pixels}\times 128~\text{pixels}$
and, through a parallel self-consistent recomputation of the flow field in successive interrogation areas of
$128~\text{pixels}\times 128~\text{pixels}$
and, through a parallel self-consistent recomputation of the flow field in successive interrogation areas of
 $64~\text{pixels}\times 64~\text{pixels}$
and
$64~\text{pixels}\times 64~\text{pixels}$
and
 $32~\text{pixels}\times 32~\text{pixels}$
(or
$32~\text{pixels}\times 32~\text{pixels}$
(or
 $4.5~\text{mm}\times 4.5~\text{mm}$
), with 50 % overlap, spatial resolution refinement was obtained (final computations were consistent with the flow fields obtained for larger windows). The final spatial resolution of the flow field for the experimental tests was of the order of 2 mm, which is considered to be sufficient to obtain information of the near-wake vortex shedding structures.
$4.5~\text{mm}\times 4.5~\text{mm}$
), with 50 % overlap, spatial resolution refinement was obtained (final computations were consistent with the flow fields obtained for larger windows). The final spatial resolution of the flow field for the experimental tests was of the order of 2 mm, which is considered to be sufficient to obtain information of the near-wake vortex shedding structures.
With regard to time resolution, large-scale vortices have a characteristic time scale (related to the Strouhal number,
 $St=f_{v}D/U$
) of 1–3 Hz for the range of reduced velocities under consideration, which is roughly 5–15 times lower than the acquisition time scale (15 Hz). The recording sequence consisted of 300 frames (lasting 20 s), which is equivalent to approximately 20 oscillation cycles of the circular cylinder. The measurement process was repeated three times for each set of parameters investigated.
$St=f_{v}D/U$
) of 1–3 Hz for the range of reduced velocities under consideration, which is roughly 5–15 times lower than the acquisition time scale (15 Hz). The recording sequence consisted of 300 frames (lasting 20 s), which is equivalent to approximately 20 oscillation cycles of the circular cylinder. The measurement process was repeated three times for each set of parameters investigated.
2.4 Validation test
To validate the experimental set-up and to obtain reference data for comparison, a non-rotating VIV circular cylinder curve was obtained. As said before, the circular cylinder had a diameter of
 $D=25~\text{mm}$
and submerged length of
$D=25~\text{mm}$
and submerged length of
 $L=430~\text{mm}$
(aspect ratio
$L=430~\text{mm}$
(aspect ratio
 $L/D=17.2$
and blockage ratio of 2.7 %). From the mechanical point of view, the mass ratio was
$L/D=17.2$
and blockage ratio of 2.7 %). From the mechanical point of view, the mass ratio was
 $m^{\ast }=11.7$
and damping
$m^{\ast }=11.7$
and damping
 $\unicode[STIX]{x1D701}=0.0043$
(yielding a mass-damping parameter value of
$\unicode[STIX]{x1D701}=0.0043$
(yielding a mass-damping parameter value of
 $m^{\ast }\unicode[STIX]{x1D701}=0.0506$
). The
$m^{\ast }\unicode[STIX]{x1D701}=0.0506$
). The
 $Re$
at the peak of the amplitude curve response was
$Re$
at the peak of the amplitude curve response was
 $Re=3200$
.
$Re=3200$
.
Figure 3 shows the measured VIV response in terms of
 $A^{\ast }$
(
$A^{\ast }$
(
 $A_{10}^{\ast }$
) as a function of the reduced velocity
$A_{10}^{\ast }$
) as a function of the reduced velocity
 $U^{\ast }$
. All measurements have been made with increasing water speed. For comparison purposes, results from Khalak & Williamson (Reference Khalak and Williamson1999), Assi et al. (Reference Assi, Meneghini, Aranha, Bearman and Casaprima2006) and Klamo (Reference Klamo2007) are also given. The mass ratios of Khalak & Williamson (Reference Khalak and Williamson1999) (
$U^{\ast }$
. All measurements have been made with increasing water speed. For comparison purposes, results from Khalak & Williamson (Reference Khalak and Williamson1999), Assi et al. (Reference Assi, Meneghini, Aranha, Bearman and Casaprima2006) and Klamo (Reference Klamo2007) are also given. The mass ratios of Khalak & Williamson (Reference Khalak and Williamson1999) (
 $m^{\ast }=10.1$
), Assi et al. (Reference Assi, Meneghini, Aranha, Bearman and Casaprima2006) (
$m^{\ast }=10.1$
), Assi et al. (Reference Assi, Meneghini, Aranha, Bearman and Casaprima2006) (
 $m^{\ast }=8.1$
) and Klamo (Reference Klamo2007) (
$m^{\ast }=8.1$
) and Klamo (Reference Klamo2007) (
 $m^{\ast }=6.5$
) are comparable to our final set-up (
$m^{\ast }=6.5$
) are comparable to our final set-up (
 $m^{\ast }=11.7$
), while the mass-damping parameters were
$m^{\ast }=11.7$
), while the mass-damping parameters were
 $m^{\ast }\unicode[STIX]{x1D701}=0.017$
, 0.016 and 0.01, respectively, which are smaller than the mass-damping ratio of the present study (
$m^{\ast }\unicode[STIX]{x1D701}=0.017$
, 0.016 and 0.01, respectively, which are smaller than the mass-damping ratio of the present study (
 $m^{\ast }\unicode[STIX]{x1D701}=0.0506$
). The Reynolds-number ranges of all cases are similar. In particular, the Reynolds number at the amplitude’s curve peak was
$m^{\ast }\unicode[STIX]{x1D701}=0.0506$
). The Reynolds-number ranges of all cases are similar. In particular, the Reynolds number at the amplitude’s curve peak was
 $Re\approx 5000$
for Khalak & Williamson (Reference Khalak and Williamson1999),
$Re\approx 5000$
for Khalak & Williamson (Reference Khalak and Williamson1999),
 $Re\approx 5500$
in Assi et al. (Reference Assi, Meneghini, Aranha, Bearman and Casaprima2006),
$Re\approx 5500$
in Assi et al. (Reference Assi, Meneghini, Aranha, Bearman and Casaprima2006),
 $Re\approx 2600$
in Klamo (Reference Klamo2007), and
$Re\approx 2600$
in Klamo (Reference Klamo2007), and
 $Re\approx 3200$
for the present VIV test.
$Re\approx 3200$
for the present VIV test.
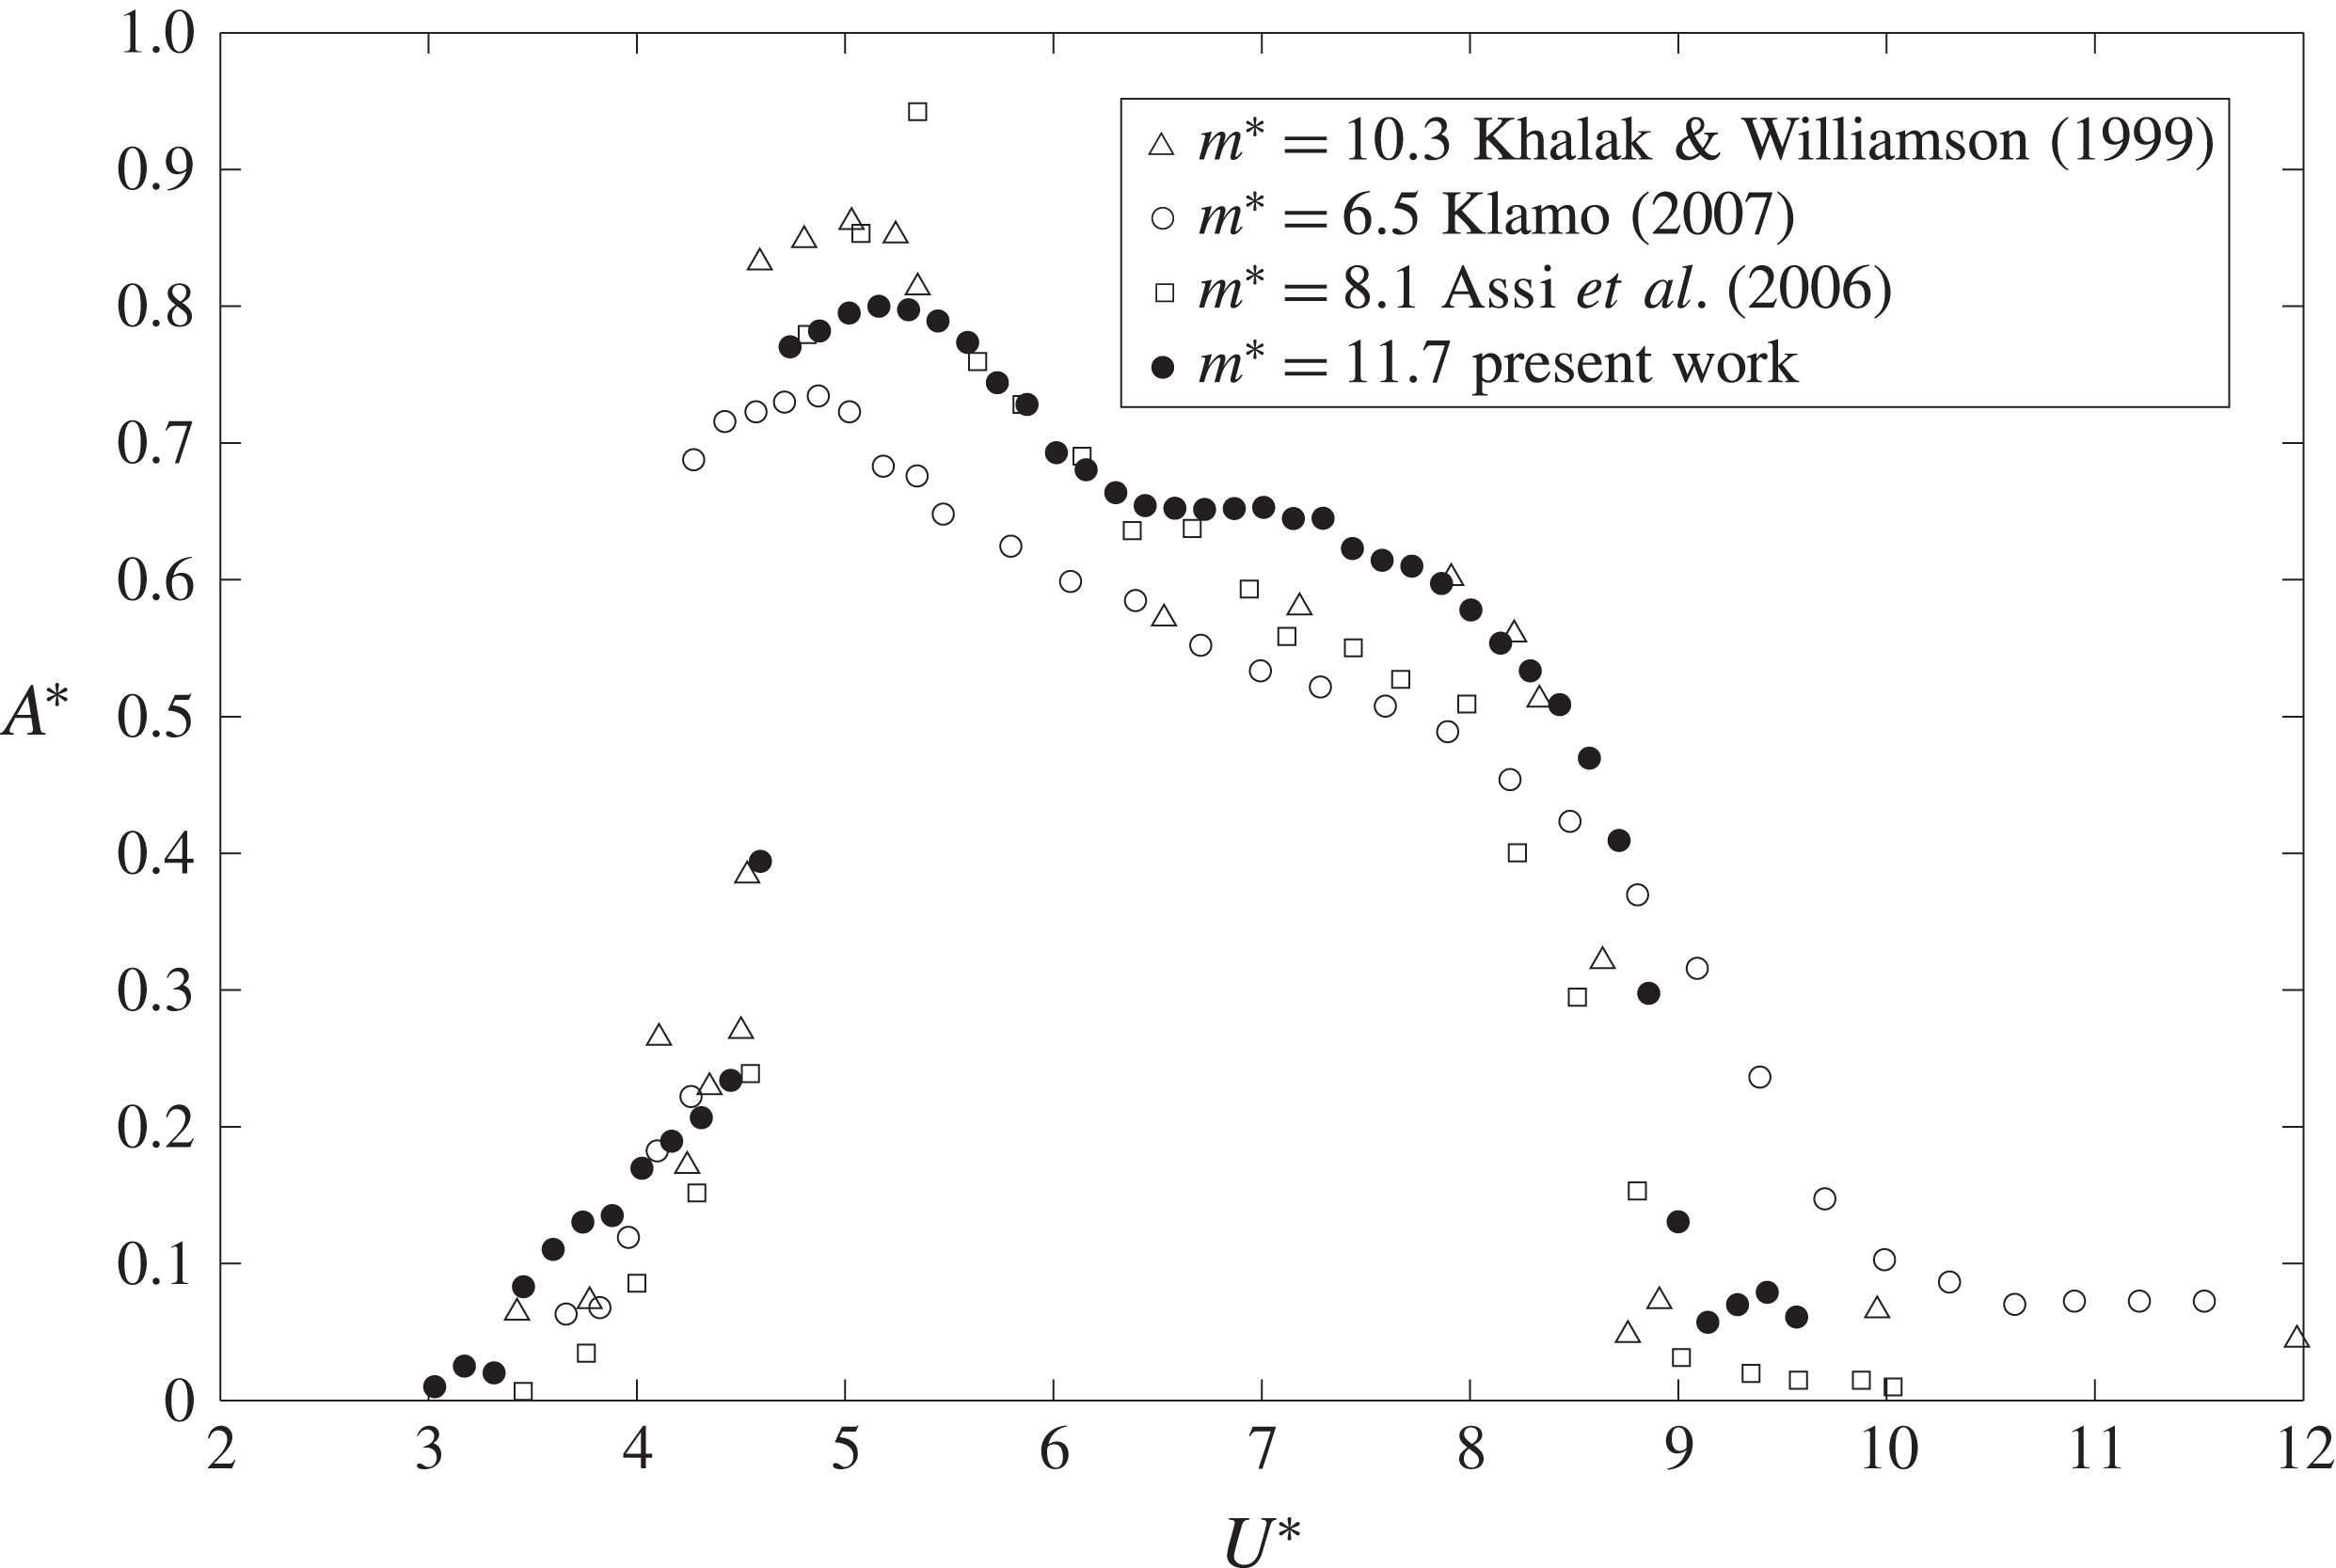
Figure 3. Comparison of experimental results for the normalized amplitude variation with reduced velocity. Triangles are from Khalak & Williamson (Reference Khalak and Williamson1999) (
 $m^{\ast }=10.3$
,
$m^{\ast }=10.3$
,
 $\unicode[STIX]{x1D701}=0.0017$
), open circles are from Klamo (Reference Klamo2007) (
$\unicode[STIX]{x1D701}=0.0017$
), open circles are from Klamo (Reference Klamo2007) (
 $m^{\ast }=6.5$
,
$m^{\ast }=6.5$
,
 $\unicode[STIX]{x1D701}=0.0015$
), squares are from Assi et al. (Reference Assi, Meneghini, Aranha, Bearman and Casaprima2006) (
$\unicode[STIX]{x1D701}=0.0015$
), squares are from Assi et al. (Reference Assi, Meneghini, Aranha, Bearman and Casaprima2006) (
 $m^{\ast }=8.1$
,
$m^{\ast }=8.1$
,
 $\unicode[STIX]{x1D701}=0.0020$
) and solid circles stand for the present results (
$\unicode[STIX]{x1D701}=0.0020$
) and solid circles stand for the present results (
 $m^{\ast }=11.7$
,
$m^{\ast }=11.7$
,
 $\unicode[STIX]{x1D701}=0.0043$
).
$\unicode[STIX]{x1D701}=0.0043$
).
As can be seen, all VIV responses present three distinctive branches, which correspond to the initial, upper and lower branch, respectively. As described by Govardhan & Williamson (Reference Govardhan and Williamson2006), the VIV curve shows three such distinctive branches for high enough Reynolds number and low enough mass-damping parameter. The transition between the initial and upper branches happens at
 $U^{\ast }\approx 4.5$
and a distinctive lower branch can be observed between
$U^{\ast }\approx 4.5$
and a distinctive lower branch can be observed between
 $U^{\ast }\approx 6$
and
$U^{\ast }\approx 6$
and
 $U^{\ast }\approx 9$
where desynchronization occurs. With respect to the maximum amplitude obtained, the differences appear to be mainly due to the effect of the Reynolds number. This point was studied in Govardhan & Williamson (Reference Govardhan and Williamson2006) where a ‘modified Griffin plot’ was introduced and a best fit for a wide range of mass damping and Reynolds number was given as
$U^{\ast }\approx 9$
where desynchronization occurs. With respect to the maximum amplitude obtained, the differences appear to be mainly due to the effect of the Reynolds number. This point was studied in Govardhan & Williamson (Reference Govardhan and Williamson2006) where a ‘modified Griffin plot’ was introduced and a best fit for a wide range of mass damping and Reynolds number was given as
 $A_{fit}^{\ast }=[1-1.12m^{\ast }\unicode[STIX]{x1D701}+0.3(m^{\ast }\unicode[STIX]{x1D701})^{2}]\log _{10}(0.41Re^{0.36})$
, which for our experimental set-up yields a theoretical maximum amplitude of oscillation of
$A_{fit}^{\ast }=[1-1.12m^{\ast }\unicode[STIX]{x1D701}+0.3(m^{\ast }\unicode[STIX]{x1D701})^{2}]\log _{10}(0.41Re^{0.36})$
, which for our experimental set-up yields a theoretical maximum amplitude of oscillation of
 $A_{fit}^{\ast }=0.82$
, which agrees closely with the maximum amplitude measured of
$A_{fit}^{\ast }=0.82$
, which agrees closely with the maximum amplitude measured of
 $A^{\ast }=0.8$
.
$A^{\ast }=0.8$
.
With regard to the end conditions, no attached end-plate was used (the effects of end conditions are reviewed in Morse, Govardhan & Williamson (Reference Morse, Govardhan and Williamson2008)), which leads to a less distinctive upper/lower transition (similar to those from Assi et al. (Reference Assi, Meneghini, Aranha, Bearman and Casaprima2006) and Klamo (Reference Klamo2007)). The decision not to use an end-plate was meant to avoid undesired effects when rotating the cylinder because small misalignments might lead to large damping effects when the cylinder rotates.
The overall agreement is good. As can be seen, all VIV amplitude responses present slight differences, which can be reasonably ascribed to the different experimental conditions listed previously. Other important factors that alter the VIV response, and could explain some differences, include the inflow properties such as its turbulence or uniformity.
3 Results
The effects of rotating the cylinder on its dynamical behaviour (namely the amplitude and frequency of oscillation) are presented here. Two strategies are proposed and compared, focusing mainly on the enhancement in oscillation amplitude or reduction in the oscillations. To better understand the mechanisms underlying the oscillations of the cylinder, PIV visualizations of the near wake are also presented.
3.1 Rotation proportional to position
Firstly, the effect of rotating the cylinder along its axis proportionally to the position of the cylinder will be studied,
 $$\begin{eqnarray}\unicode[STIX]{x1D703}=\tilde{k}_{1}Y,\end{eqnarray}$$
where
 $\tilde{k}_{1}$
is a non-dimensional feedback constant that relates the position of the cylinder to the rotation angle of the cylinder along its axis. The cylinder’s response is presented in § 3.1.1 and the different wake patterns in certain configurations are examined in § 3.1.2. A quasi-steady model is developed and presented in § 3.1.3.
$\tilde{k}_{1}$
is a non-dimensional feedback constant that relates the position of the cylinder to the rotation angle of the cylinder along its axis. The cylinder’s response is presented in § 3.1.1 and the different wake patterns in certain configurations are examined in § 3.1.2. A quasi-steady model is developed and presented in § 3.1.3.
3.1.1 Cylinder dynamics

Figure 4. Maximum non-dimensional amplitude oscillation as a function of the reduced velocity for (a) positive values and (b) negative values of the rotating parameter
 $\tilde{k}_{1}$
.
$\tilde{k}_{1}$
.
Owing to the character of the rotation imposed, symmetry is not broken and oscillations take place around the equilibrium position without flow (
 $Y=0$
) for all values of
$Y=0$
) for all values of
 $U^{\ast }$
and
$U^{\ast }$
and
 $\tilde{k}_{1}$
. Thus, the cylinder’s response can be described by its main frequency of oscillation
$\tilde{k}_{1}$
. Thus, the cylinder’s response can be described by its main frequency of oscillation
 $f^{\ast }=f/f_{N}$
and the dimensionless amplitude
$f^{\ast }=f/f_{N}$
and the dimensionless amplitude
 $A^{\ast }=A_{10}/D$
of the cylinder’s steady-state oscillations.
$A^{\ast }=A_{10}/D$
of the cylinder’s steady-state oscillations.
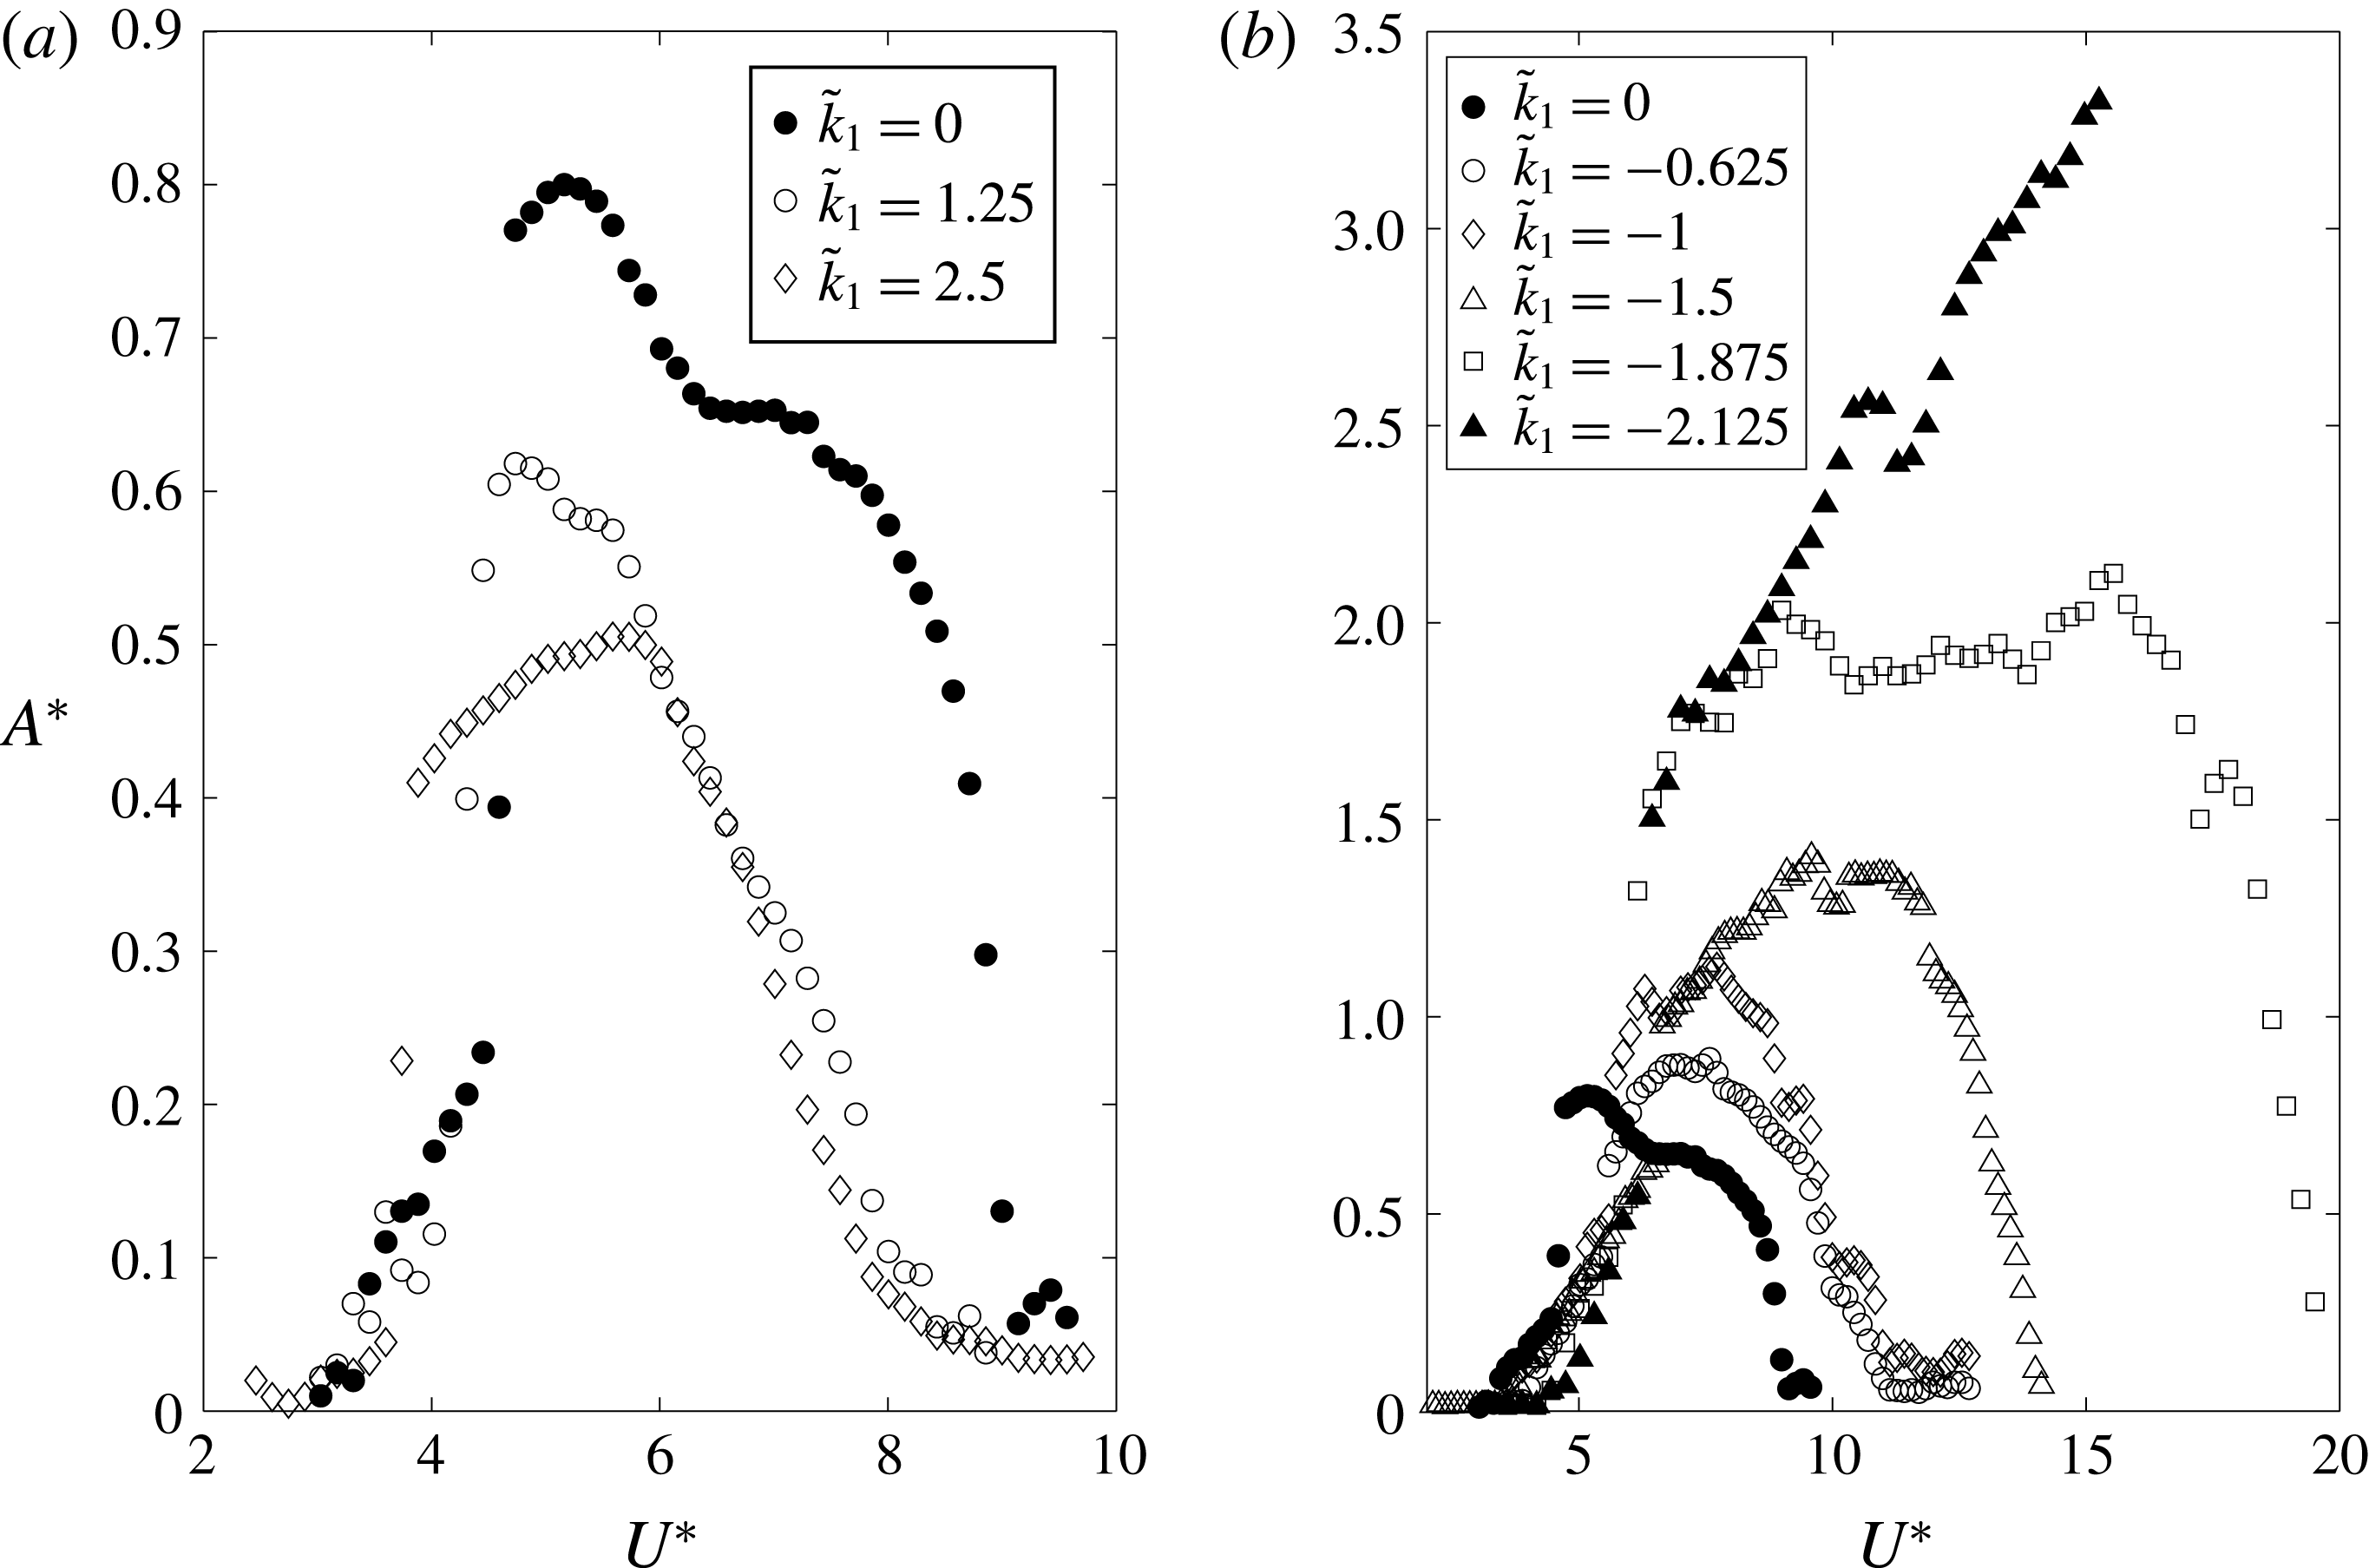
Figure 4 shows the variation of the amplitude of oscillation for different values of
 $\tilde{k}_{1}$
. With respect to the non-rotating case (that is,
$\tilde{k}_{1}$
. With respect to the non-rotating case (that is,
 $\tilde{k}_{1}=0$
), positive values of
$\tilde{k}_{1}=0$
), positive values of
 $\tilde{k}_{1}$
lead to a reduction of the maximum amplitude of oscillation as well as a reduction of the region of
$\tilde{k}_{1}$
lead to a reduction of the maximum amplitude of oscillation as well as a reduction of the region of
 $U^{\ast }$
where the cylinder undergoes large-amplitude oscillations. However, as can be seen, between
$U^{\ast }$
where the cylinder undergoes large-amplitude oscillations. However, as can be seen, between
 $\tilde{k}_{1}=1.25$
and
$\tilde{k}_{1}=1.25$
and
 $\tilde{k}_{1}=2.5$
, the reduction in amplitude of oscillation is not very significant (figure 4
b). If
$\tilde{k}_{1}=2.5$
, the reduction in amplitude of oscillation is not very significant (figure 4
b). If
 $\tilde{k}_{1}$
is further increased, the picture does not vary much (regarding amplitude of oscillation, or synchronization region). With respect to the different branches of the curve, transition between the initial and upper branches is anticipated as
$\tilde{k}_{1}$
is further increased, the picture does not vary much (regarding amplitude of oscillation, or synchronization region). With respect to the different branches of the curve, transition between the initial and upper branches is anticipated as
 $\tilde{k}_{1}$
increases. Finally, it can be noted that the differentiation between upper and lower branches is increasingly lost.
$\tilde{k}_{1}$
increases. Finally, it can be noted that the differentiation between upper and lower branches is increasingly lost.
For negative values of
 $\tilde{k}_{1}$
, the picture is quite different (see figure 4
b): oscillations are significantly enhanced and two different responses can be observed. For
$\tilde{k}_{1}$
, the picture is quite different (see figure 4
b): oscillations are significantly enhanced and two different responses can be observed. For
 $-1.8<\tilde{k}_{1}<0$
, the response amplitude exhibits in all cases a bell-shaped evolution as a function of the reduced velocity, which resembles the classical VIV response. This suggests that the vibrations occur under a wake–body synchronization mechanism. As
$-1.8<\tilde{k}_{1}<0$
, the response amplitude exhibits in all cases a bell-shaped evolution as a function of the reduced velocity, which resembles the classical VIV response. This suggests that the vibrations occur under a wake–body synchronization mechanism. As
 $\tilde{k}_{1}$
becomes more negative, oscillations are more intense, the range of synchronization is enlarged, and the reduced velocity at which maximum amplitude is achieved is delayed as well as the initial–upper branch transition. A different behaviour has been found when
$\tilde{k}_{1}$
becomes more negative, oscillations are more intense, the range of synchronization is enlarged, and the reduced velocity at which maximum amplitude is achieved is delayed as well as the initial–upper branch transition. A different behaviour has been found when
 $\tilde{k}_{1}<-1.8$
. As can be observed, for
$\tilde{k}_{1}<-1.8$
. As can be observed, for
 $\tilde{k}_{1}=-2.125$
, just after the initial–lower transition,
$\tilde{k}_{1}=-2.125$
, just after the initial–lower transition,
 $A^{\ast }$
seems to adopt a quasi-linear dependence on the reduced velocity. This resembles the dependence of galloping-type instability where motion-induced forces are dominant, in contrast to VIV where fluid forces are mainly driven by vortex shedding. For
$A^{\ast }$
seems to adopt a quasi-linear dependence on the reduced velocity. This resembles the dependence of galloping-type instability where motion-induced forces are dominant, in contrast to VIV where fluid forces are mainly driven by vortex shedding. For
 $\tilde{k}_{1}=-2.125$
, values up to
$\tilde{k}_{1}=-2.125$
, values up to
 $U^{\ast }=16$
only are presented. The reason has to do with the actual limitations of the experimental set-up. Specifically, beyond that threshold, the amplitude of the oscillations of the elastic blades is such that their elastic response starts to lose linearity. This raises the question of whether a galloping-like response will continue forever, or at some value of the reduced velocity the oscillations would start to decay. To analyse this point in more detail, an analysis of the near-wake flow pattern is made in the following subsection (figure 7), which shows that synchronization between vortex shedding and oscillations is lost. In addition, a quasi-steady model is developed in the next section, which explains the galloping-type response observed. The value
$U^{\ast }=16$
only are presented. The reason has to do with the actual limitations of the experimental set-up. Specifically, beyond that threshold, the amplitude of the oscillations of the elastic blades is such that their elastic response starts to lose linearity. This raises the question of whether a galloping-like response will continue forever, or at some value of the reduced velocity the oscillations would start to decay. To analyse this point in more detail, an analysis of the near-wake flow pattern is made in the following subsection (figure 7), which shows that synchronization between vortex shedding and oscillations is lost. In addition, a quasi-steady model is developed in the next section, which explains the galloping-type response observed. The value
 $\tilde{k}_{1}=-1.875$
shows an intermediate behaviour: after the initial–upper branch transition, the amplitude response curve adopts a linear trend with the reduced velocity, but at
$\tilde{k}_{1}=-1.875$
shows an intermediate behaviour: after the initial–upper branch transition, the amplitude response curve adopts a linear trend with the reduced velocity, but at
 $U^{\ast }\approx 10$
it loses this trend following an almost constant amplitude of oscillation for increasing
$U^{\ast }\approx 10$
it loses this trend following an almost constant amplitude of oscillation for increasing
 $U^{\ast }$
until large-amplitude oscillations cease abruptly at
$U^{\ast }$
until large-amplitude oscillations cease abruptly at
 $U^{\ast }=20$
.
$U^{\ast }=20$
.
In figure 5, the normalized frequency of oscillations
 $f^{\ast }$
is plotted as a function of the reduced velocity for different values of
$f^{\ast }$
is plotted as a function of the reduced velocity for different values of
 $\tilde{k}_{1}$
. Owing to the large value of the reduced mass, variation of
$\tilde{k}_{1}$
. Owing to the large value of the reduced mass, variation of
 $f^{\ast }$
with
$f^{\ast }$
with
 $U^{\ast }$
is relatively small. In the initial branch the frequency is lowered slightly and then increases linearly with
$U^{\ast }$
is relatively small. In the initial branch the frequency is lowered slightly and then increases linearly with
 $U^{\ast }$
. For
$U^{\ast }$
. For
 $\tilde{k}_{1}>0$
the slope of the frequency variation with
$\tilde{k}_{1}>0$
the slope of the frequency variation with
 $U^{\ast }$
is significantly increased. On the other hand, for negative values of
$U^{\ast }$
is significantly increased. On the other hand, for negative values of
 $\tilde{k}_{1}$
(up to
$\tilde{k}_{1}$
(up to
 $\tilde{k}_{1}>-1.8$
),
$\tilde{k}_{1}>-1.8$
),
 $f^{\ast }$
is lowered and the slope with
$f^{\ast }$
is lowered and the slope with
 $U^{\ast }$
is smaller. Importantly, for large negative values of
$U^{\ast }$
is smaller. Importantly, for large negative values of
 $\tilde{k}_{1}$
(i.e.
$\tilde{k}_{1}$
(i.e.
 $\tilde{k}_{1}<-1.8$
),
$\tilde{k}_{1}<-1.8$
),
 $f^{\ast }$
reaches a near-constant value after
$f^{\ast }$
reaches a near-constant value after
 $U^{\ast }\approx 10$
. This result reinforces the idea that for large negative values of
$U^{\ast }\approx 10$
. This result reinforces the idea that for large negative values of
 $\tilde{k}_{1}$
the cylinder undergoes galloping-type oscillations. Seemingly, the initial–upper branch transition branch occurs near
$\tilde{k}_{1}$
the cylinder undergoes galloping-type oscillations. Seemingly, the initial–upper branch transition branch occurs near
 $f^{\ast }=1$
for all values of
$f^{\ast }=1$
for all values of
 $\tilde{k}_{1}$
(similar to the classical VIV response).
$\tilde{k}_{1}$
(similar to the classical VIV response).
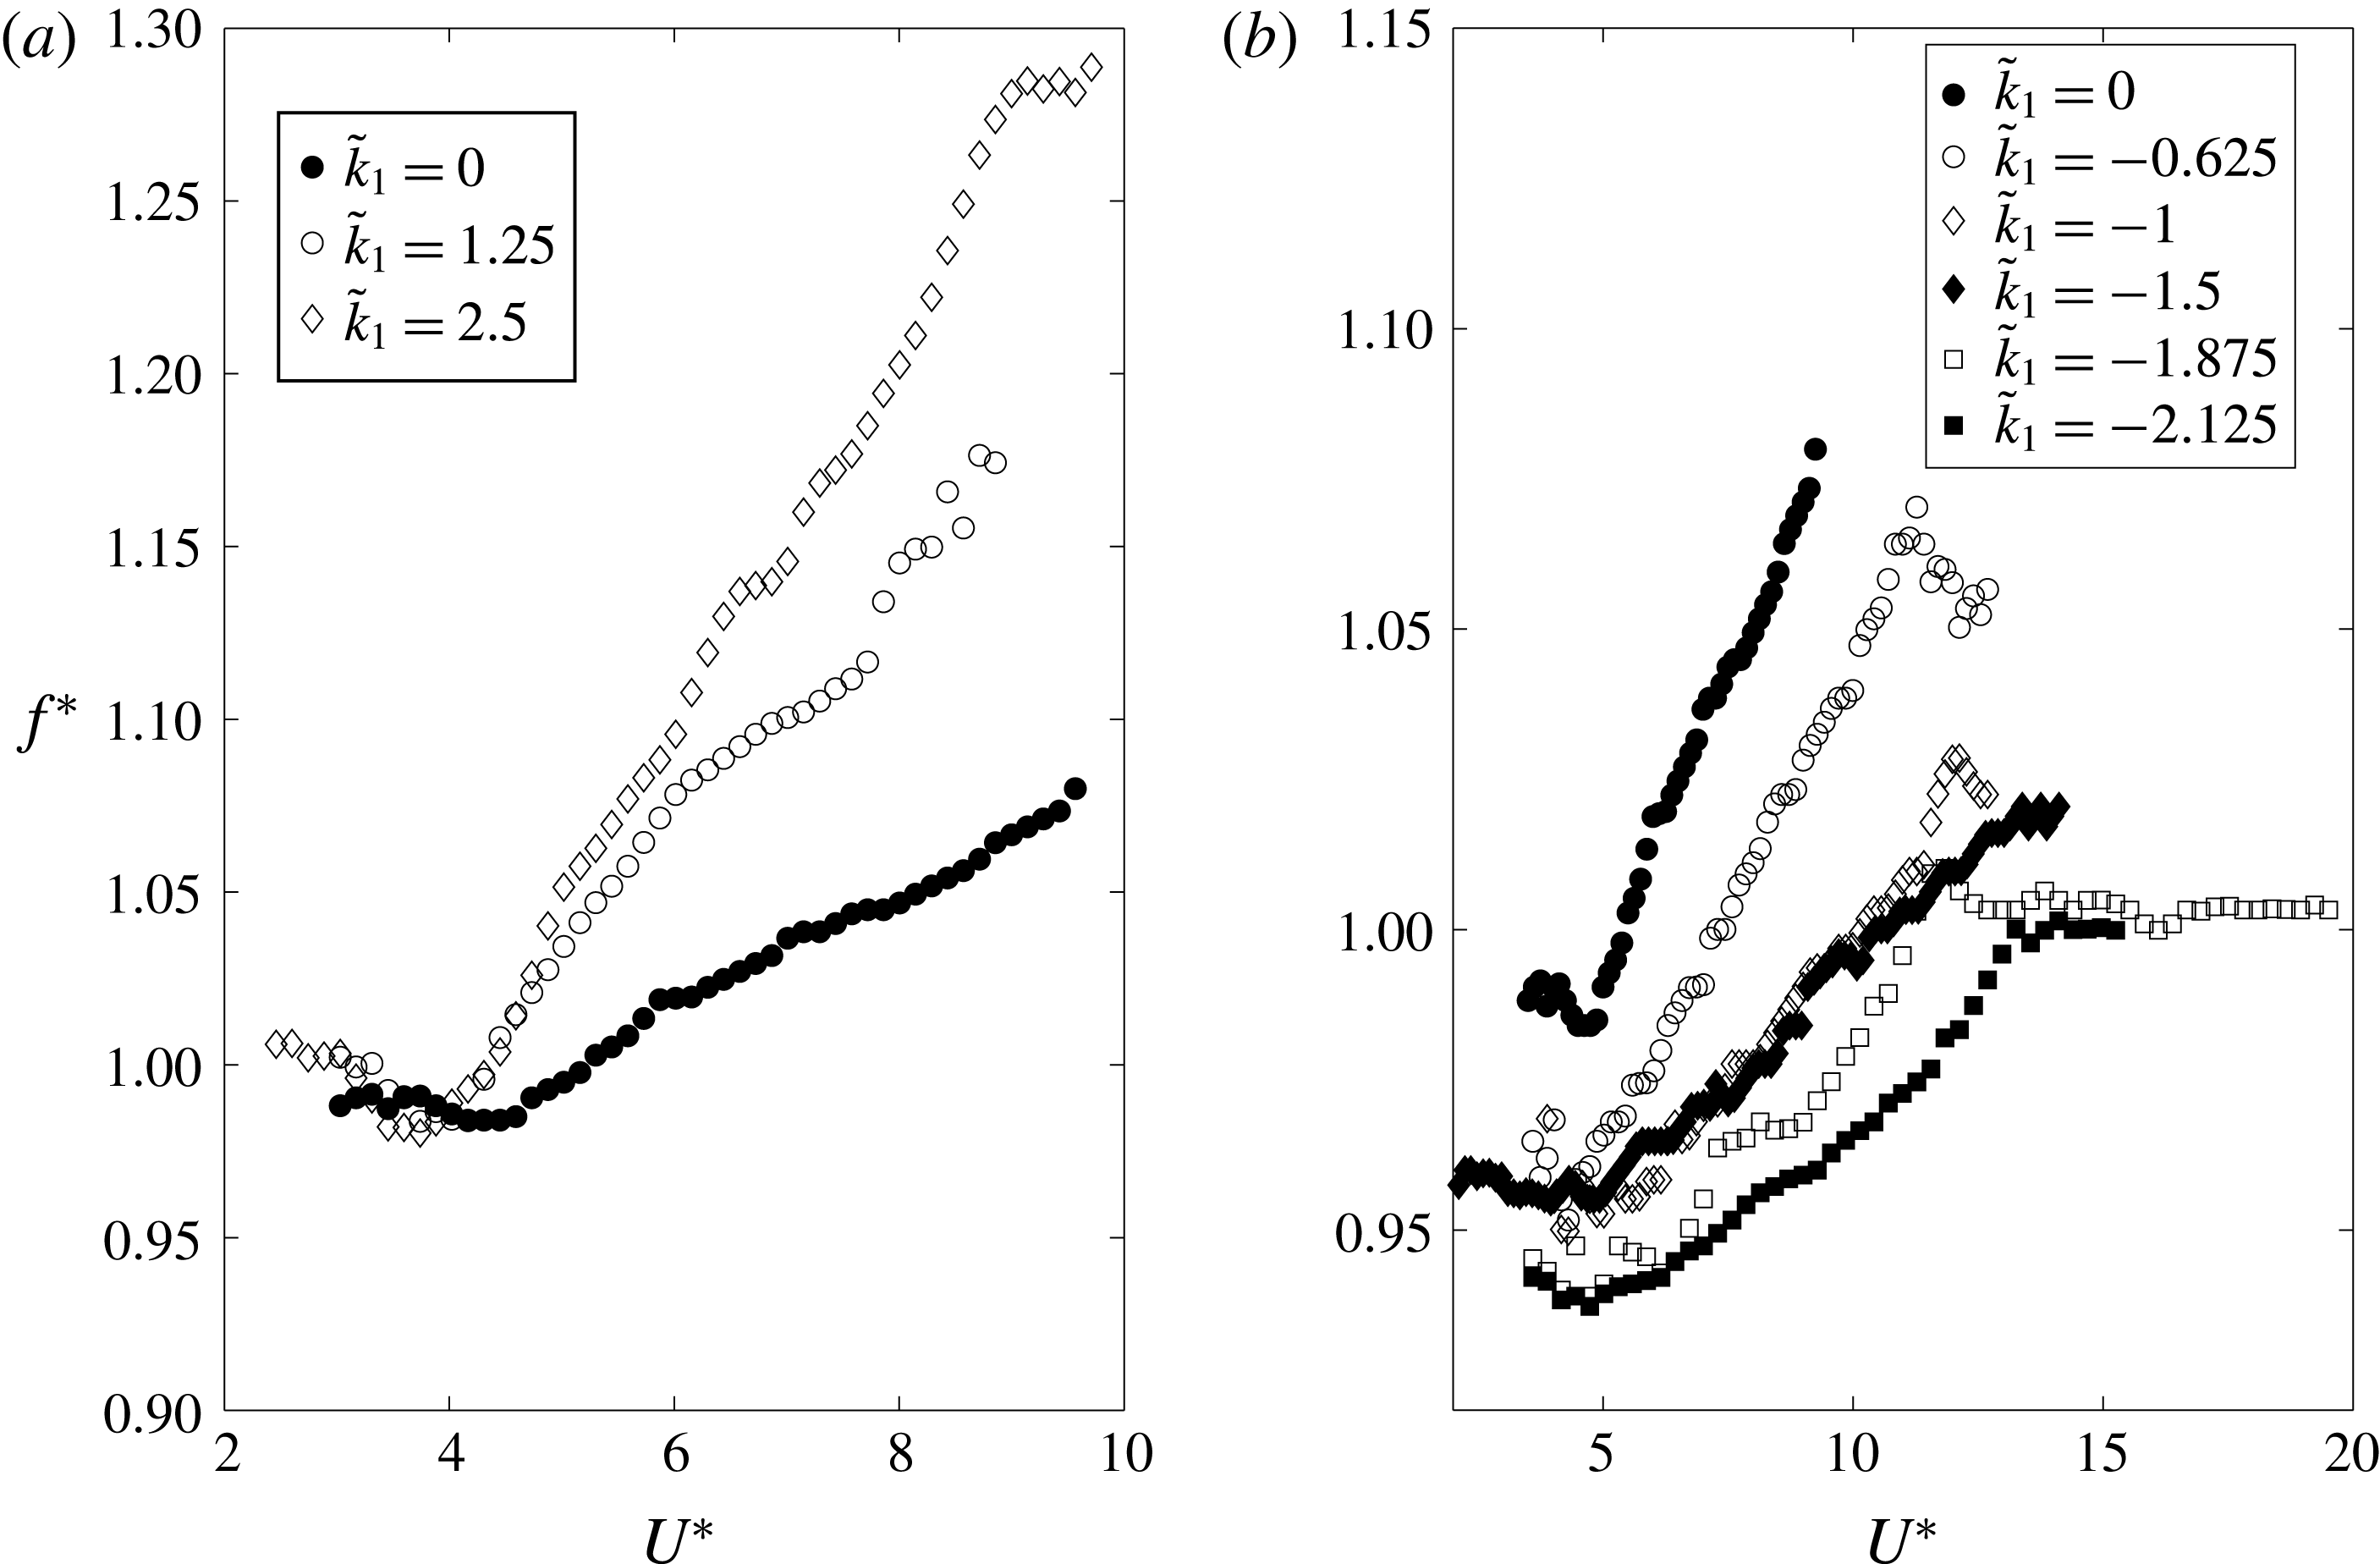
Figure 5. Non-dimensional oscillating frequency of the cylinder as a function of the reduced velocity for (a) positive values and (b) negative values of the rotating parameter
 $\tilde{k}_{1}$
.
$\tilde{k}_{1}$
.
3.1.2 PIV of the near wake for rotation proportional to the position
Here, PIV visualizations of the near wake are presented to understand the effect of the rotation of the cylinder on the wake patterns. Non-dimensional vorticity contours are given for different values of
 $\tilde{k}_{1}$
at two values of the reduced velocity,
$\tilde{k}_{1}$
at two values of the reduced velocity,
 $U^{\ast }=5.2$
(near the peak amplitude) and
$U^{\ast }=5.2$
(near the peak amplitude) and
 $U^{\ast }=7.5$
, which correspond to the upper and lower branches, respectively, in the classical VIV curve (
$U^{\ast }=7.5$
, which correspond to the upper and lower branches, respectively, in the classical VIV curve (
 $\tilde{k}_{1}=0$
). The non-dimensional vorticity contour images have been treated by proper orthogonal decomposition (POD) so as to retain high-level energy modes and to filter high spatial and temporal frequencies (for further details, the reader is referred to Berkooz, Holmes & Lumley (Reference Berkooz, Holmes and Lumley1993) and Ma et al. (Reference Ma, Karniadakis, Park and Gharib2003)).
$\tilde{k}_{1}=0$
). The non-dimensional vorticity contour images have been treated by proper orthogonal decomposition (POD) so as to retain high-level energy modes and to filter high spatial and temporal frequencies (for further details, the reader is referred to Berkooz, Holmes & Lumley (Reference Berkooz, Holmes and Lumley1993) and Ma et al. (Reference Ma, Karniadakis, Park and Gharib2003)).
As mentioned earlier, the classical VIV response, for the Reynolds numbers under consideration (
 $Re=3200$
) and for low enough mass-damping parameter (
$Re=3200$
) and for low enough mass-damping parameter (
 $m^{\ast }\unicode[STIX]{x1D701}=0.0506$
), is characterized by a three-branch curve. Regarding the wake patterns, the initial branch is characterized by a 2S mode of vortex emission at the centreline. The upper branch presents a
$m^{\ast }\unicode[STIX]{x1D701}=0.0506$
), is characterized by a three-branch curve. Regarding the wake patterns, the initial branch is characterized by a 2S mode of vortex emission at the centreline. The upper branch presents a
 $2\text{P}_{0}$
mode of vortex shedding structure (as described in Morse & Williamson (Reference Morse and Williamson2009)), which consists of two pairs of vortices shed per cycle where the secondary vortex has a intensity of circulation smaller than the main vortex (figure 6
a). In the lower branch, the secondary vortex has grown in intensity developing into a full 2P mode (figure 6
b). Further increasing the velocity leads to a desynchronization between vortex emission and oscillation.
$2\text{P}_{0}$
mode of vortex shedding structure (as described in Morse & Williamson (Reference Morse and Williamson2009)), which consists of two pairs of vortices shed per cycle where the secondary vortex has a intensity of circulation smaller than the main vortex (figure 6
a). In the lower branch, the secondary vortex has grown in intensity developing into a full 2P mode (figure 6
b). Further increasing the velocity leads to a desynchronization between vortex emission and oscillation.
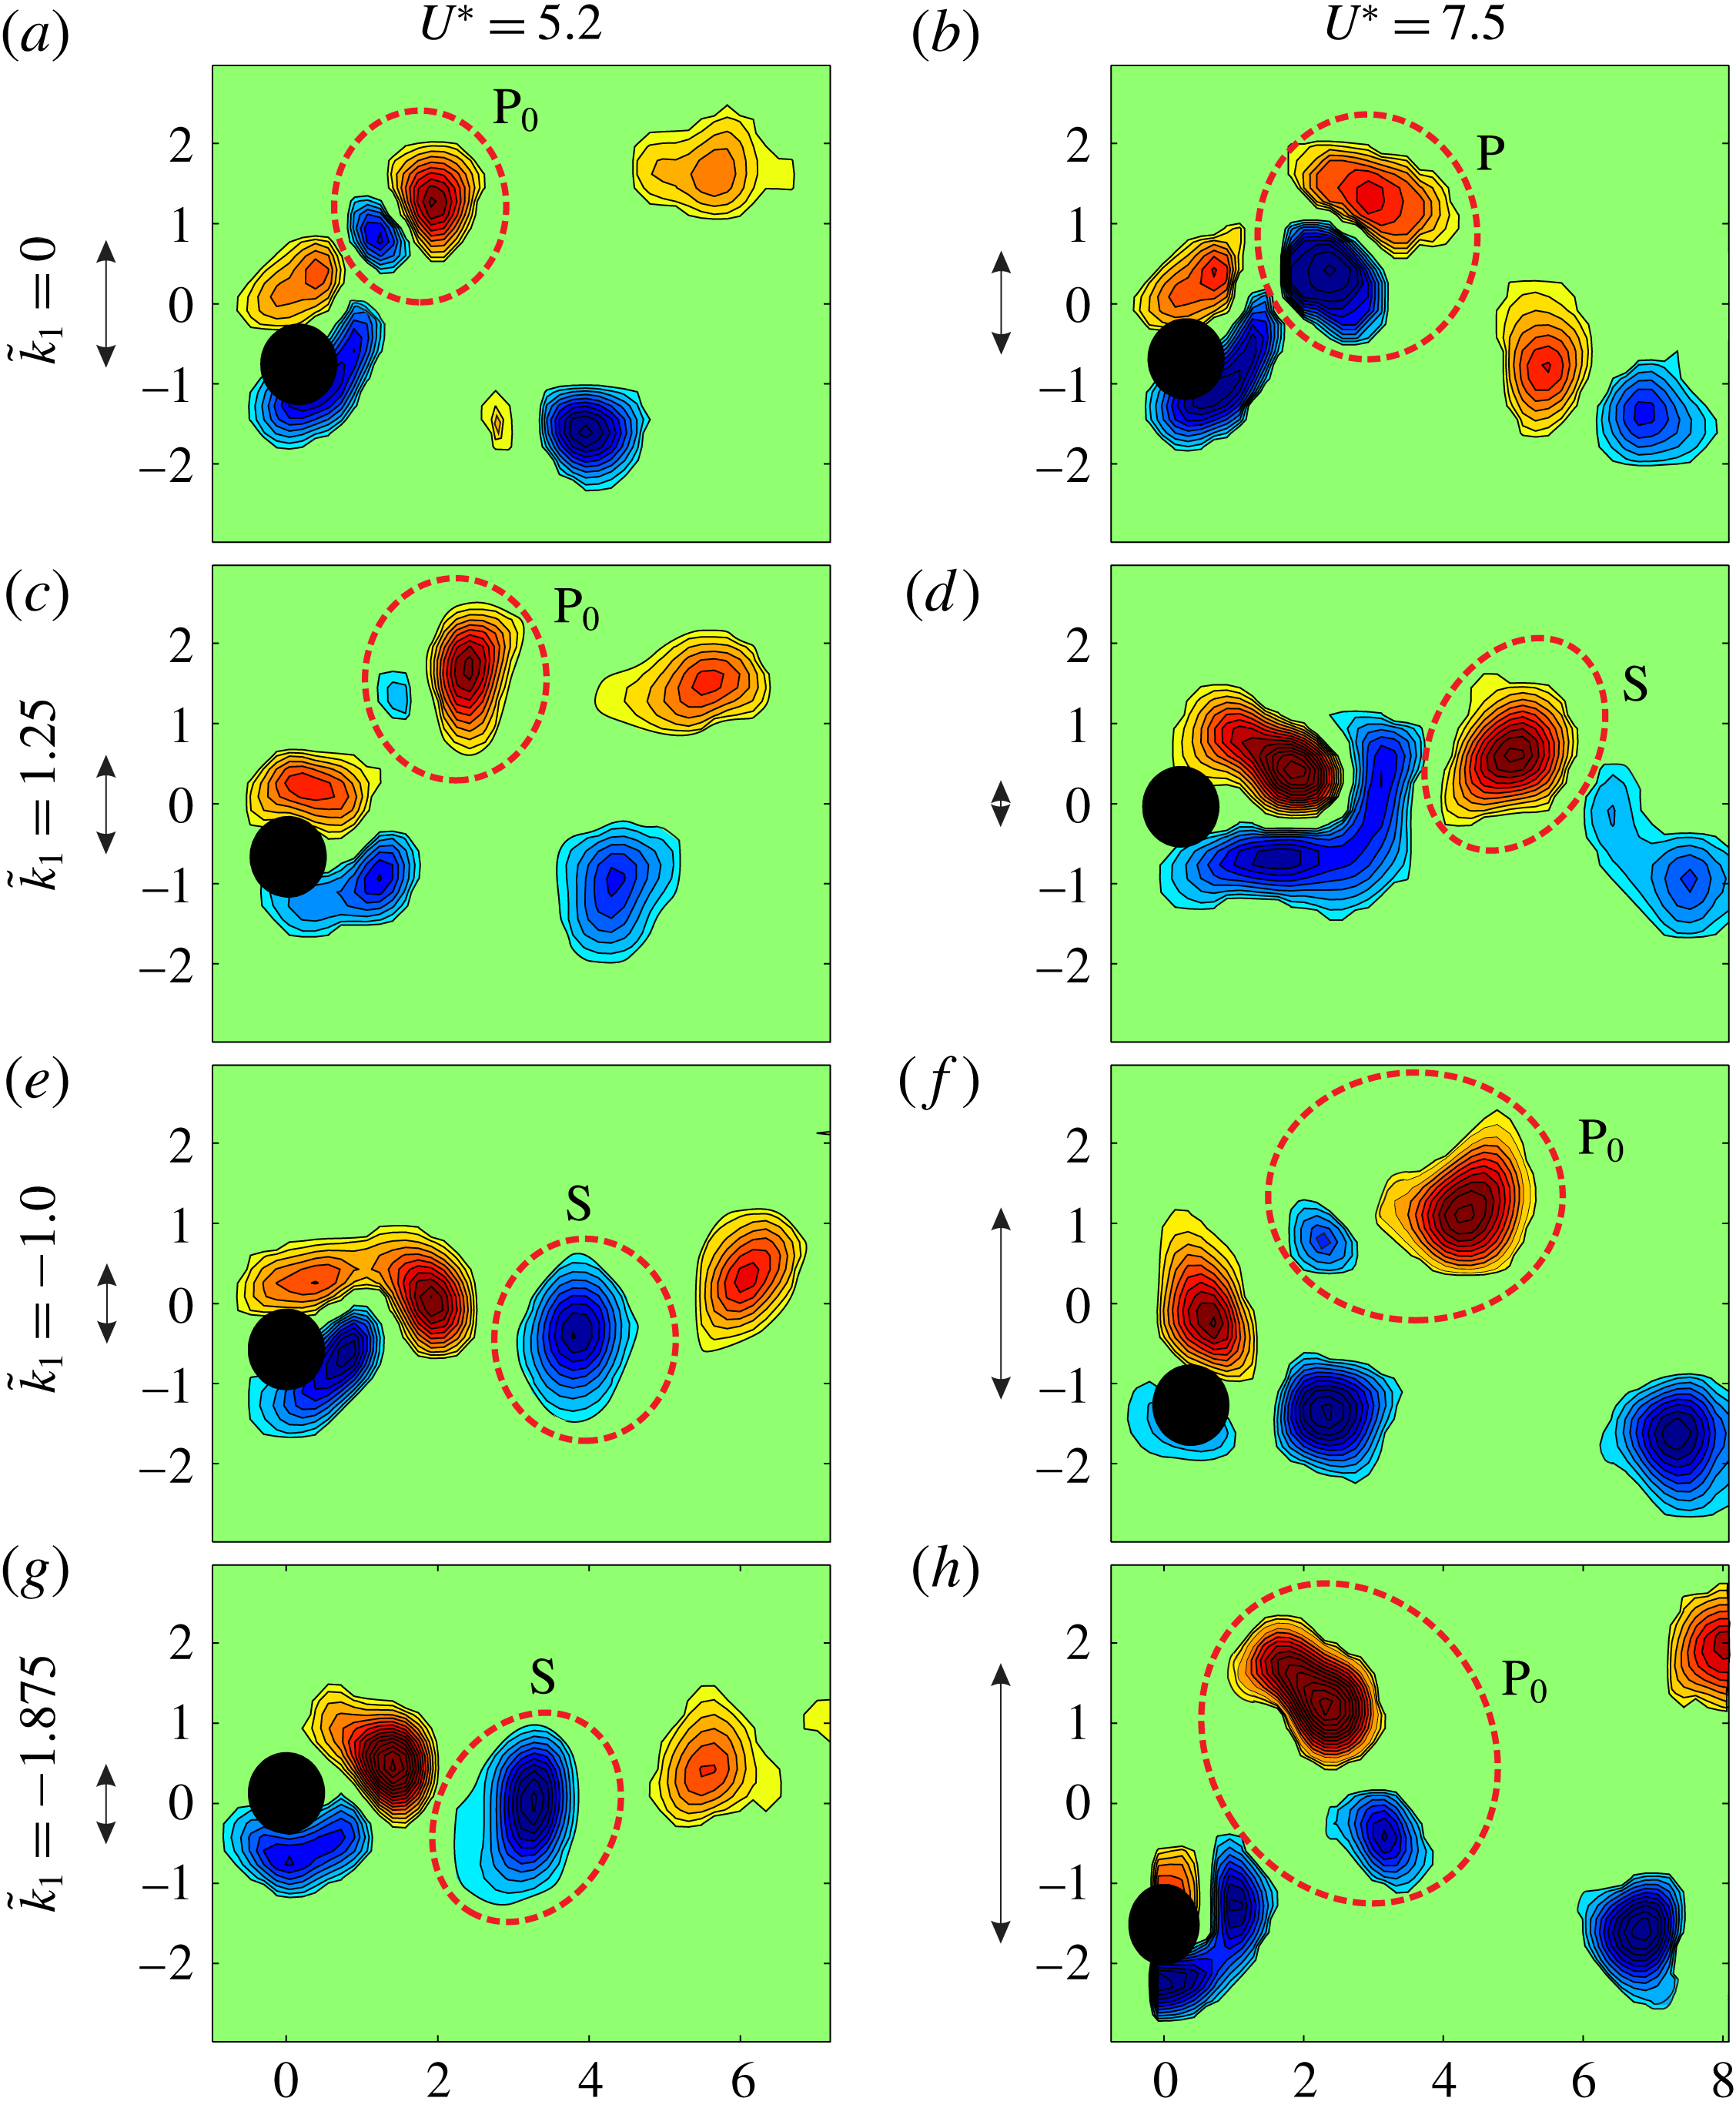
Figure 6. Non-dimensional vorticity contours
 $\unicode[STIX]{x1D714}D/U$
for two values of reduced velocity (
$\unicode[STIX]{x1D714}D/U$
for two values of reduced velocity (
 $U^{\ast }=5.2$
, 7.5) and four values of
$U^{\ast }=5.2$
, 7.5) and four values of
 $\tilde{k}_{1}$
(
$\tilde{k}_{1}$
(
 $\tilde{k}_{1}=0$
, 1.25,
$\tilde{k}_{1}=0$
, 1.25,
 $-1.0$
,
$-1.0$
,
 $-1.875$
), respectively. Red indicates clockwise circulation and blue indicates anticlockwise circulation. Vortical structures are highlighted with a red dashed line. P represents a pair of vortices shed per half-cycle corresponding to a 2P mode of vortex shedding.
$-1.875$
), respectively. Red indicates clockwise circulation and blue indicates anticlockwise circulation. Vortical structures are highlighted with a red dashed line. P represents a pair of vortices shed per half-cycle corresponding to a 2P mode of vortex shedding.
 $\text{P}_{0}$
is equivalent to the previous one but with the secondary vortex being qualitatively smaller (circulation intensity-wise). S structures represent a single vortex being shed per half-cycle, which corresponds to a 2S mode of vortex shedding. Note that, for completeness, the amplitude of oscillation for each case is indicated by a double-headed arrow.
$\text{P}_{0}$
is equivalent to the previous one but with the secondary vortex being qualitatively smaller (circulation intensity-wise). S structures represent a single vortex being shed per half-cycle, which corresponds to a 2S mode of vortex shedding. Note that, for completeness, the amplitude of oscillation for each case is indicated by a double-headed arrow.
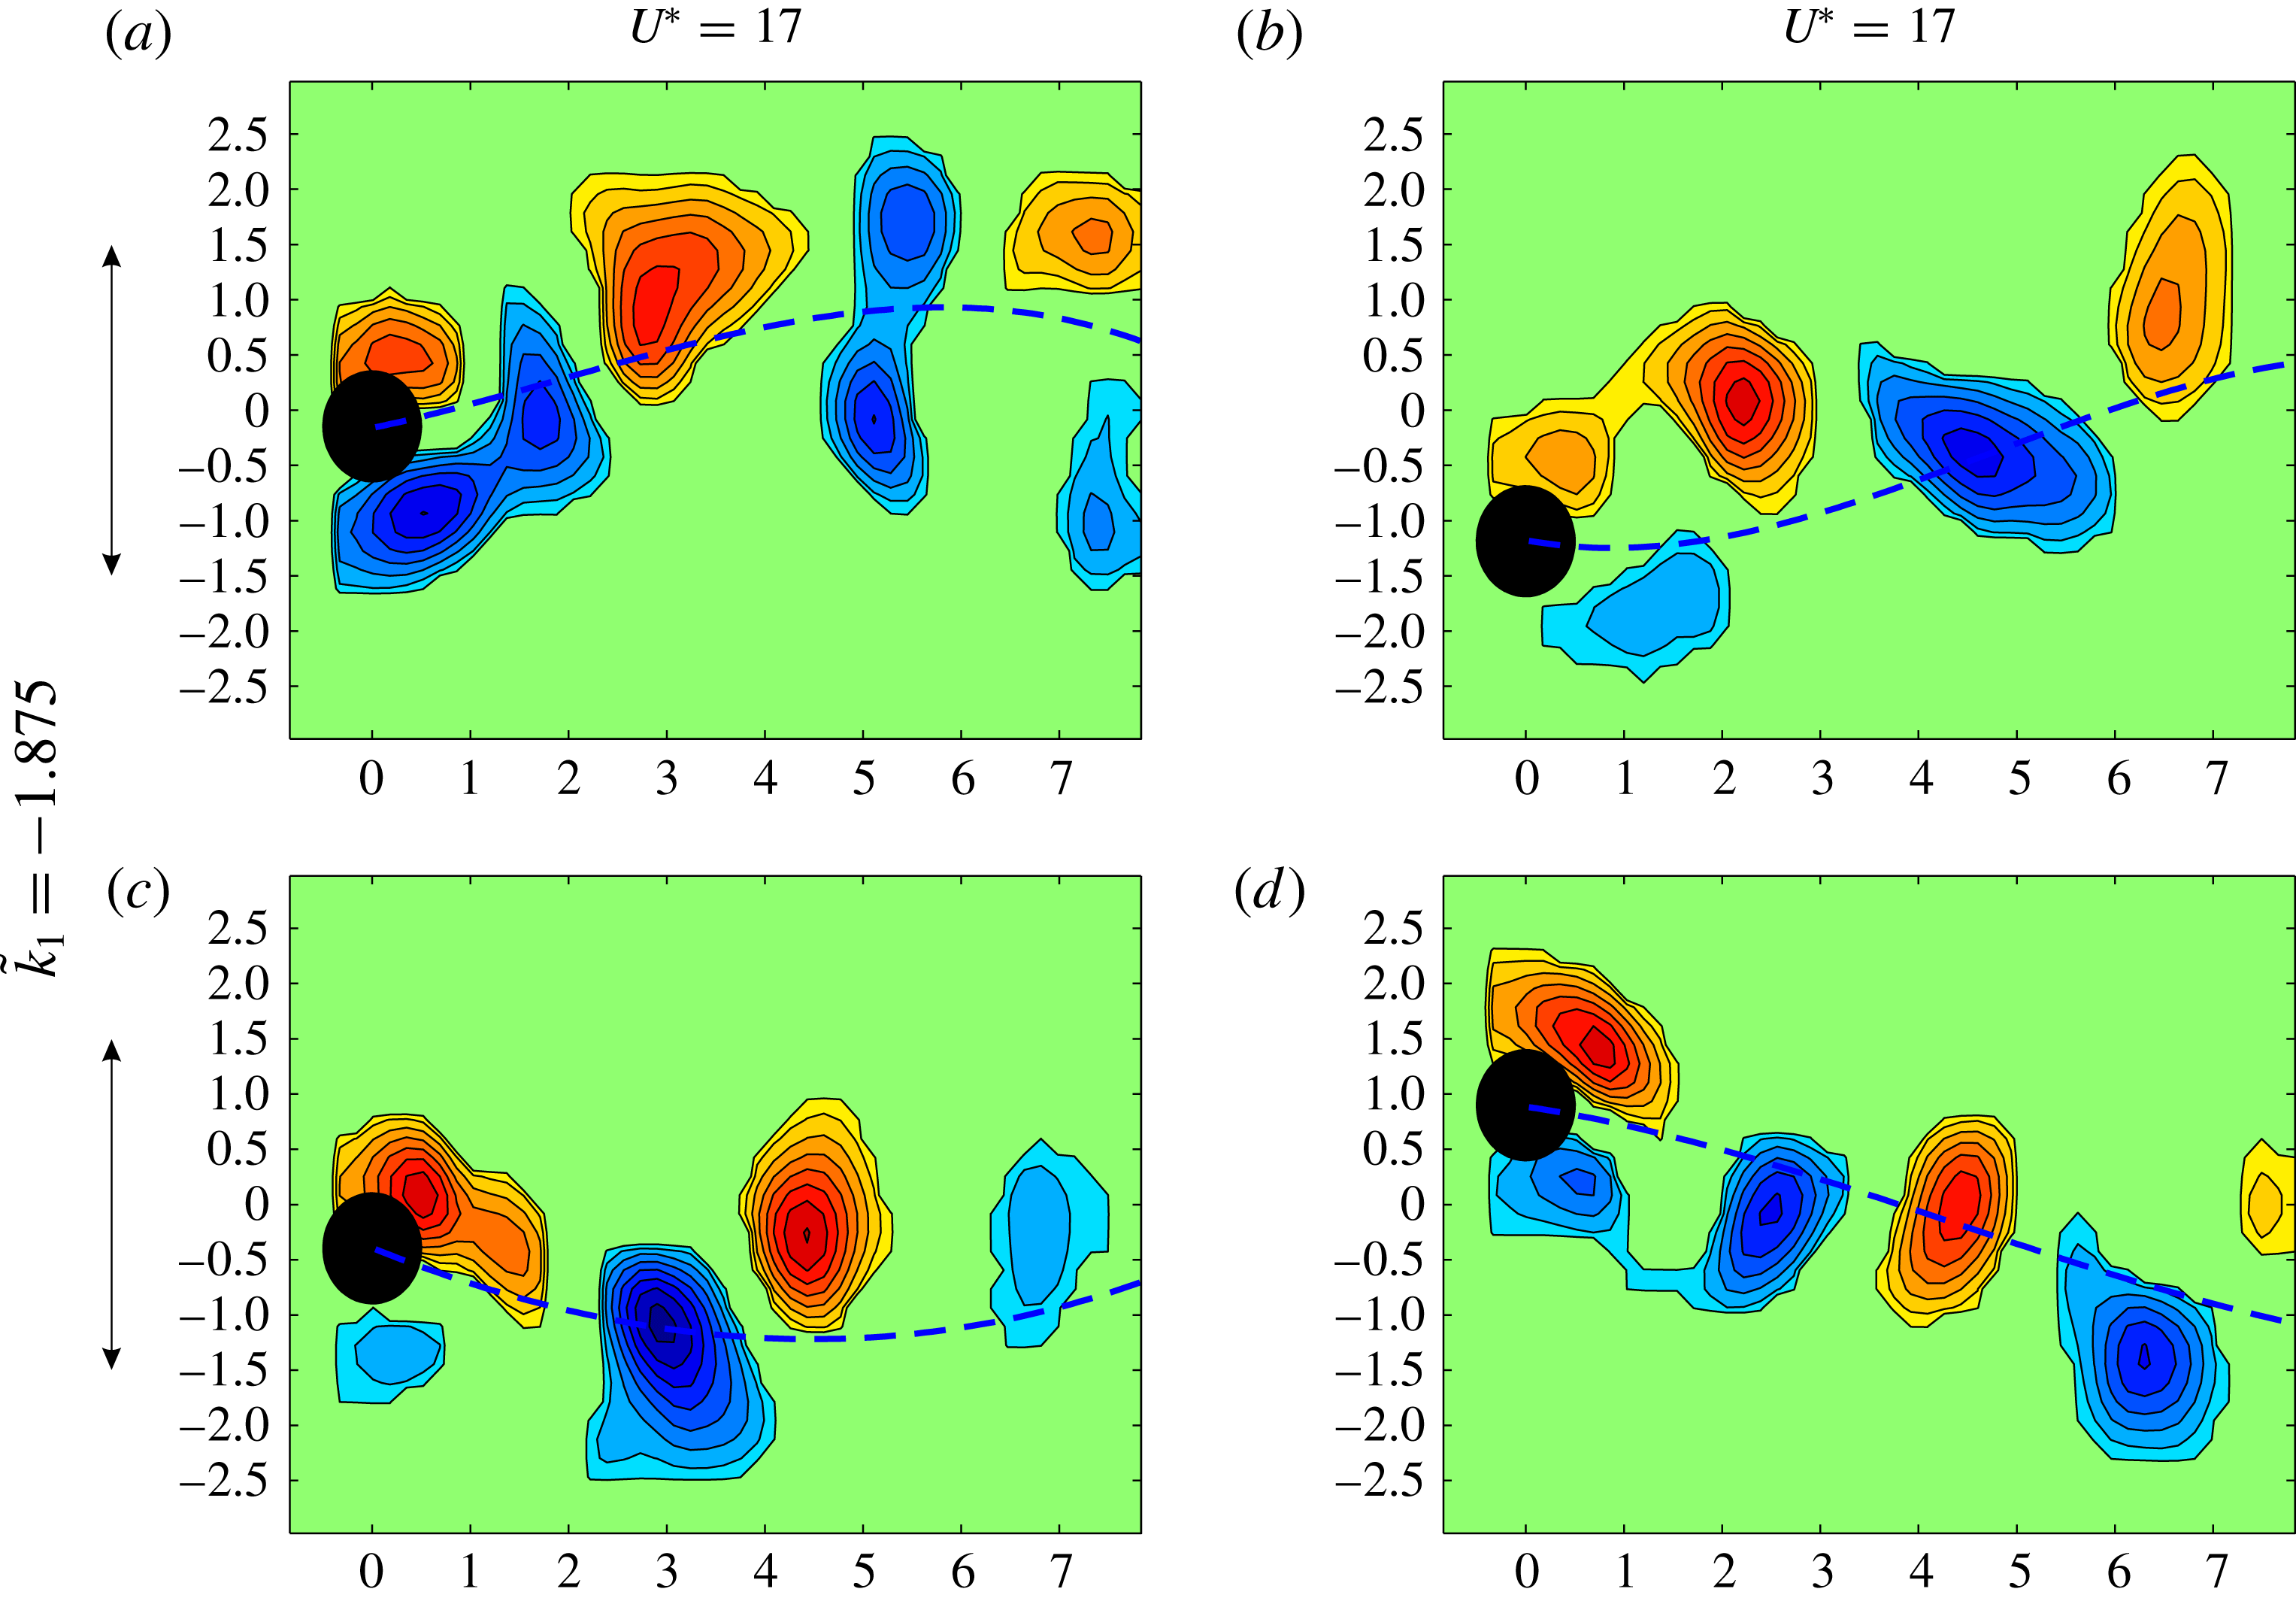
Figure 7. Non-dimensional vorticity
 $\unicode[STIX]{x1D714}D/U$
contours for
$\unicode[STIX]{x1D714}D/U$
contours for
 $U^{\ast }=17$
and
$U^{\ast }=17$
and
 $\tilde{k}_{1}=-1.875$
evaluated at four different displacements of the cylinder. Red indicates clockwise circulation and blue indicates anticlockwise circulation. The amplitude of oscillation is indicated by the double-headed arrow.
$\tilde{k}_{1}=-1.875$
evaluated at four different displacements of the cylinder. Red indicates clockwise circulation and blue indicates anticlockwise circulation. The amplitude of oscillation is indicated by the double-headed arrow.
For
 $\tilde{k}_{1}>0$
, the wake structure in the initial branch is equivalent to the case without actuation (2S vortices shed near the centreline). After the transition, near the peak amplitude, the secondary vortex is reduced and even disappears as
$\tilde{k}_{1}>0$
, the wake structure in the initial branch is equivalent to the case without actuation (2S vortices shed near the centreline). After the transition, near the peak amplitude, the secondary vortex is reduced and even disappears as
 $\tilde{k}_{1}$
grows (figure 6
c), thus evolving from a
$\tilde{k}_{1}$
grows (figure 6
c), thus evolving from a
 $2\text{P}_{0}$
mode to a 2S mode of vortex shedding (as
$2\text{P}_{0}$
mode to a 2S mode of vortex shedding (as
 $\tilde{k}_{1}$
is increased) where two single vortices are shed per cycle at the outer part of the oscillation’s cycle (near its maximum amplitude). Also, the main vortex reduces its intensity compared to the case without actuation. This phenomenon probably occurs because the cylinder rotates in the opposite direction to the vortex being shed, therefore reducing the intensity of the circulation of the vortex shed, which contributes to a reduction of the amplitude of oscillation. As will be seen in the next subsection (§ 3.1.3), from a quasi-steady point of view, the lift coefficient depends on the rate of rotation, and positive values of
$\tilde{k}_{1}$
is increased) where two single vortices are shed per cycle at the outer part of the oscillation’s cycle (near its maximum amplitude). Also, the main vortex reduces its intensity compared to the case without actuation. This phenomenon probably occurs because the cylinder rotates in the opposite direction to the vortex being shed, therefore reducing the intensity of the circulation of the vortex shed, which contributes to a reduction of the amplitude of oscillation. As will be seen in the next subsection (§ 3.1.3), from a quasi-steady point of view, the lift coefficient depends on the rate of rotation, and positive values of
 $\tilde{k}_{1}$
lead to a lift coefficient opposite to the velocity of displacement, thus contributing to a reduction of the amplitude of oscillation expected. Finally, as
$\tilde{k}_{1}$
lead to a lift coefficient opposite to the velocity of displacement, thus contributing to a reduction of the amplitude of oscillation expected. Finally, as
 $U^{\ast }$
grows, the upper and lower branches are no longer distinguishable and desynchronization is anticipated (figure 6
d).
$U^{\ast }$
grows, the upper and lower branches are no longer distinguishable and desynchronization is anticipated (figure 6
d).
For
 $\tilde{k}_{1}<0$
, the transition between the initial and upper branch is delayed; thus figure 6(e,g) shows a 2S vortex emission mode at the centreline, as these contours still represent the wake structure of the initial branch. As
$\tilde{k}_{1}<0$
, the transition between the initial and upper branch is delayed; thus figure 6(e,g) shows a 2S vortex emission mode at the centreline, as these contours still represent the wake structure of the initial branch. As
 $U^{\ast }$
increases, after the transition, a
$U^{\ast }$
increases, after the transition, a
 $2\text{P}_{0}$
mode is obtained (or 2P mode). The vortices shed increase in strength (compared to
$2\text{P}_{0}$
mode is obtained (or 2P mode). The vortices shed increase in strength (compared to
 $\tilde{k}_{1}=0$
) as
$\tilde{k}_{1}=0$
) as
 $\tilde{k}_{1}$
becomes more negative, because the rotation of the cylinder is in the same direction as that of the vortices being shed, thus increasing the circulation of such vortices (figure 6
f,h). The vorticity flux from the surface of the cylinder to the flow is
$\tilde{k}_{1}$
becomes more negative, because the rotation of the cylinder is in the same direction as that of the vortices being shed, thus increasing the circulation of such vortices (figure 6
f,h). The vorticity flux from the surface of the cylinder to the flow is
 $\unicode[STIX]{x1D6E4}_{s}=-\unicode[STIX]{x03C0}Du_{w}$
, where
$\unicode[STIX]{x1D6E4}_{s}=-\unicode[STIX]{x03C0}Du_{w}$
, where
 $u_{w}$
is the circumferential cylinder speed. For this rotating law,
$u_{w}$
is the circumferential cylinder speed. For this rotating law,
 $u_{w}=Dk_{1}{\dot{y}}/2$
and therefore
$u_{w}=Dk_{1}{\dot{y}}/2$
and therefore
 $\unicode[STIX]{x1D6E4}_{s}=-\unicode[STIX]{x03C0}D^{2}k_{1}{\dot{y}}/2$
, which suggests that vorticity emission from the cylinder’s surface contributes to increasing the circulation of the shed vortex when
$\unicode[STIX]{x1D6E4}_{s}=-\unicode[STIX]{x03C0}D^{2}k_{1}{\dot{y}}/2$
, which suggests that vorticity emission from the cylinder’s surface contributes to increasing the circulation of the shed vortex when
 $k_{1}$
is negative. This contributes to the enhancement of the amplitude of oscillation. Noticeably, the vortices are shed at the outer part of the oscillation’s cycle; thus, it seems that the rotation of the cylinder (for the range of
$k_{1}$
is negative. This contributes to the enhancement of the amplitude of oscillation. Noticeably, the vortices are shed at the outer part of the oscillation’s cycle; thus, it seems that the rotation of the cylinder (for the range of
 $\tilde{k}_{1}$
investigated) does not modify the phase at which such vortical structures are emitted.
$\tilde{k}_{1}$
investigated) does not modify the phase at which such vortical structures are emitted.
The increase in amplitude is also related to the lift coefficient that appears due to the rotation of the cylinder (from a quasi-steady point of view) in the direction of the velocity of displacement, thus contributing to the enhancement of the oscillations for negative values of
 $\tilde{k}_{1}$
.
$\tilde{k}_{1}$
.
Furthermore, a case for
 $U^{\ast }=17$
and
$U^{\ast }=17$
and
 $\tilde{k}_{1}=-1.875$
is analysed to observe the mechanism underlying oscillations for large negative values of
$\tilde{k}_{1}=-1.875$
is analysed to observe the mechanism underlying oscillations for large negative values of
 $\tilde{k}_{1}$
and large
$\tilde{k}_{1}$
and large
 $U^{\ast }$
. In figure 7, four different time snapshots are presented, and overprinted in a blue dashed line is the past trajectory of the cylinder. As can be observed, the picture is very different from the previous ones where there was synchronization between vortex emission and oscillation of the cylinder. In this case, the vortices are shed independently of the cylinder’s oscillation at its own frequency and thus the wake pattern resembles that of a wave as each vortex is shed independently at different points of the cycle of oscillation. In particular, the normalized vortex emission frequency is
$U^{\ast }$
. In figure 7, four different time snapshots are presented, and overprinted in a blue dashed line is the past trajectory of the cylinder. As can be observed, the picture is very different from the previous ones where there was synchronization between vortex emission and oscillation of the cylinder. In this case, the vortices are shed independently of the cylinder’s oscillation at its own frequency and thus the wake pattern resembles that of a wave as each vortex is shed independently at different points of the cycle of oscillation. In particular, the normalized vortex emission frequency is
 $f_{v}^{\ast }=f_{v}/f_{N}=3.44$
, which compares reasonably well to that of the Strouhal value of vortex emission for a cylinder at rest (
$f_{v}^{\ast }=f_{v}/f_{N}=3.44$
, which compares reasonably well to that of the Strouhal value of vortex emission for a cylinder at rest (
 $St=0.21$
), which yields
$St=0.21$
), which yields
 $f_{vrest}^{\ast }=3.57$
(
$f_{vrest}^{\ast }=3.57$
(
 $=StU^{\ast }$
). Thus, for large values of negative
$=StU^{\ast }$
). Thus, for large values of negative
 $\tilde{k}_{1}$
and reduced velocity, there is no synchronization between vortex emission and oscillation, and the amplitude response tends to a linear dependence with
$\tilde{k}_{1}$
and reduced velocity, there is no synchronization between vortex emission and oscillation, and the amplitude response tends to a linear dependence with
 $U^{\ast }$
resembling a galloping-type oscillation.
$U^{\ast }$
resembling a galloping-type oscillation.
3.1.3 Quasi-steady model for galloping-type response
As observed in the previous subsection, there is a clear separation in the dynamical behaviour between the cases for
 $\tilde{k}_{1}>-1.8$
and those where
$\tilde{k}_{1}>-1.8$
and those where
 $\tilde{k}_{1}<-1.8$
. In the latter case, from a certain value of the reduced velocity, the amplitude of oscillation increases linearly with the reduced velocity, leading one to assume that some kind of galloping-type phenomenon is happening. Also, the frequency of vortex emission for large
$\tilde{k}_{1}<-1.8$
. In the latter case, from a certain value of the reduced velocity, the amplitude of oscillation increases linearly with the reduced velocity, leading one to assume that some kind of galloping-type phenomenon is happening. Also, the frequency of vortex emission for large
 $U^{\ast }$
follows the Strouhal law, therefore increasing linearly with
$U^{\ast }$
follows the Strouhal law, therefore increasing linearly with
 $U^{\ast }$
, whereas the frequency of oscillation is locked at
$U^{\ast }$
, whereas the frequency of oscillation is locked at
 $f^{\ast }\approx 1$
. A quasi-steady model is proposed here to explain the observed behaviour, to determine for which values of
$f^{\ast }\approx 1$
. A quasi-steady model is proposed here to explain the observed behaviour, to determine for which values of
 $\tilde{k}_{1}$
a galloping-type behaviour is expected to hold, and to see the capability of the model to predict the cylinder’s dynamics by comparing the amplitude of oscillation given by the quasi-steady model with experimental results.
$\tilde{k}_{1}$
a galloping-type behaviour is expected to hold, and to see the capability of the model to predict the cylinder’s dynamics by comparing the amplitude of oscillation given by the quasi-steady model with experimental results.
For the quasi-steady analysis, it is assumed that the instantaneous transverse force can be obtained from the steady lift and drag force with an equivalent instantaneous velocity and angle of attack
 $\unicode[STIX]{x1D6FC}_{F}$
(Blevins Reference Blevins1990). In figure 8(a) a scheme of the equivalent configuration is shown.
$\unicode[STIX]{x1D6FC}_{F}$
(Blevins Reference Blevins1990). In figure 8(a) a scheme of the equivalent configuration is shown.
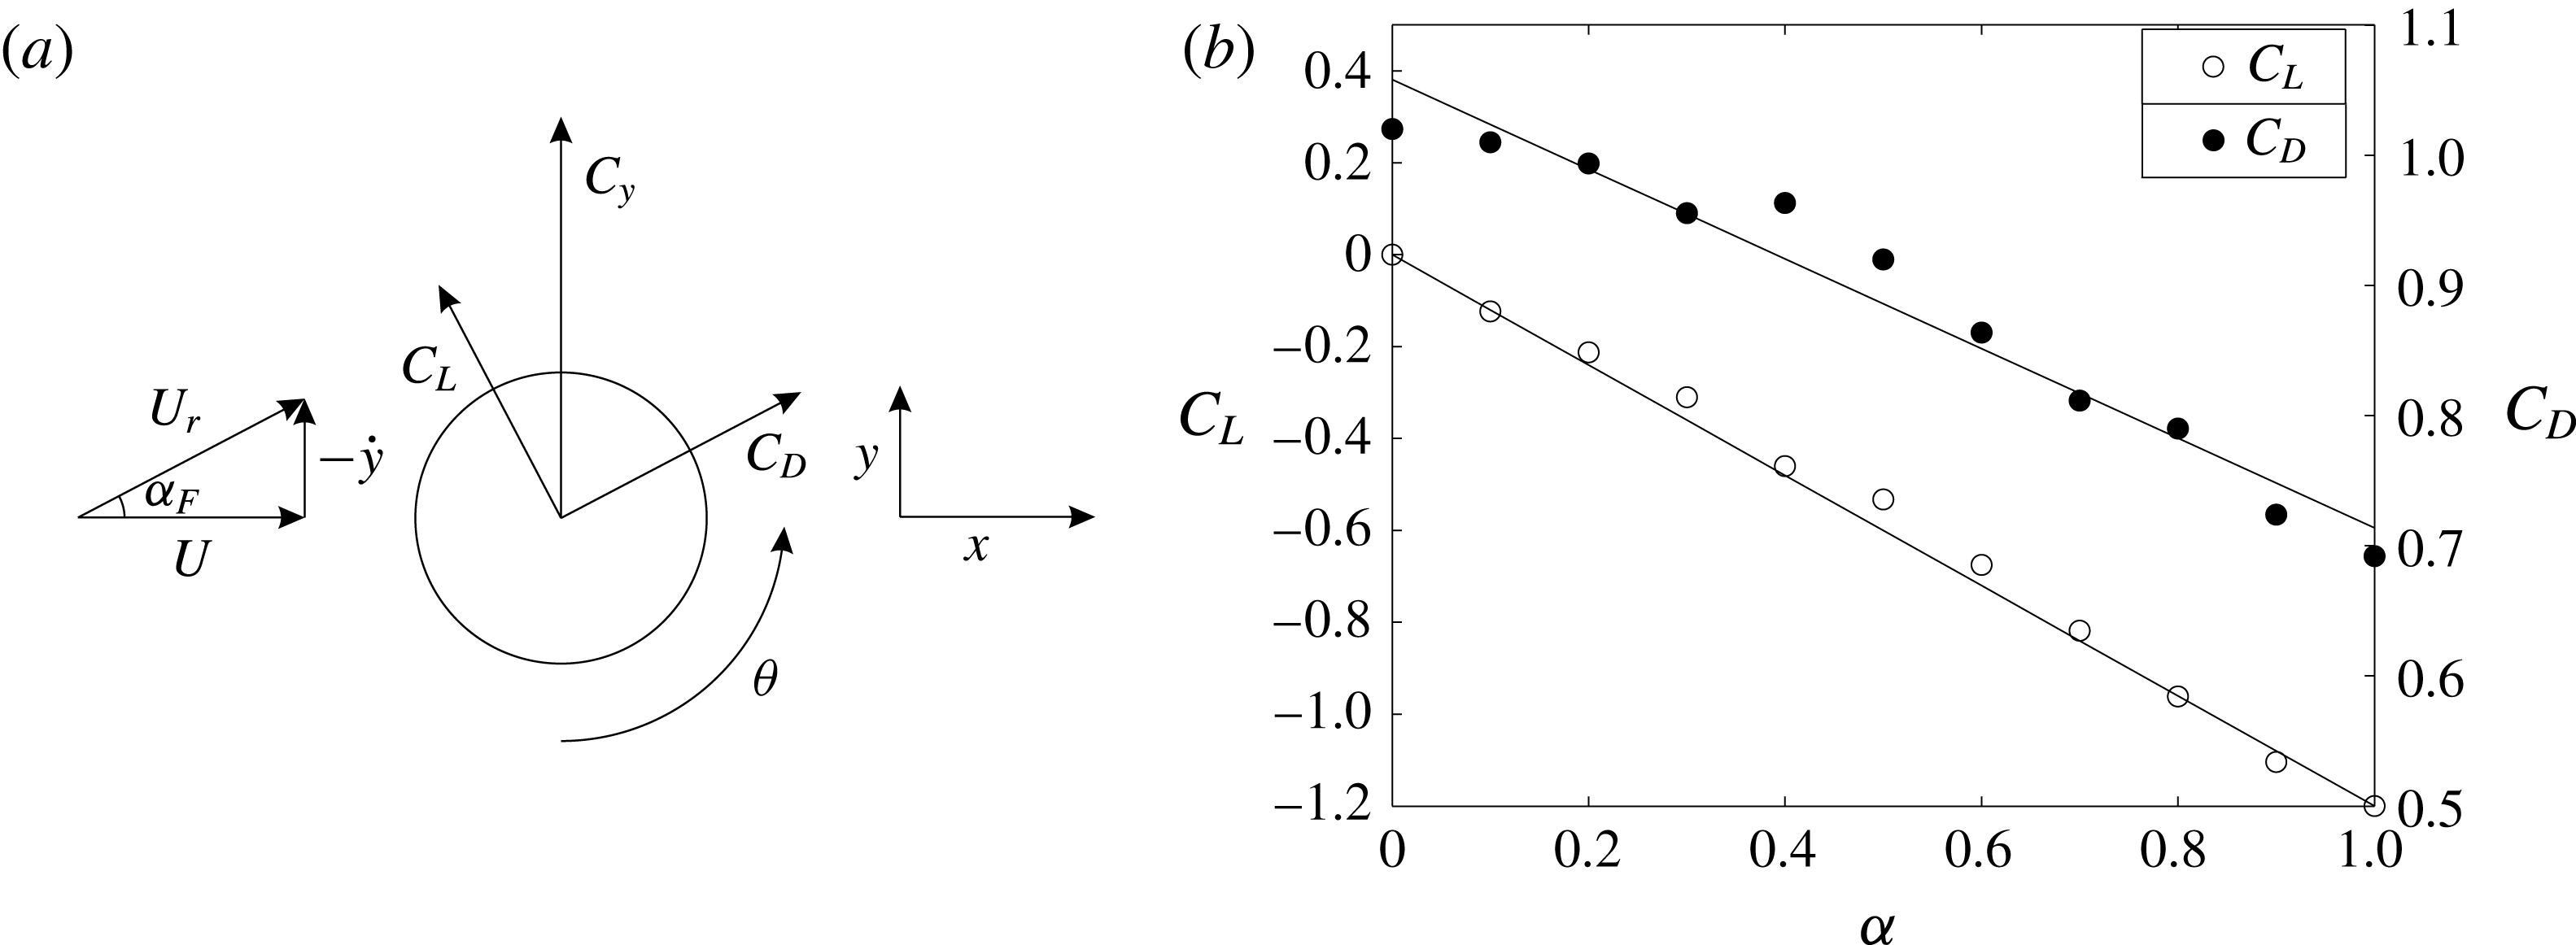
Figure 8. (a) Schematics of the forces acting on the cylinder in a quasi-steady situation. (b) Average transverse force coefficient and average in-line force coefficient as a function of the dimensionless rotation rate
 $\unicode[STIX]{x1D6FC}$
. Experiments to determine
$\unicode[STIX]{x1D6FC}$
. Experiments to determine
 $C_{L}$
and
$C_{L}$
and
 $C_{D}$
have been carried out at
$C_{D}$
have been carried out at
 $Re\approx 9000$
, which corresponds to
$Re\approx 9000$
, which corresponds to
 $U^{\ast }=15$
for the current set-up. Dashed lines represent the linear best fits.
$U^{\ast }=15$
for the current set-up. Dashed lines represent the linear best fits.
Taking into account the lift and drag force coefficients and projecting onto the transverse (cross-flow) direction, one has
 $$\begin{eqnarray}C_{y}=\frac{U_{r}}{U}(-C_{L}\cos (\unicode[STIX]{x1D6FC}_{F})-C_{D}\sin (\unicode[STIX]{x1D6FC}_{F}))=-\frac{C_{L}}{\cos (\unicode[STIX]{x1D6FC}_{F})}-C_{D}\frac{\tan (\unicode[STIX]{x1D6FC}_{F})}{\cos (\unicode[STIX]{x1D6FC}_{F})},\end{eqnarray}$$
where
 $\unicode[STIX]{x1D6FC}_{F}$
is the instantaneous angle of attack,
$\unicode[STIX]{x1D6FC}_{F}$
is the instantaneous angle of attack,
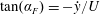 $\tan (\unicode[STIX]{x1D6FC}_{F})=-{\dot{y}}/U$
,
$\tan (\unicode[STIX]{x1D6FC}_{F})=-{\dot{y}}/U$
,
 $\cos (\unicode[STIX]{x1D6FC}_{F})=U/U_{r}$
,
$\cos (\unicode[STIX]{x1D6FC}_{F})=U/U_{r}$
,
 $U_{r}$
is the relative incident flow speed (
$U_{r}$
is the relative incident flow speed (
 $U_{r}=\sqrt{U^{2}+{\dot{y}}^{2}}$
), and
$U_{r}=\sqrt{U^{2}+{\dot{y}}^{2}}$
), and
 $C_{L}$
and
$C_{L}$
and
 $C_{D}$
are, respectively, the lift and drag time-averaged fluid force coefficients, which can be obtained from the ‘static’ configuration as a function of the dimensionless rotation rate. Figure 8(b) shows the lift and drag coefficient variations with the dimensionless rotation rate obtained from experiments carried out in a water channel where the rotation rate was fixed at different values and fluid forces were measured using a force sensor. Assuming, as a first approximation, a linear variation with the rotation rate of
$C_{D}$
are, respectively, the lift and drag time-averaged fluid force coefficients, which can be obtained from the ‘static’ configuration as a function of the dimensionless rotation rate. Figure 8(b) shows the lift and drag coefficient variations with the dimensionless rotation rate obtained from experiments carried out in a water channel where the rotation rate was fixed at different values and fluid forces were measured using a force sensor. Assuming, as a first approximation, a linear variation with the rotation rate of
 $C_{L}$
and
$C_{L}$
and
 $C_{D}$
, one has
$C_{D}$
, one has
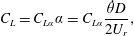 $$\begin{eqnarray}\displaystyle & \displaystyle C_{L}=C_{L\unicode[STIX]{x1D6FC}}\unicode[STIX]{x1D6FC}=C_{L\unicode[STIX]{x1D6FC}}\frac{\dot{\unicode[STIX]{x1D703}}D}{2U_{r}}, & \displaystyle\end{eqnarray}$$
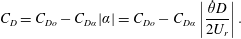 $$\begin{eqnarray}\displaystyle & \displaystyle C_{D}=C_{Do}-C_{D\unicode[STIX]{x1D6FC}}|\unicode[STIX]{x1D6FC}|=C_{Do}-C_{D\unicode[STIX]{x1D6FC}}\left|\frac{\dot{\unicode[STIX]{x1D703}}D}{2U_{r}}\right|. & \displaystyle\end{eqnarray}$$
 $\unicode[STIX]{x1D703}^{\prime }=\tilde{k}_{1}Y^{\prime }$
), (3.3a
) and (3.3b
) can be written in dimensionless form as
$\unicode[STIX]{x1D703}^{\prime }=\tilde{k}_{1}Y^{\prime }$
), (3.3a
) and (3.3b
) can be written in dimensionless form as  $$\begin{eqnarray}\displaystyle & \displaystyle C_{L}=\frac{C_{L\unicode[STIX]{x1D6FC}}}{2}\tilde{k}_{1}\frac{Y^{\prime }}{U_{r}^{\ast }}, & \displaystyle\end{eqnarray}$$
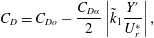 $$\begin{eqnarray}\displaystyle & \displaystyle C_{D}=C_{Do}-\frac{C_{D\unicode[STIX]{x1D6FC}}}{2}\left|\tilde{k}_{1}\frac{Y^{\prime }}{U_{r}^{\ast }}\right|, & \displaystyle\end{eqnarray}$$
 $U_{r}^{\ast }=U_{r}/f_{N}D=U^{\ast }/\cos (\unicode[STIX]{x1D6FC}_{F})$
is the non-dimensional relative incident flow velocity. From figure 8(b), the linear best fit yields
$U_{r}^{\ast }=U_{r}/f_{N}D=U^{\ast }/\cos (\unicode[STIX]{x1D6FC}_{F})$
is the non-dimensional relative incident flow velocity. From figure 8(b), the linear best fit yields
 $C_{L\unicode[STIX]{x1D6FC}}=-1.2$
,
$C_{L\unicode[STIX]{x1D6FC}}=-1.2$
,
 $C_{Do}=1.06$
and
$C_{Do}=1.06$
and
 $C_{D\unicode[STIX]{x1D6FC}}=0.36$
, which are in good agreement when compared to similar experiments and numerical simulations (Mittal & Kumar Reference Mittal and Kumar2003; Karabelas et al.
Reference Karabelas, Koumroglou, Argyropoulos and Markatos2012; Bourguet & Jacono Reference Bourguet and Jacono2014). Introducing (3.4a
) and (3.4b
) into (3.2), and taking into account that
$C_{D\unicode[STIX]{x1D6FC}}=0.36$
, which are in good agreement when compared to similar experiments and numerical simulations (Mittal & Kumar Reference Mittal and Kumar2003; Karabelas et al.
Reference Karabelas, Koumroglou, Argyropoulos and Markatos2012; Bourguet & Jacono Reference Bourguet and Jacono2014). Introducing (3.4a
) and (3.4b
) into (3.2), and taking into account that
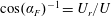 $\cos (\unicode[STIX]{x1D6FC}_{F})^{-1}=U_{r}/U$
, one obtains
$\cos (\unicode[STIX]{x1D6FC}_{F})^{-1}=U_{r}/U$
, one obtains 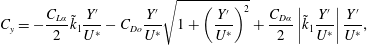 $$\begin{eqnarray}C_{y}=-\frac{C_{L\unicode[STIX]{x1D6FC}}}{2}\tilde{k}_{1}\frac{Y^{\prime }}{U^{\ast }}-C_{Do}\frac{Y^{\prime }}{U^{\ast }}\sqrt{1+\left(\frac{Y^{\prime }}{U^{\ast }}\right)^{2}}+\frac{C_{D\unicode[STIX]{x1D6FC}}}{2}\left|\tilde{k}_{1}\frac{Y^{\prime }}{U^{\ast }}\right|\frac{Y^{\prime }}{U^{\ast }},\end{eqnarray}$$
which is the transverse fluid force coefficient evaluated from a quasi-steady basis. This model for the transverse force coefficient mainly neglects the effect of the vortices shed (note that there is no fluid force without cylinder motion), which is theoretically valid for
 $U^{\ast }$
large enough with respect to
$U^{\ast }$
large enough with respect to
 $St^{-1}$
(Parkinson Reference Parkinson1989). The first term in (3.5) can be seen as a positive linear damping for
$St^{-1}$
(Parkinson Reference Parkinson1989). The first term in (3.5) can be seen as a positive linear damping for
 $\tilde{k}_{1}>0$
, reducing possible amplitude oscillations, or as a linear negative damping term for
$\tilde{k}_{1}>0$
, reducing possible amplitude oscillations, or as a linear negative damping term for
 $\tilde{k}_{1}<0$
, which, on the other hand, contributes to amplifying the amplitude of oscillations. The last two terms are nonlinear damping terms associated with the drag force. Note that there is no stiffness term that could significantly change the frequency of oscillation, thus leading to the result that the frequency of oscillation should coincide with
$\tilde{k}_{1}<0$
, which, on the other hand, contributes to amplifying the amplitude of oscillations. The last two terms are nonlinear damping terms associated with the drag force. Note that there is no stiffness term that could significantly change the frequency of oscillation, thus leading to the result that the frequency of oscillation should coincide with
 $f_{N}$
, that is,
$f_{N}$
, that is,
 $f^{\ast }=1$
(which agrees well with results shown in figure 5(b) for
$f^{\ast }=1$
(which agrees well with results shown in figure 5(b) for
 $\tilde{k}_{1}=-1.875$
and
$\tilde{k}_{1}=-1.875$
and
 $\tilde{k}_{1}=-2.125$
for large reduced velocities).
$\tilde{k}_{1}=-2.125$
for large reduced velocities).
It is of interest to study the theoretical value of
 $\tilde{k}_{1}$
from which the galloping-type response is expected to occur according to the quasi-steady model. To do so, note that (3.5) can be linearized retaining only the linear terms:
$\tilde{k}_{1}$
from which the galloping-type response is expected to occur according to the quasi-steady model. To do so, note that (3.5) can be linearized retaining only the linear terms:
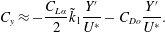 $$\begin{eqnarray}C_{y}\approx -\frac{C_{L\unicode[STIX]{x1D6FC}}}{2}\tilde{k}_{1}\frac{Y^{\prime }}{U^{\ast }}-C_{Do}\frac{Y^{\prime }}{U^{\ast }}.\end{eqnarray}$$
Galloping-type oscillations may occur when the linearized term of the transverse force coefficients yields a positive value only, thus
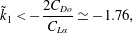 $$\begin{eqnarray}\tilde{k}_{1}<-\frac{2C_{Do}}{C_{L\unicode[STIX]{x1D6FC}}}\simeq -1.76,\end{eqnarray}$$
which compares well with the results found during experimental results, since galloping-type oscillations appeared for
 $\tilde{k}_{1}<-1.8$
. To obtain the amplitude of oscillations, the dynamical equation for the cylinder (2.2a
) along with
$\tilde{k}_{1}<-1.8$
. To obtain the amplitude of oscillations, the dynamical equation for the cylinder (2.2a
) along with
 $C_{y}$
given by (3.5) can be solved analytically by the harmonic balance method such as in Vicente-Ludlam et al. (Reference Vicente-Ludlam, Barrero-Gil and Velazquez2014) and Vicente-Ludlam, Barrero-Gil & Velazquez (Reference Vicente-Ludlam, Barrero-Gil and Velazquez2015, Reference Vicente-Ludlam, Barrero-Gil and Velazquez2017) or numerically with a Runge–Kutta scheme.
$C_{y}$
given by (3.5) can be solved analytically by the harmonic balance method such as in Vicente-Ludlam et al. (Reference Vicente-Ludlam, Barrero-Gil and Velazquez2014) and Vicente-Ludlam, Barrero-Gil & Velazquez (Reference Vicente-Ludlam, Barrero-Gil and Velazquez2015, Reference Vicente-Ludlam, Barrero-Gil and Velazquez2017) or numerically with a Runge–Kutta scheme.
Figure 9. Comparison between quasi-steady solution and the present experimental results for
 $\tilde{k}_{1}=-2.125$
.
$\tilde{k}_{1}=-2.125$
.
Figure 9 assesses the validity of the quasi-steady model proposed with the present experimental results for
 $\tilde{k}_{1}=-2.125$
with good agreement for high enough reduced velocity (say
$\tilde{k}_{1}=-2.125$
with good agreement for high enough reduced velocity (say
 $U^{\ast }>8$
) with errors smaller than 10 %. This reinforces the idea that for large negative values of
$U^{\ast }>8$
) with errors smaller than 10 %. This reinforces the idea that for large negative values of
 $\tilde{k}_{1}$
and enough reduced velocities the cylinder is driven mainly for motion-induced fluid forces, which can be reasonably well described by the quasi-steady hypothesis. However, for
$\tilde{k}_{1}$
and enough reduced velocities the cylinder is driven mainly for motion-induced fluid forces, which can be reasonably well described by the quasi-steady hypothesis. However, for
 $\tilde{k}_{1}=-1.875$
the quasi-steady model fails to predict the amplitude of oscillations of the experimental data since, after an initial linear trend with
$\tilde{k}_{1}=-1.875$
the quasi-steady model fails to predict the amplitude of oscillations of the experimental data since, after an initial linear trend with
 $U^{\ast }$
, the amplitude of oscillations keeps a nearly constant value until these cease at
$U^{\ast }$
, the amplitude of oscillations keeps a nearly constant value until these cease at
 $U^{\ast }=20$
. This could be caused by the low value of the linear part of the transverse force from (3.5) at this value of
$U^{\ast }=20$
. This could be caused by the low value of the linear part of the transverse force from (3.5) at this value of
 $\tilde{k}_{1}$
, which is very close to the minimum theoretically predicted by the quasi-steady model, making other phenomena not taken into account in the quasi-steady model overcome the galloping-type oscillations.
$\tilde{k}_{1}$
, which is very close to the minimum theoretically predicted by the quasi-steady model, making other phenomena not taken into account in the quasi-steady model overcome the galloping-type oscillations.
3.2 Rotation proportional to the cylinder’s velocity (
 $\unicode[STIX]{x1D703}=\tilde{k}_{2}Y^{\prime }$
)
$\unicode[STIX]{x1D703}=\tilde{k}_{2}Y^{\prime }$
)

Another strategy that has been studied is to modify the response of a circular cylinder undergoing VIV by rotating the cylinder proportionally to its own transverse velocity. Results including amplitude and frequency of oscillation and non-dimensional vorticity contours are presented here. In what follows, the cylinder is rotated according to the feedback equation
 $$\begin{eqnarray}\unicode[STIX]{x1D703}=\tilde{k}_{2}Y^{\prime },\end{eqnarray}$$
where
 $\tilde{k}_{2}$
is a non-dimensional feedback constant. The cylinder’s response is presented in § 3.2.1 and the different wake patterns in certain configurations are examined in § 3.2.2.
$\tilde{k}_{2}$
is a non-dimensional feedback constant. The cylinder’s response is presented in § 3.2.1 and the different wake patterns in certain configurations are examined in § 3.2.2.
3.2.1 Cylinder dynamics
Figure 10. Maximum non-dimensional amplitude oscillation as a function of the reduced velocity for (a) positive values and (b) negative values of the rotating parameter
 $\tilde{k}_{2}$
.
$\tilde{k}_{2}$
.
In figure 10, the amplitude of oscillation of the cylinder is plotted as a function of the reduced velocity for different values of
 $\tilde{k}_{2}$
. For
$\tilde{k}_{2}$
. For
 $\tilde{k}_{2}>0$
the response is greatly attenuated with respect to the curve without actuation (figure 10
a, see curve
$\tilde{k}_{2}>0$
the response is greatly attenuated with respect to the curve without actuation (figure 10
a, see curve
 $\tilde{k}_{2}=0$
). With
$\tilde{k}_{2}=0$
). With
 $\tilde{k}_{2}=1.25$
, the peak amplitude is
$\tilde{k}_{2}=1.25$
, the peak amplitude is
 $A^{\ast }\approx 0.22$
whereas when rotating proportionally to the cylinder’s displacement, for
$A^{\ast }\approx 0.22$
whereas when rotating proportionally to the cylinder’s displacement, for
 $\tilde{k}_{1}=2.5$
(which approximately leads to twice the level of rotation for a prescribed amplitude of oscillation) the maximum oscillation does not exceed
$\tilde{k}_{1}=2.5$
(which approximately leads to twice the level of rotation for a prescribed amplitude of oscillation) the maximum oscillation does not exceed
 $A^{\ast }=0.5$
(as was shown in figure 4
a). Thus rotating the cylinder proportionally to its velocity of oscillation is considerably more efficient in terms of attenuating the amplitude of oscillation with less actuation. On the other hand, negative values of
$A^{\ast }=0.5$
(as was shown in figure 4
a). Thus rotating the cylinder proportionally to its velocity of oscillation is considerably more efficient in terms of attenuating the amplitude of oscillation with less actuation. On the other hand, negative values of
 $\tilde{k}_{2}$
lead to an increase of the amplitude of oscillation as well as an increase of the synchronization region undergoing large-amplitude oscillations. However, as can be seen in figure 10(b), further decreasing
$\tilde{k}_{2}$
lead to an increase of the amplitude of oscillation as well as an increase of the synchronization region undergoing large-amplitude oscillations. However, as can be seen in figure 10(b), further decreasing
 $\tilde{k}_{2}$
does not modify the type of response obtained, namely, no galloping-type oscillations have been found. This result can be explained through the quasi-steady model, which gives the following transverse fluid force coefficient:
$\tilde{k}_{2}$
does not modify the type of response obtained, namely, no galloping-type oscillations have been found. This result can be explained through the quasi-steady model, which gives the following transverse fluid force coefficient:
 $$\begin{eqnarray}C_{y}=-\frac{C_{L\unicode[STIX]{x1D6FC}}}{2}\tilde{k}_{2}\frac{Y^{\prime \prime }}{U^{\ast }}-C_{Do}\frac{Y^{\prime }}{U^{\ast }}\sqrt{1+\left(\frac{Y^{\prime }}{U^{\ast }}\right)^{2}}+\frac{C_{D\unicode[STIX]{x1D6FC}}}{2}\left|\tilde{k}_{2}\frac{Y^{\prime \prime }}{U^{\ast }}\right|\frac{Y^{\prime }}{U^{\ast }}.\end{eqnarray}$$
This equation is obtained in the same way as (3.5), but taking into account that rotation is now proportional to the velocity of oscillation. From (3.9) note that it is not possible to introduce negative damping that can overcome the damping introduced by the drag coefficient. Thus, the increase of the amplitude of oscillations has to be explained by the modification of the structure of the near wake (namely, intensity of vortices shed). The transition between the initial and upper branch is not as pronounced as it is for the case without actuation (or when rotating the cylinder proportionally to its position), and the reduced velocity at which the transition occurs is not modified by
 $\tilde{k}_{2}$
. Also, the distinction between the upper and lower branches is lost as actuation (either positive or negative) is increased.
$\tilde{k}_{2}$
. Also, the distinction between the upper and lower branches is lost as actuation (either positive or negative) is increased.
Finally, with regard to the frequency of oscillation (figure 11),
 $\tilde{k}_{2}$
does not modify
$\tilde{k}_{2}$
does not modify
 $f^{\ast }$
significantly. The value of the non-dimensional frequency of oscillation nearly fits into a single curve for all values of
$f^{\ast }$
significantly. The value of the non-dimensional frequency of oscillation nearly fits into a single curve for all values of
 $\tilde{k}_{2}$
, thus explaining why the initial–upper branch transition occurs at similar reduced velocity as the frequency of oscillation reaches
$\tilde{k}_{2}$
, thus explaining why the initial–upper branch transition occurs at similar reduced velocity as the frequency of oscillation reaches
 $f^{\ast }=1$
at nearly the same reduced velocity. Negative values of
$f^{\ast }=1$
at nearly the same reduced velocity. Negative values of
 $\tilde{k}_{2}$
(figure 11
b) increase the region of synchronization; therefore, the frequency of oscillation keeps growing with the same slope until desynchronization occurs (for larger
$\tilde{k}_{2}$
(figure 11
b) increase the region of synchronization; therefore, the frequency of oscillation keeps growing with the same slope until desynchronization occurs (for larger
 $U^{\ast }$
as
$U^{\ast }$
as
 $\tilde{k}_{2}$
becomes more negative).
$\tilde{k}_{2}$
becomes more negative).
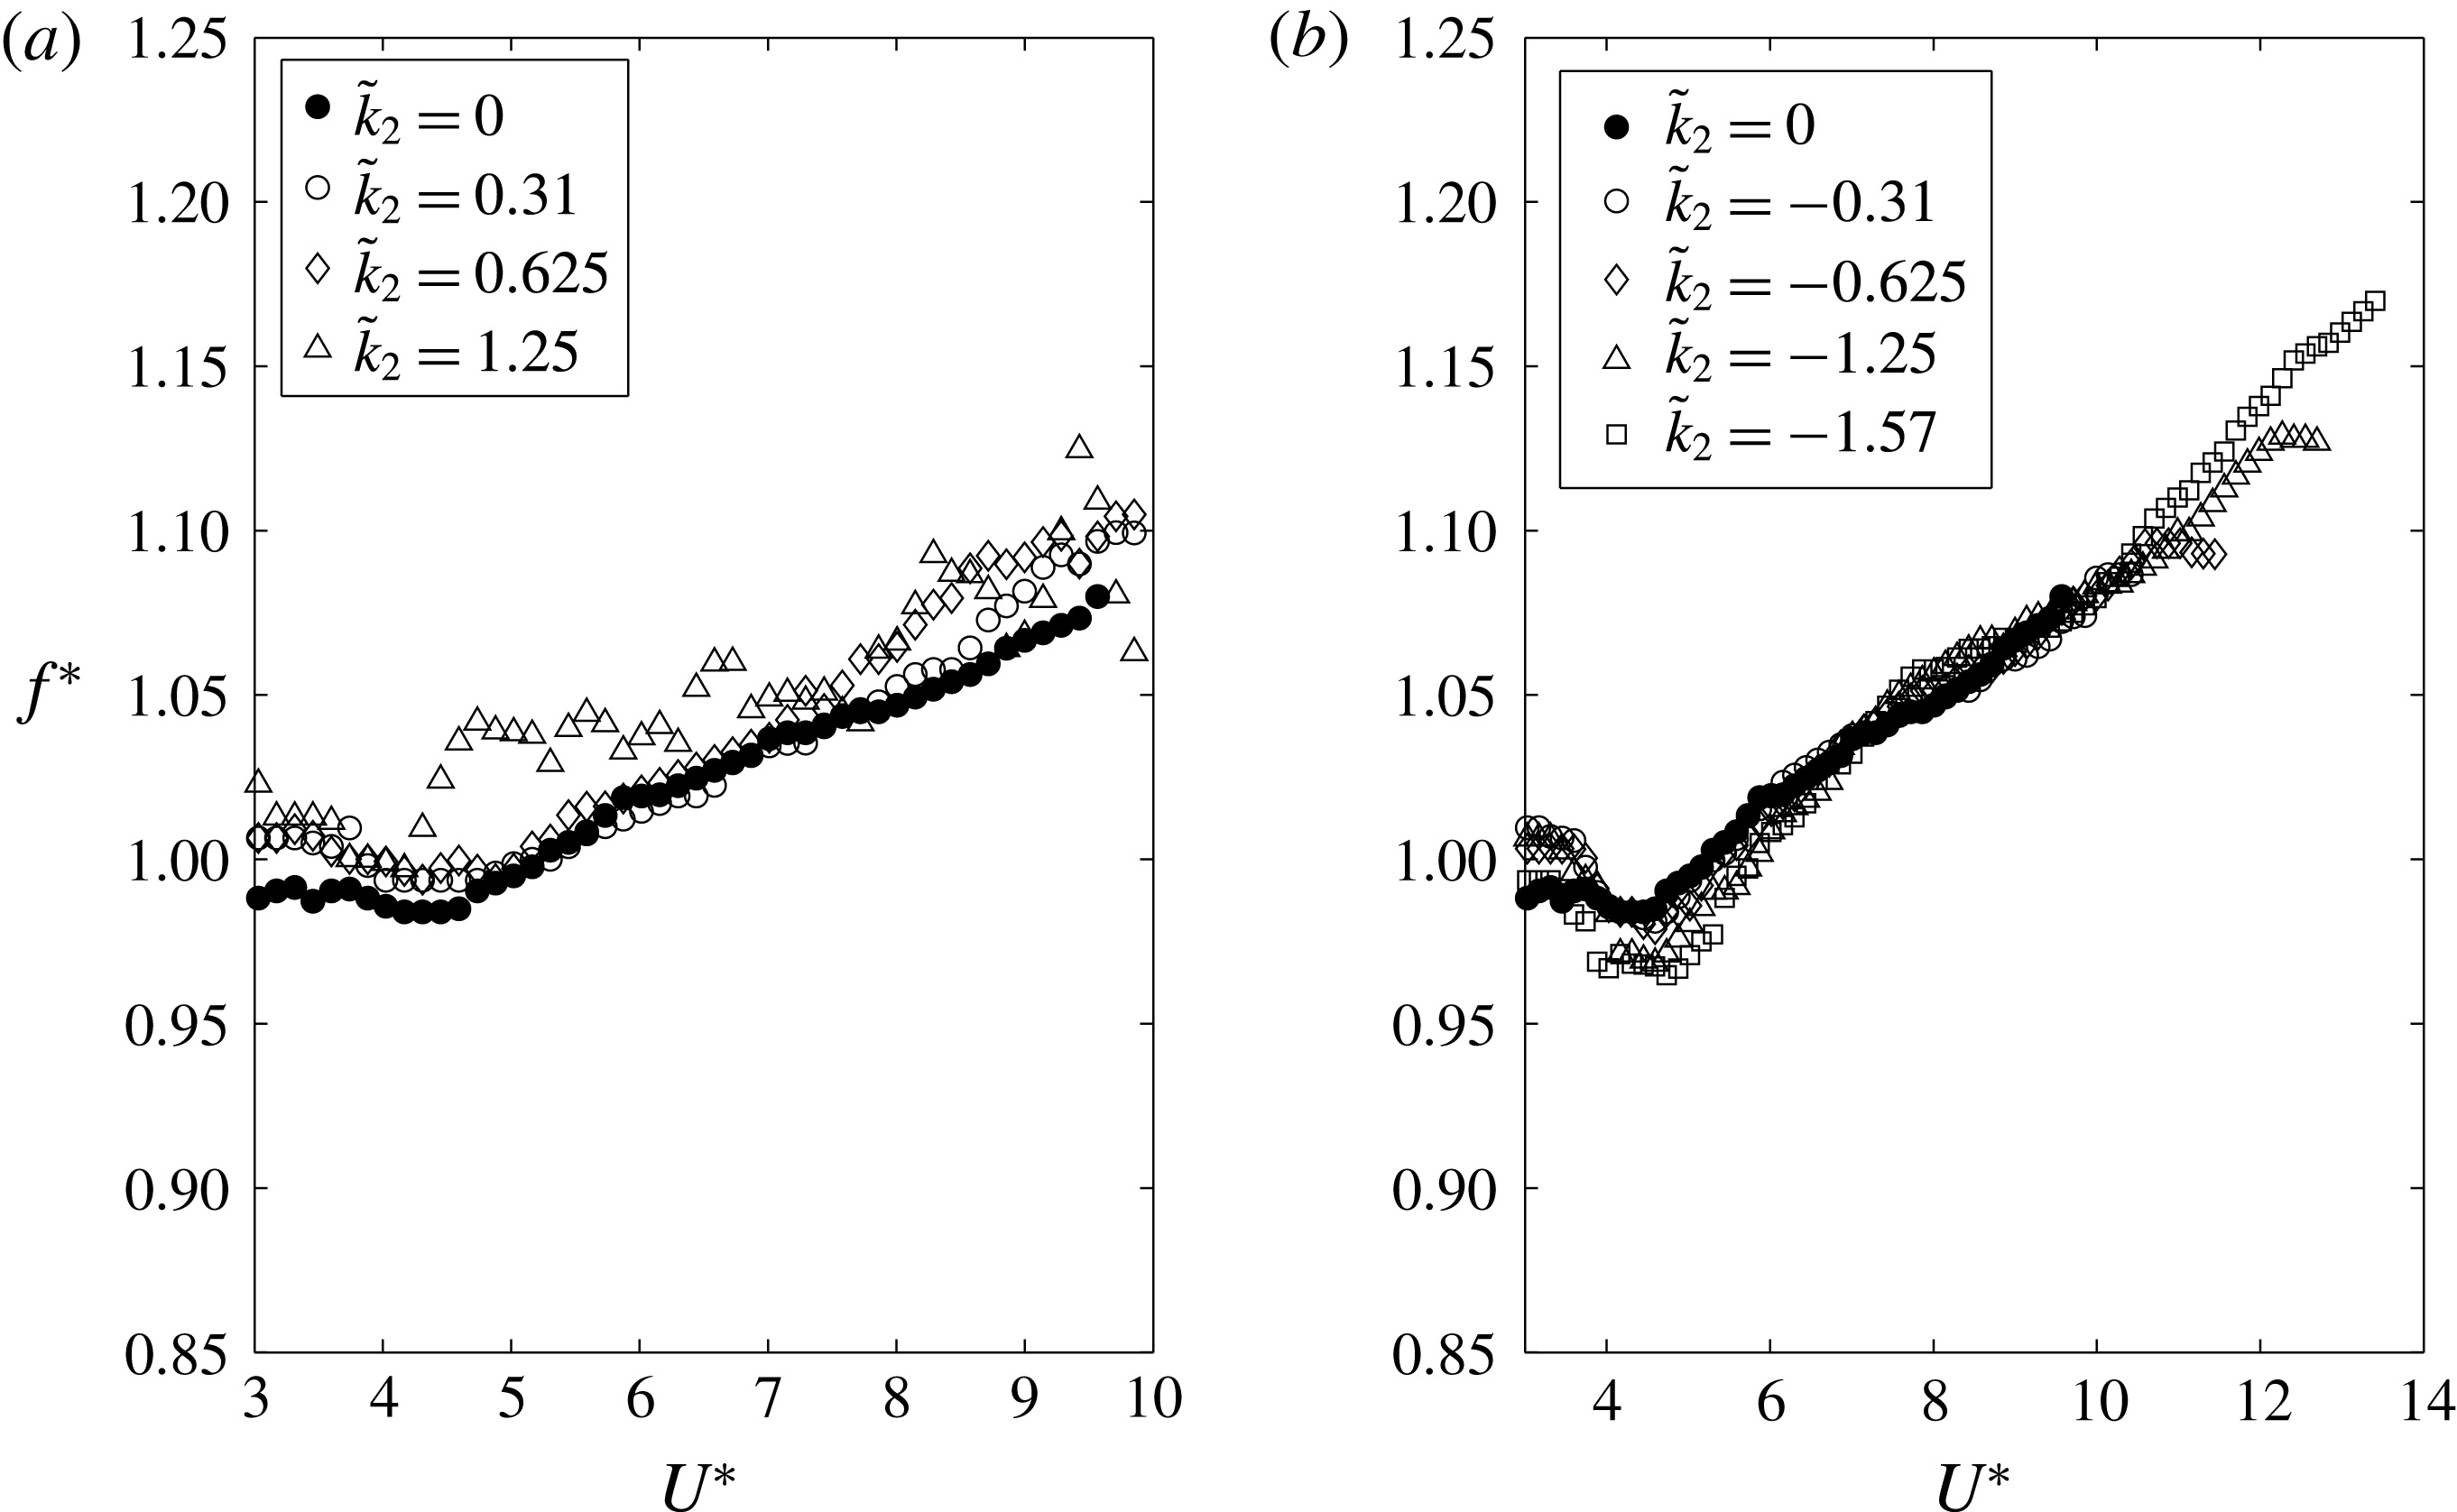
Figure 11. Non-dimensional oscillating frequency of the cylinder as a function of the reduced velocity for (a) positive values and (b) negative values of the rotating parameter
 $\tilde{k}_{2}$
.
$\tilde{k}_{2}$
.
3.2.2 PIV of the near wake for rotation proportional to the velocity of displacement
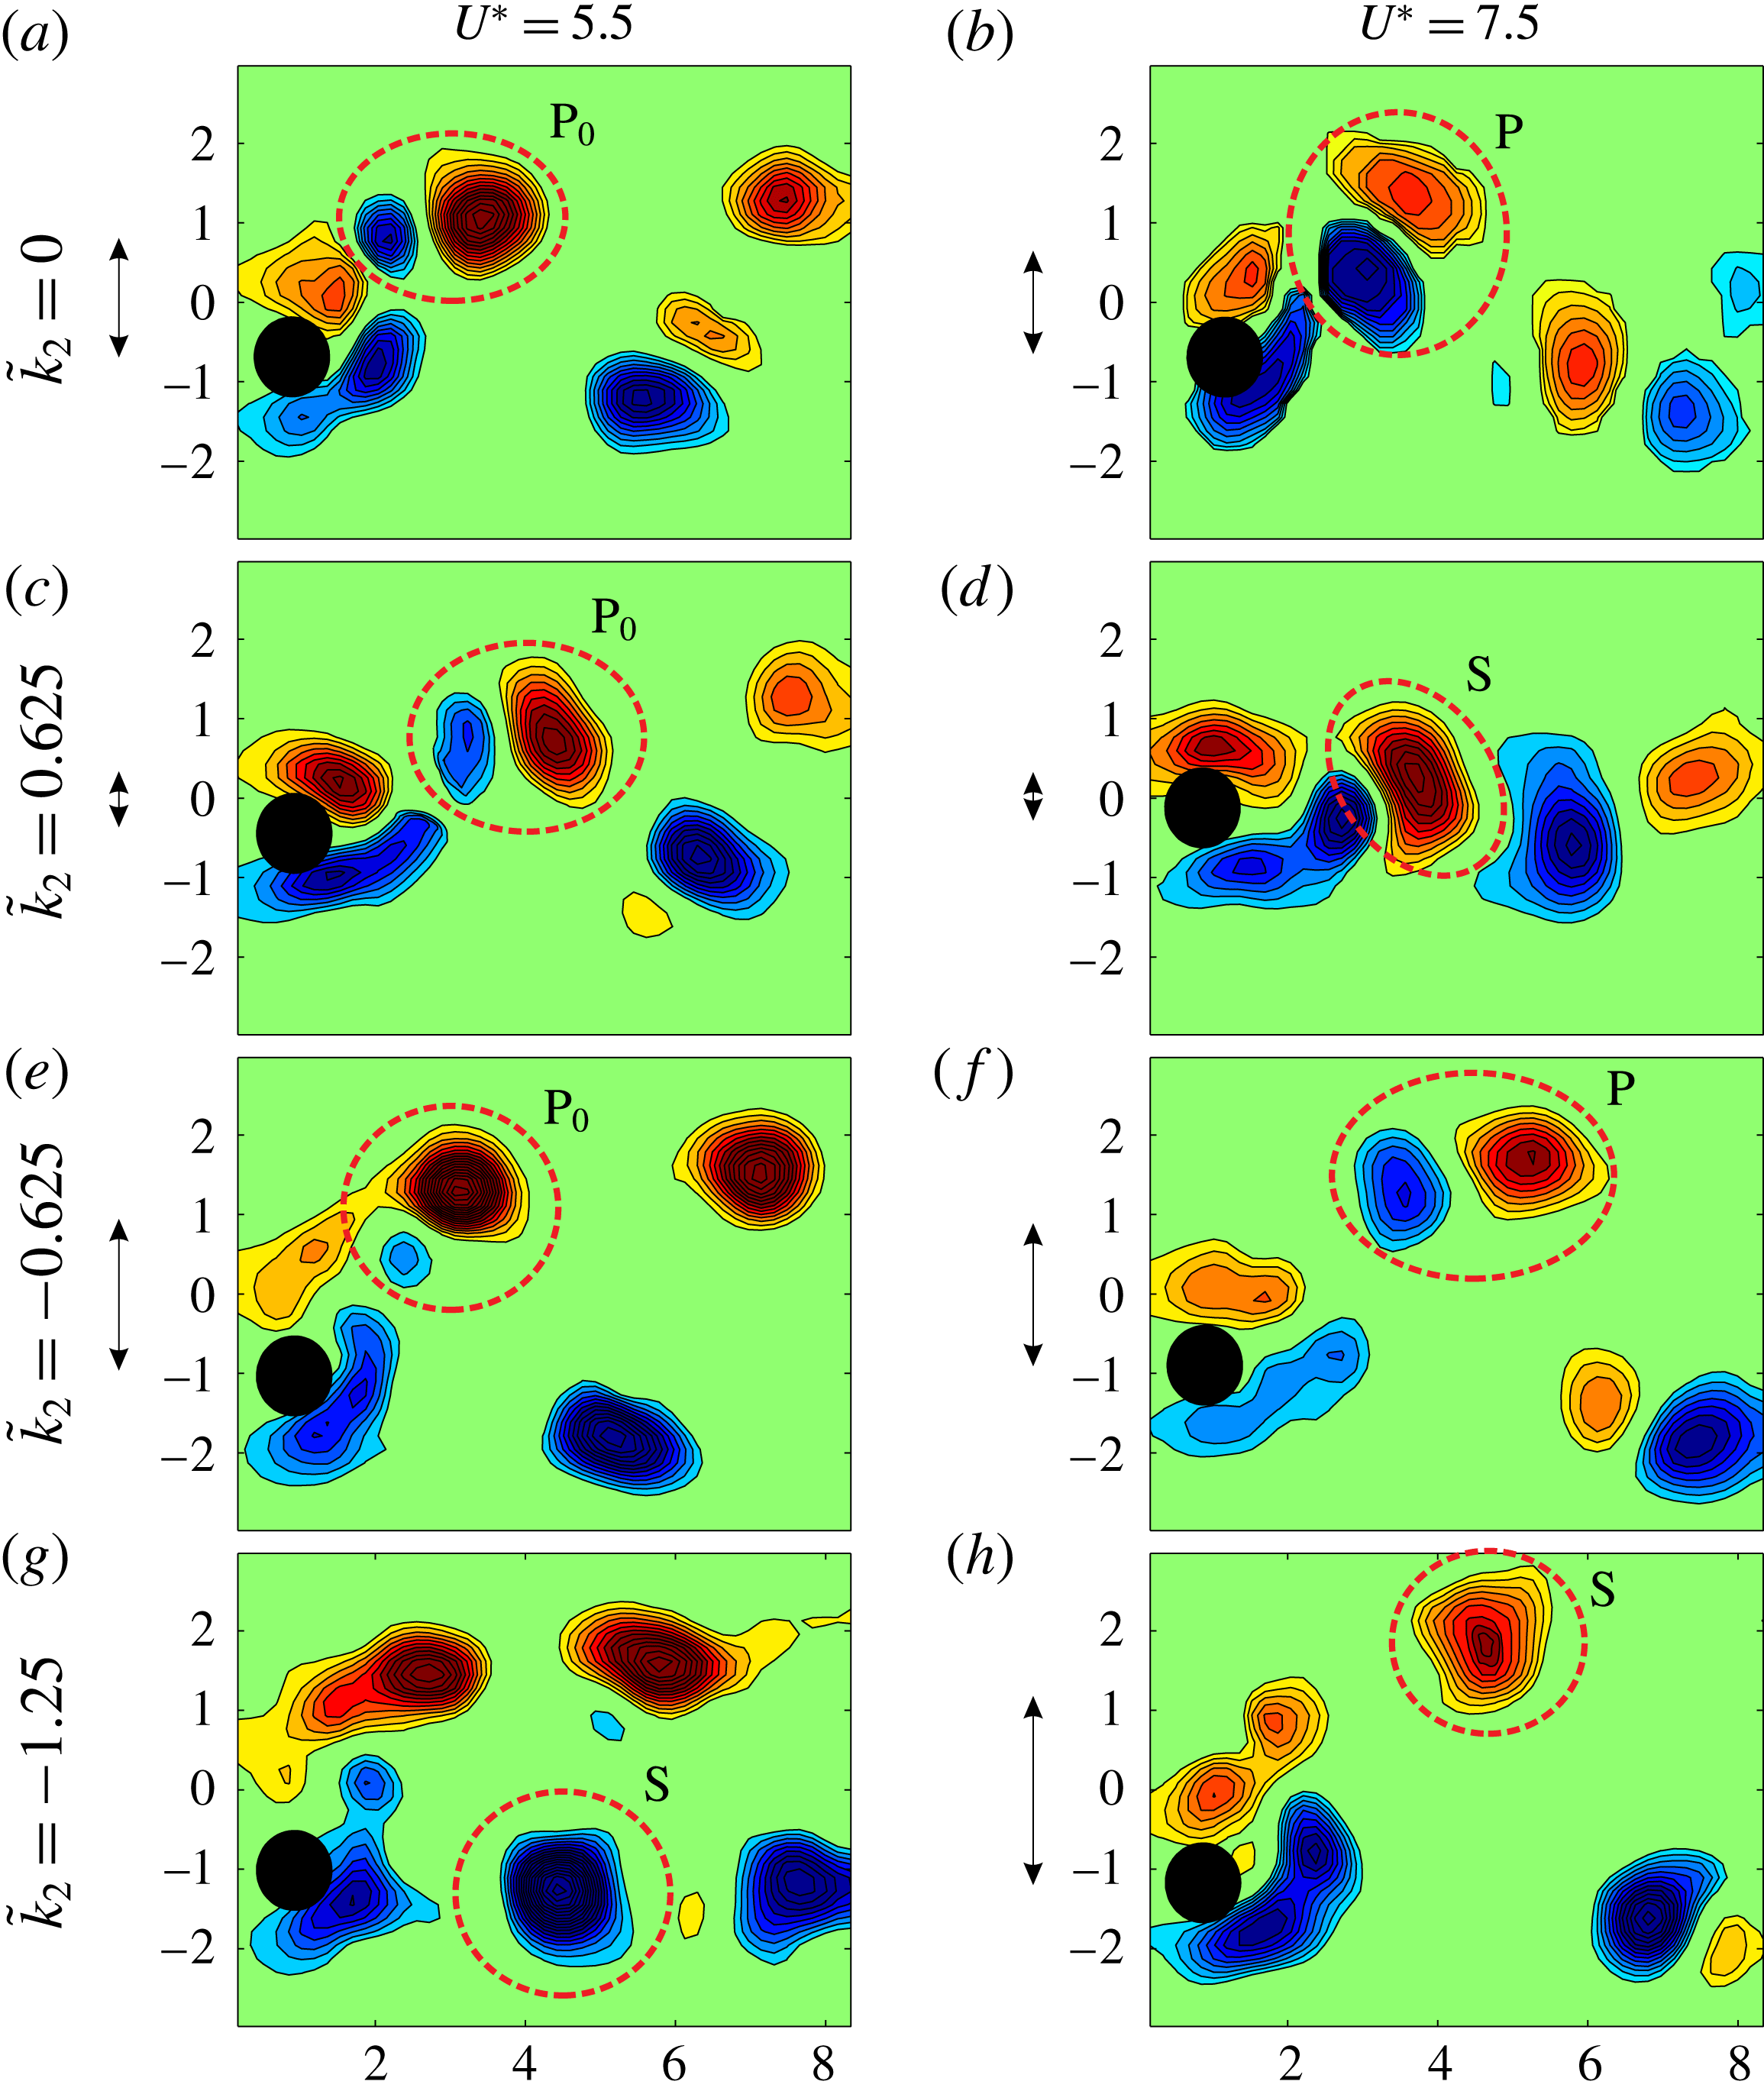
Figure 12. Non-dimensional vorticity contours for two values of reduced velocity (
 $U^{\ast }=5.5$
, 7.5) and four values of
$U^{\ast }=5.5$
, 7.5) and four values of
 $\tilde{k}_{2}$
(
$\tilde{k}_{2}$
(
 $\tilde{k}_{2}=0$
, 0.625,
$\tilde{k}_{2}=0$
, 0.625,
 $-0.625$
,
$-0.625$
,
 $-1.25$
), respectively. Red indicates clockwise circulation and blue indicates anticlockwise circulation. Vortical structures are highlighted with a red dashed line. P represents a pair of vortices shed per half-cycle corresponding to a 2P mode of vortex shedding.
$-1.25$
), respectively. Red indicates clockwise circulation and blue indicates anticlockwise circulation. Vortical structures are highlighted with a red dashed line. P represents a pair of vortices shed per half-cycle corresponding to a 2P mode of vortex shedding.
 $\text{P}_{0}$
is equivalent to the previous one but with the secondary vortex being qualitatively smaller (circulation intensity-wise). S structures represent a single vortex being shed per half-cycle, which corresponds to a 2S mode of vortex shedding. Note that, for completeness, the amplitude of oscillation for each case is indicated by a double-headed arrow.
$\text{P}_{0}$
is equivalent to the previous one but with the secondary vortex being qualitatively smaller (circulation intensity-wise). S structures represent a single vortex being shed per half-cycle, which corresponds to a 2S mode of vortex shedding. Note that, for completeness, the amplitude of oscillation for each case is indicated by a double-headed arrow.
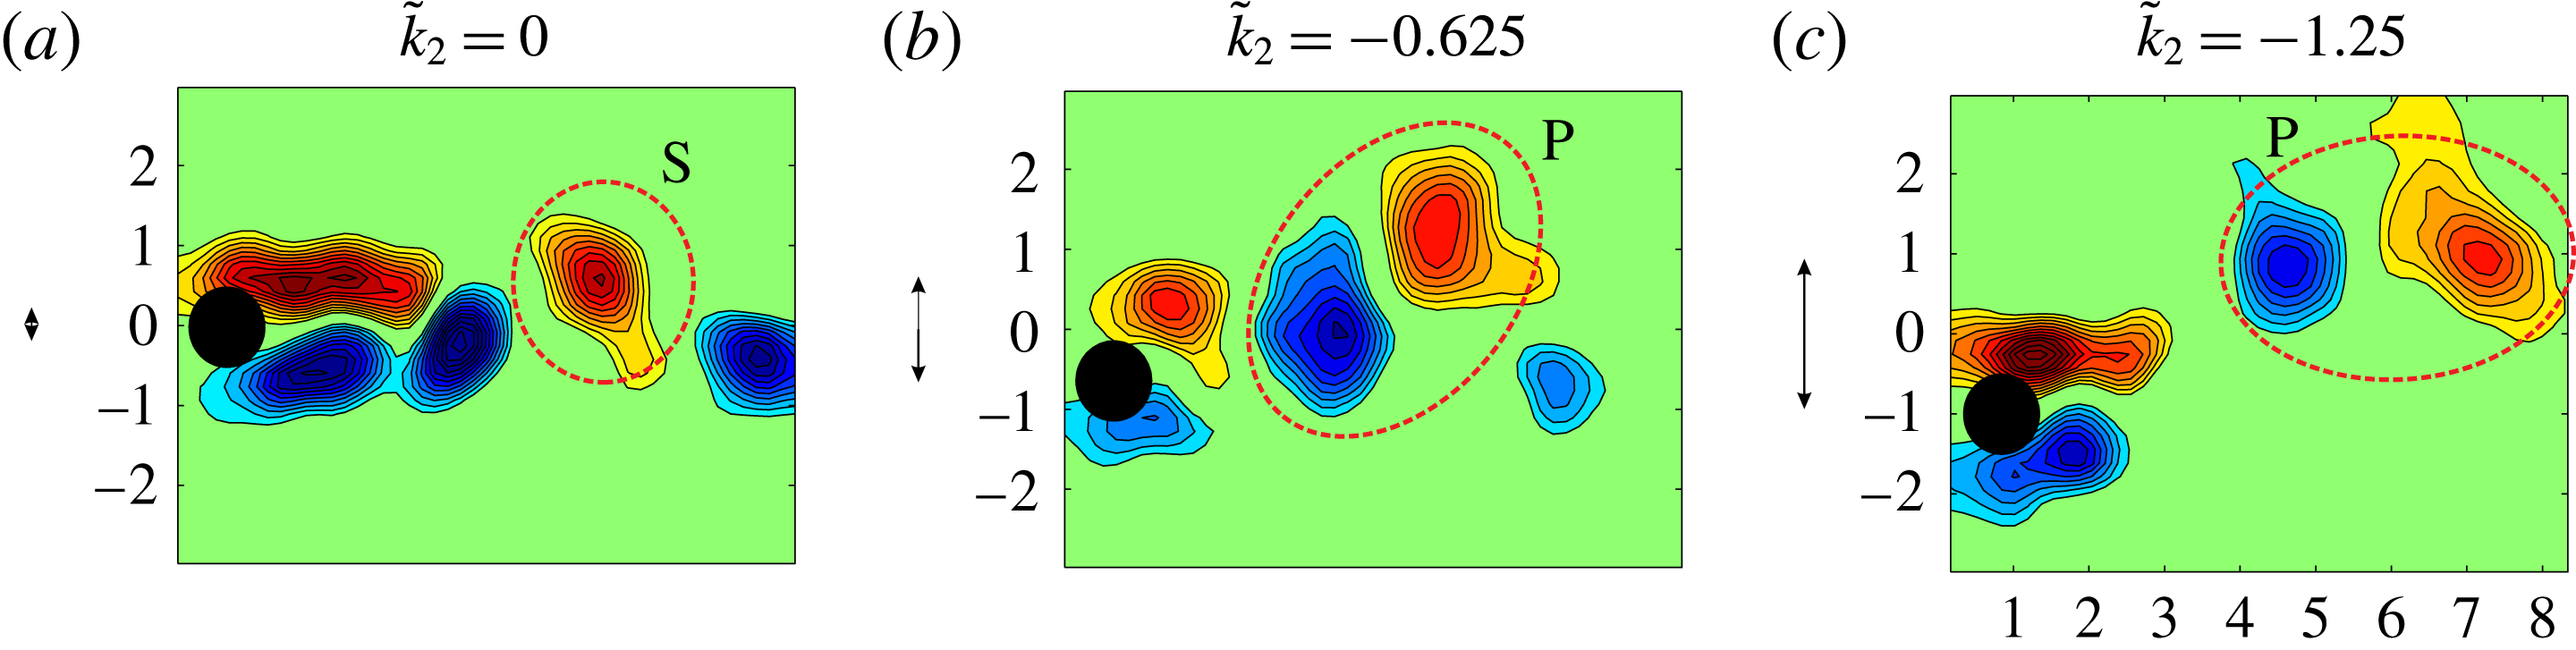
Figure 13. Non-dimensional vorticity contours for
 $U^{\ast }=9.5$
and three values of
$U^{\ast }=9.5$
and three values of
 $\tilde{k}_{2}$
(
$\tilde{k}_{2}$
(
 $\tilde{k}_{2}=0$
,
$\tilde{k}_{2}=0$
,
 $-0.625$
,
$-0.625$
,
 $-1.25$
), respectively. Red indicates clockwise circulation and blue indicates anticlockwise circulation. Vortical structures are highlighted with a red dashed line. P represents a pair of vortices shed per half-cycle corresponding to a 2P mode of vortex shedding.
$-1.25$
), respectively. Red indicates clockwise circulation and blue indicates anticlockwise circulation. Vortical structures are highlighted with a red dashed line. P represents a pair of vortices shed per half-cycle corresponding to a 2P mode of vortex shedding.
 $\text{P}_{0}$
is equivalent to the previous one but with the secondary vortex being qualitatively smaller (circulation intensity-wise). S structures represent a single vortex being shed per half-cycle, which corresponds to a 2S mode of vortex shedding. Note that, for completeness, the amplitude of oscillation for each case is indicated by a double-headed arrow.
$\text{P}_{0}$
is equivalent to the previous one but with the secondary vortex being qualitatively smaller (circulation intensity-wise). S structures represent a single vortex being shed per half-cycle, which corresponds to a 2S mode of vortex shedding. Note that, for completeness, the amplitude of oscillation for each case is indicated by a double-headed arrow.
For positive values of
 $\tilde{k}_{2}$
, the initial branch is not modified with respect to the case without actuation (presenting a 2S mode of vortex shedding at the centreline). At
$\tilde{k}_{2}$
, the initial branch is not modified with respect to the case without actuation (presenting a 2S mode of vortex shedding at the centreline). At
 $U^{\ast }=5.5$
for
$U^{\ast }=5.5$
for
 $\tilde{k}_{2}=0$
(which corresponds to the upper branch), a
$\tilde{k}_{2}=0$
(which corresponds to the upper branch), a
 $2\text{P}_{0}$
mode of vortex shedding was observed (figure 12
a). As
$2\text{P}_{0}$
mode of vortex shedding was observed (figure 12
a). As
 $\tilde{k}_{2}$
increases, the amplitude of oscillation diminishes and still a
$\tilde{k}_{2}$
increases, the amplitude of oscillation diminishes and still a
 $2\text{P}_{0}$
mode is observable (figure 12
c,
$2\text{P}_{0}$
mode is observable (figure 12
c,
 $\tilde{k}_{2}=0.625$
), though circulation intensity is reduced and vortices are shed nearer to the centreline. Further raising of
$\tilde{k}_{2}=0.625$
), though circulation intensity is reduced and vortices are shed nearer to the centreline. Further raising of
 $\tilde{k}_{2}$
leads to an increasingly undefined wake pattern where 2P vortex emission is mixed with 2S mode alternately (driven by the low amplitude of oscillation as well as the rotation of the cylinder). As the reduced velocity is increased (
$\tilde{k}_{2}$
leads to an increasingly undefined wake pattern where 2P vortex emission is mixed with 2S mode alternately (driven by the low amplitude of oscillation as well as the rotation of the cylinder). As the reduced velocity is increased (
 $U^{\ast }=7.5$
), the picture is similar where
$U^{\ast }=7.5$
), the picture is similar where
 $2\text{P}$
vortex emission (for
$2\text{P}$
vortex emission (for
 $\tilde{k}_{2}=0$
, figure 12
b) slowly evolves to a 2S mode as
$\tilde{k}_{2}=0$
, figure 12
b) slowly evolves to a 2S mode as
 $\tilde{k}_{2}$
increases (figure 12
d exhibits a fully 2S mode for
$\tilde{k}_{2}$
increases (figure 12
d exhibits a fully 2S mode for
 $\tilde{k}_{2}=0.625$
and amplitude of oscillation lower than 0.2).
$\tilde{k}_{2}=0.625$
and amplitude of oscillation lower than 0.2).
For negative
 $\tilde{k}_{2}$
, the initial branch is not modified (2S mode). After the transition, in the upper branch (
$\tilde{k}_{2}$
, the initial branch is not modified (2S mode). After the transition, in the upper branch (
 $U^{\ast }=5.5$
), negative
$U^{\ast }=5.5$
), negative
 $\tilde{k}_{2}$
markedly increases the circulation of the vortices shed compared to the case without actuation, and the secondary vortex is suppressed as
$\tilde{k}_{2}$
markedly increases the circulation of the vortices shed compared to the case without actuation, and the secondary vortex is suppressed as
 $\tilde{k}_{2}$
is diminished (figure 12
e,g). For
$\tilde{k}_{2}$
is diminished (figure 12
e,g). For
 $U^{\ast }=7.5$
a 2P mode of vortex emission (similar to
$U^{\ast }=7.5$
a 2P mode of vortex emission (similar to
 $\tilde{k}_{2}=0$
) is obtained with increasing vortex circulation intensity as
$\tilde{k}_{2}=0$
) is obtained with increasing vortex circulation intensity as
 $\tilde{k}_{2}$
is diminished with also a diminishing intensity of the secondary vortex (figure 12
f,h). As observed, rotating the cylinder proportionally to its velocity mainly affects the intensity of the vortices shed for this range of
$\tilde{k}_{2}$
is diminished with also a diminishing intensity of the secondary vortex (figure 12
f,h). As observed, rotating the cylinder proportionally to its velocity mainly affects the intensity of the vortices shed for this range of
 $U^{\ast }$
without affecting the phase of vortex emission. For this rotating law, the vorticity flux from the surface of the cylinder is
$U^{\ast }$
without affecting the phase of vortex emission. For this rotating law, the vorticity flux from the surface of the cylinder is
 $\unicode[STIX]{x1D6E4}_{s}=-\unicode[STIX]{x03C0}D^{2}k_{2}\ddot{y} /2$
(note that circumferential velocity at the cylinder’s surface is
$\unicode[STIX]{x1D6E4}_{s}=-\unicode[STIX]{x03C0}D^{2}k_{2}\ddot{y} /2$
(note that circumferential velocity at the cylinder’s surface is
 $Dk_{2}\ddot{y} /2$
). This suggests that more circulation in the shed vortex is expected for negative values of
$Dk_{2}\ddot{y} /2$
). This suggests that more circulation in the shed vortex is expected for negative values of
 $k_{2}$
. Observe that if we consider
$k_{2}$
. Observe that if we consider
 $\ddot{y} \approx -2\unicode[STIX]{x03C0}f^{2}y$
(since oscillations have a harmonic character), it follows that
$\ddot{y} \approx -2\unicode[STIX]{x03C0}f^{2}y$
(since oscillations have a harmonic character), it follows that
 $\unicode[STIX]{x1D6E4}_{s}$
is in phase with the cylinder’s displacement. This may help to accommodate vorticity generation in the surface onto the growing vortex, increasing its circulation significantly.
$\unicode[STIX]{x1D6E4}_{s}$
is in phase with the cylinder’s displacement. This may help to accommodate vorticity generation in the surface onto the growing vortex, increasing its circulation significantly.
Notably, as seen in figure 10(b), the synchronization region can be enlarged with negative
 $\tilde{k}_{2}$
. In particular, non-dimensional vorticity contour maps are given at
$\tilde{k}_{2}$
. In particular, non-dimensional vorticity contour maps are given at
 $U^{\ast }=9.5$
for the case without actuation (
$U^{\ast }=9.5$
for the case without actuation (
 $\tilde{k}_{2}=0$
, figure 13
a) and two negative values of
$\tilde{k}_{2}=0$
, figure 13
a) and two negative values of
 $\tilde{k}_{2}$
(
$\tilde{k}_{2}$
(
 $\tilde{k}_{2}=-0.625$
,
$\tilde{k}_{2}=-0.625$
,
 $\tilde{k}_{2}=-1.25$
, figures 13
b and 13
c, respectively). As observed, for
$\tilde{k}_{2}=-1.25$
, figures 13
b and 13
c, respectively). As observed, for
 $\tilde{k}_{2}=0$
, oscillations are small due to desynchronization between vortex emission and the cylinder’s oscillation. However, as
$\tilde{k}_{2}=0$
, oscillations are small due to desynchronization between vortex emission and the cylinder’s oscillation. However, as
 $\tilde{k}_{2}$
becomes more negative, the synchronization region is enlarged and large-amplitude oscillations occur and a fully developed 2P mode can be observed.
$\tilde{k}_{2}$
becomes more negative, the synchronization region is enlarged and large-amplitude oscillations occur and a fully developed 2P mode can be observed.
Finally, no quasi-steady flow pattern has been found with regard to the wake pattern (as deduced from (3.9)).
4 Concluding remarks
Hydroelastic experiments have been performed to study the dynamical behaviour and wake pattern of the fluid flow around a circular cylinder undergoing FIV (
 $m^{\ast }=11.7$
and Reynolds number in the range 1500–10 000), free to oscillate in the transverse direction with an imposed rotation around its axis linked to the cylinder’s dynamics. Two different rotating laws have been investigated: first, a rotation proportional to the cylinder’s displacement; second, a rotation proportional to the cylinder’s velocity. The main findings are as follows.
$m^{\ast }=11.7$
and Reynolds number in the range 1500–10 000), free to oscillate in the transverse direction with an imposed rotation around its axis linked to the cylinder’s dynamics. Two different rotating laws have been investigated: first, a rotation proportional to the cylinder’s displacement; second, a rotation proportional to the cylinder’s velocity. The main findings are as follows.
(i) Regarding the case where rotation is proportional to the cylinder’s displacement (
 $\unicode[STIX]{x1D703}=\tilde{k}_{1}Y$
), it has been found that positive values of
$\unicode[STIX]{x1D703}=\tilde{k}_{1}Y$
), it has been found that positive values of
 $\tilde{k}_{1}$
lead to a reduction in the maximum amplitude of oscillation compared to that of the non-rotating VIV, and the transition between the initial and lower branch happened for lower values of reduced velocities. Also, the frequency of oscillation was slightly increased and the region of VIV synchronization was diminished. On the other hand, negative values of
$\tilde{k}_{1}$
lead to a reduction in the maximum amplitude of oscillation compared to that of the non-rotating VIV, and the transition between the initial and lower branch happened for lower values of reduced velocities. Also, the frequency of oscillation was slightly increased and the region of VIV synchronization was diminished. On the other hand, negative values of
 $\tilde{k}_{1}$
significantly increase the maximum peak value of oscillations and increase the reduced velocity at which this maximum occurs. Also, the region of synchronization is greatly enlarged as
$\tilde{k}_{1}$
significantly increase the maximum peak value of oscillations and increase the reduced velocity at which this maximum occurs. Also, the region of synchronization is greatly enlarged as
 $\tilde{k}_{1}$
becomes more negative. In fact, if
$\tilde{k}_{1}$
becomes more negative. In fact, if
 $\tilde{k}_{1}$
overcomes a certain negative value, the response obtained changes dramatically and a galloping-type response is obtained, where the amplitude of oscillation increases almost linearly for high values of the reduced velocity. In those cases, the frequency of oscillation remains constant (
$\tilde{k}_{1}$
overcomes a certain negative value, the response obtained changes dramatically and a galloping-type response is obtained, where the amplitude of oscillation increases almost linearly for high values of the reduced velocity. In those cases, the frequency of oscillation remains constant (
 $f^{\ast }$
close to 1) for high values of reduced velocity and the frequency of vortex shedding increases approximately following the Strouhal law, and thus both time scales (oscillation and vortex shedding) depart from each other. A large number (increasing with the reduced velocity) of vortices are shed per oscillation cycle. From the practical side, note that negative values of
$f^{\ast }$
close to 1) for high values of reduced velocity and the frequency of vortex shedding increases approximately following the Strouhal law, and thus both time scales (oscillation and vortex shedding) depart from each other. A large number (increasing with the reduced velocity) of vortices are shed per oscillation cycle. From the practical side, note that negative values of
 $\tilde{k}_{1}$
could be of interest for energy harvesting purposes as well as to promote mixing.
$\tilde{k}_{1}$
could be of interest for energy harvesting purposes as well as to promote mixing.
(ii) A quasi-steady model has been proposed to predict the amplitude of oscillation for large negative values of
 $\tilde{k}_{1}$
as well as to better understand the observed results. When the time scales of the vortex emission and the oscillation period are insignificantly different, the force can be considered in a quasi-steady fashion and the
$\tilde{k}_{1}$
as well as to better understand the observed results. When the time scales of the vortex emission and the oscillation period are insignificantly different, the force can be considered in a quasi-steady fashion and the
 $C_{y}$
force coefficient can be expressed as a function of
$C_{y}$
force coefficient can be expressed as a function of
 $Y^{\prime }/U^{\ast }$
. Following (3.5), the galloping condition is fulfilled for negative values larger than
$Y^{\prime }/U^{\ast }$
. Following (3.5), the galloping condition is fulfilled for negative values larger than
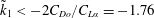 $\tilde{k}_{1}<-2C_{Do}/C_{L\unicode[STIX]{x1D6FC}}=-1.76$
, which agrees well with the experimental results. The quasi-steady model predicts a linear dependence of the amplitude of oscillation on the reduced velocity. As
$\tilde{k}_{1}<-2C_{Do}/C_{L\unicode[STIX]{x1D6FC}}=-1.76$
, which agrees well with the experimental results. The quasi-steady model predicts a linear dependence of the amplitude of oscillation on the reduced velocity. As
 $\tilde{k}_{1}$
becomes more negative, the slope of the amplitude oscillation with the reduced velocity increases. The quasi-steady model was compared to experimental results with good agreement between them.
$\tilde{k}_{1}$
becomes more negative, the slope of the amplitude oscillation with the reduced velocity increases. The quasi-steady model was compared to experimental results with good agreement between them.
(iii) For the case where rotation is proportional to the cylinder’s velocity (
 $\unicode[STIX]{x1D703}=\tilde{k}_{2}Y^{\prime }$
), it has been found that positive values of
$\unicode[STIX]{x1D703}=\tilde{k}_{2}Y^{\prime }$
), it has been found that positive values of
 $\tilde{k}_{2}$
lead to a reduction in the maximum amplitude of oscillation compared to that of the pure VIV. Notably, this rotation law leads to greater reduction of the amplitude of oscillation of the cylinder with less actuation compared to rotating the cylinder proportionally to its displacement (with
$\tilde{k}_{2}$
lead to a reduction in the maximum amplitude of oscillation compared to that of the pure VIV. Notably, this rotation law leads to greater reduction of the amplitude of oscillation of the cylinder with less actuation compared to rotating the cylinder proportionally to its displacement (with
 $\tilde{k}_{1}>0$
), so rotation proportional to velocity should be applied to reduce the amplitude of oscillations efficiently. On the other hand, negative values of
$\tilde{k}_{1}>0$
), so rotation proportional to velocity should be applied to reduce the amplitude of oscillations efficiently. On the other hand, negative values of
 $\tilde{k}_{2}$
increase the maximum value of oscillation. Regarding the frequency of oscillation, it nearly fits into a single curve for all values of
$\tilde{k}_{2}$
increase the maximum value of oscillation. Regarding the frequency of oscillation, it nearly fits into a single curve for all values of
 $\tilde{k}_{2}$
. Negative values of
$\tilde{k}_{2}$
. Negative values of
 $\tilde{k}_{2}$
increase the region of synchronization; thus
$\tilde{k}_{2}$
increase the region of synchronization; thus
 $f^{\ast }$
keeps growing with
$f^{\ast }$
keeps growing with
 $U^{\ast }$
until desynchronization occurs and the vortex shedding frequency is always synchronized with the frequency of oscillation. For all values of
$U^{\ast }$
until desynchronization occurs and the vortex shedding frequency is always synchronized with the frequency of oscillation. For all values of
 $\tilde{k}_{2}$
, oscillations occur under VIV (bell-shaped evolution as a function of the reduced velocity).
$\tilde{k}_{2}$
, oscillations occur under VIV (bell-shaped evolution as a function of the reduced velocity).
(iv) The quasi-steady model developed helps to explain why a galloping-type response is not expected to occur for the case of rotating the cylinder proportional to its oscillating velocity, since the linear transverse force term associated with the rotation is proportional to the acceleration. Therefore, there is no excitation that overcomes the damping term introduced by the drag force. This agrees with experimental results and PIV visualizations performed in which all large-amplitude oscillations obtained occur under a VIV-type solution.
(v) In general, investigated wake modes found for the parameter set of
 $U^{\ast }$
,
$U^{\ast }$
,
 $\tilde{k}_{1}$
and
$\tilde{k}_{1}$
and
 $\tilde{k}_{2}$
are equivalent to those observed for the non-rotating case (Morse & Williamson Reference Morse and Williamson2009), that is, modes 2S,
$\tilde{k}_{2}$
are equivalent to those observed for the non-rotating case (Morse & Williamson Reference Morse and Williamson2009), that is, modes 2S,
 $2\text{P}_{0}$
and 2P. Rotation of the cylinder mainly modifies the intensity of the circulation of the vortices shed. Positive values of
$2\text{P}_{0}$
and 2P. Rotation of the cylinder mainly modifies the intensity of the circulation of the vortices shed. Positive values of
 $\tilde{k}_{1}$
and
$\tilde{k}_{1}$
and
 $\tilde{k}_{2}$
lead to a reduction in their intensity of circulation whereas negative values of
$\tilde{k}_{2}$
lead to a reduction in their intensity of circulation whereas negative values of
 $\tilde{k}_{1}$
and
$\tilde{k}_{1}$
and
 $\tilde{k}_{2}$
increase such intensity as a general trend. This is caused mainly by the direction of rotation of the cylinder as well as its rotation rate. However, for high enough negative values of
$\tilde{k}_{2}$
increase such intensity as a general trend. This is caused mainly by the direction of rotation of the cylinder as well as its rotation rate. However, for high enough negative values of
 $\tilde{k}_{1}$
and high
$\tilde{k}_{1}$
and high
 $U^{\ast }$
, a new wake mode of vortex shedding has been found where the vortex formation is decoupled from the oscillation of the cylinder. The vortices are shed independently from the cylinder’s oscillation at its own frequency and thus the wake pattern resembles that of a wave, as each vortex is shed at different points of the cycle of oscillation. The shedding frequency of the vortices was found to compare well with the frequency given by the Strouhal law. From the applied side, the ability of the rotation law to fix a certain wake pattern can be of interest for some applications (mixing, heat transport, etc.). Further experiments for higher values of the feedback constants
$U^{\ast }$
, a new wake mode of vortex shedding has been found where the vortex formation is decoupled from the oscillation of the cylinder. The vortices are shed independently from the cylinder’s oscillation at its own frequency and thus the wake pattern resembles that of a wave, as each vortex is shed at different points of the cycle of oscillation. The shedding frequency of the vortices was found to compare well with the frequency given by the Strouhal law. From the applied side, the ability of the rotation law to fix a certain wake pattern can be of interest for some applications (mixing, heat transport, etc.). Further experiments for higher values of the feedback constants
 $\tilde{k}_{1}$
and
$\tilde{k}_{1}$
and
 $\tilde{k}_{2}$
should be performed to determine if new modes of vortex emission emerge.
$\tilde{k}_{2}$
should be performed to determine if new modes of vortex emission emerge.
Acknowledgements
A.V. has been funded by the Spanish Ministry of Economy and Competitiveness (Ministerio de Economia y Competitividad) under research contract DPI2016-75296-P, and gratefully acknowledges this support.
Supplementary movies
Supplementary movies are available at https://doi.org/10.1017/jfm.2018.332.