


1 Introduction
Transitioning and turbulent flows often use the idea of characteristic scales to approach the physical mechanisms dominating the flow. For flow around a circular prism, the drag crisis has been analysed at great length from the point of view of the local boundary layer behaviour, e.g. the boundary layer thickness,
 $\unicode[STIX]{x1D6FF}$
(Achenbach Reference Achenbach1971). For Strouhal number formulations in the wake, it was suggested by Roshko (Reference Roshko1954) to use the wake width and velocity at separation instead of the body diameter and free-stream velocity as a way to universalize Strouhal numbers for various bluff body geometries. In these instances, the scale(s) of interest are directly tied to the motivating physical changes in the flow. Others, including Unal & Rockwell (Reference Unal and Rockwell1988) simultaneously studied two scales where one seemingly dominates the other, noting that the respective size and authority over one another introduce nonlinearities that encumber any attempts to reduce the problem to a single scale. They further pointed out that a physical interpretation of these multiscale flows is necessary to appreciate the fluid dynamics in full detail. Of particular interest here are flows where multiple scaling arguments may be appropriate to describe the same flow field, for example; where a boundary layer and a wake region are in close proximity behind a bluff body. The adjacent shear layer could then be described in terms of boundary layer thicknesses, or in wake diameters. The question then becomes, which set of scales most appropriately represents the responsible physical mechanisms. One archetype geometry that illustrates this behaviour is the rectangular prism with a varying side length ratio.
$\unicode[STIX]{x1D6FF}$
(Achenbach Reference Achenbach1971). For Strouhal number formulations in the wake, it was suggested by Roshko (Reference Roshko1954) to use the wake width and velocity at separation instead of the body diameter and free-stream velocity as a way to universalize Strouhal numbers for various bluff body geometries. In these instances, the scale(s) of interest are directly tied to the motivating physical changes in the flow. Others, including Unal & Rockwell (Reference Unal and Rockwell1988) simultaneously studied two scales where one seemingly dominates the other, noting that the respective size and authority over one another introduce nonlinearities that encumber any attempts to reduce the problem to a single scale. They further pointed out that a physical interpretation of these multiscale flows is necessary to appreciate the fluid dynamics in full detail. Of particular interest here are flows where multiple scaling arguments may be appropriate to describe the same flow field, for example; where a boundary layer and a wake region are in close proximity behind a bluff body. The adjacent shear layer could then be described in terms of boundary layer thicknesses, or in wake diameters. The question then becomes, which set of scales most appropriately represents the responsible physical mechanisms. One archetype geometry that illustrates this behaviour is the rectangular prism with a varying side length ratio.

Figure 1. Schematic demonstrating three flow regimes along the side of a rectangular section. (I) Initial development, (II) nonlinear interactions and (III) wake influenced. Flow is left to right.
Rectangular prisms represent a subset of bluff body geometry exhibiting sharp corners. The corners introduce surface discontinuities and force separation regardless of the local pressure gradients. Figure 1 highlights the main flow regimes that are typically analysed using individual scales in the flow field around a two-dimensional rectangular body of arbitrary length. In order to outline these physical scales involved in the bluff body flow field, a brief description of the velocity and accompanying vorticity fields follows. For a steady irrotational approaching flow, one observes the development of a laminar boundary layer on the front face. Its properties can be quantified through the Thwaites method as carried out by Sigurdson (Reference Sigurdson1986). Here, vorticity is generated instantaneously inside the boundary layer as the pressure gradient accelerates the flow toward the corner (Morton Reference Morton1984). At the leading edge corner, the flow experiences laminar separation and the newly separated boundary layer becomes a separated shear layer. This separated shear layer (referred to simply as the shear layer) has a mean velocity profile containing an inflection point suggesting a vulnerability to the Kelvin–Helmholtz (KH) instability, where small perturbations grow in an unbounded manner, (Schmid & Henningson Reference Schmid and Henningson2001). While the generation of vorticity is instantaneous on the front face, it is the shear layer that governs the rate of vorticity diffusion, which can be described by the vorticity transport equation. If the body is long enough in the streamwise direction, the shear layer eventually reattaches to the body surface as it undergoes turbulent transition and forms a secondary boundary layer downstream of the reattachment point. Ultimately, the flow passes beyond the trailing edge yielding another shear layer in the near wake region. This second shear layer forms one half of a wake profile, where the second half comes from the opposite side of the body.
In terms of vortex development, there are two places where coherent structures are likely to be detected and thus amenable to scaling analysis. The first are the KH vortical structures, which are born out of the roll up of the separated shear layer, with a frequency
 $f_{KH}$
. Region I in figure 1 highlights the initial development region where the growth rate of a shear layer perturbation may be considered as a linear mechanism. Beyond that region the growth rate becomes nonlinear and the supply of circulation stemming from the front face is periodically severed as the shear layer rolls up onto itself. It is at this point, in Region II, that multiple coherent structures with similarly signed vorticity are able to interact with one another via pairing as they are convected downstream. Region III represents an area where the dominant structures found are wake vortices, formed due to the communication across the centreline of the body with a second shear layer of oppositely signed vorticity (Matsumoto Reference Matsumoto1999). The resulting vortical structures are referred to here as von Kármán (VK) vortices. Depending on the ratio of side lengths of the body these three regions are in varying proximity to each other, exhibiting differing levels of influence over one another. The resulting interactions and energy transfers between these two vortical systems (
$f_{KH}$
. Region I in figure 1 highlights the initial development region where the growth rate of a shear layer perturbation may be considered as a linear mechanism. Beyond that region the growth rate becomes nonlinear and the supply of circulation stemming from the front face is periodically severed as the shear layer rolls up onto itself. It is at this point, in Region II, that multiple coherent structures with similarly signed vorticity are able to interact with one another via pairing as they are convected downstream. Region III represents an area where the dominant structures found are wake vortices, formed due to the communication across the centreline of the body with a second shear layer of oppositely signed vorticity (Matsumoto Reference Matsumoto1999). The resulting vortical structures are referred to here as von Kármán (VK) vortices. Depending on the ratio of side lengths of the body these three regions are in varying proximity to each other, exhibiting differing levels of influence over one another. The resulting interactions and energy transfers between these two vortical systems (
 $f_{VK}$
and
$f_{VK}$
and
 $f_{KH}$
) under a changing Reynolds number is a primary focus in this work.
$f_{KH}$
) under a changing Reynolds number is a primary focus in this work.
As individual flow fields, each of these regimes has received significant attention. Planar mixing layers, perhaps most famously documented by Brown & Roshko (Reference Brown and Roshko1974), are attractive because of their composition of coherent motion at both large and small scales. The quantification of the spatial growth of the mixing layer showed two distinct rates according to Winant & Browand (Reference Winant and Browand1974). Depending on whether or not the shear layer was laminar or turbulent, the growth rates via momentum thickness, obeyed a logarithmic or linear trend, respectively. Nevertheless, the length scale of choice for mixing layers is typically that describing the thickness of the sheared region; a momentum thickness or vorticity thickness. In the event of recirculating flow, the definition written in Fiedler (Reference Fiedler1991) accounts for the additional thickness of the layer, a point that will be addressed in subsequent sections. Predictions about the properties of the most unstable waves within the mixing layer using the analytical treatments of Michalke (Reference Michalke1965) and later Monkewitz (Reference Monkewitz1982) have shown to give reliable estimations for plane mixing layer behaviour in laminar and surprisingly, some turbulent mixing layers. However, as emphasized in Ho & Huerre (Reference Ho and Huerre1984), a large disparity between large and small scales within the planar mixing layer may be one reason why a linear assumption is able to remain competitive in a nonlinear flow. In either case, the compatibility of linear theory and experimental data was described with a velocity ratio across the shear layer rather than a free-stream Reynolds number formulation. This is a logical choice when considering the inviscid mechanisms associated with the onset of turbulence within the mixing layer.
Under certain settings, such as a significant afterbody, and/or a favourable local pressure gradient, the separated shear layer will reattach to the surface of the body. The nature of the shear layer bounding the recirculation region has been studied by many, including Castro & Haque (Reference Castro and Haque1987) who showed that the reattaching shear layer from a bluff body is unique, demonstrating high initial growth rates and sustained accumulation of turbulent kinetic energy. In that work, the primary scale of choice was that of the recirculation bubble’s length rather than a mixing layer thickness as in the planar mixing layer scenario. More recently, under atmospheric boundary layer conditions, Akon & Kopp (Reference Akon and Kopp2018) attempted to characterize the recirculation bubble over a bluff body by collapsing a series of normal and Reynolds stress profiles using a variety of scaling lengths. Their conclusions found that those extracted from the bubble’s topology, such at its wall-normal thickness, yielded the best collapse of the data.
The bubble thickness and reattachment position of the recirculation region help define the level of curvature sustained by the shear layer. The curvature itself was observed by Shimada & Ishihara (Reference Shimada and Ishihara2002) to increase with decreasing side length ratios, another point to be considered. In addition, changing the angle of attack effectively changes the pressure gradient at separation, which also forces changes in the level of curvature exhibited by the shear layer. Schewe (Reference Schewe2013) found that under increasing angles of attack, the shear layer on the pressure side of a 5 : 1 section reattached sooner than its orthogonal baseline case. The reduced mean reattachment length further responded nonlinearly to an increasing Reynolds number, suggesting that the reattachment, and subsequently the mean lift coefficient, is a nonlinear function of both the pressure gradient at separation as well as the free-stream Reynolds number.
Many of the published findings around bluff body shear layers exercise unique test parameters and/or focus their analyses in various directions within the flow, although there have also been standardized attempts to understand and describe these shear flows. An international benchmark study was launched at the Sixth International Colloquium on Bluff Body Aerodynamics and Applications in an effort to deepen the knowledge around many of the phenomena related to a rectangular section. The study focused on the fundamentals of the turbulent flow and aerodynamic loading of a two-dimensional (2-D) rectangle having an in-wind length to depth ratio (i.e. side aspect ratio) of 5 : 1 both experimentally as well as numerically (Bartoli et al. Reference Bartoli, Bruno, Buresti, Ricciardelli, Salvetti and Zasso2008). A successful benchmark campaign would help to reconcile many of the scaling scenarios described above. Yet while more than a dozen investigations surrounding this benchmark surfaced in the following three years, it appears that only mean flow statistics show encouraging levels of agreement among data sets. Unsteady measurements, including surface pressures, showed wide levels of disparity both within the numerical community as well as within the experimental groups (Bruno, Salvetti & Ricciardelli Reference Bruno, Salvetti and Ricciardelli2014). Moreover, the self-generated unsteadiness within the bluff body shear layer continues to confound fluid dynamicists after several decades of study, which is strong evidence of the complexity associated with describing the flow field.
Perhaps one such reason for this complexity is the close proximity of multiple sources of instability. To further appreciate this notion, the physical signatures of various hydrodynamic instabilities are briefly reiterated here. In the event that the shear layer instability is purely convective, its evolution may only be detected downstream of an origin. The origin at present is deemed to be the leading edge corner of the section. On the other hand, the global nature of wake instabilities broadcasts its presence throughout the domain, both within the wake, as well as upstream. Distinctions between these two types of instability can be a valuable tool for understanding and scaling flow fields.
Practically speaking, one may probe a velocity field and quickly distinguish between these two types of instabilities. A convective instability will only be detected downstream of its source, making the source relatively easy to define while global instabilities are detectable everywhere in the velocity field, both upstream and downstream. Thus, its origin is more experimentally obscure. For example, many planar mixing layers have been shown to match well with a spatial treatment and yield a final result of a convective instability (Monkewitz Reference Monkewitz1982). Wake flows, such as a Gaussian profile for parallel flows, as discussed in Hultgren & Aggarwal (Reference Hultgren and Aggarwal1987), have been shown to be absolutely unstable, while globally unstable behaviour is reserved for spatially developing profiles (Huerre & Monkewitz Reference Huerre and Monkewitz1990). In both of these instances, the signature of vortex shedding in the wake can be detected by probing the velocity field upstream or downstream of the body itself. An interesting situation arises when a convective disturbance is nearby a global one, such as along a rectangular section. As will be shown in subsequent sections, the signature from the KH instability is detected only after some finite distance downstream of the leading edge corner, along the shear layer trajectory. In contrast, the wake frequency is detected at all locations of interest and exhibits globally unstable behaviour. The shear layer’s power spectrum then appears bimodal, containing competing levels of influence from both instabilities, KH and VK. The former is associated with scales much smaller than the height of the section, while the latter is of a similar order to the section height. Changing the Reynolds number and/or spatial proximity between leading and trailing edges through the modification of side lengths are thus mechanisms for evaluating the relative influence of either instability mechanism.
Investigating the individual contributions from specific large and small scales is similar to other available literature in the community. Targeting homogeneous turbulence, Carter & Coletti (Reference Carter and Coletti2018) experimentally investigated the correlation of the smaller scales with larger velocity gradients and found that a positive correlation yielded the result that small scales, associated with dissipation, are not entirely independent of the largest eddies in the flow, challenging the traditional Kolmogorov turbulence hypothesis of a universal equilibrium range. Similar conclusions were found in shear flows. Bandyopadhyay & Hussain (Reference Bandyopadhyay and Hussain1984) investigated the interactions between two broadband ranges of high and low frequencies in turbulent mixing layers using a single hot-wire probe. Through extensive autocorrelations they showed that smaller scales became most active when the velocity related to the larger scales changes sign. Conversely, when the large scales reach their peak amplitudes the smaller scales were less apparent, demonstrating a convincing phase dependency between scales. In wall-bounded flows, Hutchins & Marusic (Reference Hutchins and Marusic2007) found a bimodal spectrum by probing a turbulent boundary layer with a hot-wire. They showed that the (higher frequency) inner mode scaled with viscous units while the (lower frequency) outer mode was more appropriately described using the boundary layer thickness. One primary finding from their work was that the larger scales modulated the amplitude of smaller-scale fluctuations. Amplitude modulation has since been extended to increasingly higher Reynolds numbers to describe the relationship between modes in turbulent boundary layers (Mathis, Hutchins & Marusic Reference Mathis, Hutchins and Marusic2009). The present study extends the approach of these earlier cases, although external flows around bluff bodies are neither homogeneous nor entirely wall-bounded. Furthermore, it will be shown that the shear layer experiences turbulent transition that extends a significant distance downstream, consistently operating on the budgets of turbulent kinetic energy and vorticity. Thus, the flow does not yet have access to the necessary set of scaling tools (Kolmogorov scales for homogeneous turbulence, viscous units in boundary layers, etc.) to compare to the available literature. By combining relevant queries, methods and metrics from various bodies of literature it is our goal to explore, in detail, the unsteady flow field around a rectangular section and elucidate the fundamental fluid physics associated with this ubiquitous geometry.
In the following sections, the findings from this investigation are explored. Details of the experimental set-up are given in § 2. An uncertainty analysis is included in § 3 to address the accuracy of the experimental methods. Main results are presented and discussed in § 4 and subsequent conclusions are offered in § 5.

Figure 2. Side view of wind tunnel models showing the individually acquired FOVs for each model (from left to right, 5 : 1, 3 : 1 and 1 : 1). Flow is left to right. Origin exists at the lower left corner of each section.
2 Experimental set-up
A modular rectangular prism was fabricated at Rensselaer Polytechnic Institute (RPI). The modules themselves were machined from aluminium square tubes, with final dimensions of
 $L=h=50.8$
mm and a span of
$L=h=50.8$
mm and a span of
 $w=508$
mm. Five modules were then aligned parallel to one another and bolted together to allow for configurations including
$w=508$
mm. Five modules were then aligned parallel to one another and bolted together to allow for configurations including
 $L/h=$
1 : 1, 3 : 1 and 5 : 1. However, the span of the assembly remained constant. To ensure adequate surface quality and integrity of the corners, the assembled model was machined once more to produce satisfactory surface finish and reduce any discontinuities between modules. The model assembly was mounted on a circular shaft between end plates that allowed the model to change its inclination angle relative to the oncoming wind. A schematic of the models surface geometry shown in figure 2. The end plates extended approximately
$L/h=$
1 : 1, 3 : 1 and 5 : 1. However, the span of the assembly remained constant. To ensure adequate surface quality and integrity of the corners, the assembled model was machined once more to produce satisfactory surface finish and reduce any discontinuities between modules. The model assembly was mounted on a circular shaft between end plates that allowed the model to change its inclination angle relative to the oncoming wind. A schematic of the models surface geometry shown in figure 2. The end plates extended approximately
 $14h$
upstream and
$14h$
upstream and
 $20h$
downstream of the model’s rotational axis. The distance between the leading/trailing edges and the leading/trailing edges of the end plates then depended on the model’s configuration. The test rig, including the model along with end plates, was installed in the Large Subsonic Wind Tunnel on at RPI’s Center for Flow Physics and Control (CeFPaC).
$20h$
downstream of the model’s rotational axis. The distance between the leading/trailing edges and the leading/trailing edges of the end plates then depended on the model’s configuration. The test rig, including the model along with end plates, was installed in the Large Subsonic Wind Tunnel on at RPI’s Center for Flow Physics and Control (CeFPaC).
The wind tunnel is a blow-down type with two centrifugal fans powered by a
 $100$
hp motor. A large settling chamber houses a honeycomb and a series of screens with decreasing grid size, which act to break up larger turbulent eddies and distribute the flow uniformly before the flow is accelerated through the contraction into the test section. The contraction has an area reduction ratio of 9 : 1 with the test section having dimensions of height, width and length of
$100$
hp motor. A large settling chamber houses a honeycomb and a series of screens with decreasing grid size, which act to break up larger turbulent eddies and distribute the flow uniformly before the flow is accelerated through the contraction into the test section. The contraction has an area reduction ratio of 9 : 1 with the test section having dimensions of height, width and length of
 $0.8$
m,
$0.8$
m,
 $0.8$
m and
$0.8$
m and
 $5.0$
m, respectively, with a maximum wind speed of 50 m s
$5.0$
m, respectively, with a maximum wind speed of 50 m s
 $^{-1}$
. In the empty tunnel the uniformity of the mean flow across the middle
$^{-1}$
. In the empty tunnel the uniformity of the mean flow across the middle
 $0.5\,$
m of the tunnel is better than 0.1 %, with lower velocities in regions close to the walls. Over the range of wind speeds used for testing, the longitudinal turbulence intensity was measured to be less than 0.25 %. Tests were carried out at a range of Reynolds numbers varying between
$0.5\,$
m of the tunnel is better than 0.1 %, with lower velocities in regions close to the walls. Over the range of wind speeds used for testing, the longitudinal turbulence intensity was measured to be less than 0.25 %. Tests were carried out at a range of Reynolds numbers varying between
 $1.34\times 10^{4}$
and
$1.34\times 10^{4}$
and
 $1.18\times 10^{5}$
by changing the speeds,
$1.18\times 10^{5}$
by changing the speeds,
 $U_{\infty }$
. The Reynolds number in this case is based on the constant dimension of the model’s height, the free-stream velocity and the kinematic viscosity of the air in the tunnel,
$U_{\infty }$
. The Reynolds number in this case is based on the constant dimension of the model’s height, the free-stream velocity and the kinematic viscosity of the air in the tunnel,
 $Re_{h}=U_{\infty }h/\unicode[STIX]{x1D708}$
. Components of the velocity in the streamwise and vertical direction are described using
$Re_{h}=U_{\infty }h/\unicode[STIX]{x1D708}$
. Components of the velocity in the streamwise and vertical direction are described using
 $U$
and
$U$
and
 $V$
, respectively. A standard Reynolds decomposition is used to calculate fluctuating quantities such as the streamwise fluctuations,
$V$
, respectively. A standard Reynolds decomposition is used to calculate fluctuating quantities such as the streamwise fluctuations,
 $\overline{{u^{\prime }}^{2}}=\overline{U^{2}}-\overline{U}^{2}$
, where
$\overline{{u^{\prime }}^{2}}=\overline{U^{2}}-\overline{U}^{2}$
, where
 $\overline{U}$
is the mean value of the signal. Fluctuations in the vertical direction are referenced with a similar expression using the variable
$\overline{U}$
is the mean value of the signal. Fluctuations in the vertical direction are referenced with a similar expression using the variable
 $v^{\prime }$
.
$v^{\prime }$
.
Figure 2 shows the test set-up including the coordinate system as well as the characteristic dimensions of the model. In order to support a high level of spatial accuracy using particle image velocimetery (PIV), a grid of fields of view (FOVs) was individually acquired and then stitched together in post-processing to construct a high resolution picture of time-averaged flow parameters. Depending on the model’s aspect ratio, anywhere from 6 to 28 FOVs were recorded to reconstruct the flow fields. Each FOV was investigated using 2C-2 Camera PIV. The cameras were positioned next to one another. Both cameras were LaVision Imager LX cameras, each having 2 MPx resolution and were calibrated using the same target with
 $10\,\%$
of their images overlapping. The flow was illuminated with a New Wave Solo PIV 120 mJ pulse
$10\,\%$
of their images overlapping. The flow was illuminated with a New Wave Solo PIV 120 mJ pulse
 $^{-1}$
per frame Nd-YAG (532
$^{-1}$
per frame Nd-YAG (532
 $\unicode[STIX]{x03BC}$
m) dual-head laser. The timing of the system allowed sampling at approximately 15 Hz and in all cases convergence of turbulent statistics was satisfied by acquiring 1000 image pairs. Vector fields were calculated using sequential cross-correlations of the image pairs. A multipass processing algorithm was implemented through LaVision software, where the first pass used a
$\unicode[STIX]{x03BC}$
m) dual-head laser. The timing of the system allowed sampling at approximately 15 Hz and in all cases convergence of turbulent statistics was satisfied by acquiring 1000 image pairs. Vector fields were calculated using sequential cross-correlations of the image pairs. A multipass processing algorithm was implemented through LaVision software, where the first pass used a
 $64~\text{px}\times 64~\text{px}$
interrogation window, while the secondary and final passes used a
$64~\text{px}\times 64~\text{px}$
interrogation window, while the secondary and final passes used a
 $32~\text{px}\times 32~\text{px}$
, each with a 50 % overlap. The resulting vector fields had a spatial resolution of 5.45 vectors per millimetre. This meant that each FOV corresponded to a physical domain of
$32~\text{px}\times 32~\text{px}$
, each with a 50 % overlap. The resulting vector fields had a spatial resolution of 5.45 vectors per millimetre. This meant that each FOV corresponded to a physical domain of
 $0.35h\times 0.88h$
or a total of 279.4 vectors per body height.
$0.35h\times 0.88h$
or a total of 279.4 vectors per body height.
Table 1. Summary of the parameters explored.

Additional point measurements were carried out using two single hot-wire probes from Dantec Dynamics A/S, type 55P11, sampled using an AN-1005 Anemometry System from A.A. Labs Ltd. Each hot-wire was individually calibrated over the same range of velocities, approximately 1–40 m s
 $^{-1}$
, and mounted on its own traverse system such that the two probes existed on the same streamwise plane. The orientation of the wires with respect to the model was such that the wires axis was parallel to the leading edge corner of the model. This set-up ensured that the probe was equally sensitive to both vertical and streamwise velocities while also allowing the probe to approach the leading edge corner as close as possible without making contact. The traverses themselves had a repeatability of 0.005 mm in both streamwise and vertical coordinates. The probes were simultaneously sampled at 40 kHz for 30 s and were placed at locations determined by the results of the PIV. Special care was taken to ensure that no more than 0.2 % of the data exceeded the calibration range of the wires. The procedure to locate the upstream hot-wire involved identifying the origin (at the leading edge corner) and using the topology of the reconstructed PIV field to get a series of target location in the coordinates of the PIV. A linear transformation converted the target locations to physical distances that were digitally controlled using the traverses. The only change to the wind tunnel set-up was a modified floor in the test section beneath the model that contained a narrow slot through which the hot-wire probe protruded. A summary of the parameters explored and their dimensional quantities is given in table 1.
$^{-1}$
, and mounted on its own traverse system such that the two probes existed on the same streamwise plane. The orientation of the wires with respect to the model was such that the wires axis was parallel to the leading edge corner of the model. This set-up ensured that the probe was equally sensitive to both vertical and streamwise velocities while also allowing the probe to approach the leading edge corner as close as possible without making contact. The traverses themselves had a repeatability of 0.005 mm in both streamwise and vertical coordinates. The probes were simultaneously sampled at 40 kHz for 30 s and were placed at locations determined by the results of the PIV. Special care was taken to ensure that no more than 0.2 % of the data exceeded the calibration range of the wires. The procedure to locate the upstream hot-wire involved identifying the origin (at the leading edge corner) and using the topology of the reconstructed PIV field to get a series of target location in the coordinates of the PIV. A linear transformation converted the target locations to physical distances that were digitally controlled using the traverses. The only change to the wind tunnel set-up was a modified floor in the test section beneath the model that contained a narrow slot through which the hot-wire probe protruded. A summary of the parameters explored and their dimensional quantities is given in table 1.
3 Uncertainties
Inherent to the analysis of any experiment is the notion of random errors occurring in the measurement process and their propagation into a final result. This work focuses specifically on flows that typically challenge flow measurement techniques and with that in mind, the major sources of error are identified and quantified here. Primary focus is devoted toward the PIV measurements, which have received significant attention recently in regards to uncertainty quantification (UQ) (Christensen & Scarano Reference Christensen and Scarano2015), with additional consideration towards the hot-wire measurements that follow. PIV is non-invasive in that there is no blockage effect from the measurement device, an attractive feature for many experimental set-ups. However, as shown in the database from Neal et al. (Reference Neal, Sciacchitano, Smith and Scarano2015), standard laboratory PIV systems typically overestimate the fluctuation intensity of unsteady shear flows. If the error is truly random, that is to say the bias errors do not contribute to the total measurement error, then the uncertainty of the mean asymptotes toward zero with an infinitely large sample size proportional to
 $\unicode[STIX]{x1D70E}_{u}/\sqrt{N}$
, where
$\unicode[STIX]{x1D70E}_{u}/\sqrt{N}$
, where
 $\unicode[STIX]{x1D70E}_{u}$
is the standard deviation of the sample set of
$\unicode[STIX]{x1D70E}_{u}$
is the standard deviation of the sample set of
 $u$
measurements and
$u$
measurements and
 $N$
is the number of independent samples. The variable
$N$
is the number of independent samples. The variable
 $U$
is traditionally given to describe the uncertainty, for example, the uncertainty of the mean streamwise velocity,
$U$
is traditionally given to describe the uncertainty, for example, the uncertainty of the mean streamwise velocity,
 $U_{\overline{U}}$
. Avoiding confusion with the velocity field definitions, the notation
$U_{\overline{U}}$
. Avoiding confusion with the velocity field definitions, the notation
 $\unicode[STIX]{x1D701}\,_{\overline{U}}$
is used to describe the same parameter here. The symbol
$\unicode[STIX]{x1D701}\,_{\overline{U}}$
is used to describe the same parameter here. The symbol
 $\unicode[STIX]{x1D701}$
represents the uncertainty variable.
$\unicode[STIX]{x1D701}$
represents the uncertainty variable.
A single FOV is chosen to represent the uncertainty of the results presented herein. Table 10 in Neal et al. (Reference Neal, Sciacchitano, Smith and Scarano2015) displays the relative error of traditional PIV systems in various locations traversing away from a laminar/turbulent jet. In the region where vortex roll up occurs the error magnitude of the normal stresses was nearly 4.1 %. Beyond that point, in a fully developed turbulent region, the error rose slightly to just under 5 %. These results suggest that the fluctuations associated with vortex roll up, in combination with substantial mean shear, determine a significant portion of the relative error. As such, a similar location in the current study should give a conservative estimate of the PIV uncertainty data. The analogous location in the current study is the area where the KH vortices are first observed, or the FOV nearest the leading edge corner. Furthermore, as will be shown later, the peak turbulent fluctuations move upstream with Reynolds number. Thus, UQ is considered for each of the normal stresses at the highest Reynolds number tested at the leading edge corner.
Following the derivations in Sciacchitano & Wieneke (Reference Sciacchitano and Wieneke2016), a good estimate for the uncertainty for the normal streamwise stress fields is given as
 $$\begin{eqnarray}\displaystyle \unicode[STIX]{x1D701}\,_{\overline{u^{\prime }u^{\prime }}}=\overline{u^{\prime }u^{\prime }}\sqrt{{\displaystyle \frac{2}{N}}}. & & \displaystyle\end{eqnarray}$$
A similar expression to (3.1) can also be written for the normal stresses in the perpendicular direction. To demonstrate the magnitude of errors contributing to the analysis herein, figure 3 is presented. Figures 3(a) and 3(b) present the scalar fields of the stresses
 $\overline{u^{\prime }u^{\prime }}$
and
$\overline{u^{\prime }u^{\prime }}$
and
 $\overline{v^{\prime }v^{\prime }}$
, respectively, where figures 3(c) and 3(d) are the results of the corresponding versions of (3.1). Figures 3(c) and 3(d) show that the uncertainty of the stress field scales with the magnitude of the signal, with the maximum uncertainty level occurring approximately at the same location as the peak stress. For both
$\overline{v^{\prime }v^{\prime }}$
, respectively, where figures 3(c) and 3(d) are the results of the corresponding versions of (3.1). Figures 3(c) and 3(d) show that the uncertainty of the stress field scales with the magnitude of the signal, with the maximum uncertainty level occurring approximately at the same location as the peak stress. For both
 $\overline{u^{\prime }u^{\prime }}$
and
$\overline{u^{\prime }u^{\prime }}$
and
 $\overline{v^{\prime }v^{\prime }}$
components, the uncertainty varies between 1 % and 4 % of the corresponding stress value based on a single standard deviation. As such, constructing a 95 % confidence interval at each point necessitates a factor 2 applied to the uncertainties. In the following sections, uncertainty bands of a 95 % confidence interval are included where relevant.
$\overline{v^{\prime }v^{\prime }}$
components, the uncertainty varies between 1 % and 4 % of the corresponding stress value based on a single standard deviation. As such, constructing a 95 % confidence interval at each point necessitates a factor 2 applied to the uncertainties. In the following sections, uncertainty bands of a 95 % confidence interval are included where relevant.

Figure 3. Uncertainty calculations. (a,b) Normal stresses, (c,d) uncertainties of normal stresses. All fields are normalized by
 $U_{\infty }^{2}$
.
$U_{\infty }^{2}$
.
 $Re_{h}=1.18\times 10^{5}$
.
$Re_{h}=1.18\times 10^{5}$
.
The second source of error considered relates to the positions of the hot-wire probes. As will be discussed in subsequent sections, various hot-wire measurements were carried out using specific points observed using the PIV data. There is some level of human error in the relative positions of the origins between these two set-ups. The origin according to PIV measurements is defined optically with a resolution of the order of a pixel. Positional errors of the origin are assumed to be negligible. On the other hand, the origin of the hot-wire traverse system was defined manually, by eye. This process subjects the hot-wire position to a vertical bias of the order of
 $0.1$
mm. In the regions close to the leading edge corner, this bias may be of a similar order of the shear layer thickness. In those cases, the probe bias means that the probe is located on the high speed side of the shear layer (e.g. outside of any recirculation region), and resulting spectral amplitudes likely contain some attenuation as compared to those measured precisely on the centre of the shear layer. However, the relative changes observed along the arclength of the shear layer are significant enough that it is believed that this bias does not significantly change the overall narrative of the shear layers’ behaviour.
$0.1$
mm. In the regions close to the leading edge corner, this bias may be of a similar order of the shear layer thickness. In those cases, the probe bias means that the probe is located on the high speed side of the shear layer (e.g. outside of any recirculation region), and resulting spectral amplitudes likely contain some attenuation as compared to those measured precisely on the centre of the shear layer. However, the relative changes observed along the arclength of the shear layer are significant enough that it is believed that this bias does not significantly change the overall narrative of the shear layers’ behaviour.

Figure 4. Time-averaged streamlines (top) and vorticity contours (bottom) for (a) 5 : 1 section, and (b) 3 : 1 section and (c) 1 : 1.
 $Re_{h}=3.04\times 10^{4}$
.
$Re_{h}=3.04\times 10^{4}$
.
4 Results
Before diving into the detailed physics of the flow around these bluff sections, preliminary results are presented to show the major similarities and differences between unattached and reattaching shear layers. Figure 4 shows the time-averaged streamlines (shown on upper surface) as well as the vorticity contours (shown on lower surface) on the 5 : 1, 3 : 1 and 1 : 1 sections, respectively. For all sections, the vorticity distributions are concentrated at the leading edge and quickly diffuse into wider bands, which eventually approach the noise floor of the PIV system. The vorticity flux at the leading edge corner is similar for all sections, due mostly to the fact that the front face geometry is unchanged and so time-averaged circulation is generated almost exactly the same for each section. However, the intricate nature of the diffusion of vorticity helps differentiate between sections. For example, examining the trailing edge corner for all three sections quickly shows which of those experience mean reattachment. Both the 3 : 1 and 1 : 1 sections contain a small but distinct region of negative vorticity just upwind of the trailing edge. This results from flow near the base of the model separating off the trailing edge corner before flowing upstream as depicted in the recirculating streamlines. However, on the 5 : 1 section, no such region exists. On the contrary, if the saturation levels are reduced one even finds that there is a definitive region of positive vorticity in the analogous location that weakly increases in the streamwise direction indicating flow is attached as streamlines suggest.
Flow reattachment is seen through streamlines impinging on the surface of the 5 : 1 section at approximately
 $x/h=4.4$
, or just upstream of the trailing edge. This reattachment point defines the downstream limit of a finite-sized recirculation bubble on the surface. The topology of the recirculation region, similar to figure 4(a) has been one way of comparing data sets among investigators for 5 : 1 sections, especially in the numerical community. Table 10 in Bruno et al. (Reference Bruno, Salvetti and Ricciardelli2014) compiles an ensemble average of numerical data for similar Reynolds numbers to those tested here. There, the average reattachment is at
$x/h=4.4$
, or just upstream of the trailing edge. This reattachment point defines the downstream limit of a finite-sized recirculation bubble on the surface. The topology of the recirculation region, similar to figure 4(a) has been one way of comparing data sets among investigators for 5 : 1 sections, especially in the numerical community. Table 10 in Bruno et al. (Reference Bruno, Salvetti and Ricciardelli2014) compiles an ensemble average of numerical data for similar Reynolds numbers to those tested here. There, the average reattachment is at
 $x/h=4.7$
, which is in fair agreement with the current experiments. Furthermore, the centre of recirculation is observed here at
$x/h=4.7$
, which is in fair agreement with the current experiments. Furthermore, the centre of recirculation is observed here at
 $(x/h,y/h)=(2.51,-0.36)$
, which is well within one standard deviation of the ensemble average of those data,
$(x/h,y/h)=(2.51,-0.36)$
, which is well within one standard deviation of the ensemble average of those data,
 $(x/h,y/h)=(2.27,-0.304)$
. Conversely, the 3 : 1 and 1 : 1 sections have no such reattachment point as observed by streamlines bypassing the trailing edge and entering the wake. A lack of reattachment means that any shedding in the wake directly affects the instantaneous streamlines as well as the vorticity band in the lateral direction giving the square’s shear layer the notorious flapping motion. While the 5 : 1 section still has trailing edge separation, the shear layer bounding the recirculation bubble is less affected by the shedding in the wake. Figure 4 shows that the shear layer and wake region are likely less coupled on the 5 : 1 section than on its bluffer counterparts. By first observing shear layer behaviour on the 5 : 1 section, the influence of the wake can be further understood and applied to more complicated flow topologies like those on the 3 : 1 and the 1 : 1 sections, in particular.
$(x/h,y/h)=(2.27,-0.304)$
. Conversely, the 3 : 1 and 1 : 1 sections have no such reattachment point as observed by streamlines bypassing the trailing edge and entering the wake. A lack of reattachment means that any shedding in the wake directly affects the instantaneous streamlines as well as the vorticity band in the lateral direction giving the square’s shear layer the notorious flapping motion. While the 5 : 1 section still has trailing edge separation, the shear layer bounding the recirculation bubble is less affected by the shedding in the wake. Figure 4 shows that the shear layer and wake region are likely less coupled on the 5 : 1 section than on its bluffer counterparts. By first observing shear layer behaviour on the 5 : 1 section, the influence of the wake can be further understood and applied to more complicated flow topologies like those on the 3 : 1 and the 1 : 1 sections, in particular.
The rapid diffusion and dissipation of the vorticity first observed in figure 4 is concurrent with an equally rapid accumulation of unsteadiness. This is seen quantitatively in figure 5(a) using the downstream evolution of the integrated spanwise vorticity. The spanwise vorticity is integrated in the wall-normal direction in order to show the total amount at a given streamwise location. This integral could also be thought of as the circulation per unit width
 $\unicode[STIX]{x1D6E4}^{\prime }$
. For all three bodies, the integrated quantity is a maximum near the upstream corner, with the square having slightly higher levels. Farther along the body
$\unicode[STIX]{x1D6E4}^{\prime }$
. For all three bodies, the integrated quantity is a maximum near the upstream corner, with the square having slightly higher levels. Farther along the body
 $\unicode[STIX]{x1D6E4}^{\prime }$
decays until a distance equal to the body height,
$\unicode[STIX]{x1D6E4}^{\prime }$
decays until a distance equal to the body height,
 $x/h=1$
, where the curves appear to collapse onto one another. The additional integrated vorticity for the 1 : 1 section is due to the lack of reattachment. For infinitely long sections, vorticity generation and the flux passing the leading edge corner is a steady process. Increasingly bluff sections, with shedding in the wake, introduce periodic accelerations of the shear layer at the leading edge corner. Although the diffusion process of vorticity is much slower than its generation, the decaying nature of vorticity makes it difficult to track over long distances. Vorticity is generated in the presence of a wall, so it is natural to expect a separated flow, such as the one considered here, to diffuse the accumulated amount. The current PIV measurements maintain a relatively high level of accuracy at small scales (i.e. high spatial resolution) and yet the discretized nature of the data introduces numerical error into the vorticity fields and eventually the signal is lost to noise. Therefore, it is more instructive to inspect two-dimensional turbulent kinetic energy (TKE) when analysing the shear layer’s behaviour. Figure 5(b) shows a similar integration scheme applied to the TKE,
$x/h=1$
, where the curves appear to collapse onto one another. The additional integrated vorticity for the 1 : 1 section is due to the lack of reattachment. For infinitely long sections, vorticity generation and the flux passing the leading edge corner is a steady process. Increasingly bluff sections, with shedding in the wake, introduce periodic accelerations of the shear layer at the leading edge corner. Although the diffusion process of vorticity is much slower than its generation, the decaying nature of vorticity makes it difficult to track over long distances. Vorticity is generated in the presence of a wall, so it is natural to expect a separated flow, such as the one considered here, to diffuse the accumulated amount. The current PIV measurements maintain a relatively high level of accuracy at small scales (i.e. high spatial resolution) and yet the discretized nature of the data introduces numerical error into the vorticity fields and eventually the signal is lost to noise. Therefore, it is more instructive to inspect two-dimensional turbulent kinetic energy (TKE) when analysing the shear layer’s behaviour. Figure 5(b) shows a similar integration scheme applied to the TKE,
 $$\begin{eqnarray}\displaystyle \tilde{E}={\textstyle \frac{1}{2}}(\overline{u^{\prime }u^{\prime }}+\overline{v^{\prime }v^{\prime }}), & & \displaystyle\end{eqnarray}$$
where
 $u^{\prime }$
and
$u^{\prime }$
and
 $v^{\prime }$
correspond to the fluctuating components of velocity in
$v^{\prime }$
correspond to the fluctuating components of velocity in
 $x$
and
$x$
and
 $y$
directions, respectively. While vorticity in this flow field is generated under a non-uniform pressure gradient along the front face,
$y$
directions, respectively. While vorticity in this flow field is generated under a non-uniform pressure gradient along the front face,
 $\tilde{E}$
is generated anywhere there are fluctuations in the presence of a mean velocity gradient, regardless of the proximity of a wall surface. This can be shown by inspecting the production,
$\tilde{E}$
is generated anywhere there are fluctuations in the presence of a mean velocity gradient, regardless of the proximity of a wall surface. This can be shown by inspecting the production,
 ${\mathcal{P}}$
, of the turbulent kinetic energy transport equation for an incompressible flow in two dimensions,
${\mathcal{P}}$
, of the turbulent kinetic energy transport equation for an incompressible flow in two dimensions,
 $$\begin{eqnarray}\displaystyle -\overline{{\mathcal{P}}}=\overline{u^{\prime }u^{\prime }}{\displaystyle \frac{\unicode[STIX]{x2202}\overline{U}}{\unicode[STIX]{x2202}x}}+\overline{u^{\prime }v^{\prime }}\left({\displaystyle \frac{\unicode[STIX]{x2202}\overline{U}}{\unicode[STIX]{x2202}y}}+{\displaystyle \frac{\unicode[STIX]{x2202}\overline{V}}{\unicode[STIX]{x2202}x}}\right)+\overline{v^{\prime }v^{\prime }}{\displaystyle \frac{\unicode[STIX]{x2202}\overline{V}}{\unicode[STIX]{x2202}y}}, & & \displaystyle\end{eqnarray}$$
where the sum of the four terms is total turbulent production, and is everywhere greater than zero.
Equation (4.2) clearly shows that as long as there is mean shear sustained along the body in addition to some level of fluctuations, turbulent kinetic energy will be produced along the entire length of the shear layer. Figure 5(b) verifies this by showing increasing levels of
 $\tilde{E}$
for each section, indicating a high level of
$\tilde{E}$
for each section, indicating a high level of
 $\tilde{E}$
production. The growth rate of
$\tilde{E}$
production. The growth rate of
 $\tilde{E}$
for the 1 : 1 square is significantly higher than the longer sections, indicating a much more unsteady flow field. The reasons for this increased unsteadiness are similar to the increased levels of vorticity generation discussed earlier. The steep decline in integrated vorticity concurrent with increasing levels of
$\tilde{E}$
for the 1 : 1 square is significantly higher than the longer sections, indicating a much more unsteady flow field. The reasons for this increased unsteadiness are similar to the increased levels of vorticity generation discussed earlier. The steep decline in integrated vorticity concurrent with increasing levels of
 $\tilde{E}$
points to the rapid conversion of rotational energy housed within the front face boundary layer toward unsteadiness in the shear layer. In recognition of this, as well as an improved amplitude and signal to noise ratio using
$\tilde{E}$
points to the rapid conversion of rotational energy housed within the front face boundary layer toward unsteadiness in the shear layer. In recognition of this, as well as an improved amplitude and signal to noise ratio using
 $\tilde{E}$
, the remainder of this study makes use of turbulent kinetic energy in order to track the behaviour of the shear layer, especially in areas near the leading edge corner.
$\tilde{E}$
, the remainder of this study makes use of turbulent kinetic energy in order to track the behaviour of the shear layer, especially in areas near the leading edge corner.

Figure 5. Downstream evolution of (a) vertically averaged spanwise vorticity, and (b) vertically averaged turbulent kinetic energy. Every fourth point is plotted.
The distributions of velocity components, along with distributions of vorticity are shown in figures 6(a)–6(c), respectively, for the 5 : 1 section. Both mean shear and unsteadiness support the production of turbulent kinetic energy. The velocity profiles near the leading edge in figure 6(a) exhibit high velocity gradients near the wall close to the leading edge corner. The location of the inflection point coincides with the peaks of the spanwise vorticity in figure 6(b). Moreover, the vorticity profiles indicate high concentrations near the corner, diffusing rapidly farther downstream. Appealing to the stresses (figure 6
c), the growth of
 $\tilde{E}$
(shown previously in figure 5
b) is evident, whereas the vorticity is quick to diffuse and dissipate. The most drastic accumulation of normal stresses appears to occur near the leading edge corner (between
$\tilde{E}$
(shown previously in figure 5
b) is evident, whereas the vorticity is quick to diffuse and dissipate. The most drastic accumulation of normal stresses appears to occur near the leading edge corner (between
 $0<x/h<0.5$
in figure 6
c), consistent with the fact that the source of the fluctuations is the corner itself. Once the peaks are observed, the amplitudes increase only slightly between subsequent profiles, yet the wall-normal extent of the distributions expands continuously. Reasons for this expansion in wall-normal unsteadiness, as will be addressed in detail in later sections, relate to the entrainment of the shear layer. Additional stress magnitudes point toward an unsteady shear layer that consumes ambient fluid from both sides of the shear layer which erodes the steep gradients seen in the mean velocity profiles as well as stresses. Distributions of
$0<x/h<0.5$
in figure 6
c), consistent with the fact that the source of the fluctuations is the corner itself. Once the peaks are observed, the amplitudes increase only slightly between subsequent profiles, yet the wall-normal extent of the distributions expands continuously. Reasons for this expansion in wall-normal unsteadiness, as will be addressed in detail in later sections, relate to the entrainment of the shear layer. Additional stress magnitudes point toward an unsteady shear layer that consumes ambient fluid from both sides of the shear layer which erodes the steep gradients seen in the mean velocity profiles as well as stresses. Distributions of
 $\overline{u^{\prime }u^{\prime }}$
are everywhere higher than
$\overline{u^{\prime }u^{\prime }}$
are everywhere higher than
 $\overline{v^{\prime }v^{\prime }}$
, although the location of their maximum values align well with each other. The Reynolds shear stress,
$\overline{v^{\prime }v^{\prime }}$
, although the location of their maximum values align well with each other. The Reynolds shear stress,
 $\overline{u^{\prime }v^{\prime }}$
, which is not shown here, has magnitudes significantly less than the normal stress counterparts.
$\overline{u^{\prime }v^{\prime }}$
, which is not shown here, has magnitudes significantly less than the normal stress counterparts.

Figure 6. Wall-normal profiles of (a) time-averaged streamwise velocity, (b) time-averaged spanwise vorticity and (c) normal stresses for the 5 : 1 section.
 $Re_{h}=3.04\times 10^{4}$
.
$Re_{h}=3.04\times 10^{4}$
.
The role of the Reynolds stresses in turbulent production has been shown to dominate over the normal stresses in the production of turbulent energy, most clearly demonstrated by Cantwell & Coles (Reference Cantwell and Coles1983) in the near wake of a circular cylinder. However, as shown in figure 7, it appears that the cross-terms associated with the Reynolds stress are secondary in the production of
 $\tilde{E}$
within the current coordinate system. Figure 7 shows profiles of each component of
$\tilde{E}$
within the current coordinate system. Figure 7 shows profiles of each component of
 $\overline{{\mathcal{P}}}$
at four different locations between the first two profiles in figure 6, where the onset of unsteadiness occurs. At the first position,
$\overline{{\mathcal{P}}}$
at four different locations between the first two profiles in figure 6, where the onset of unsteadiness occurs. At the first position,
 $x/h=0.02$
, a small net-negative product is detected in figure 7(a) and 7(c). This is seemingly balanced by figures 7(b) and 7(d) where the peak is in the same location along the
$x/h=0.02$
, a small net-negative product is detected in figure 7(a) and 7(c). This is seemingly balanced by figures 7(b) and 7(d) where the peak is in the same location along the
 $y$
-axis with opposing sign. The summed result in the rightmost panel, figure 7(e), shows a negligible amount of turbulent production at
$y$
-axis with opposing sign. The summed result in the rightmost panel, figure 7(e), shows a negligible amount of turbulent production at
 $x/h=0.02$
. This is consistent with the relative lack of peaks at the same location in figure 6(c) or even integrated
$x/h=0.02$
. This is consistent with the relative lack of peaks at the same location in figure 6(c) or even integrated
 $\tilde{E}$
as seen in figure 5. At greater downstream distances (
$\tilde{E}$
as seen in figure 5. At greater downstream distances (
 $x/h=0.1,x/h=0.2$
), all four terms of
$x/h=0.1,x/h=0.2$
), all four terms of
 ${\mathcal{P}}$
increase in amplitude before diffusing in the wall-normal direction by
${\mathcal{P}}$
increase in amplitude before diffusing in the wall-normal direction by
 $x/h=0.4$
. Among the four components across this range, figure 7(a) appears to contribute the most to the overall amount of
$x/h=0.4$
. Among the four components across this range, figure 7(a) appears to contribute the most to the overall amount of
 $\overline{{\mathcal{P}}}$
, indicating that terms associated with streamwise gradients and/or streamwise normal stresses are most responsible for the initial production of
$\overline{{\mathcal{P}}}$
, indicating that terms associated with streamwise gradients and/or streamwise normal stresses are most responsible for the initial production of
 $\tilde{E}$
on the 5 : 1 section.
$\tilde{E}$
on the 5 : 1 section.

Figure 7. Turbulent production terms. (a–d) are profiles of each of the terms in (4.2) respectively, where (e) represents the total production. Every third point plotted.
The average trajectory of the shear layer can be defined using any of the four parameters discussed in figure 6 with only minor discrepancies among them. In the current study, the average position of the shear layer is defined using maxima of
 $\tilde{E}$
as shown in figure 8. The figure shows the locus of maximum turbulent kinetic energy values,
$\tilde{E}$
as shown in figure 8. The figure shows the locus of maximum turbulent kinetic energy values,
 $\tilde{E}_{max}$
, for all Reynolds numbers tested on all sections tested. It is remarkable that a decade of Reynolds number data collapse onto thin bands for each section, demonstrating an invariance of the shear layers’ average position. The data show the location for the 1 : 1 square, which is heavily curved throughout the entire body length and enters the wake at a significant angle with respect to the mean flow. The longer 5 : 1 section boasts a more extended shear layer trajectory (see labels in the figure), which is initially curved but then relaxes to fall in line with the mean flow as it passes the trailing edge. Moreover, it is worth pointing out that while the streamlines in figure 4 show flow reattachment near the trailing edge, the shear layer, as defined here, does not. It is hypothesized that sections much longer than
$\tilde{E}_{max}$
, for all Reynolds numbers tested on all sections tested. It is remarkable that a decade of Reynolds number data collapse onto thin bands for each section, demonstrating an invariance of the shear layers’ average position. The data show the location for the 1 : 1 square, which is heavily curved throughout the entire body length and enters the wake at a significant angle with respect to the mean flow. The longer 5 : 1 section boasts a more extended shear layer trajectory (see labels in the figure), which is initially curved but then relaxes to fall in line with the mean flow as it passes the trailing edge. Moreover, it is worth pointing out that while the streamlines in figure 4 show flow reattachment near the trailing edge, the shear layer, as defined here, does not. It is hypothesized that sections much longer than
 $L/h=5$
will see the trajectory of
$L/h=5$
will see the trajectory of
 $\tilde{E}_{max}$
approach and reside adjacent to the surface inside the secondary boundary layer formed downstream of the reattachment point. However, here, the influence from the wake appears to keep the locations of the most unsteadiness some distance away from the surface. In any case, the collapse of all Reynolds number data for each section enables a fit line to be generated and relayed to the hot-wire traverse and measurement system.
$\tilde{E}_{max}$
approach and reside adjacent to the surface inside the secondary boundary layer formed downstream of the reattachment point. However, here, the influence from the wake appears to keep the locations of the most unsteadiness some distance away from the surface. In any case, the collapse of all Reynolds number data for each section enables a fit line to be generated and relayed to the hot-wire traverse and measurement system.

Figure 8. Locus of maximum TKE,
 $\tilde{E}_{max}$
, over all Reynolds numbers and aspect ratios tested.
$\tilde{E}_{max}$
, over all Reynolds numbers and aspect ratios tested.
 $1.34\times 10^{4}\leqslant Re_{h}\leqslant 1.18\times 10^{5}$
.
$1.34\times 10^{4}\leqslant Re_{h}\leqslant 1.18\times 10^{5}$
.
4.1 Shear layer coupling
As mentioned above, the averaged trajectory of
 $\tilde{E}_{max}$
for each section was used to define the locations where the hot-wire measurements were obtained. The hot-wire data from these trajectories reveal details about the spectral content within the shear layer. For each case, the two hot-wire probes were mechanically traversed along the mean shear layer trajectories. Figure 9 shows a sample of the power spectra for both sections (5 : 1 and 1 : 1) at two different positions along the shear layer. For both bodies, the lighter curve shows the power spectrum of the hot-wire probe taken directly adjacent to the leading edge, where the origin is defined using the PIV system as the leading edge corner. The hot-wire system thus is inherently offset in order to avoid a collision of the probe. Near the leading edge, the spectra in both cases appear to have most of their energy concentrated toward the low-frequency end with a discrete concentration at the wake shedding frequency labelled
$\tilde{E}_{max}$
for each section was used to define the locations where the hot-wire measurements were obtained. The hot-wire data from these trajectories reveal details about the spectral content within the shear layer. For each case, the two hot-wire probes were mechanically traversed along the mean shear layer trajectories. Figure 9 shows a sample of the power spectra for both sections (5 : 1 and 1 : 1) at two different positions along the shear layer. For both bodies, the lighter curve shows the power spectrum of the hot-wire probe taken directly adjacent to the leading edge, where the origin is defined using the PIV system as the leading edge corner. The hot-wire system thus is inherently offset in order to avoid a collision of the probe. Near the leading edge, the spectra in both cases appear to have most of their energy concentrated toward the low-frequency end with a discrete concentration at the wake shedding frequency labelled
 $f_{VK}$
. Comparing the two sections, the 1 : 1 section has much more energy at
$f_{VK}$
. Comparing the two sections, the 1 : 1 section has much more energy at
 $f_{VK}$
due to the flapping of the fully separated shear layer. The spectra of the 5 : 1 section have less energy at the wake shedding frequency, which is a further evidence that the wake’s influence is smaller for this section. At some small but finite distance along the shear layer, at
$f_{VK}$
due to the flapping of the fully separated shear layer. The spectra of the 5 : 1 section have less energy at the wake shedding frequency, which is a further evidence that the wake’s influence is smaller for this section. At some small but finite distance along the shear layer, at
 $(x/h,y/h)=(0.174,-0.190)$
and (0.081,
$(x/h,y/h)=(0.174,-0.190)$
and (0.081,
 $-$
0.100) for the 5 : 1 and 1 : 1 sections respectively, the spectra change dramatically. In both cases a high frequency, with a broad banded peak, rises up several orders of magnitude compared to the signals taken upstream at the corner. This high-frequency content is labelled as
$-$
0.100) for the 5 : 1 and 1 : 1 sections respectively, the spectra change dramatically. In both cases a high frequency, with a broad banded peak, rises up several orders of magnitude compared to the signals taken upstream at the corner. This high-frequency content is labelled as
 $f_{KH}$
. Although its precise spatial definition is not easily described, as will be discussed in later sections, it is pointed out here qualitatively. One highlight is that, depending on the area of interest, there may be multiple competing modes, and the relative amplitude between
$f_{KH}$
. Although its precise spatial definition is not easily described, as will be discussed in later sections, it is pointed out here qualitatively. One highlight is that, depending on the area of interest, there may be multiple competing modes, and the relative amplitude between
 $f_{VK}$
and
$f_{VK}$
and
 $f_{KH}$
is one metric to evaluate the level of coupling between activity occurring in the wake and the KH instability originating at the leading edge.
$f_{KH}$
is one metric to evaluate the level of coupling between activity occurring in the wake and the KH instability originating at the leading edge.

Figure 9. Power spectra taken at the leading edge corner
 $(x/h,y/h)=(0,0)$
, and at
$(x/h,y/h)=(0,0)$
, and at
 $(x/h,y/h)=(a)(0.174,-0.190)$
for the 5 : 1, and (b) (0.081,
$(x/h,y/h)=(a)(0.174,-0.190)$
for the 5 : 1, and (b) (0.081,
 $-$
0.100) for the 1 : 1 sections.
$-$
0.100) for the 1 : 1 sections.
 $Re_{h}=3.04\times 10^{4}$
.
$Re_{h}=3.04\times 10^{4}$
.
Another way to quantify the level of coupling between the wake and shear layer regions is through cross-correlations using two hot-wire signals. Two-point measurements have been used by investigators in incompressible flows to extract details about features such as physical size, frequency and convective speed (Tennekes & Lumley Reference Tennekes and Lumley1972). Traditionally, two probes are separated in space and the cross-correlation function is calculated using the two simultaneously acquired signals normalized by the product of their standard deviations,
 $$\begin{eqnarray}\displaystyle \unicode[STIX]{x1D70C}(\unicode[STIX]{x0394}x,\unicode[STIX]{x0394}y,t)={\displaystyle \frac{u_{mag,\,1}^{\prime }(x,y,t)\,u_{mag,\,2}^{\prime }(x+\unicode[STIX]{x0394}x,y+\unicode[STIX]{x0394}y,t)}{\sqrt{\overline{{u^{\prime }}^{2}}_{mag,\,1}}\,\sqrt{\overline{{u^{\prime }}^{2}}_{mag,\,2}}}}. & & \displaystyle\end{eqnarray}$$

Figure 10. Cross-correlation coefficients along the length of the three sections. Direction of increasing
 $\unicode[STIX]{x0394}x$
is indicated in the upper centre portion of the figure.
$\unicode[STIX]{x0394}x$
is indicated in the upper centre portion of the figure.
 $Re_{h}=3.04\times 10^{4}$
.
$Re_{h}=3.04\times 10^{4}$
.
In this case, the two signals are velocity magnitudes measured by the hot-wires. As seen in (4.3), the value of
 $\unicode[STIX]{x1D70C}$
is dimensionless, decaying with increasing separation distance at zero time shift from
$\unicode[STIX]{x1D70C}$
is dimensionless, decaying with increasing separation distance at zero time shift from
 $\unicode[STIX]{x1D70C}(0,0,0)=1$
according to Schwartz’s inequality for stationary signals. Since the wires must maintain a small separation distance in order to avoid collision, the resulting coefficient can only approach unity at small distances
$\unicode[STIX]{x1D70C}(0,0,0)=1$
according to Schwartz’s inequality for stationary signals. Since the wires must maintain a small separation distance in order to avoid collision, the resulting coefficient can only approach unity at small distances
 $\unicode[STIX]{x0394}x$
,
$\unicode[STIX]{x0394}x$
,
 $\unicode[STIX]{x0394}y$
. Here, the two hot-wire probes were placed on the shear layers’ average trajectory with a single wire fixed in the plane of the trailing edge and the other was traversed along the previously mentioned trajectory of maximum TKE, in the direction upstream of the fixed probe. The cross-correlation coefficients were found as a function of
$\unicode[STIX]{x0394}y$
. Here, the two hot-wire probes were placed on the shear layers’ average trajectory with a single wire fixed in the plane of the trailing edge and the other was traversed along the previously mentioned trajectory of maximum TKE, in the direction upstream of the fixed probe. The cross-correlation coefficients were found as a function of
 $\unicode[STIX]{x0394}x/h$
or the distance upstream from the fixed probe, and are presented in figure 10. As can be seen in the figure, the correlation coefficient for each body is close to unity when the probes are very close to each other in the wake, as one might expect since the probes are at their closest. As the travelling probe was traverses upstream along the shear layer, i.e. increasing
$\unicode[STIX]{x0394}x/h$
or the distance upstream from the fixed probe, and are presented in figure 10. As can be seen in the figure, the correlation coefficient for each body is close to unity when the probes are very close to each other in the wake, as one might expect since the probes are at their closest. As the travelling probe was traverses upstream along the shear layer, i.e. increasing
 $\unicode[STIX]{x0394}x/h$
, the correlation coefficients decrease as the distance between probes increased. Note that here, the sign of
$\unicode[STIX]{x0394}x/h$
, the correlation coefficients decrease as the distance between probes increased. Note that here, the sign of
 $\unicode[STIX]{x0394}x$
is inverted in comparison to
$\unicode[STIX]{x0394}x$
is inverted in comparison to
 $x$
, which is a necessary arrangement to distinguish between convective and global instabilities. Aligning the two probes at the trailing edge and moving one upstream tracks the upstream influence of global instabilities only, since convective instabilities are directional and thus depend on the convective speeds and times in the flow. Moving the travelling probe upstream from that initial location and extracting the correlation value at zero time lag then documents how far upstream the global behaviour of the VK instability extends at a given instant in time.
$x$
, which is a necessary arrangement to distinguish between convective and global instabilities. Aligning the two probes at the trailing edge and moving one upstream tracks the upstream influence of global instabilities only, since convective instabilities are directional and thus depend on the convective speeds and times in the flow. Moving the travelling probe upstream from that initial location and extracting the correlation value at zero time lag then documents how far upstream the global behaviour of the VK instability extends at a given instant in time.
For the 1 : 1 section, the correlation coefficient remains above 50 % everywhere along the shear layer, indicating a relatively high level of correlation, suggesting that the wake’s influence is significant all the way to the leading edge. Sections with extended afterbodies such as the 3 : 1 and 5 : 1, show correlation coefficients continuing to decay with upstream distance for more than one body height upstream. The 5 : 1 section in particular is nearly zero near the leading edge, demonstrating that the two probes experience two independent and uncorrelated signals. As such, it may be expected that the wake’s influence is significantly smaller for the 5 : 1 section than for the 1 : 1 section.
Figure 11 presents the spatial correlations with hot-wire signals filtered before the correlation coefficient was calculated. When the high pass filter (with a cutoff frequency at
 $fh/U_{\infty }=0.39$
, nearly
$fh/U_{\infty }=0.39$
, nearly
 $3.5$
times the Strouhal number,
$3.5$
times the Strouhal number,
 $St$
) was applied, the coefficients reflect the correlation associated with shear layer content only. In the case of the 1 : 1 square section (figure 11
b), the high pass filter shows no correlation between the signals at leading and trailing edges. Low pass filtering at the same cutoff frequency has the opposite effect. Isolating low-frequency content associated with the wake shedding raises coefficients, demonstrating an increased global coherence, a direct result of the upstream propagation of instability waves associated with the wake instability. This is most clearly seen with the 1 : 1 square. In addition to a net offset of increased coherence for all measured locations, the differences between leading and trailing edge are reduced for the low pass filtered data in comparison to the highpass filtered data. Physically, this points toward the low-frequency dominance associated with the global instability from wake shedding. In either case, it is clear that there are two primary frequency components, the first being low frequencies that appear to be coherent, meaning their correlation coefficients extend far upstream from their source. The second component is the high frequency shear layer content, less correlated over the length of the shear layer. Of these, the low and high-frequency regimes appear to be less coupled for the 5 : 1 section, as shown by the lack of correlation at the leading edge of the 5 : 1 section (figure 11
a). Therefore, the interactions between the two modes of instability are examined primarily through the use of the 5 : 1 section as the two modes are more independent of one another. All sections, however, display clearly that the shear layers’ frequency content is heavily dependent on the spatial location. That spatial dependence also includes Reynolds number effects as will be discussed in the next section.
$St$
) was applied, the coefficients reflect the correlation associated with shear layer content only. In the case of the 1 : 1 square section (figure 11
b), the high pass filter shows no correlation between the signals at leading and trailing edges. Low pass filtering at the same cutoff frequency has the opposite effect. Isolating low-frequency content associated with the wake shedding raises coefficients, demonstrating an increased global coherence, a direct result of the upstream propagation of instability waves associated with the wake instability. This is most clearly seen with the 1 : 1 square. In addition to a net offset of increased coherence for all measured locations, the differences between leading and trailing edge are reduced for the low pass filtered data in comparison to the highpass filtered data. Physically, this points toward the low-frequency dominance associated with the global instability from wake shedding. In either case, it is clear that there are two primary frequency components, the first being low frequencies that appear to be coherent, meaning their correlation coefficients extend far upstream from their source. The second component is the high frequency shear layer content, less correlated over the length of the shear layer. Of these, the low and high-frequency regimes appear to be less coupled for the 5 : 1 section, as shown by the lack of correlation at the leading edge of the 5 : 1 section (figure 11
a). Therefore, the interactions between the two modes of instability are examined primarily through the use of the 5 : 1 section as the two modes are more independent of one another. All sections, however, display clearly that the shear layers’ frequency content is heavily dependent on the spatial location. That spatial dependence also includes Reynolds number effects as will be discussed in the next section.
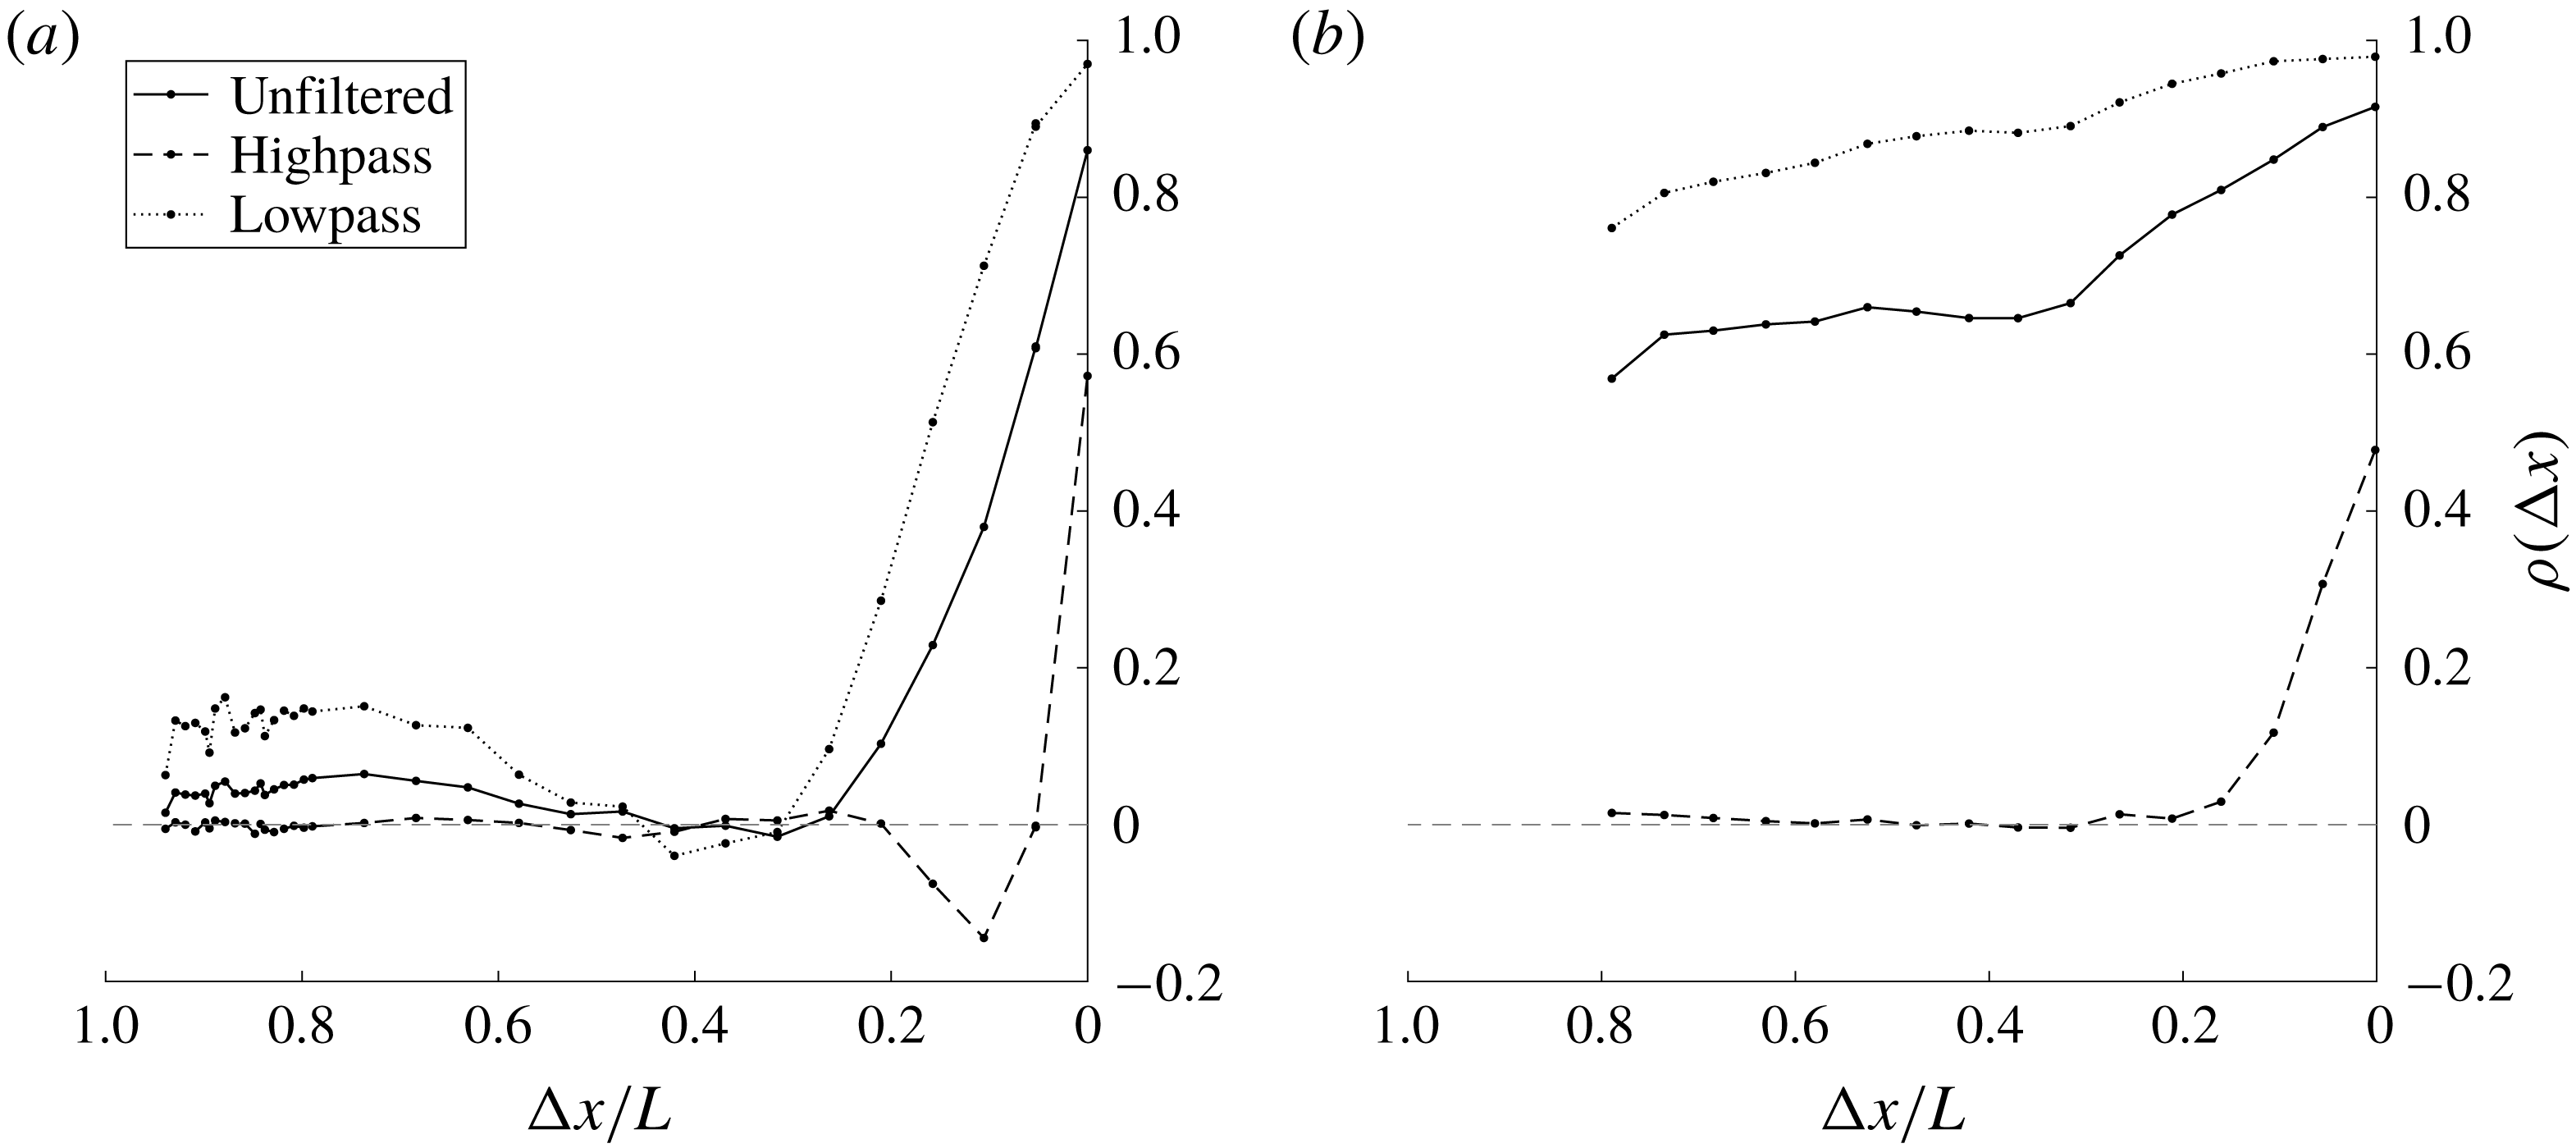
Figure 11. Highpass and lowpass filtered correlations for (a) the 5 : 1 section, and (b) the 1 : 1 square section. Sign conventions are same as figure 10.
4.2 Reynolds number dependency
Figure 12 shows the dependence of the shear layer frequency on Reynolds number for the sections tested. Figure 12(a–c) presents the Strouhal number,
 $St=f_{VK}h/U_{\infty }$
for the 1 : 1, 3 : 1 and 5 : 1 sections, respectively, over Reynolds numbers. For each section, the Strouhal number is nearly constant over a wide range of Reynolds numbers. This Reynolds number invariance is attributed to a linear correspondence between the vortex shedding frequency in the wake,
$St=f_{VK}h/U_{\infty }$
for the 1 : 1, 3 : 1 and 5 : 1 sections, respectively, over Reynolds numbers. For each section, the Strouhal number is nearly constant over a wide range of Reynolds numbers. This Reynolds number invariance is attributed to a linear correspondence between the vortex shedding frequency in the wake,
 $f_{VK}$
, and the free-stream velocity,
$f_{VK}$
, and the free-stream velocity,
 $U_{\infty }$
. In figure 12(d) the variation of the ratio of the shear layer’s frequency to the wake’s frequency,
$U_{\infty }$
. In figure 12(d) the variation of the ratio of the shear layer’s frequency to the wake’s frequency,
 $f_{KH}/f_{VK}$
, with Reynolds number is shown along with data from relevant literature. It is immediately obvious that the shear layer’s frequency does not vary linearly with wind speed (assuming a common reference length for the Reynolds numbers). Instead, the curves abide by a power law relationship,
$f_{KH}/f_{VK}$
, with Reynolds number is shown along with data from relevant literature. It is immediately obvious that the shear layer’s frequency does not vary linearly with wind speed (assuming a common reference length for the Reynolds numbers). Instead, the curves abide by a power law relationship,
 $Re^{n}$
, with exponents ranging upwards from
$Re^{n}$
, with exponents ranging upwards from
 $n=0.5$
as first noted by Bloor (Reference Bloor1964). The best-fit value of
$n=0.5$
as first noted by Bloor (Reference Bloor1964). The best-fit value of
 $n$
is given a physical justification for a circular prism (
$n$
is given a physical justification for a circular prism (
 $n=0.67$
) in Prasad & Williamson (Reference Prasad and Williamson1997) and extended to the square prism (
$n=0.67$
) in Prasad & Williamson (Reference Prasad and Williamson1997) and extended to the square prism (
 $n=0.60$
) in Lander et al. (Reference Lander, Moore, Letchford and Amitay2018). It is interesting that all geometries fit well with a power law; however, both the exponent and the coefficient are different for each prism geometry. These differences may be explained by considering the dynamics at separation for each body. For any geometry, the shedding frequency of the KH events near separation ought to scale inversely with the thickness of the separating boundary layer. In zero or adverse pressure gradients, such as the separation point on a circular prism, the thickness is larger than that of a boundary layer separating under an highly favourable pressure gradient such as the front face of a square prism. This reduction in boundary layer thickness may explain the initial offset of each of the curves. It is precisely these intricacies of the shear layer, with a shared dependence on spatial coordinate and free-stream Reynolds number, that provoke the curiosity of the authors and warrant a deeper investigation into their natural behaviour.
$n=0.60$
) in Lander et al. (Reference Lander, Moore, Letchford and Amitay2018). It is interesting that all geometries fit well with a power law; however, both the exponent and the coefficient are different for each prism geometry. These differences may be explained by considering the dynamics at separation for each body. For any geometry, the shedding frequency of the KH events near separation ought to scale inversely with the thickness of the separating boundary layer. In zero or adverse pressure gradients, such as the separation point on a circular prism, the thickness is larger than that of a boundary layer separating under an highly favourable pressure gradient such as the front face of a square prism. This reduction in boundary layer thickness may explain the initial offset of each of the curves. It is precisely these intricacies of the shear layer, with a shared dependence on spatial coordinate and free-stream Reynolds number, that provoke the curiosity of the authors and warrant a deeper investigation into their natural behaviour.

Figure 12. Variation of the Strouhal number with Reynolds number for the (a) 1 : 1, (b) 3 : 1 and (c) 5 : 1 sections. (d) The dependence of
 $f_{KH}/f_{VK}$
with Reynolds number.
$f_{KH}/f_{VK}$
with Reynolds number.
The data in previous sections have demonstrated the quantities of a separated shear layer that change significantly in space as well as with respect to Reynolds number. These dependencies are important when analysing shear layer behaviour as the relevant scales are not as predictable as those observed in the wake. Particular attention is noted for the leading edge corner where the spatial dependence is critical to understand the early stages of transition to turbulence. This region, which is founded qualitatively on the regimes in figure 1, is partially summarized in figure 13. Figure 13 shows the spatio-temporal dependence of the bluff body’s shear layer using both PIV and hot-wire. On the left-hand side, an instantaneous normalized spanwise vorticity field (
 $\overline{\unicode[STIX]{x1D714}}_{z}>20$
) is displayed near the leading edge corner of the 1 : 1 square section as a way to visualize the transition process. As a reference for the spatial extent of the image, the domain here is 0.84
$\overline{\unicode[STIX]{x1D714}}_{z}>20$
) is displayed near the leading edge corner of the 1 : 1 square section as a way to visualize the transition process. As a reference for the spatial extent of the image, the domain here is 0.84
 $h$
and 0.34
$h$
and 0.34
 $h$
in
$h$
in
 $x$
and
$x$
and
 $y$
directions, respectively.
$y$
directions, respectively.

Figure 13. An instantaneous vorticity field (a), and sample time histories and a reference length equal to one period of
 $f_{VK}$
(b) around the leading edge corner of a 1 : 1 (square) prism,
$f_{VK}$
(b) around the leading edge corner of a 1 : 1 (square) prism,
 $Re_{h}=3.04\times 10^{4}$
. Saturation level is set to
$Re_{h}=3.04\times 10^{4}$
. Saturation level is set to
 $\overline{\unicode[STIX]{x1D714}}_{z}=20.$
In the figure, a laminar shear layer is detected immediately after separation, near point A, similar to the results in figure 4. The shear layer quickly bends into the direction of the mean flow (left to right in the figure) and eventually rolls up in a counter-clockwise direction forming a laminar vortex, which can be detected near point E. Downstream of the vortex formation, vortex pairing can be detected, followed by a breakdown of the organized structures to smaller turbulent eddies. On the right hand side, five time traces are shown, one for each of the points labelled in the vorticity field. Initially, at point A, only one frequency can be seen, namely the
 $f_{VK}$
. This time trace is directly taken from time history used for the calculation of the power spectra in figure 9. Note that the
$f_{VK}$
. This time trace is directly taken from time history used for the calculation of the power spectra in figure 9. Note that the
 $f_{KH}$
frequency is not detected at this location, suggesting either the disturbance amplitude is below the resolution of the probe, or that the local Reynolds number is below the critical Reynolds number for transition to initiate. At point B, a much higher frequency can be observed as a small bursting event, intermittently spaced on the von Kármán signature. Point C shows the same high-frequency content becoming less intermittent. These are the early stages of shear layer transition (i.e. growth of disturbances) and the accumulation of energy at
$f_{KH}$
frequency is not detected at this location, suggesting either the disturbance amplitude is below the resolution of the probe, or that the local Reynolds number is below the critical Reynolds number for transition to initiate. At point B, a much higher frequency can be observed as a small bursting event, intermittently spaced on the von Kármán signature. Point C shows the same high-frequency content becoming less intermittent. These are the early stages of shear layer transition (i.e. growth of disturbances) and the accumulation of energy at
 $f_{KH}$
. Points B–D show the evolution of
$f_{KH}$
. Points B–D show the evolution of
 $f_{KH}$
as it grows in space along the shear layer and culminating at point E, where formation of a vortex marks the end of the linear growth. In essence, this sequence demonstrates how short the region is where linear growth of the shear layer instabilities is likely to be found.
$f_{KH}$
as it grows in space along the shear layer and culminating at point E, where formation of a vortex marks the end of the linear growth. In essence, this sequence demonstrates how short the region is where linear growth of the shear layer instabilities is likely to be found.
With a physical intuition established, we now shift to focus on comparing metrics and trends already established in the literature. The nonlinear Reynolds number dependencies within the shear layer behaviour were discussed with regard to the appropriate length scale in Bloor (Reference Bloor1964), as well as the corresponding time scales (Prasad & Williamson Reference Prasad and Williamson1997) and the combination of scales was then satisfied using the linear scaling in Lander et al. (Reference Lander, Moore, Letchford and Amitay2018) who also noted that a thinning boundary layer on the front face of the section mirrors the behaviour of shear layer transition lengths. In the following paragraphs it will further be shown that upon reducing the wake’s influence, the spatial amplification of disturbances reveals its own Reynolds number dependency. This is supportive of the idea that the shear layer behaves more similar to what may be expected of a boundary layer on the front face of the section, rather than an inviscid planar mixing layer alongside it. With these new details, a more comprehensive view of the bluff body shear layer arises, encouraging a holistic view of the bluff body flow field.
Unlike the planar mixing layer, the bluff body shear layer experiences external influences including intense curvature, potential viscous effects due to the proximity to a solid surface, and proximity to other instability modes. These factors serve to elevate growth rates and obscure comparisons made with the planar mixing layer literature. For example, the mixing layer behind a backward facing step was found to grow at two different rates according to Sato (Reference Sato1956), as well as experiments downstream of a splitter plate in Winant & Browand (Reference Winant and Browand1974). The junction between the two growth rates marked a transition point for a free shear layer with infinite boundary conditions. However, Lander et al. (Reference Lander, Moore, Letchford and Amitay2018) used a similar analysis for the 2-D square prism that showed a continuous distribution of momentum thickness both upstream and downstream of what is later defined as the transition point for the square prism. Extending that analysis, the shear layer width is defined in the current study using the momentum thickness found in Fiedler (Reference Fiedler1991), whose definition accounts for recirculating flows in local coordinates.
 $$\begin{eqnarray}\displaystyle \unicode[STIX]{x1D703}(s)=\int _{y_{1}^{\prime }}^{y_{2}^{\prime }}\left({\displaystyle \frac{\overline{U}_{s}(s,y^{\prime })-\overline{U}_{s,min}}{\overline{U}_{s,max}-\overline{U}_{s,min}}}\right)\left(1-{\displaystyle \frac{\overline{U}_{s}(s,y^{\prime })-\overline{U}_{s,min}}{\overline{U}_{s,max}-\overline{U}_{s,min}}}\right)\text{d}y^{\prime }. & & \displaystyle\end{eqnarray}$$
Schematics and representative profiles illustrating this transformation are given in Lander et al. (Reference Lander, Moore, Letchford and Amitay2018). The variable
 $y^{\prime }$
corresponds to the direction normal to the shear layer’s trajectory at each streamwise coordinate. The slope of that line is inversely proportional to the tangent angle of the shear layer trajectory, and approaches a Cartesian grid when the shear layer becomes aligned with the free stream. The variable,
$y^{\prime }$
corresponds to the direction normal to the shear layer’s trajectory at each streamwise coordinate. The slope of that line is inversely proportional to the tangent angle of the shear layer trajectory, and approaches a Cartesian grid when the shear layer becomes aligned with the free stream. The variable,
 $s$
, is the arc-length distance along the shear layer, and
$s$
, is the arc-length distance along the shear layer, and
 $\overline{U}_{s}$
is then the mean velocity in the local direction of the shear layer axis. Limits
$\overline{U}_{s}$
is then the mean velocity in the local direction of the shear layer axis. Limits
 $y_{1}$
and
$y_{1}$
and
 $y_{2}$
correspond to the locations where
$y_{2}$
correspond to the locations where
 $\overline{U}_{s,max}$
and
$\overline{U}_{s,max}$
and
 $\overline{U}_{s,min}$
are found. The resulting local alignment allows for the calculation of a host of lengths and velocities that are skewed when described using traditional Cartesian coordinates. By aligning with streamlines or main gradients in the flow, a curved shear layer can be geometrically unwrapped, ignoring any effect of the pressure field. In doing so, it appears that the main functionality so far has been to compare curved shear layers with the archetypal planar mixing layer scenario. The result, as mentioned above, is that growth rates of shear layers born from leading edge separation are substantially higher and continuous functions of the axial coordinate. The present study confirms the elevated growth rates for all sections tested.
$\overline{U}_{s,min}$
are found. The resulting local alignment allows for the calculation of a host of lengths and velocities that are skewed when described using traditional Cartesian coordinates. By aligning with streamlines or main gradients in the flow, a curved shear layer can be geometrically unwrapped, ignoring any effect of the pressure field. In doing so, it appears that the main functionality so far has been to compare curved shear layers with the archetypal planar mixing layer scenario. The result, as mentioned above, is that growth rates of shear layers born from leading edge separation are substantially higher and continuous functions of the axial coordinate. The present study confirms the elevated growth rates for all sections tested.
Figures 14(a) and 14(b) show the momentum thickness distributions for the 5 : 1 and 1 : 1 sections near the leading edge, respectively. In both cases, the coordinate system is local to the time-averaged shear layer position. The use of local coordinates is limited here to a single figure for comparison and validation purposes. In the figure, the continuously increasing nature of
 $\unicode[STIX]{x1D703}$
is clear in all cases. Focusing on figure 14(b), two curves from the present study are compared to similar Reynolds number cases explored by Lander et al. (Reference Lander, Moore, Letchford and Amitay2018). Data with similar Reynolds numbers for the 1 : 1 section match reasonably well. At higher Reynolds numbers, the agreement is better between the two data sets. At lower Reynolds numbers, there are differences in the two experiments beyond
$\unicode[STIX]{x1D703}$
is clear in all cases. Focusing on figure 14(b), two curves from the present study are compared to similar Reynolds number cases explored by Lander et al. (Reference Lander, Moore, Letchford and Amitay2018). Data with similar Reynolds numbers for the 1 : 1 section match reasonably well. At higher Reynolds numbers, the agreement is better between the two data sets. At lower Reynolds numbers, there are differences in the two experiments beyond
 $s/h=0.3$
, which may be due to the differences in blockage ratios between the two experiments, 9.1 % and 6.3 %, the later of the two corresponding to the current study. It is worth noting that, while not included here, a similar treatment of direct numerical simulation (DNS) data shown in that work at
$s/h=0.3$
, which may be due to the differences in blockage ratios between the two experiments, 9.1 % and 6.3 %, the later of the two corresponding to the current study. It is worth noting that, while not included here, a similar treatment of direct numerical simulation (DNS) data shown in that work at
 $Re_{h}=2.2\times 10^{4}$
from Trias, Gorobets & Oliva (Reference Trias, Gorobets and Oliva2015) falls between curves of the present study at
$Re_{h}=2.2\times 10^{4}$
from Trias, Gorobets & Oliva (Reference Trias, Gorobets and Oliva2015) falls between curves of the present study at
 $Re_{h}=1.34\times 10^{4}$
and Lander’s data at
$Re_{h}=1.34\times 10^{4}$
and Lander’s data at
 $Re_{h}=1.67\times 10^{4}$
. For the 5 : 1 section (figure 14
a), the shear layer evolution with Reynolds numbers is more compelling. As Reynolds number increases the magnitude of the exponent of a line of best fit,
$Re_{h}=1.67\times 10^{4}$
. For the 5 : 1 section (figure 14
a), the shear layer evolution with Reynolds numbers is more compelling. As Reynolds number increases the magnitude of the exponent of a line of best fit,
 $\unicode[STIX]{x1D703}\propto A\times (s/h)^{B}$
, decreases bringing the growth of the momentum thickness closer to a linear trend. Values extracted from a simple curve fitting procedure are listed in table 2.
$\unicode[STIX]{x1D703}\propto A\times (s/h)^{B}$
, decreases bringing the growth of the momentum thickness closer to a linear trend. Values extracted from a simple curve fitting procedure are listed in table 2.
The differences in shear layer development are more easily differentiated in the case of the 5 : 1 section. It appears that the reduced levels of coupling on the longer section more easily distinguish the true growth of the shear layer instability rather than the growth of a combination of instabilities as in the 1 : 1 body. This detail marks a departure from Lander’s work on the square prism. Nevertheless, all distributions of momentum thickness measured in the current study are continuous, meaning that they lack the necessary change in slope needed to identify a transition point. However, the apparent transition as seen through the hot-wire, and instantaneously through PIV, can be properly tracked through a different parameter, namely the turbulent kinetic energy,
 $\tilde{E}$
. What is appealing about
$\tilde{E}$
. What is appealing about
 $\tilde{E}$
, as initially reported in Lander et al. (Reference Lander, Moore, Letchford and Amitay2018), is that while the locus of the maxima was shown in figure 8 to be invariant with respect to Reynolds number, it will now be shown that the content of those points possess a strong dependency on Reynolds number, strong enough to form the basis for transition lengths of many rectangular sections.
$\tilde{E}$
, as initially reported in Lander et al. (Reference Lander, Moore, Letchford and Amitay2018), is that while the locus of the maxima was shown in figure 8 to be invariant with respect to Reynolds number, it will now be shown that the content of those points possess a strong dependency on Reynolds number, strong enough to form the basis for transition lengths of many rectangular sections.

Figure 14. Variation of the momentum thickness with the normalized arc-length distance along the shear layer axis for (a) 5 : 1 section, and (b) 1 : 1 section at two different Reynolds numbers compared to data from Lander et al. (Reference Lander, Moore, Letchford and Amitay2018). Every other point is plotted.
Table 2. Curve fitting coefficients for momentum thickness of the separated shear layer. Values are given as low/high where
 $Re_{low}/Re_{high}$
corresponds to
$Re_{low}/Re_{high}$
corresponds to
 $1.34\times 10^{4}/1.18\times 10^{5}.$
Values apply to
$1.34\times 10^{4}/1.18\times 10^{5}.$
Values apply to
 $0<s/h<0.5$
.
$0<s/h<0.5$
.

The effect of Reynolds number on the distribution of
 $\tilde{E}_{max}$
along the 5 : 1 section for three different Reynolds numbers is presented in figure 15. Each of the three curves demonstrates qualitatively similar behaviour. Near the leading edge corner, each of the curves begins from a low free-stream value and subsequently rises with an exponential trend until it saturates. Beyond those saturation points the curves decay slightly and change gradually beyond
$\tilde{E}_{max}$
along the 5 : 1 section for three different Reynolds numbers is presented in figure 15. Each of the three curves demonstrates qualitatively similar behaviour. Near the leading edge corner, each of the curves begins from a low free-stream value and subsequently rises with an exponential trend until it saturates. Beyond those saturation points the curves decay slightly and change gradually beyond
 $x/h=1$
, where at the trailing edge the curves converge. The increase near the leading edge is what is most convincing about this particular data set. Increasing the Reynolds number has several important effects on
$x/h=1$
, where at the trailing edge the curves converge. The increase near the leading edge is what is most convincing about this particular data set. Increasing the Reynolds number has several important effects on
 $\tilde{E}_{max}$
. The following observations are common to all section types and Reynolds numbers tested but for brevity are plotted here only for the 5 : 1 section. First, the initial values of
$\tilde{E}_{max}$
. The following observations are common to all section types and Reynolds numbers tested but for brevity are plotted here only for the 5 : 1 section. First, the initial values of
 $\tilde{E}_{max}$
climb approximately linearly with respect to increasing
$\tilde{E}_{max}$
climb approximately linearly with respect to increasing
 $Re_{h}$
. Their magnitudes are of the order of 1 % of the energy of the free stream. Second, the exponential rises of the turbulent kinetic energy are increasingly more aggressive, a feature that becomes much more vivid for longer sections such as the one in figure 15. While PIV cannot distinguish which frequencies grow faster than others, steeper exponential curves with increasing
$Re_{h}$
. Their magnitudes are of the order of 1 % of the energy of the free stream. Second, the exponential rises of the turbulent kinetic energy are increasingly more aggressive, a feature that becomes much more vivid for longer sections such as the one in figure 15. While PIV cannot distinguish which frequencies grow faster than others, steeper exponential curves with increasing
 $Re_{h}$
here are qualitatively synonymous with elevated spatial growth rates of a band of unstable frequencies. Ultimately, the curves of
$Re_{h}$
here are qualitatively synonymous with elevated spatial growth rates of a band of unstable frequencies. Ultimately, the curves of
 $\tilde{E}_{max}$
saturate of the order of 5 %–10 % of the energy of the free stream at which point they have overstepped the notion of linear superposition on the mean flow. The level at which
$\tilde{E}_{max}$
saturate of the order of 5 %–10 % of the energy of the free stream at which point they have overstepped the notion of linear superposition on the mean flow. The level at which
 $\tilde{E}_{max}$
saturates steadily decreases as Reynolds number increases, and the saturation location moves upstream with diminishing gains. These features are in line with those involving viscous instabilities where the distance to transition is described using a local Reynolds number,
$\tilde{E}_{max}$
saturates steadily decreases as Reynolds number increases, and the saturation location moves upstream with diminishing gains. These features are in line with those involving viscous instabilities where the distance to transition is described using a local Reynolds number,
 $Re_{x}$
. As the free-stream Reynolds number increases, the distance to the critical local Reynolds number is reduced, resulting in shorter transition lengths.
$Re_{x}$
. As the free-stream Reynolds number increases, the distance to the critical local Reynolds number is reduced, resulting in shorter transition lengths.
A Reynolds-dependent transition process in a nominally separated flow raises interesting questions as to the exact origins of the observed instability. Specifically, one may question whether or not the observed trends are simply downstream artefacts of front face boundary layer activity undergoing viscous instability, or if the presence of the corner is close enough to contribute wall effects. Previous work on the square prism by this same group found spatial amplification rates that appeared to be constant over the Reynolds numbers tested; however, figure 15 indicates otherwise. Returning to the time-averaged positions of the shear layers in figure 8, the trajectories over the first half-body dimension are nearly the same suggesting that the proximity of the wall cannot explain the apparent presence of such effects for the 5 : 1 section. Nevertheless, these traits using
 $\tilde{E}_{max}$
constitute the beginnings of a transition length for separated shear layers of rectangular sections. However, the extent of Reynolds number dependency appears to be short lived. Beyond the saturation of
$\tilde{E}_{max}$
constitute the beginnings of a transition length for separated shear layers of rectangular sections. However, the extent of Reynolds number dependency appears to be short lived. Beyond the saturation of
 $\tilde{E}_{max}$
the curves slowly converge onto one another giving a hint of self-similarity near the trailing edge.
$\tilde{E}_{max}$
the curves slowly converge onto one another giving a hint of self-similarity near the trailing edge.
Figure 16 show profiles of
 $\tilde{E}$
on a normalized vertical coordinate,
$\tilde{E}$
on a normalized vertical coordinate,
 $y^{\ast }=y-y|_{\tilde{E}_{max}}$
for the same three Reynolds numbers, demonstrating a lack of similarity near the leading edge but a convincing self-similar profile near the trailing edge. In figure 16(a), the profiles are presented at
$y^{\ast }=y-y|_{\tilde{E}_{max}}$
for the same three Reynolds numbers, demonstrating a lack of similarity near the leading edge but a convincing self-similar profile near the trailing edge. In figure 16(a), the profiles are presented at
 $x/h=0.15$
, which is beyond the saturation point for high Reynolds numbers and upstream of the saturation for the lower Reynolds numbers. As a result, the profiles’ peak magnitudes are not easily sorted by Reynolds number at first glance. At the highest Reynolds number of
$x/h=0.15$
, which is beyond the saturation point for high Reynolds numbers and upstream of the saturation for the lower Reynolds numbers. As a result, the profiles’ peak magnitudes are not easily sorted by Reynolds number at first glance. At the highest Reynolds number of
 $Re_{h}=1.18\times 10^{5}$
, the maximum
$Re_{h}=1.18\times 10^{5}$
, the maximum
 $\tilde{E}$
is between the lower two Reynolds number curves, a feature that is easily distinguished in figure 15. As can be seen in figure 16(b), at
$\tilde{E}$
is between the lower two Reynolds number curves, a feature that is easily distinguished in figure 15. As can be seen in figure 16(b), at
 $x/h=4.5$
all three profiles collapse on top of one other, suggesting Reynolds number independence near the trailing edge. This independence might be due to the proximity to the wake, which is governed by an inviscid mechanism, as seen by the Strouhal number behaviour. Figures 15, 16 and 13 indicate a rapid transition process, which can be quantified and verified through
$x/h=4.5$
all three profiles collapse on top of one other, suggesting Reynolds number independence near the trailing edge. This independence might be due to the proximity to the wake, which is governed by an inviscid mechanism, as seen by the Strouhal number behaviour. Figures 15, 16 and 13 indicate a rapid transition process, which can be quantified and verified through
 $\tilde{E}$
.
$\tilde{E}$
.

Figure 15. Downstream trajectories of
 $\tilde{E}_{max}$
. A 95 % confidence interval is shown for
$\tilde{E}_{max}$
. A 95 % confidence interval is shown for
 $Re_{h}=1.34\times 10^{4}$
only. Every tenth point is plotted.
$Re_{h}=1.34\times 10^{4}$
only. Every tenth point is plotted.

Figure 16. (a) Wall-normal profiles of
 $\tilde{E}$
at (a)
$\tilde{E}$
at (a)
 $x/h=0.15$
, and (b) at
$x/h=0.15$
, and (b) at
 $x/h=4.5$
. Every fifth point plotted.
$x/h=4.5$
. Every fifth point plotted.
Another way to visualize the spatial development of transition within the separated shear layer is through analysis of instantaneous fields. Figure 17(a,c) and figure 17(b,d) show contours of instantaneous spanwise vorticity,
 $\overline{\unicode[STIX]{x1D714}}_{z}$
, near the leading edge of the 5 : 1 and 1 : 1 sections, respectively. Figure 17(a) shows a band of vorticity stemming from the leading edge of the 5 : 1 section, similar to the distribution in figure 13 where the Reynolds number is moderate,
$\overline{\unicode[STIX]{x1D714}}_{z}$
, near the leading edge of the 5 : 1 and 1 : 1 sections, respectively. Figure 17(a) shows a band of vorticity stemming from the leading edge of the 5 : 1 section, similar to the distribution in figure 13 where the Reynolds number is moderate,
 $Re_{h}=1.34\times 10^{4}$
. At an order of magnitude higher Reynolds number (
$Re_{h}=1.34\times 10^{4}$
. At an order of magnitude higher Reynolds number (
 $Re_{h}=1.18\times 10^{5}$
, figure 17
c), the same pattern is visible although the downstream location where the first vortex is detected is substantially closer to the leading edge and the size of the resulting structure is smaller. Similarly, the 1 : 1 section show the same main features, where at the lower Reynolds number (figure 17
b) there is a significant distance to the roll up event, while at the higher Reynolds number case (figure 17
d) the roll up of the first vortex is very close to the leading edge. In contrast to much of the mean flow parameters discussed earlier, there is a striking dependence on the Reynolds number. Indeed, the vorticity fields displayed here are common to the tens of thousands of instantaneous fields captured over the course of the experimental campaign, indicating that this behaviour is predictable although its exact coordinates vary slightly in space. Furthermore, it is shown here that while the position of the separated shear layer is nearly Reynolds number independent, its unsteady content is not. This notion can be observed by aligning these vorticity fields with the corresponding magnitudes of
$Re_{h}=1.18\times 10^{5}$
, figure 17
c), the same pattern is visible although the downstream location where the first vortex is detected is substantially closer to the leading edge and the size of the resulting structure is smaller. Similarly, the 1 : 1 section show the same main features, where at the lower Reynolds number (figure 17
b) there is a significant distance to the roll up event, while at the higher Reynolds number case (figure 17
d) the roll up of the first vortex is very close to the leading edge. In contrast to much of the mean flow parameters discussed earlier, there is a striking dependence on the Reynolds number. Indeed, the vorticity fields displayed here are common to the tens of thousands of instantaneous fields captured over the course of the experimental campaign, indicating that this behaviour is predictable although its exact coordinates vary slightly in space. Furthermore, it is shown here that while the position of the separated shear layer is nearly Reynolds number independent, its unsteady content is not. This notion can be observed by aligning these vorticity fields with the corresponding magnitudes of
 $\tilde{E}_{max}$
as done in figure 17(e) for the 5 : 1 section and figure 17(f) for the 1 : 1 square section. This pattern in the instantaneous fields in figure 17 is similar to that highlighted in Lander (Reference Lander2017), who used the
$\tilde{E}_{max}$
as done in figure 17(e) for the 5 : 1 section and figure 17(f) for the 1 : 1 square section. This pattern in the instantaneous fields in figure 17 is similar to that highlighted in Lander (Reference Lander2017), who used the
 ${\mathcal{Q}}$
criterion to identify the first coherent structure in the shear layer and noted their alignment with an integrated kinetic energy parameter for the square prism. Here it is shown that a similar analysis can readily be extended to other rectangular sections with improving resolution as the influence of the wake is diminished with increasing aspect ratio. While earlier discussions appealed to the position of the maximum TKE, its magnitude is now shown to be a useful tool to detect the location of discrete vortex formation and the end of the linear growth of the instability. In fact, the instantaneous vorticity plots show that the roll up of the vortex coincides nicely with the saturation of
${\mathcal{Q}}$
criterion to identify the first coherent structure in the shear layer and noted their alignment with an integrated kinetic energy parameter for the square prism. Here it is shown that a similar analysis can readily be extended to other rectangular sections with improving resolution as the influence of the wake is diminished with increasing aspect ratio. While earlier discussions appealed to the position of the maximum TKE, its magnitude is now shown to be a useful tool to detect the location of discrete vortex formation and the end of the linear growth of the instability. In fact, the instantaneous vorticity plots show that the roll up of the vortex coincides nicely with the saturation of
 $\tilde{E}_{max}$
along the
$\tilde{E}_{max}$
along the
 $x$
axis for the 5 : 1 section. A similar pattern applies for the 1 : 1 square section in figure 17(f), although the initial levels of
$x$
axis for the 5 : 1 section. A similar pattern applies for the 1 : 1 square section in figure 17(f), although the initial levels of
 $\tilde{E}_{max}$
are higher, the slopes apparently similar to one another, and instead of a saturation the distributions experience a slope reduction that coincides in space with the location of the first vortex. Note that since the shear layer associated with the 1 : 1 section is significantly affected by the proximity to the wake,
$\tilde{E}_{max}$
are higher, the slopes apparently similar to one another, and instead of a saturation the distributions experience a slope reduction that coincides in space with the location of the first vortex. Note that since the shear layer associated with the 1 : 1 section is significantly affected by the proximity to the wake,
 $\tilde{E}_{max}$
continues to increase. Appealing once again to linear theory, one might expect to see exponential growth regions of the shear layer where the growth rates are best described using linear methods. The slope reduction in 17(f) is likely where the disturbance growth is at first linear but quickly goes nonlinear and is dominated by the growth of another instability in the flow, namely the instability in the wake.
$\tilde{E}_{max}$
continues to increase. Appealing once again to linear theory, one might expect to see exponential growth regions of the shear layer where the growth rates are best described using linear methods. The slope reduction in 17(f) is likely where the disturbance growth is at first linear but quickly goes nonlinear and is dominated by the growth of another instability in the flow, namely the instability in the wake.

Figure 17. Instantaneous vorticity fields. (a,c) 5 : 1 section, and (b,d) 1 : 1 section. (a,b) At
 $Re_{h}=1.34\times 10^{4}$
, saturation level is set to
$Re_{h}=1.34\times 10^{4}$
, saturation level is set to
 $\overline{\unicode[STIX]{x1D714}}_{z}>20$
; (c,d) at
$\overline{\unicode[STIX]{x1D714}}_{z}>20$
; (c,d) at
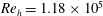 $Re_{h}=1.18\times 10^{5}$
, saturation level is set to
$Re_{h}=1.18\times 10^{5}$
, saturation level is set to
 $\overline{\unicode[STIX]{x1D714}}_{z}>50$
. Also included is
$\overline{\unicode[STIX]{x1D714}}_{z}>50$
. Also included is
 $\tilde{E}_{max}$
for (e) 5 : 1 section, and (f) 1 : 1 section at the two Reynolds numbers. Every fifth point is plotted. Arrows highlight the end of the linear growth regime for each Reynolds number.
$\tilde{E}_{max}$
for (e) 5 : 1 section, and (f) 1 : 1 section at the two Reynolds numbers. Every fifth point is plotted. Arrows highlight the end of the linear growth regime for each Reynolds number.
Changes in spatial amplification of turbulent kinetic energy between Reynolds numbers is an important distinction when comparing longer bodies with shorter bodies. For the less coupled section, the 5 : 1, the slope changes are easily distinguished. The reason for this is the additional coherence of the presence of the von Kármán mode at the leading edge of shorter sections, which elevates the observed increases in total fluctuations, forming a likely combined growth rate and obscuring any Reynolds number dependencies. Only by adding an afterbody (i.e. increasing the body’s length), and displacing the wake farther downstream, can the effect of the VK mode be reduced enough to showcase the natural KH growth. Even still, changes in slope of
 $\tilde{E}_{max}$
maintain their use for monitoring transition of the shear layer. In the most simple sense, figure 17 confirms the robustness with which turbulent kinetic energy is able to predict the location of the first coherent vortex in the flow for rectangular sections. It is this length, from leading edge corner to the location where the growth rate saturates that is defined here to be a transition distance for rectangular sections,
$\tilde{E}_{max}$
maintain their use for monitoring transition of the shear layer. In the most simple sense, figure 17 confirms the robustness with which turbulent kinetic energy is able to predict the location of the first coherent vortex in the flow for rectangular sections. It is this length, from leading edge corner to the location where the growth rate saturates that is defined here to be a transition distance for rectangular sections,
 $x_{\unicode[STIX]{x1D70F}}$
. It is noteworthy that similar behaviour was obtained for the 3 : 1 section although not shown here for brevity.
$x_{\unicode[STIX]{x1D70F}}$
. It is noteworthy that similar behaviour was obtained for the 3 : 1 section although not shown here for brevity.
As a final note on the comparisons across sections of different lengths, the Reynolds number dependency of the normalized location of the transition and flow reattachment over the body is presented in figures 18(a) and 18(b), respectively. The reattachment point is also a metric for defining the streamwise length of the separation bubble. Figure 18(a) displays normalized transition lengths for the 5 : 1, 3 : 1, and 1 : 1 sections. As can be seen, the normalized transition locations are similar for all sections and the dependence on the Reynolds number is similar, where the transition location varies as
 $Re_{h}^{-0.6}$
. The Reynolds number resolution here is not satisfactory to establish a statistically robust curve fit of the exponent describing the diminishing transition length. This point should be addressed in future work with additional data over a wider range of Reynolds numbers in order to more accurately quantify this trend. However, for the reattachment location for the 5 : 1 section (figure 18
b) a much weaker dependency on Reynolds number is visible. This is in contrast to the combined numerical and experimental work from Mannini, Šoda & Schewe (Reference Mannini, Šoda and Schewe2010) and Schewe (Reference Schewe2013) who observed a significant upstream trend of the reattachment point with increasing
$Re_{h}^{-0.6}$
. The Reynolds number resolution here is not satisfactory to establish a statistically robust curve fit of the exponent describing the diminishing transition length. This point should be addressed in future work with additional data over a wider range of Reynolds numbers in order to more accurately quantify this trend. However, for the reattachment location for the 5 : 1 section (figure 18
b) a much weaker dependency on Reynolds number is visible. This is in contrast to the combined numerical and experimental work from Mannini, Šoda & Schewe (Reference Mannini, Šoda and Schewe2010) and Schewe (Reference Schewe2013) who observed a significant upstream trend of the reattachment point with increasing
 $Re_{h}$
for a similar geometry. In those studies, the reattachment was identified using surface pressure while in the current study, to calculate the reattachment location,
$Re_{h}$
for a similar geometry. In those studies, the reattachment was identified using surface pressure while in the current study, to calculate the reattachment location,
 $x_{{\mathcal{R}}}$
, the
$x_{{\mathcal{R}}}$
, the
 $x$
coordinate with the sign reversal of the streamwise velocity was identified using the PIV data. When normalized by the initial values,
$x$
coordinate with the sign reversal of the streamwise velocity was identified using the PIV data. When normalized by the initial values,
 $x_{{\mathcal{R}}_{0}}$
, the trend is apparently a weak function of Reynolds number with the reattachment lengths changing only a few per cent. It is noteworthy that this lack of dependency on Reynolds number has been recently confirmed in a three dimensional numerical simulation of a 3-D rectangular prism conducted by Prosser & Smith (Reference Prosser and Smith2016) indicating that the two-dimensional nature of the current PIV data is still sufficient to capture most of the important physical phenomena associated with the shear layer.
$x_{{\mathcal{R}}_{0}}$
, the trend is apparently a weak function of Reynolds number with the reattachment lengths changing only a few per cent. It is noteworthy that this lack of dependency on Reynolds number has been recently confirmed in a three dimensional numerical simulation of a 3-D rectangular prism conducted by Prosser & Smith (Reference Prosser and Smith2016) indicating that the two-dimensional nature of the current PIV data is still sufficient to capture most of the important physical phenomena associated with the shear layer.
These combined results further support a strong Reynolds number dependence of the shear layers’ turbulent content near the leading edge corner but a relatively weak dependency near the trailing edge, a process that appears to be more drawn out on long sections, and more compact on short sections. The metrics used to monitor the onset of turbulent transition process are similar across all sections tested here. However, we stop short of suggesting that the observed behaviour is exactly the same. Contributions from the wake overwhelm the shear layer dynamics when the two instabilities are close, and observations of the later are misleading if not considered within the context described above.

Figure 18. Variation of (a) the normalized transition lengths for the 5 : 1, 3 : 1 and 1 : 1 sections, and (b) normalized reattachment lengths for the 5 : 1 section with Reynolds number.

Figure 19. Power spectra measured along the 5 : 1 section. (a) Near the leading edge (
 $x$
/
$x$
/
 $h$
,
$h$
,
 $y$
/
$y$
/
 $h$
); A (0,0), B (0.023,
$h$
); A (0,0), B (0.023,
 $-$
0.097), C (0.073,
$-$
0.097), C (0.073,
 $-$
0.130), D (0.124,
$-$
0.130), D (0.124,
 $-$
0.161), E (0.174,
$-$
0.161), E (0.174,
 $-$
0.190), F (0.225,
$-$
0.190), F (0.225,
 $-$
0.219); (b) downstream of the transition location: (0.326,
$-$
0.219); (b) downstream of the transition location: (0.326,
 $-$
0.271), (0.583,
$-$
0.271), (0.583,
 $-$
0.384), (1.038,
$-$
0.384), (1.038,
 $-$
0.527), (1.823,
$-$
0.527), (1.823,
 $-$
0.659), (2.882,
$-$
0.659), (2.882,
 $-$
0.722), (3.677,
$-$
0.722), (3.677,
 $-$
0.764), (4.736,
$-$
0.764), (4.736,
 $-$
0.799).
$-$
0.799).
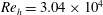 $Re_{h}=3.04\times 10^{4}$
.
$Re_{h}=3.04\times 10^{4}$
.
4.3 Spectral migrations
In order to explore the spectral content of the shear layer and energy exchanges between the shear layer and the wake, figure 19 is presented. Previous figures have shown an exponential increases in fluctuating energy,
 $\tilde{E}_{max}$
, that is reminiscent of linear stability theory, yet limited by the optical technique used. The spectral content comprising the exponential growth in different locations in the flow field can only be documented experimentally with adequate temporal resolution in combination with precise spatial awareness. In the current study, this was done once again through the combined use of PIV and hot-wire systems. By traversing a single hot-wire probe along the shear layer trajectory, as defined previously, the frequency content can be monitored in the streamwise direction. Such an example is shown in figure 19, which shows a series of spectra measured at multiple locations along the shear layer between the leading and trailing edges of the 5 : 1 section. Qualitatively, these points in figure 19 represent those labelled in the spatio-temporal schematic of figure 13. It may be noted that the location where the KH frequency is initially observed is approximately 0.02
$\tilde{E}_{max}$
, that is reminiscent of linear stability theory, yet limited by the optical technique used. The spectral content comprising the exponential growth in different locations in the flow field can only be documented experimentally with adequate temporal resolution in combination with precise spatial awareness. In the current study, this was done once again through the combined use of PIV and hot-wire systems. By traversing a single hot-wire probe along the shear layer trajectory, as defined previously, the frequency content can be monitored in the streamwise direction. Such an example is shown in figure 19, which shows a series of spectra measured at multiple locations along the shear layer between the leading and trailing edges of the 5 : 1 section. Qualitatively, these points in figure 19 represent those labelled in the spatio-temporal schematic of figure 13. It may be noted that the location where the KH frequency is initially observed is approximately 0.02
 $h$
from the leading edge corner (i.e. not detected at the leading edge itself). As the downstream distance increases there is a notable migration of the KH frequency to lower values. For example, the spectrum at
$h$
from the leading edge corner (i.e. not detected at the leading edge itself). As the downstream distance increases there is a notable migration of the KH frequency to lower values. For example, the spectrum at
 $x/h=0.023$
contains a peak at a reduced frequency of
$x/h=0.023$
contains a peak at a reduced frequency of
 $fh/U_{\infty }=8.24$
, whereas at
$fh/U_{\infty }=8.24$
, whereas at
 $x/h=0.073$
, the spectrum shows a much wider distribution with two local maxima,
$x/h=0.073$
, the spectrum shows a much wider distribution with two local maxima,
 $fh/U_{\infty }=4.38$
and
$fh/U_{\infty }=4.38$
and
 $8.14$
. Farther downstream, at
$8.14$
. Farther downstream, at
 $x/h=0.124$
, the peak value exists between the two prior peaks at
$x/h=0.124$
, the peak value exists between the two prior peaks at
 $fh/U_{\infty }=5.20$
. At the final measurement shown in figure 19(a),
$fh/U_{\infty }=5.20$
. At the final measurement shown in figure 19(a),
 $x/h=0.225$
, the peak value is centred around
$x/h=0.225$
, the peak value is centred around
 $fh/U_{\infty }=4.6$
. It is noteworthy that a factor of 2 exists in frequency between the initially observed KH peak, and peak measured at the location where the first vortex is observed at that Reynolds number,
$fh/U_{\infty }=4.6$
. It is noteworthy that a factor of 2 exists in frequency between the initially observed KH peak, and peak measured at the location where the first vortex is observed at that Reynolds number,
 $x_{\unicode[STIX]{x1D70F}}/h=0.27$
. Within that distance, the corresponding momentum thickness decreases by factor of nearly 4.
$x_{\unicode[STIX]{x1D70F}}/h=0.27$
. Within that distance, the corresponding momentum thickness decreases by factor of nearly 4.
Downstream of the transition location (
 $x>x_{\unicode[STIX]{x1D70F}}$
, figure 19
b), there is a migration of the high-frequency content toward the wake frequency as the downstream distance increases. At these streamwise locations no further accumulation of spectral energy is visible, especially in the area where the KH is initially observed. Previous discussions have highlighted the increasing nature of the turbulent kinetic energy as a whole along the body; figure 19 indicates that the initial growth of
$x>x_{\unicode[STIX]{x1D70F}}$
, figure 19
b), there is a migration of the high-frequency content toward the wake frequency as the downstream distance increases. At these streamwise locations no further accumulation of spectral energy is visible, especially in the area where the KH is initially observed. Previous discussions have highlighted the increasing nature of the turbulent kinetic energy as a whole along the body; figure 19 indicates that the initial growth of
 $\tilde{E}$
is apparently due to high frequencies associated with the KH mode, while the latter is due to accumulation of, and migration toward, energy at lower frequencies associated with the VK mode.
$\tilde{E}$
is apparently due to high frequencies associated with the KH mode, while the latter is due to accumulation of, and migration toward, energy at lower frequencies associated with the VK mode.
The division of the data set in figure 19 seeks to elucidate the transition of energetic scales within the shear layer. Had the spectra remained constant in space, or shifted in a consistent manner, the length and velocity scales needed to justify the dominating frequencies, may be obtained from a linear scaling. However, the current data show that a continuous scaling encapsulating the entire shear layer is significantly more complicated. To illustrate this, consider the value of
 $f_{KH}$
at this particular Reynolds number. It may be defined by the first observable peak along the shear layer, as done in the past. Or, it may be the value found at the point where vortices typically form, a much lower frequency. Further still, at any location between these two stations, there may be multiple peaks on the spectra in the region beyond
$f_{KH}$
at this particular Reynolds number. It may be defined by the first observable peak along the shear layer, as done in the past. Or, it may be the value found at the point where vortices typically form, a much lower frequency. Further still, at any location between these two stations, there may be multiple peaks on the spectra in the region beyond
 $f_{VK}$
, injecting more confusion into the debate. One then expects that with increased resolution in space, the movement of such peaks and the exchange of spectral energy become a continuous surface with sensitivities along all three axes of frequency, power, and space. Thus, before searching for the scaling that satisfies this flow field, the frequencies and corresponding lengths ought to be identified and examined in detail. Specifically, scales whose steep spectral gradients convert large amounts of average kinetic energy to turbulent kinetic energy are the energetic ones. These, more than others, are the range of scales driving turbulent transition within the shear layer, facilitating the missing link between small wavenumber/high-frequency content at the leading edge corner, and larger wavenumber/lower-frequency activity in the wake.
$f_{VK}$
, injecting more confusion into the debate. One then expects that with increased resolution in space, the movement of such peaks and the exchange of spectral energy become a continuous surface with sensitivities along all three axes of frequency, power, and space. Thus, before searching for the scaling that satisfies this flow field, the frequencies and corresponding lengths ought to be identified and examined in detail. Specifically, scales whose steep spectral gradients convert large amounts of average kinetic energy to turbulent kinetic energy are the energetic ones. These, more than others, are the range of scales driving turbulent transition within the shear layer, facilitating the missing link between small wavenumber/high-frequency content at the leading edge corner, and larger wavenumber/lower-frequency activity in the wake.
Selecting important scales for predicting flow behaviour around bluff bodies is not a novel concept. The presence of turbulent fluctuations in shear layers has been a major thrust of study in structural aerodynamics for decades. Melbourne’s small-scale spectral density parameter describes the importance of small-scale, high-frequency content in the spectrum of the free-stream turbulence from the point of view of the maximum suction observed beneath the shear layer on the surface of the body (Melbourne Reference Melbourne1979). An opposing viewpoint was taken by Bearman & Morel (Reference Bearman and Morel1983) who suggested that scales of the order of
 $h$
are the scales that dictate the aerodynamic response of the body. Decades later Tieleman (Reference Tieleman2003) summarized the problem of scales by suggesting that the combined presence of large and small scales is necessary to produce the largest suction peaks. Recently, Morrison & Kopp (Reference Morrison and Kopp2018) confirmed this by showing that the range of frequencies in free-stream turbulence necessary for accurate aerodynamic modelling of structures was contained in the range
$h$
are the scales that dictate the aerodynamic response of the body. Decades later Tieleman (Reference Tieleman2003) summarized the problem of scales by suggesting that the combined presence of large and small scales is necessary to produce the largest suction peaks. Recently, Morrison & Kopp (Reference Morrison and Kopp2018) confirmed this by showing that the range of frequencies in free-stream turbulence necessary for accurate aerodynamic modelling of structures was contained in the range
 $0.1<fh/U_{\infty }<10$
. This band of frequencies was subsequently defined as ‘active scales’ in the flow. Here, without the influence of elevated levels of free-stream turbulence, the shear layer’s self-generating turbulent behaviour is evident. In regions between the leading edge and the transition location,
$0.1<fh/U_{\infty }<10$
. This band of frequencies was subsequently defined as ‘active scales’ in the flow. Here, without the influence of elevated levels of free-stream turbulence, the shear layer’s self-generating turbulent behaviour is evident. In regions between the leading edge and the transition location,
 $0<x<x_{\unicode[STIX]{x1D70F}}$
, the smaller scales are of most interest. However, the spectral amplitudes of the KH only surpass the larger VK mode for certain bodies, namely those experiencing a reattaching shear layer (e.g. the 5 : 1 section). In these instances, the energetic scales are the primary mode responsible for converting mean flow energy to TKE. For shorter sections, such as the 1 : 1 section, the relative amplitude between the two modes is such that the smaller scales, while still growing rapidly as the instability matures, are secondary to the much larger fluctuations associated with the wake. Beyond transition,
$0<x<x_{\unicode[STIX]{x1D70F}}$
, the smaller scales are of most interest. However, the spectral amplitudes of the KH only surpass the larger VK mode for certain bodies, namely those experiencing a reattaching shear layer (e.g. the 5 : 1 section). In these instances, the energetic scales are the primary mode responsible for converting mean flow energy to TKE. For shorter sections, such as the 1 : 1 section, the relative amplitude between the two modes is such that the smaller scales, while still growing rapidly as the instability matures, are secondary to the much larger fluctuations associated with the wake. Beyond transition,
 $x_{\unicode[STIX]{x1D70F}}<x<L$
, there is a much more subtle migration of energy toward the larger scales, on the order of the body. This relative nature of the two modes, separated on a power spectra by multiple orders of magnitude on the power axis, contrasts with the scales in the studies of Hutchins & Marusic (Reference Hutchins and Marusic2007). In their work, the two modes of interest had peak amplitudes of similar order of magnitude,
$x_{\unicode[STIX]{x1D70F}}<x<L$
, there is a much more subtle migration of energy toward the larger scales, on the order of the body. This relative nature of the two modes, separated on a power spectra by multiple orders of magnitude on the power axis, contrasts with the scales in the studies of Hutchins & Marusic (Reference Hutchins and Marusic2007). In their work, the two modes of interest had peak amplitudes of similar order of magnitude,
 $O(1)$
. The spectral amplitude ratios in the current study range from
$O(1)$
. The spectral amplitude ratios in the current study range from
 $S_{KH}/S_{VK}\approx 10^{-6}$
at the leading edge to
$S_{KH}/S_{VK}\approx 10^{-6}$
at the leading edge to
 $10^{-2}$
at
$10^{-2}$
at
 $x_{\unicode[STIX]{x1D70F}}$
for the 1 : 1 section. The 5 : 1 section covers an even wider range from
$x_{\unicode[STIX]{x1D70F}}$
for the 1 : 1 section. The 5 : 1 section covers an even wider range from
 $S_{KH}/S_{VK}\approx 10^{-4}$
to
$S_{KH}/S_{VK}\approx 10^{-4}$
to
 $10^{2}$
across a similar non-dimensional distance. That these two modes originate in opposite corners of a power spectrum and converge during the course of a single convection cycle is indeed impressive.
$10^{2}$
across a similar non-dimensional distance. That these two modes originate in opposite corners of a power spectrum and converge during the course of a single convection cycle is indeed impressive.

Figure 20. Downstream variation of the integral time scales (measured along the trajectory of
 $\tilde{E}_{max}$
).
$\tilde{E}_{max}$
).
 $Re_{h}=3.04\times 10^{4}$
.
$Re_{h}=3.04\times 10^{4}$
.
The boundary conditions of the velocity field at either end of the shear layer complicate a continuous description. At the leading edge, there is a significant dependency of TKE on Reynolds number. Near the trailing edge, the effect is difficult to discern. The corresponding lengths to collapse mean and unsteady profiles at either end are likely different. However, one continuous way to visualize the energy transfer between scales is shown in figure 20 through the autocorrelation function of the traversing hot-wire probe. Here, the dimensionless integral time scale is shown as a function of the streamwise distance between leading and trailing edges as well as the mean velocity magnitude obtained by the hot-wire. The integral time scale is defined in Tennekes & Lumley (Reference Tennekes and Lumley1972) as
 ${\mathcal{T}}=\int _{0}^{\infty }\unicode[STIX]{x1D70C}(\unicode[STIX]{x1D70F})\,\text{d}\unicode[STIX]{x1D70F}$
where
${\mathcal{T}}=\int _{0}^{\infty }\unicode[STIX]{x1D70C}(\unicode[STIX]{x1D70F})\,\text{d}\unicode[STIX]{x1D70F}$
where
 $\unicode[STIX]{x1D70C}$
is the autocorrelation function and
$\unicode[STIX]{x1D70C}$
is the autocorrelation function and
 $\unicode[STIX]{x1D70F}$
in this case is a time lag from the beginning of the sample. Assuming that a finite
$\unicode[STIX]{x1D70F}$
in this case is a time lag from the beginning of the sample. Assuming that a finite
 ${\mathcal{T}}$
exists, integration is extended toward infinity. In regards to this definition, two practical concessions must be made. The first is the sample length, which is limited to 30 s at 40 kHz and therefore it is assumed that the integral length scale is significantly less than this duration. Second, the nature of the function
${\mathcal{T}}$
exists, integration is extended toward infinity. In regards to this definition, two practical concessions must be made. The first is the sample length, which is limited to 30 s at 40 kHz and therefore it is assumed that the integral length scale is significantly less than this duration. Second, the nature of the function
 $\unicode[STIX]{x1D70C}$
is sinusoidal, oscillating about the zero point. Thus, the upper integration limit determines the magnitude of
$\unicode[STIX]{x1D70C}$
is sinusoidal, oscillating about the zero point. Thus, the upper integration limit determines the magnitude of
 ${\mathcal{T}}$
. In regards to the second point, integrals were carried out until the first zero crossing of the autocorrelation function. For the sections represented here, several of the features mentioned above are reconciled. First, the migration toward time scales of the order of the body dimension,
${\mathcal{T}}$
. In regards to the second point, integrals were carried out until the first zero crossing of the autocorrelation function. For the sections represented here, several of the features mentioned above are reconciled. First, the migration toward time scales of the order of the body dimension,
 $h/U$
or the time of flight, is clear in that both curves appear to reach levels approximately equal to unity at their respective trailing edges. For shorter sections such as the 1 : 1 section, the wake frequency
$h/U$
or the time of flight, is clear in that both curves appear to reach levels approximately equal to unity at their respective trailing edges. For shorter sections such as the 1 : 1 section, the wake frequency
 $f_{VK}$
maintains its relative dominance at the leading edge. This is confirmed for the 1 : 1 section, which suggests relatively larger scales near the leading edge corner. On the other hand, the 5 : 1 section indicates smaller scales initially. As was proposed, longer sections are associated with reduced coupling between the wake and the shear layer as the physical distance between these instabilities increases. So too is the spectral amplitude ratio much higher for the 5 : 1 section, well above unity, highlighting the dominance of energetic scales. That notion is confirmed by showing the 5 : 1 section exhibiting time scales near the leading edge of the order of
$f_{VK}$
maintains its relative dominance at the leading edge. This is confirmed for the 1 : 1 section, which suggests relatively larger scales near the leading edge corner. On the other hand, the 5 : 1 section indicates smaller scales initially. As was proposed, longer sections are associated with reduced coupling between the wake and the shear layer as the physical distance between these instabilities increases. So too is the spectral amplitude ratio much higher for the 5 : 1 section, well above unity, highlighting the dominance of energetic scales. That notion is confirmed by showing the 5 : 1 section exhibiting time scales near the leading edge of the order of
 ${\mathcal{T}}\overline{U}_{mag}/h=0.1$
. This difference in integral time scales is likely a function of the mean flow reattachment. The reattachment point provides a downstream limit for the recirculation bubble, but does not completely eliminate local accelerations of the shear layer at the leading edge. Without reattachment, as in the 1 : 1 section, the entire length of the shear layer is forced by the wake instability at a large amplitude and much lower frequency diminishing the role played by the energetic scales. Previous work by Castro & Haque (Reference Castro and Haque1987) on reattaching shear layers reported a decreasing time scale with increasing distance downstream. However, in that case, the body was a flat plate aligned normally to the flow with a long splitter plate, eliminating any shedding entirely. It would seem then that the integral time scales reported here reflect the activity in the wake, as well as provide a convenient way to organize the influence of the energetic scales housed within the shear layer.
${\mathcal{T}}\overline{U}_{mag}/h=0.1$
. This difference in integral time scales is likely a function of the mean flow reattachment. The reattachment point provides a downstream limit for the recirculation bubble, but does not completely eliminate local accelerations of the shear layer at the leading edge. Without reattachment, as in the 1 : 1 section, the entire length of the shear layer is forced by the wake instability at a large amplitude and much lower frequency diminishing the role played by the energetic scales. Previous work by Castro & Haque (Reference Castro and Haque1987) on reattaching shear layers reported a decreasing time scale with increasing distance downstream. However, in that case, the body was a flat plate aligned normally to the flow with a long splitter plate, eliminating any shedding entirely. It would seem then that the integral time scales reported here reflect the activity in the wake, as well as provide a convenient way to organize the influence of the energetic scales housed within the shear layer.
5 Discussion and conclusions
This study documents a clear Reynolds number dependency of the rapidly growing disturbances associated with instabilities of the shear layer emanating from a sharp corner. These flow structures mature earlier and saturate more rapidly at increasingly smaller scales and higher frequencies, all with increasing Reynolds number. With mostly constant Strouhal numbers, the dynamic behaviour in the wake adheres to typical scaling arguments stating that sections with sharp edges behave nearly independent of Reynolds number, tempting us to apply a similar straightforward scaling to the shear layer. Similarly, many of time-averaged parameters for the shear layer including velocity and vorticity profiles show only weak Reynolds dependencies. Critical inspection of unsteady parameters and instantaneous data near the leading edge corner show more deeply the effect of Reynolds number.
As the shear layer transitions from its initial laminar origin to a turbulent shear layer, the growing momentum thickness demonstrates the shift from small wavelengths and high frequencies to longer wavelengths and lower frequencies. The observed transition behaviour of the shear layer with respect to a changing Reynolds number is similar across the range of sections tested herein. However, for shorter sections, much of the shear layer’s nonlinear behaviour is obscured by the much larger wake shedding patterns. The visibility of this is directly linked to the amplitudes of energetic scales within the shear layer. Shorter sections, where flow does not reattach on the body, experience such large amplitude oscillations from the wake that the relative contribution from the energetic scales is secondary to the net accumulation of TKE. On the other hand, if the section is long enough such that the time-averaged flow is able to reattach to the surface, the wake’s influence is significantly attenuated; thus, highlighting the role of the shear layer’s energetic scales at the leading edge. Only then is it possible to observe the connection between smaller scales at the leading edge and larger scales at the trailing edge.
The relationship between the front face boundary layer and the separated shear layer remains a mystery for Reynolds numbers as high as those tested here. Experimental observations at that scale are limited, leaving any subsequent estimations to numerical methods and classical theory. The link established between the thinning boundary layer and the decreasing transition distance of a separated shear layer by Lander et al. (Reference Lander, Moore, Letchford and Amitay2018), combined with the current findings on the 5 : 1 body, suggest that the shear layer mirrors and magnifies at least some of the activity occurring on the front face. Studying longer sections has systematically displaced the unsteady forcing associated with the wake, leaving behind a more unobstructed view of the shear layer’s behaviour. Using that advantage, it was pointed out that the initial values of TKE seen at the leading edge corner increase with Reynolds number, similar to what may be expected of disturbance activity within a boundary layer. So too does the shear layer’s growth rate, gained through the maximum values of TKE, exhibit more aggressive amplification rates. If there exists a critical Reynolds number based on a boundary layer thickness along the front face
 $Re_{\unicode[STIX]{x1D6FF}}$
, then that point moves closer to the stagnation point as
$Re_{\unicode[STIX]{x1D6FF}}$
, then that point moves closer to the stagnation point as
 $Re_{h}$
increases, perhaps explaining the similar migration of the transition points monitored in the shear layer. These trends also agree with the nature of the transition behaviours discussed in the previous works (Sato Reference Sato1956; Prasad & Williamson Reference Prasad and Williamson1997; Lander et al.
Reference Lander, Moore, Letchford and Amitay2018) demonstrating the ability of the separated shear layer to adopt many behaviours of other ambient features in the flow field. Moreover, if such a connection is made, it would then be possible to track the set of scales that grows from those initially associated with a boundary layer on the front face, to those in the wake, transcending the multiple-scale scenario considered by Unal & Rockwell (Reference Unal and Rockwell1988) and extending the range of scales identified here.
$Re_{h}$
increases, perhaps explaining the similar migration of the transition points monitored in the shear layer. These trends also agree with the nature of the transition behaviours discussed in the previous works (Sato Reference Sato1956; Prasad & Williamson Reference Prasad and Williamson1997; Lander et al.
Reference Lander, Moore, Letchford and Amitay2018) demonstrating the ability of the separated shear layer to adopt many behaviours of other ambient features in the flow field. Moreover, if such a connection is made, it would then be possible to track the set of scales that grows from those initially associated with a boundary layer on the front face, to those in the wake, transcending the multiple-scale scenario considered by Unal & Rockwell (Reference Unal and Rockwell1988) and extending the range of scales identified here.
Lastly, we note that the range of energetic frequencies relevant to the turbulent transition around a bluff section cover a non-dimensional range from
 $0.1\leqslant fh/U_{\infty }\leqslant 10$
at relatively low Reynolds numbers and approach
$0.1\leqslant fh/U_{\infty }\leqslant 10$
at relatively low Reynolds numbers and approach
 $fh/U_{\infty }\approx 10^{2}$
at the upper end of Reynolds numbers tested here. In turbulent conditions, it was Morrison & Kopp (Reference Morrison and Kopp2018) who specified ‘active scales’ over a similar spectral range in looking at pressure fluctuations under full scale Reynolds numbers. The findings here agree with that study in the extent of spectral range, although the amplitudes of velocity spectra between the two studies are substantially different, an artefact of the free-stream turbulence conditions in the two studies. However, in pursuit of a deeper knowledge of the shear layer on bluff bodies we recognize one more major commonality between these two situations. In both laminar and turbulent flows, it is clear that the conditions at or just downstream of the leading edge are the most critical in revealing the characteristic phenomena and necessary clues needed to truly understand these bluff body flows.
$fh/U_{\infty }\approx 10^{2}$
at the upper end of Reynolds numbers tested here. In turbulent conditions, it was Morrison & Kopp (Reference Morrison and Kopp2018) who specified ‘active scales’ over a similar spectral range in looking at pressure fluctuations under full scale Reynolds numbers. The findings here agree with that study in the extent of spectral range, although the amplitudes of velocity spectra between the two studies are substantially different, an artefact of the free-stream turbulence conditions in the two studies. However, in pursuit of a deeper knowledge of the shear layer on bluff bodies we recognize one more major commonality between these two situations. In both laminar and turbulent flows, it is clear that the conditions at or just downstream of the leading edge are the most critical in revealing the characteristic phenomena and necessary clues needed to truly understand these bluff body flows.
Acknowledgements
The authors wish to thank Dr D. Lander for many fruitful discussions and debates. We would also like to thank D. DiGiulio and R. Touzjian for their design expertise in the fabrication stage of this experiment. Portions of this work are gratefully supported through the National Science Foundation, grant no. 1727401.


