1 Introduction
There has been a considerable interest in utilising fluids at pressures and temperatures above their vapour–liquid critical point in many industrial applications. Supercritical fluids exhibit significant deviations from ideal thermodynamic behaviour and do not undergo vaporisation or condensation phase transitions. Supercritical fluid-based technologies are involved in a wide variety of technical process such as pharmaceutical processes for the formation of micro and nanoparticles (Fages et al. Reference Fages, Lochard, Letourneau, Sauceau and Rodier2004) and in chemical engineering as solvents (Matson et al. Reference Matson, Fulton, Petersen and Smith1987a ; Matson, Petersen & Smith Reference Matson, Petersen and Smith1987b ; Debenedetti et al. Reference Debenedetti, Tom, Sang-Do and Gio-Bin1993). Due to their peculiar thermodynamic properties, they are also used in energy applications, such as heat pumps, refrigeration cycles (Ma, Liu & Tian Reference Ma, Liu and Tian2013), power cycles (Dostal, Hejzlar & Driscoll Reference Dostal, Hejzlar and Driscoll2006; Chen, Goswami & Stefanakos Reference Chen, Goswami and Stefanakos2010) and biodiesel production (Saka & Kusdiana Reference Saka and Kusdiana2001).
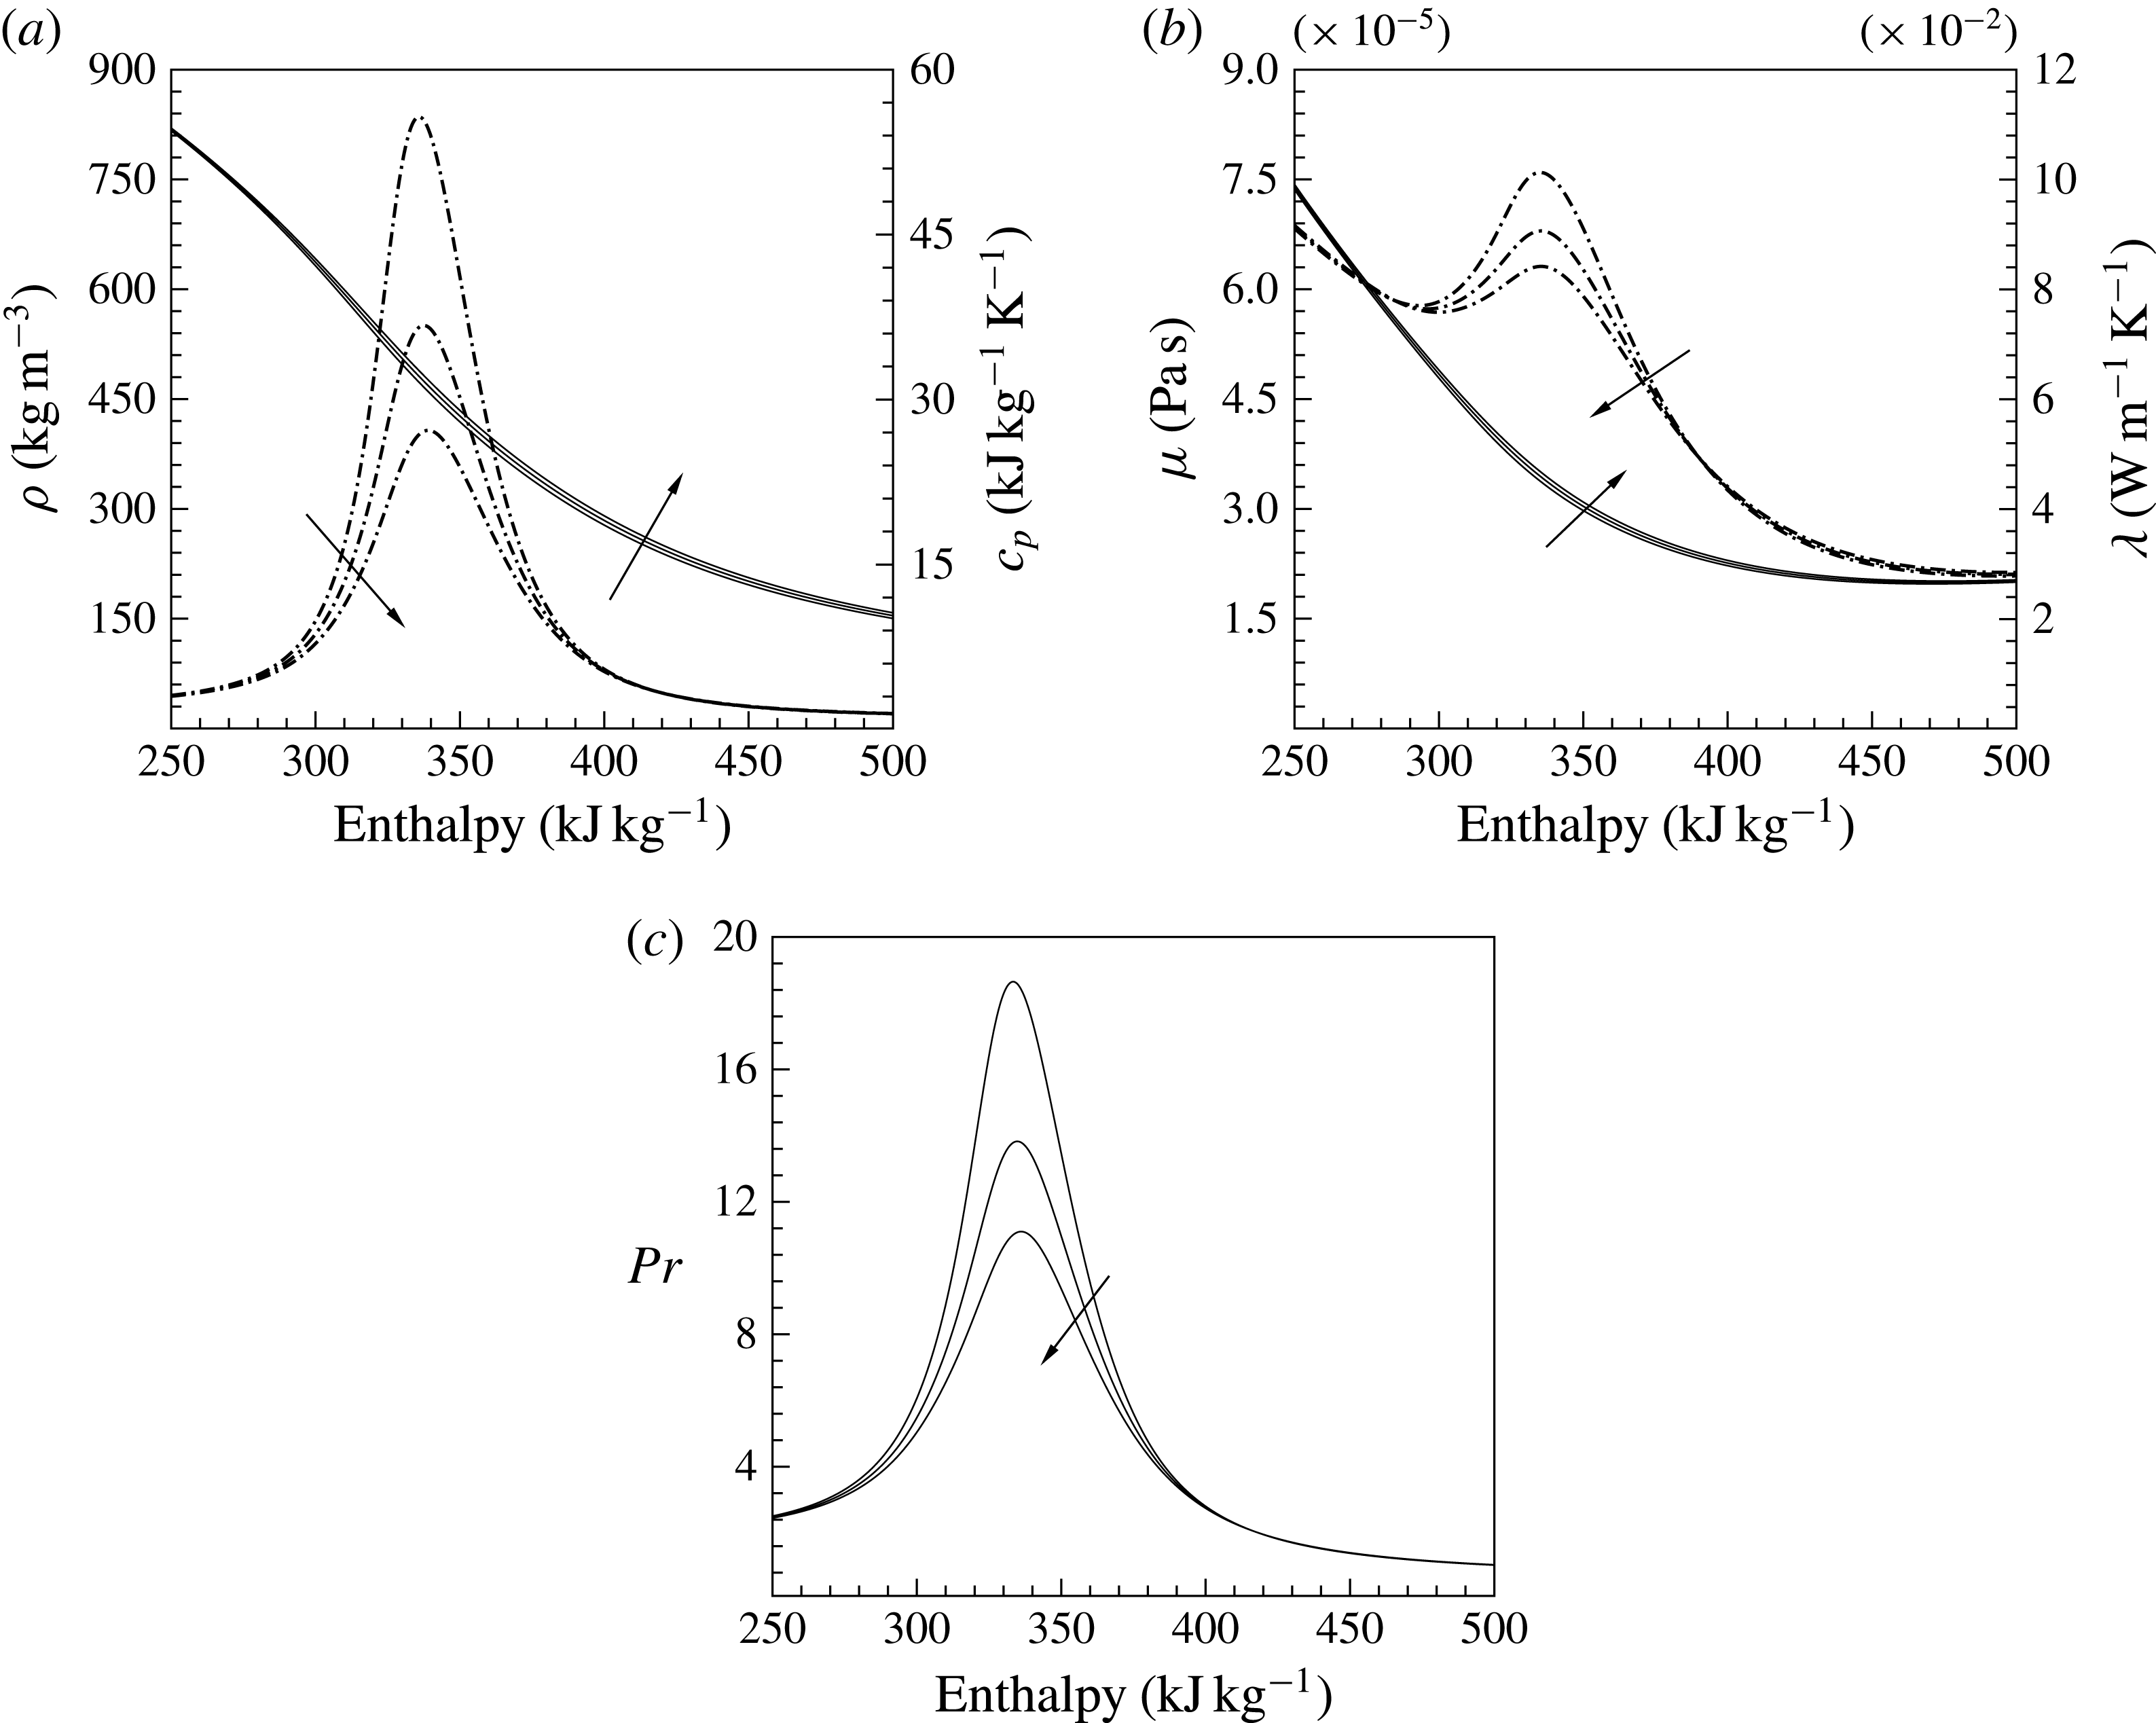
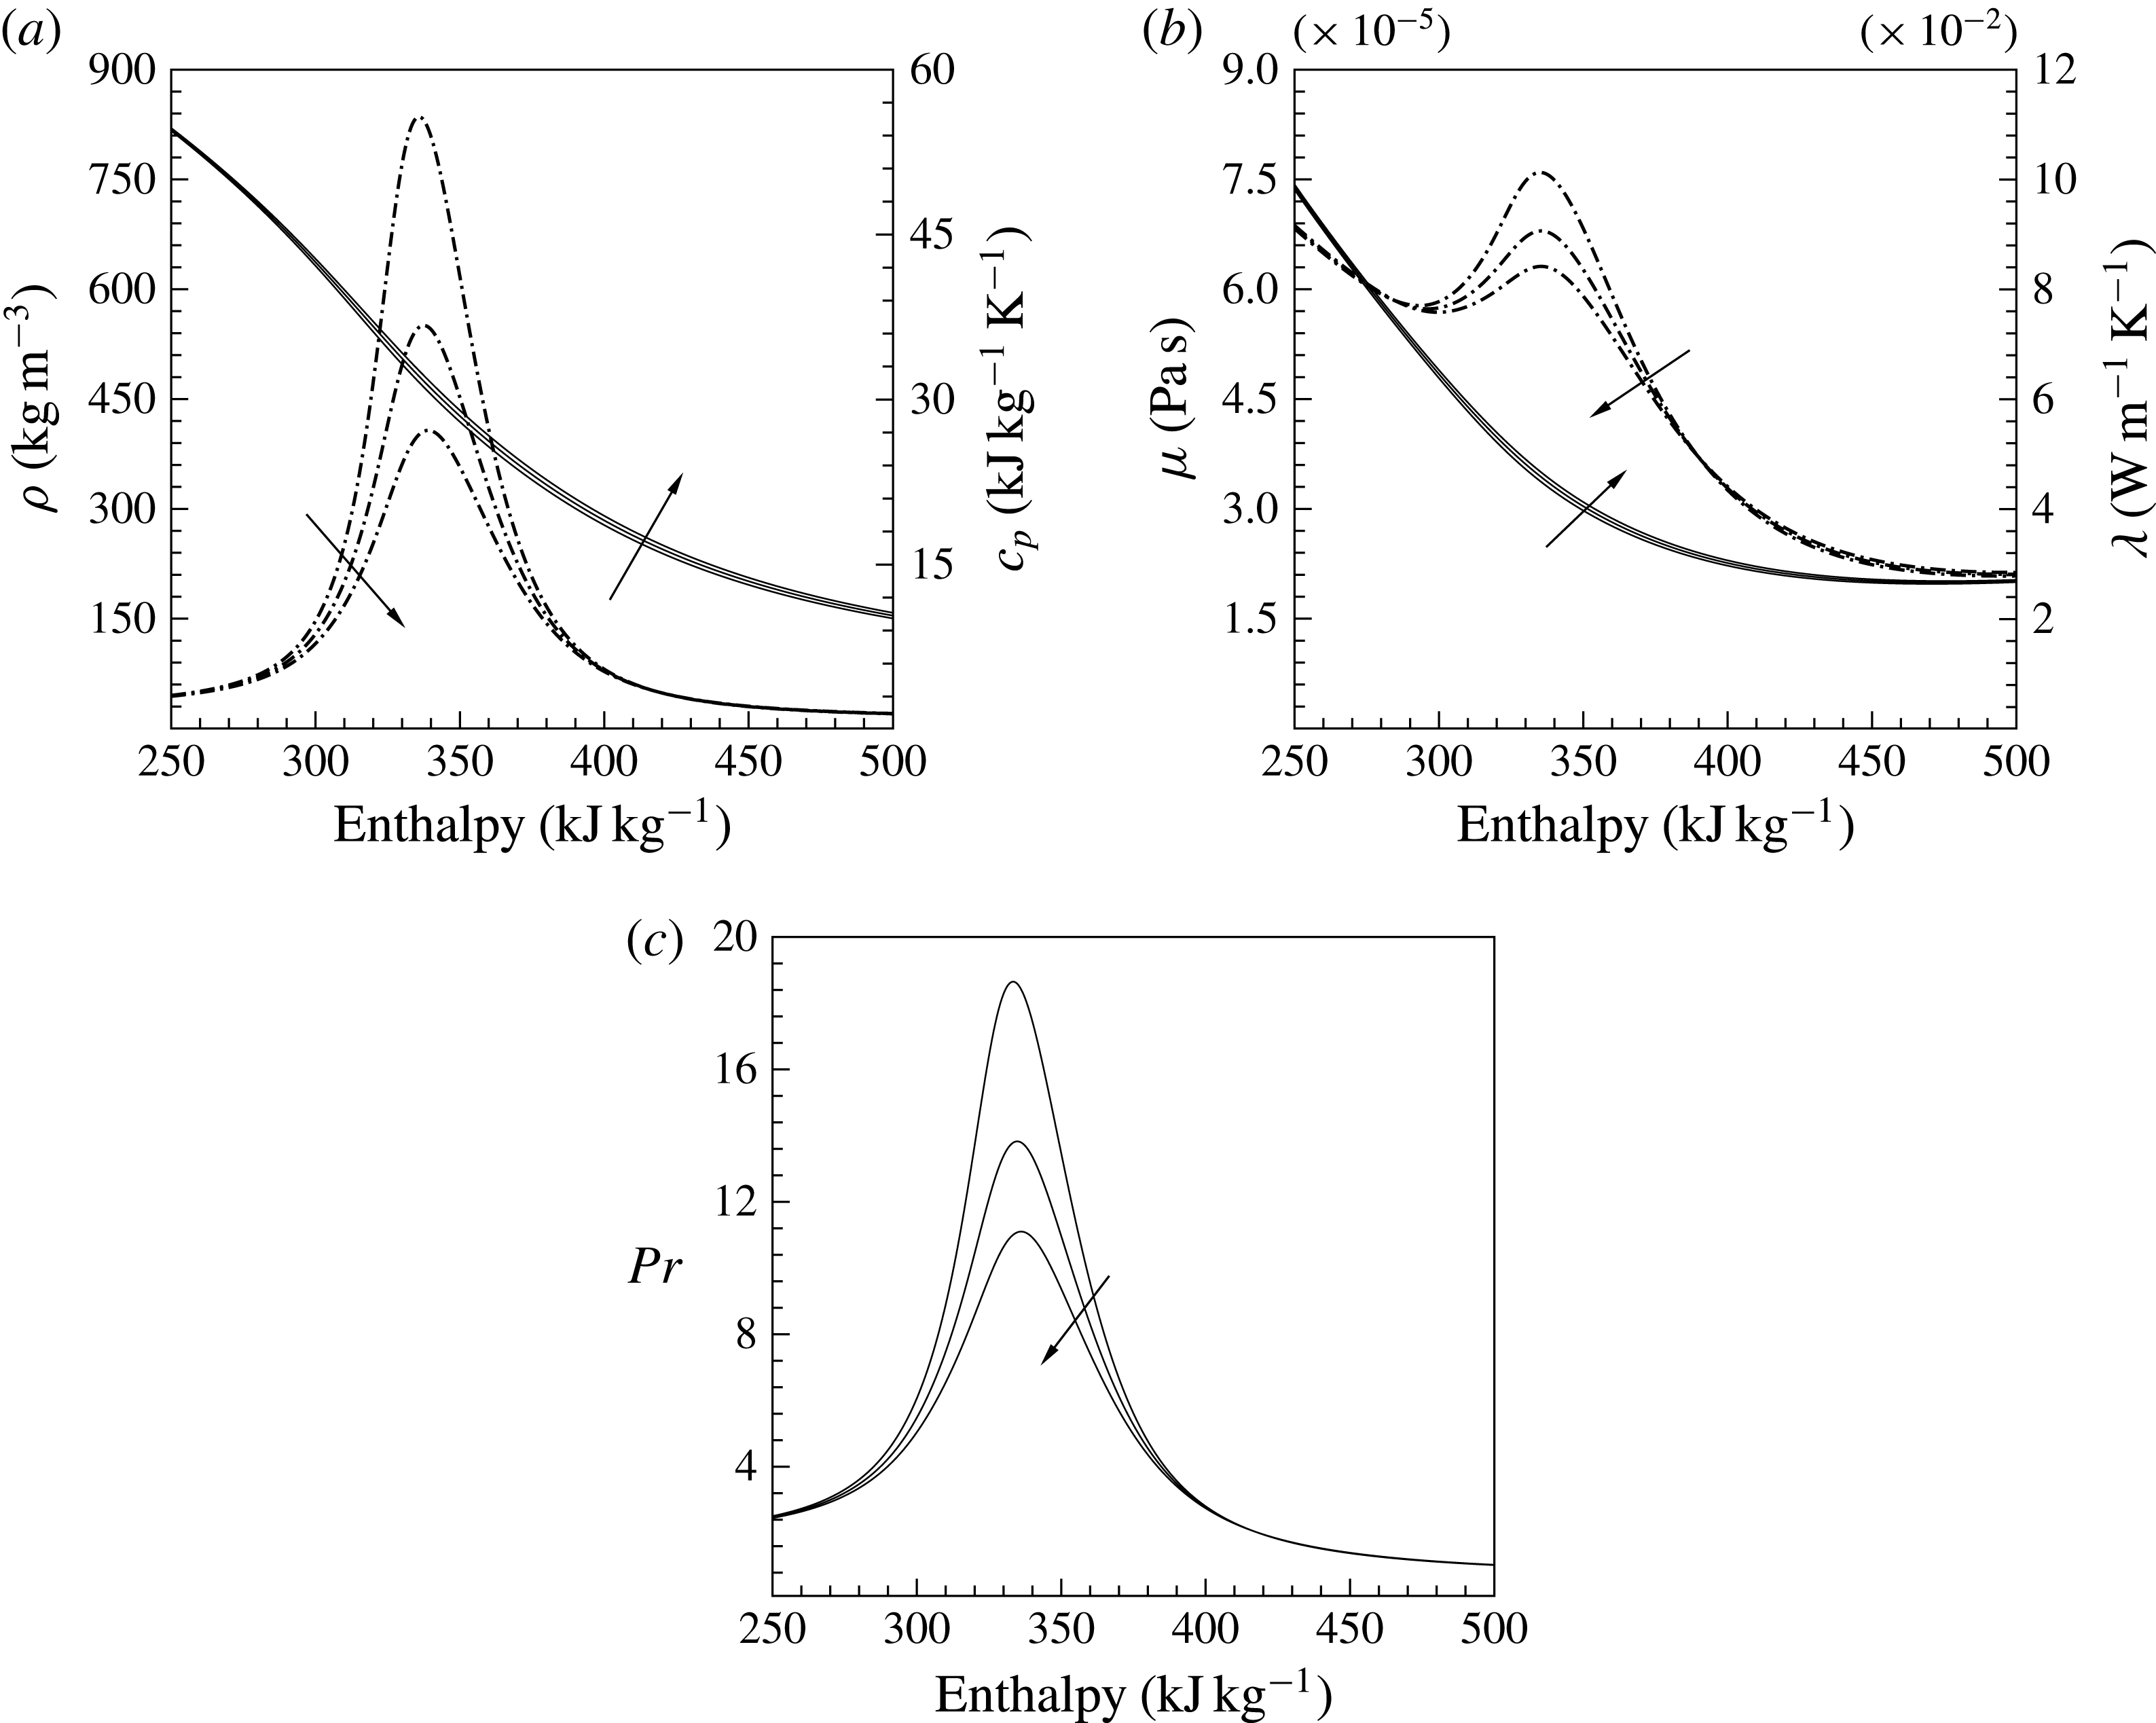
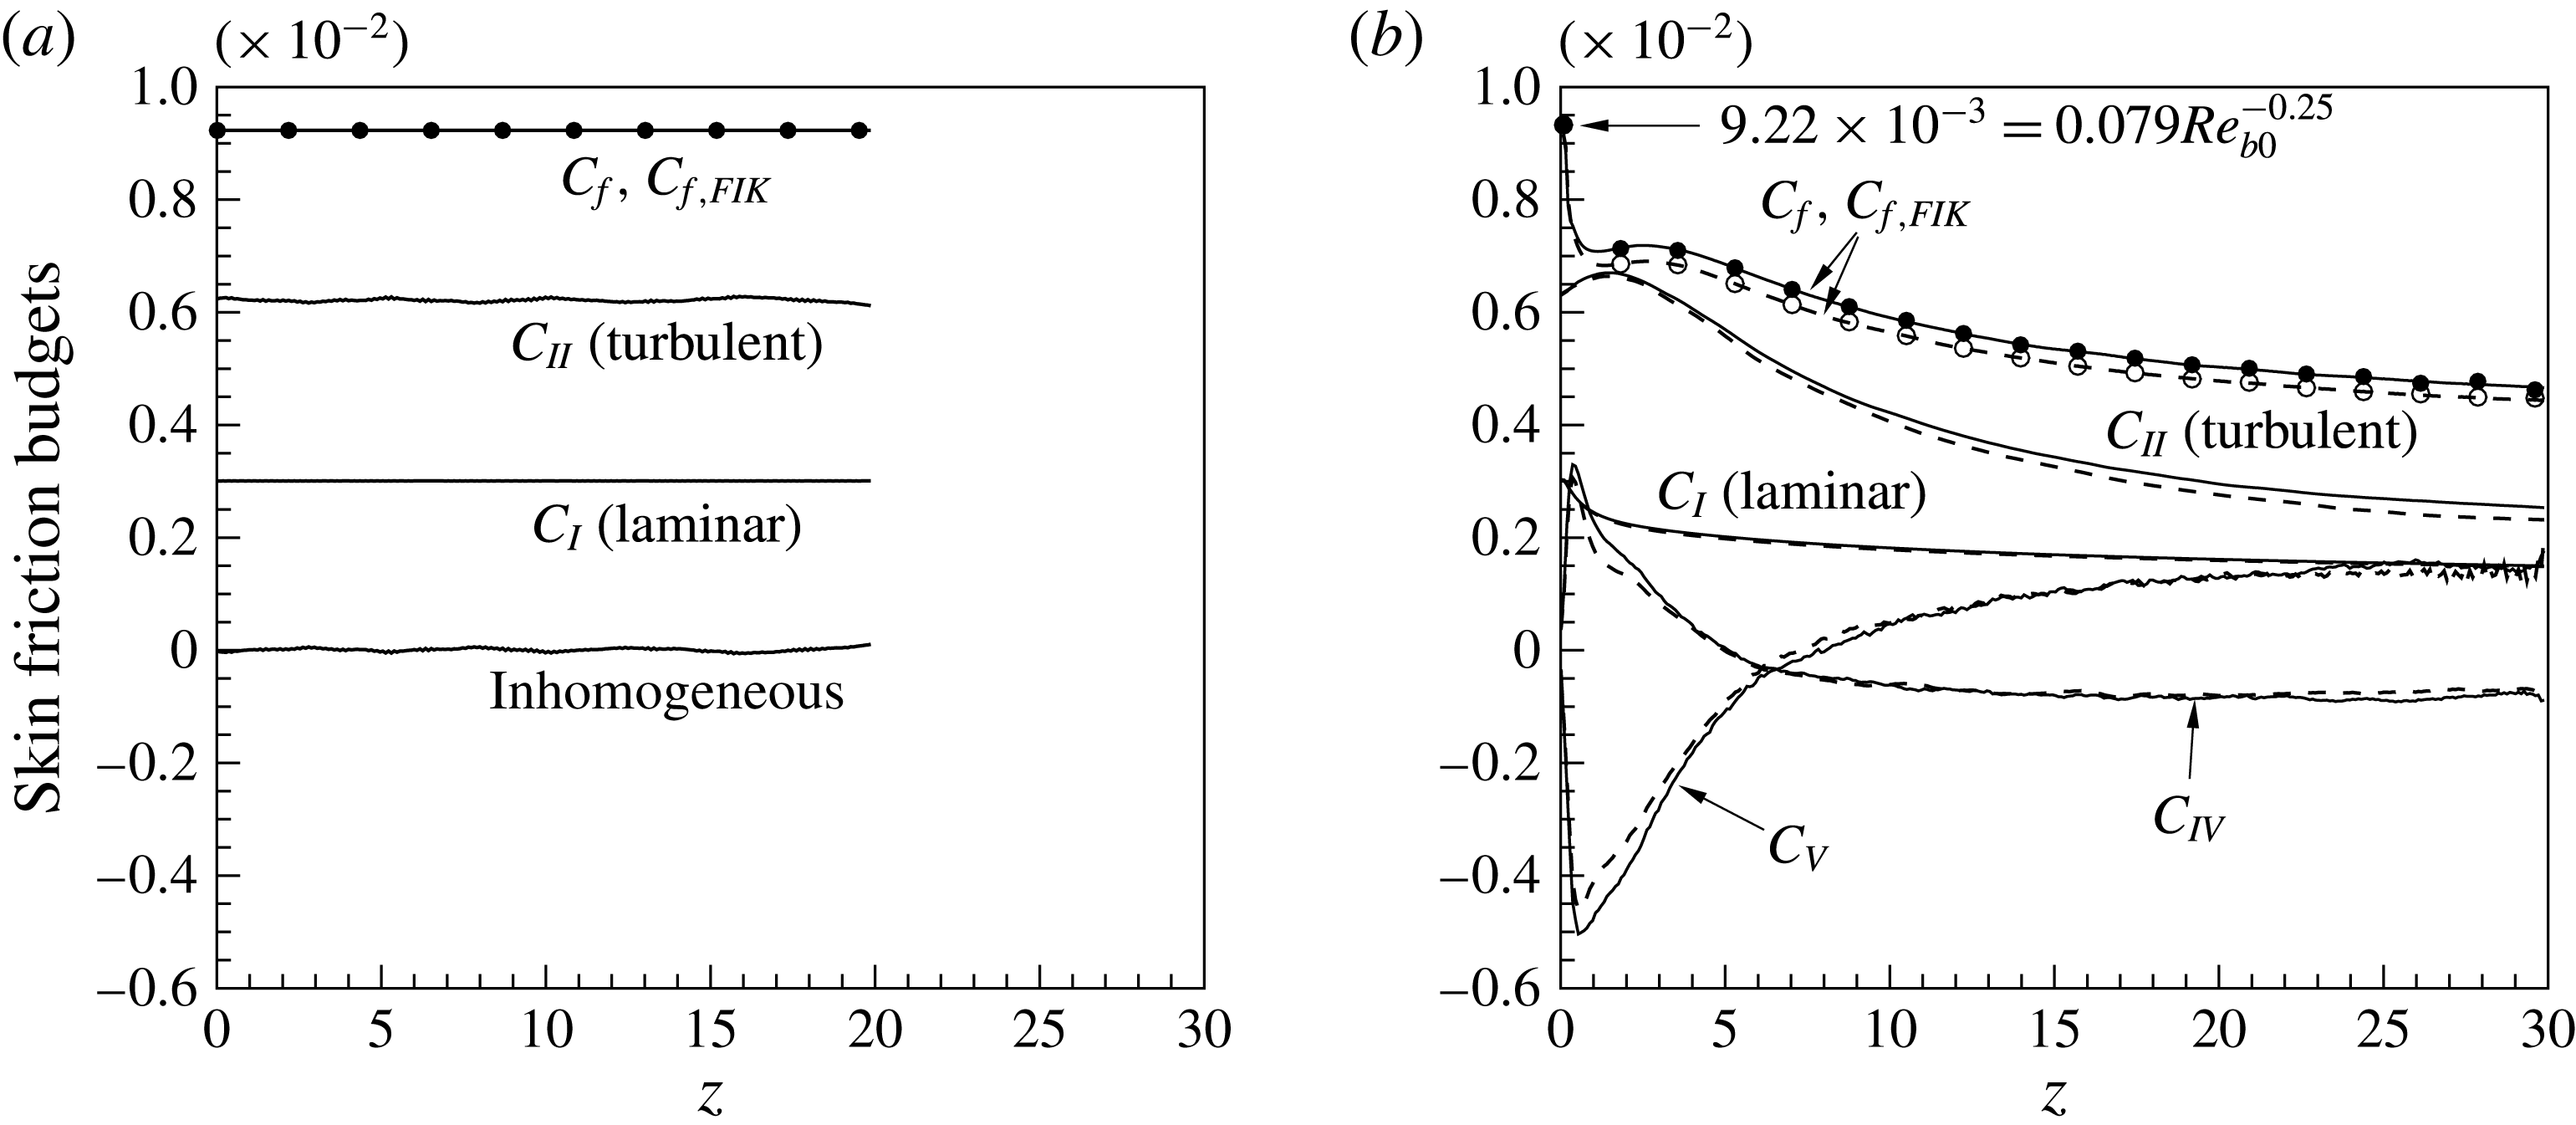
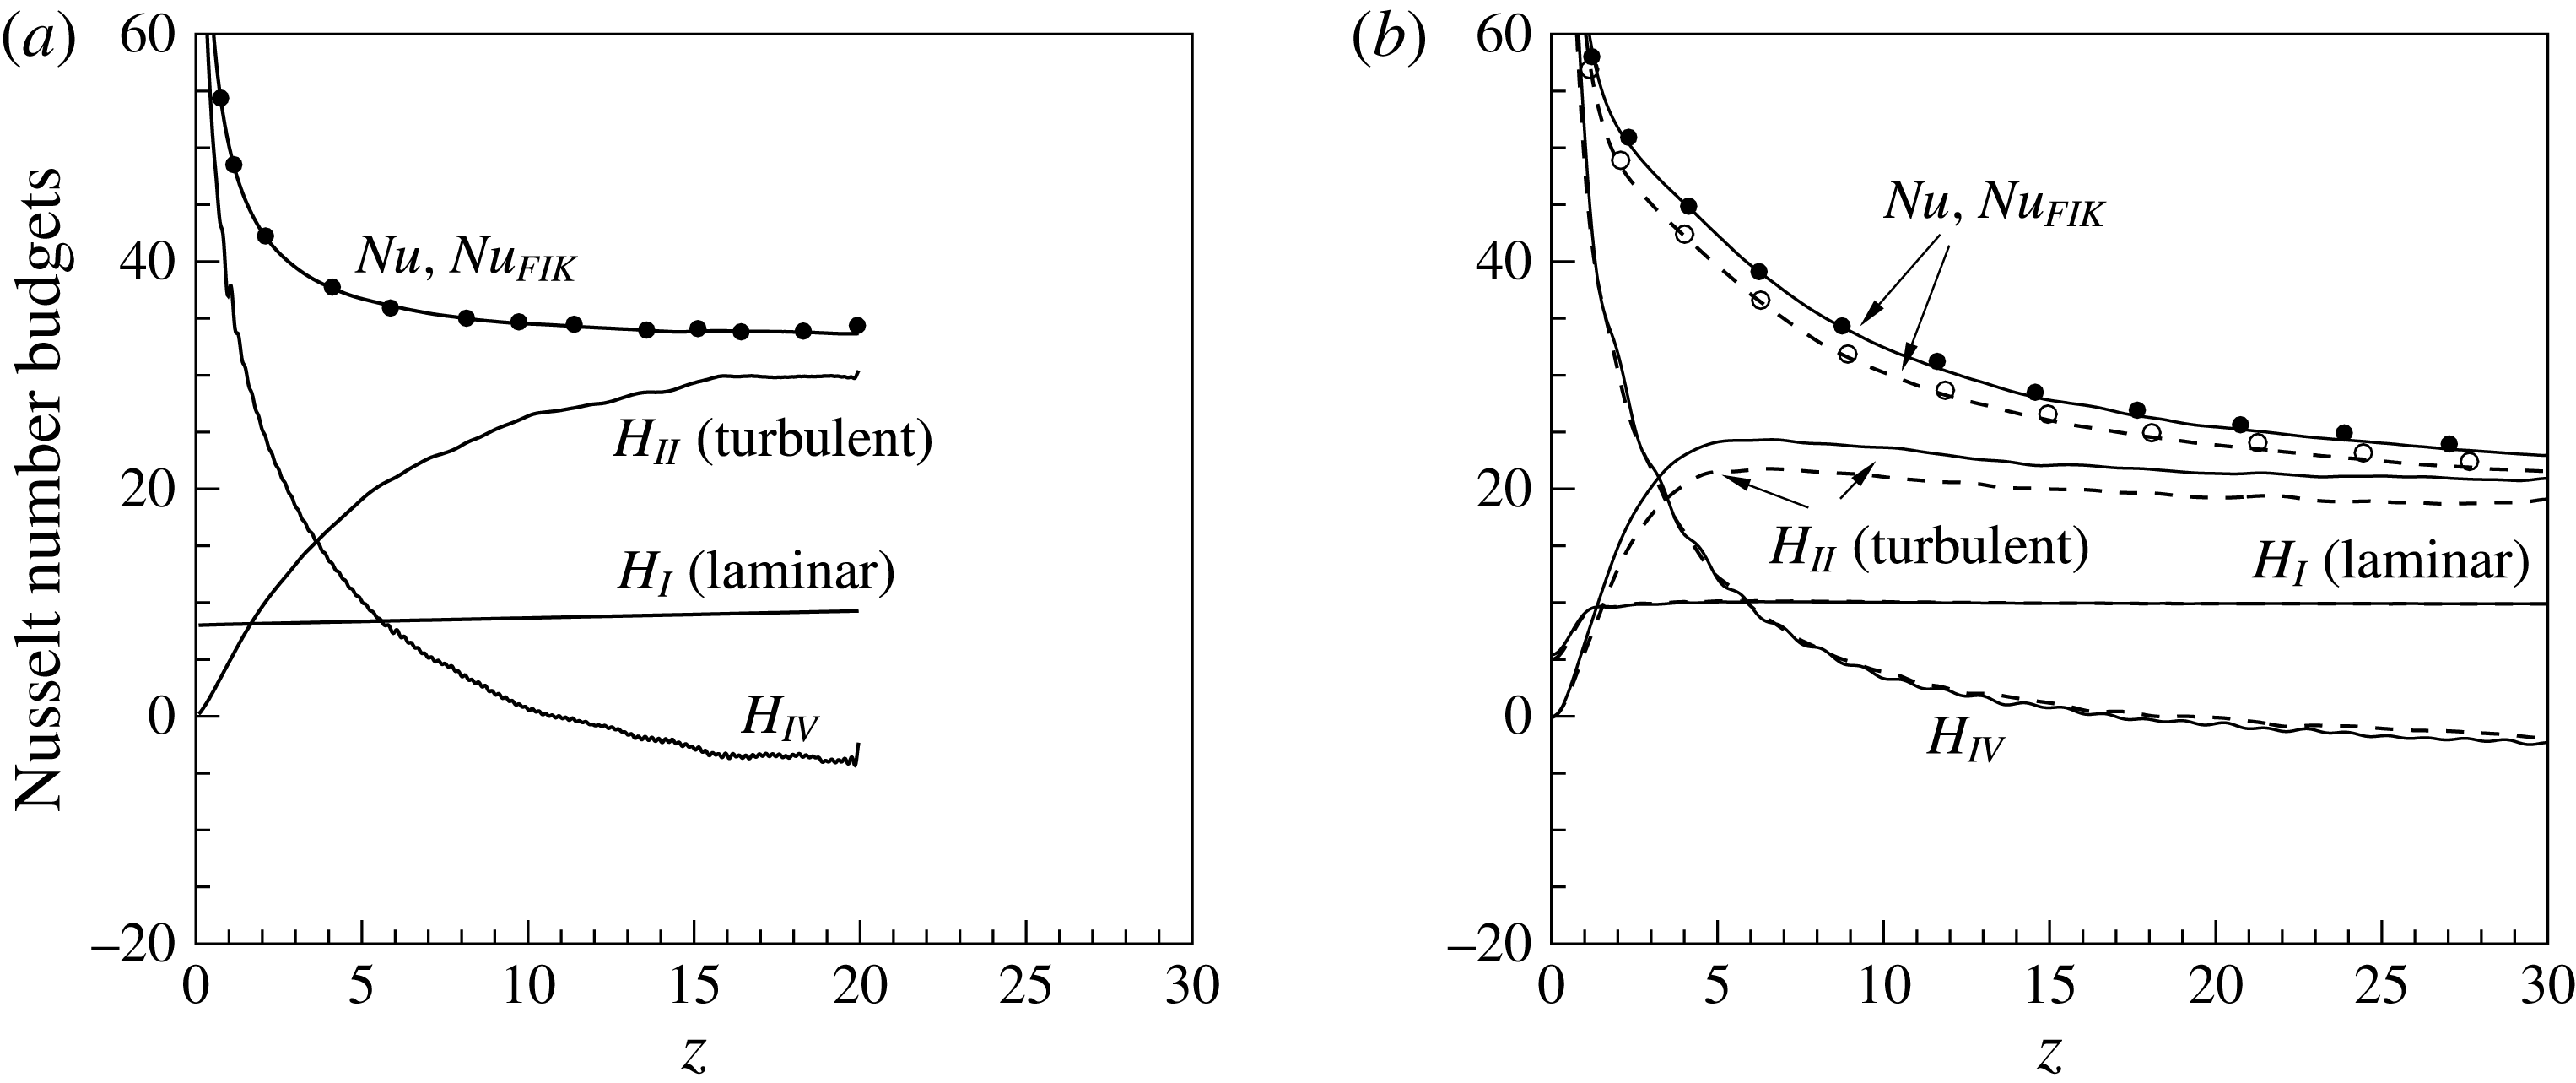
Figure 1. Property variations of carbon dioxide
![]() $\text{CO}_{2}$
versus enthalpy for pressures
$\text{CO}_{2}$
versus enthalpy for pressures
![]() $P_{0}=78$
, 80 and 82 bar based on Span & Wagner (Reference Span and Wagner2003) (arrows show the direction of increasing
$P_{0}=78$
, 80 and 82 bar based on Span & Wagner (Reference Span and Wagner2003) (arrows show the direction of increasing
![]() $P_{0}$
). (a) Density
$P_{0}$
). (a) Density
![]() ${\it\rho}$
(——) and isobaric heat capacity
${\it\rho}$
(——) and isobaric heat capacity
![]() $c_{p}$
(— ⋅ —), (b) dynamic viscosity
$c_{p}$
(— ⋅ —), (b) dynamic viscosity
![]() ${\it\mu}$
(——) and thermal conductivity
${\it\mu}$
(——) and thermal conductivity
![]() ${\it\lambda}$
(— ⋅ —) and (c) Prandtl number (——).
${\it\lambda}$
(— ⋅ —) and (c) Prandtl number (——).
In the supercritical region, small changes in temperature and pressure can lead to substantial changes in thermophysical properties. As an example, figure 1 shows the variation of thermophysical properties of
![]() $\text{CO}_{2}$
as a function of temperature at three different pressures above the critical pressure (
$\text{CO}_{2}$
as a function of temperature at three different pressures above the critical pressure (
![]() $P_{critical}=73.773$
bar). It shows that the thermophysical properties of the fluid, at constant pressure, vary significantly within a narrow temperature range (295–355 K) across the pseudo-critical temperature
$P_{critical}=73.773$
bar). It shows that the thermophysical properties of the fluid, at constant pressure, vary significantly within a narrow temperature range (295–355 K) across the pseudo-critical temperature
![]() $T_{pc}$
. The pseudo-critical temperature
$T_{pc}$
. The pseudo-critical temperature
![]() $T_{pc}$
is defined as the temperature along a supercritical isobar at which the specific heat capacity
$T_{pc}$
is defined as the temperature along a supercritical isobar at which the specific heat capacity
![]() $c_{p}$
has a maximum value. This is also the point where a supercritical isobar intersects with the critical isochore (density at the critical point). Owing to these unusual thermophysical properties, heat transfer at a supercritical pressure is very different from that at subcritical pressures. Experimental and numerical studies of heat transfer characteristics of flows at supercritical pressure have been reviewed by Yoo (Reference Yoo2013) and detailed turbulence statistics containing second-order moments for Reynolds stresses and turbulent heat flux obtained from direct numerical simulation (DNS) are given in Bae, Yoo & Choi (Reference Bae, Yoo and Choi2005), Bae, Yoo & McEligot (Reference Bae, Yoo and McEligot2008) and Nemati et al. (Reference Nemati, Patel, Boersma and Pecnik2015). It was shown that property fluctuations, in the case of an isoflux wall boundary condition, significantly affect the mean energy transfer and strongly modify the average heat flux distribution at, and close to, the wall. This motivated us to study the effect of the thermal effusivity ratio on heat transfer to supercritical fluids.
$c_{p}$
has a maximum value. This is also the point where a supercritical isobar intersects with the critical isochore (density at the critical point). Owing to these unusual thermophysical properties, heat transfer at a supercritical pressure is very different from that at subcritical pressures. Experimental and numerical studies of heat transfer characteristics of flows at supercritical pressure have been reviewed by Yoo (Reference Yoo2013) and detailed turbulence statistics containing second-order moments for Reynolds stresses and turbulent heat flux obtained from direct numerical simulation (DNS) are given in Bae, Yoo & Choi (Reference Bae, Yoo and Choi2005), Bae, Yoo & McEligot (Reference Bae, Yoo and McEligot2008) and Nemati et al. (Reference Nemati, Patel, Boersma and Pecnik2015). It was shown that property fluctuations, in the case of an isoflux wall boundary condition, significantly affect the mean energy transfer and strongly modify the average heat flux distribution at, and close to, the wall. This motivated us to study the effect of the thermal effusivity ratio on heat transfer to supercritical fluids.
The thermal effusivity ratio
![]() $K$
(also called the thermal activity ratio) describes the ability of two materials to exchange heat. The thermal effusivity is defined as the square root of the product of density, thermal conductivity and specific heat capacity, namely
$K$
(also called the thermal activity ratio) describes the ability of two materials to exchange heat. The thermal effusivity is defined as the square root of the product of density, thermal conductivity and specific heat capacity, namely
![]() $e=\sqrt{{\it\rho}{\it\lambda}c_{p}}$
(Carslaw & Jaeger Reference Carslaw and Jaeger1959). For example, if two semi-infinite materials with different temperatures
$e=\sqrt{{\it\rho}{\it\lambda}c_{p}}$
(Carslaw & Jaeger Reference Carslaw and Jaeger1959). For example, if two semi-infinite materials with different temperatures
![]() $T_{1}$
and
$T_{1}$
and
![]() $T_{2}$
are brought into contact, the equilibrium contact temperature is a function of
$T_{2}$
are brought into contact, the equilibrium contact temperature is a function of
![]() $K=e_{2}/e_{1}$
, expressed as
$K=e_{2}/e_{1}$
, expressed as
![]() $T_{c}=(T_{1}+KT_{2})/(1+K)$
. It follows that for
$T_{c}=(T_{1}+KT_{2})/(1+K)$
. It follows that for
![]() $K\gg 1$
, the contact temperature is closer to
$K\gg 1$
, the contact temperature is closer to
![]() $T_{2}$
, while for
$T_{2}$
, while for
![]() $K\ll 1$
it is closer to
$K\ll 1$
it is closer to
![]() $T_{1}$
. In the case of heat transfer between a turbulent flow and a solid, the thermal effusivity ratio (
$T_{1}$
. In the case of heat transfer between a turbulent flow and a solid, the thermal effusivity ratio (
![]() $K=e_{\mathit{fluid}}/e_{\mathit{solid}}$
) not only determines the averaged contact temperature but also whether wall temperature fluctuations are allowed or suppressed. Kasagi, Kuroda & Hirata (Reference Kasagi, Kuroda and Hirata1989) investigated the effect of thermal effusivity ratio, wall thickness, and Prandtl number on wall temperature fluctuations and turbulent heat transfer. They found that for thick solid walls and
$K=e_{\mathit{fluid}}/e_{\mathit{solid}}$
) not only determines the averaged contact temperature but also whether wall temperature fluctuations are allowed or suppressed. Kasagi, Kuroda & Hirata (Reference Kasagi, Kuroda and Hirata1989) investigated the effect of thermal effusivity ratio, wall thickness, and Prandtl number on wall temperature fluctuations and turbulent heat transfer. They found that for thick solid walls and
![]() $K\rightarrow 0$
, no temperature fluctuations can occur, such that the thermal boundary condition can be approximated as an ideal isothermal wall. This condition is met for combinations of air and most solid materials, and for water if heated or cooled by a thick copper wall. On the other hand, for
$K\rightarrow 0$
, no temperature fluctuations can occur, such that the thermal boundary condition can be approximated as an ideal isothermal wall. This condition is met for combinations of air and most solid materials, and for water if heated or cooled by a thick copper wall. On the other hand, for
![]() $K\rightarrow \infty$
the wall heat flux can be described by an ideal isoflux wall boundary condition. For values of
$K\rightarrow \infty$
the wall heat flux can be described by an ideal isoflux wall boundary condition. For values of
![]() $K\approx 1$
, such as water and glass, temperature fluctuations at the wall are approximately 50 % to that of an ideal isoflux wall. Kasagi et al. (Reference Kasagi, Kuroda and Hirata1989) also investigated the effect of wall thickness on temperature fluctuations. For fluids with
$K\approx 1$
, such as water and glass, temperature fluctuations at the wall are approximately 50 % to that of an ideal isoflux wall. Kasagi et al. (Reference Kasagi, Kuroda and Hirata1989) also investigated the effect of wall thickness on temperature fluctuations. For fluids with
![]() $Pr\approx 1$
and a thermal conductivity a hundred times lower than that of the solid, temperature fluctuations are independent for wall thicknesses larger than the non-dimensional wall distance of
$Pr\approx 1$
and a thermal conductivity a hundred times lower than that of the solid, temperature fluctuations are independent for wall thicknesses larger than the non-dimensional wall distance of
![]() $y^{+}\approx 100$
of the fluid. By decreasing the wall thickness, the temperature fluctuations approach the value of the ideal isoflux condition, even for
$y^{+}\approx 100$
of the fluid. By decreasing the wall thickness, the temperature fluctuations approach the value of the ideal isoflux condition, even for
![]() $K\ll 1$
. Later, Tiselj et al. (Reference Tiselj, Bergant, Mavko, Bajsic and Hetsroni2001a
) confirmed the results of Kasagi et al. (Reference Kasagi, Kuroda and Hirata1989) by performing DNS of fully developed turbulent channel flows with conjugate heat transfer by varying values of wall thickness, effusivity ratio and Prandtl number.
$K\ll 1$
. Later, Tiselj et al. (Reference Tiselj, Bergant, Mavko, Bajsic and Hetsroni2001a
) confirmed the results of Kasagi et al. (Reference Kasagi, Kuroda and Hirata1989) by performing DNS of fully developed turbulent channel flows with conjugate heat transfer by varying values of wall thickness, effusivity ratio and Prandtl number.
Kays & Crawford (Reference Kays and Crawford1993) found that in a fully developed turbulent pipe flow the effects of temperature fluctuations on heat transfer vanish with increasing Prandtl number and that the Nusselt number for isoflux and isothermal boundary conditions are equal if
![]() $Pr\geqslant 0.7$
. This can be explained by the thickness of thermal resistance region, which depends on the Prandtl number. For fluids with
$Pr\geqslant 0.7$
. This can be explained by the thickness of thermal resistance region, which depends on the Prandtl number. For fluids with
![]() $Pr\ll 1$
the dominant heat transfer mechanism is thermal conduction, which causes the thermal resistance region to move toward the centre of the pipe. In this case, different thermal wall boundary conditions have a large influence on temperature fluctuations and consequently heat transfer from the wall. A higher value of
$Pr\ll 1$
the dominant heat transfer mechanism is thermal conduction, which causes the thermal resistance region to move toward the centre of the pipe. In this case, different thermal wall boundary conditions have a large influence on temperature fluctuations and consequently heat transfer from the wall. A higher value of
![]() $Pr$
causes the thermal resistance region to move closer to the wall, such that the vanishing (small) velocity fluctuations very close to the wall mitigate the effect of temperature fluctuations on the wall-normal turbulent heat flux. Studies on flat plate boundary layers with respect to different thermal boundary conditions were performed by Kong, Choi & Lee (Reference Kong, Choi and Lee2000) and Li et al. (Reference Li, Schlatter, Brandt and Henningson2009). They showed that close to the wall the behaviour of the wall-normal heat flux for isothermal wall boundary conditions is similar to that of the Reynolds shear stress, implying consistency between temperature and streamwise velocity. They also confirmed that the mean temperature profiles and the streamwise Stanton number (
$Pr$
causes the thermal resistance region to move closer to the wall, such that the vanishing (small) velocity fluctuations very close to the wall mitigate the effect of temperature fluctuations on the wall-normal turbulent heat flux. Studies on flat plate boundary layers with respect to different thermal boundary conditions were performed by Kong, Choi & Lee (Reference Kong, Choi and Lee2000) and Li et al. (Reference Li, Schlatter, Brandt and Henningson2009). They showed that close to the wall the behaviour of the wall-normal heat flux for isothermal wall boundary conditions is similar to that of the Reynolds shear stress, implying consistency between temperature and streamwise velocity. They also confirmed that the mean temperature profiles and the streamwise Stanton number (
![]() $St=Nu/(Re\,Pr)$
) distributions are independent of the boundary condition for Prandtl numbers above unity. Further studies on this topic have been performed by Iritani, Kasagi & Hirata (Reference Iritani, Kasagi and Hirata1985), Hetsroni & Rozenblit (Reference Hetsroni and Rozenblit1994), Mosyak, Pogrebnyak & Hetsroni (Reference Mosyak, Pogrebnyak and Hetsroni2001), Verzicco & Sreenivasan (Reference Verzicco and Sreenivasan2008), who also investigated the effect of thermal wall boundary condition on wall temperature fluctuations and turbulent heat transfer.
$St=Nu/(Re\,Pr)$
) distributions are independent of the boundary condition for Prandtl numbers above unity. Further studies on this topic have been performed by Iritani, Kasagi & Hirata (Reference Iritani, Kasagi and Hirata1985), Hetsroni & Rozenblit (Reference Hetsroni and Rozenblit1994), Mosyak, Pogrebnyak & Hetsroni (Reference Mosyak, Pogrebnyak and Hetsroni2001), Verzicco & Sreenivasan (Reference Verzicco and Sreenivasan2008), who also investigated the effect of thermal wall boundary condition on wall temperature fluctuations and turbulent heat transfer.
In this work, we investigate the influence of thermal wall boundary conditions, namely isothermal (
![]() $K\rightarrow 0$
) and isoflux (
$K\rightarrow 0$
) and isoflux (
![]() $K\rightarrow \infty$
), on heat transfer to fluids with large property variations and high Prandtl numbers. The configuration is a heated developing pipe flow with supercritical
$K\rightarrow \infty$
), on heat transfer to fluids with large property variations and high Prandtl numbers. The configuration is a heated developing pipe flow with supercritical
![]() $\text{CO}_{2}$
at a pressure of 80 bar. The fluid temperature at the inlet is slightly below the thermodynamic pseudo-critical point and the fluid is heated at the wall, such that the fluid crosses a region where strong thermophysical property variations occur. If supercritical
$\text{CO}_{2}$
at a pressure of 80 bar. The fluid temperature at the inlet is slightly below the thermodynamic pseudo-critical point and the fluid is heated at the wall, such that the fluid crosses a region where strong thermophysical property variations occur. If supercritical
![]() $\text{CO}_{2}$
at 80 bar is considered as the heat transfer medium in a heat exchanger made of stainless steel, the effusivity ratio at the pseudo-critical temperature is of the order of
$\text{CO}_{2}$
at 80 bar is considered as the heat transfer medium in a heat exchanger made of stainless steel, the effusivity ratio at the pseudo-critical temperature is of the order of
![]() $K=0.15$
. Thus, it can be expected that considerable temperature fluctuations at the wall can occur, which can be estimated to approximately 20 % that of ideal isoflux boundary conditions for thick walls (see, for example, Kasagi et al.
Reference Kasagi, Kuroda and Hirata1989; Tiselj et al.
Reference Tiselj, Bergant, Mavko, Bajsic and Hetsroni2001a
; Tiselj & Cizelj Reference Tiselj and Cizelj2012). For thin walls, the fluctuations can be even higher. However, the Prandtl number close to the pseudo-critical point is approximately 14 (see figure 1) and the effect of the thermal boundary conditions – and thus wall temperature fluctuations – on the turbulent heat transfer should be negligible. As we will outline in this work, this is not the case for fluids with large property variations.
$K=0.15$
. Thus, it can be expected that considerable temperature fluctuations at the wall can occur, which can be estimated to approximately 20 % that of ideal isoflux boundary conditions for thick walls (see, for example, Kasagi et al.
Reference Kasagi, Kuroda and Hirata1989; Tiselj et al.
Reference Tiselj, Bergant, Mavko, Bajsic and Hetsroni2001a
; Tiselj & Cizelj Reference Tiselj and Cizelj2012). For thin walls, the fluctuations can be even higher. However, the Prandtl number close to the pseudo-critical point is approximately 14 (see figure 1) and the effect of the thermal boundary conditions – and thus wall temperature fluctuations – on the turbulent heat transfer should be negligible. As we will outline in this work, this is not the case for fluids with large property variations.
The organisation of the paper is as follows. In § 2 the governing equations of momentum and energy in their low Mach number approximation are briefly described and §§ 3 and 4 discuss the simulation set-up and boundary conditions. Section 5 outlines the results for the instantaneous fields (§ 5.1), mean and turbulence statistics (§ 5.2), quadrant analysis of the Reynolds shear stress and the turbulent heat flux (§ 5.3) and turbulence budgets in § 5.4. In § 5.5 we exploit the Fukagata, Iwamoto & Kasagi identity (Fukagata, Iwamoto & Kasagi Reference Fukagata, Iwamoto and Kasagi2002) to show the exact relations between wall quantities, e.g. wall shear stress and wall heat flux, and the contributions from different physical mechanisms. The summary of our results is given in § 6.
2 Governing equations
In the present study, the anelastic (also known as the low Mach number) approximation of the Navier–Stokes equations in cylindrical coordinates is solved. The effects associated with density changes in response to pressure fluctuations, which are regarded as compressibility effects, are thus not captured. However, the variable inertia effects related to density changes due to heat transfer are taken into account (Lele Reference Lele1994). For the sake of brevity, the derivation of the governing equations is omitted and can be found in Nemati et al. (Reference Nemati, Patel, Boersma and Pecnik2015). The final form of the equations is:
where
![]() ${\it\tau}_{ij}=2{\it\mu}S_{ij}={\it\mu}(\partial u_{i}/\partial x_{j}+\partial u_{j}/\partial x_{i}-2/3\,\partial u_{k}/\partial x_{k}{\it\delta}_{ij})$
is the stress tensor,
${\it\tau}_{ij}=2{\it\mu}S_{ij}={\it\mu}(\partial u_{i}/\partial x_{j}+\partial u_{j}/\partial x_{i}-2/3\,\partial u_{k}/\partial x_{k}{\it\delta}_{ij})$
is the stress tensor,
![]() $q_{i}=-{\it\lambda}\partial T/\partial x_{i}=-{\it\alpha}\partial h/\partial x_{i}$
is the Fourier law for the heat conduction and
$q_{i}=-{\it\lambda}\partial T/\partial x_{i}=-{\it\alpha}\partial h/\partial x_{i}$
is the Fourier law for the heat conduction and
![]() ${\it\delta}_{ij}$
is the Kronecker delta. Note, the Fourier law can be also expressed in terms of the enthalpy as,
${\it\delta}_{ij}$
is the Kronecker delta. Note, the Fourier law can be also expressed in terms of the enthalpy as,
![]() $q_{i}=-{\it\alpha}\partial h/\partial x_{i}$
, with
$q_{i}=-{\it\alpha}\partial h/\partial x_{i}$
, with
![]() $c_{p}=\partial h/\partial T$
and
$c_{p}=\partial h/\partial T$
and
![]() ${\it\alpha}={\it\lambda}/c_{p}$
. The symbols
${\it\alpha}={\it\lambda}/c_{p}$
. The symbols
![]() $t$
,
$t$
,
![]() $x_{i}$
,
$x_{i}$
,
![]() ${\it\rho}$
,
${\it\rho}$
,
![]() ${\it\mu}$
,
${\it\mu}$
,
![]() ${\it\lambda}$
,
${\it\lambda}$
,
![]() $c_{p}$
,
$c_{p}$
,
![]() $u_{i}$
,
$u_{i}$
,
![]() $T$
,
$T$
,
![]() $p$
and
$p$
and
![]() $h$
are the dimensionless time, coordinates, density, dynamic viscosity, thermal conductivity, isobaric heat capacity, velocity, temperature, hydrodynamic pressure and enthalpy, respectively. These quantities are non-dimensionalised as:
$h$
are the dimensionless time, coordinates, density, dynamic viscosity, thermal conductivity, isobaric heat capacity, velocity, temperature, hydrodynamic pressure and enthalpy, respectively. These quantities are non-dimensionalised as:
 $$\begin{eqnarray}\left.\begin{array}{@{}c@{}}\displaystyle t=\frac{t^{\ast }}{D^{\ast }/u_{{\it\tau}0}^{\ast }},\quad x_{i}=\frac{x_{i}^{\ast }}{D^{\ast }},\quad {\it\rho}=\frac{{\it\rho}^{\ast }}{{\it\rho}_{0}^{\ast }},\quad {\it\mu}=\frac{{\it\mu}^{\ast }}{{\it\mu}_{0}^{\ast }},\quad {\it\lambda}=\frac{{\it\lambda}^{\ast }}{{\it\lambda}_{0}^{\ast }},\\ \displaystyle c_{p}=\frac{c_{p}^{\ast }}{c_{p0}^{\ast }},\quad u_{i}=\frac{u_{i}^{\ast }}{u_{{\it\tau}0}^{\ast }},\quad T=\frac{T^{\ast }}{T_{0}^{\ast }},\quad p=\frac{p^{\ast }}{{\it\rho}_{0}^{\ast }u_{{\it\tau}0}^{\ast 2}},\quad h=\frac{h^{\ast }-h_{0}^{\ast }}{c_{p0}^{\ast }T_{0}^{\ast }}.\end{array}\right\}\end{eqnarray}$$
Here, the superscript
![]() $^{\ast }$
denotes the dimensional quantities and the subscript
$^{\ast }$
denotes the dimensional quantities and the subscript
![]() $_{0}$
denotes the values at the pipe inlet. The non-dimensional numbers are given by
$_{0}$
denotes the values at the pipe inlet. The non-dimensional numbers are given by
with
![]() $Re_{{\it\tau}0}$
the Reynolds number based on the inlet friction velocity and the pipe diameter
$Re_{{\it\tau}0}$
the Reynolds number based on the inlet friction velocity and the pipe diameter
![]() $D^{\ast }$
,
$D^{\ast }$
,
![]() $Pr_{0}$
is the inlet Prandtl number,
$Pr_{0}$
is the inlet Prandtl number,
![]() $Q$
is the non-dimensional constant wall heat flux and
$Q$
is the non-dimensional constant wall heat flux and
![]() $q_{w}^{\ast }$
is the dimensional constant wall heat flux.
$q_{w}^{\ast }$
is the dimensional constant wall heat flux.
3 Thermal boundary conditions and simulation set-up
Before we discuss the numerical details and the results, it is necessary to outline the procedure for setting the thermal boundary conditions in our simulations. The aim of this work is to investigate the effect of wall temperature fluctuations on the Nusselt number for flows with variable thermophysical properties. Therefore, it is crucial that the thermodynamic conditions for all the investigated cases are equivalent, such that the observed effects on heat transfer only depend on wall temperature fluctuations and not on different thermodynamic states (note, the thermophysical properties depend on the absolute value of temperature).
Kong et al. (Reference Kong, Choi and Lee2000) and Li et al. (Reference Li, Schlatter, Brandt and Henningson2009) investigated the effect of zero/non-zero wall temperature fluctuations on the Nusselt number for constant property fluids by setting isothermal and isoflux boundary condition, respectively. The Nusselt number is defined as
![]() $Nu=HL_{ref}^{\ast }/{\it\lambda}_{ref}^{\ast }$
, with the heat transfer coefficient
$Nu=HL_{ref}^{\ast }/{\it\lambda}_{ref}^{\ast }$
, with the heat transfer coefficient
![]() $H$
, a reference length
$H$
, a reference length
![]() $L_{ref}^{\ast }$
and a reference thermal conductivity
$L_{ref}^{\ast }$
and a reference thermal conductivity
![]() ${\it\lambda}_{ref}^{\ast }$
of the fluid. In their simulations, the non-dimensional temperature
${\it\lambda}_{ref}^{\ast }$
of the fluid. In their simulations, the non-dimensional temperature
![]() ${\it\Theta}$
, the thermal wall boundary condition, and the Nusselt number
${\it\Theta}$
, the thermal wall boundary condition, and the Nusselt number
![]() $Nu$
for
$Nu$
for
![]() $K\rightarrow 0$
and
$K\rightarrow 0$
and
![]() $K\rightarrow \infty$
can be summarised as follows,
$K\rightarrow \infty$
can be summarised as follows,
where
![]() $T_{\infty }^{\ast }$
is the free stream temperature,
$T_{\infty }^{\ast }$
is the free stream temperature,
![]() $T_{w}^{\ast }$
is the wall temperature and
$T_{w}^{\ast }$
is the wall temperature and
![]() $q_{w}^{\ast }$
is the wall heat flux. Note, the bar in (3.1) and (3.2) indicates Reynolds averaging to properly define the average Nusselt number. It is apparent that for constant thermophysical properties, the Nusselt number in (3.1) and (3.2) only depends on the non-dimensional temperature
$q_{w}^{\ast }$
is the wall heat flux. Note, the bar in (3.1) and (3.2) indicates Reynolds averaging to properly define the average Nusselt number. It is apparent that for constant thermophysical properties, the Nusselt number in (3.1) and (3.2) only depends on the non-dimensional temperature
![]() ${\it\Theta}$
.
${\it\Theta}$
.
If the thermophysical properties are a function of temperature, the Nusselt number not only depends on the temperature but also on the thermal conductivity as follows
 $$\begin{eqnarray}Nu=\frac{\left.\overline{{\it\lambda}^{\ast }{\displaystyle \frac{\partial T^{\ast }}{\partial y^{\ast }}}}\right|_{w}}{{\it\lambda}_{ref}^{\ast }(\overline{T}_{w}^{\ast }-T_{b}^{\ast })/L_{ref}^{\ast }}.\end{eqnarray}$$
Moreover, it is also not possible to use isoflux and isothermal boundary conditions and to ensure the same thermodynamic conditions at the wall.
We therefore use a different approach. First, we perform a simulation with a constant heat flux boundary condition that corresponds to a solid–fluid configuration with
![]() $K\rightarrow \infty$
. The averaged wall enthalpy obtained from this simulation is then used for a successive simulation, whereby the wall enthalpy is constant in time but with the same streamwise distribution, as obtained from the simulation with the constant wall heat flux. This simulation is associated with a solid–fluid configuration with
$K\rightarrow \infty$
. The averaged wall enthalpy obtained from this simulation is then used for a successive simulation, whereby the wall enthalpy is constant in time but with the same streamwise distribution, as obtained from the simulation with the constant wall heat flux. This simulation is associated with a solid–fluid configuration with
![]() $K\rightarrow 0$
. This procedure of applying a fluctuating and non-fluctuating wall temperature boundary condition is outlined in figure 2. The same approach was also performed for the constant property simulations to verify this set-up. Note, an equivalent approach would have been to first perform a simulation with an isothermal wall boundary condition (
$K\rightarrow 0$
. This procedure of applying a fluctuating and non-fluctuating wall temperature boundary condition is outlined in figure 2. The same approach was also performed for the constant property simulations to verify this set-up. Note, an equivalent approach would have been to first perform a simulation with an isothermal wall boundary condition (
![]() $K\rightarrow 0$
), and then to use the obtained bulk enthalpy increase to calculate the streamwise heat flux distribution for the successive simulation (
$K\rightarrow 0$
), and then to use the obtained bulk enthalpy increase to calculate the streamwise heat flux distribution for the successive simulation (
![]() $K\rightarrow \infty$
). Four cases have been investigated: two cases with fluid properties corresponding to supercritical
$K\rightarrow \infty$
). Four cases have been investigated: two cases with fluid properties corresponding to supercritical
![]() $\text{CO}_{2}$
at 80 bar and two cases with a constant property fluid. For both pairs, simulations with either a fluctuating or non-fluctuating enthalpy boundary condition at the wall were performed. A summary of all case studies is given in table 1.
$\text{CO}_{2}$
at 80 bar and two cases with a constant property fluid. For both pairs, simulations with either a fluctuating or non-fluctuating enthalpy boundary condition at the wall were performed. A summary of all case studies is given in table 1.
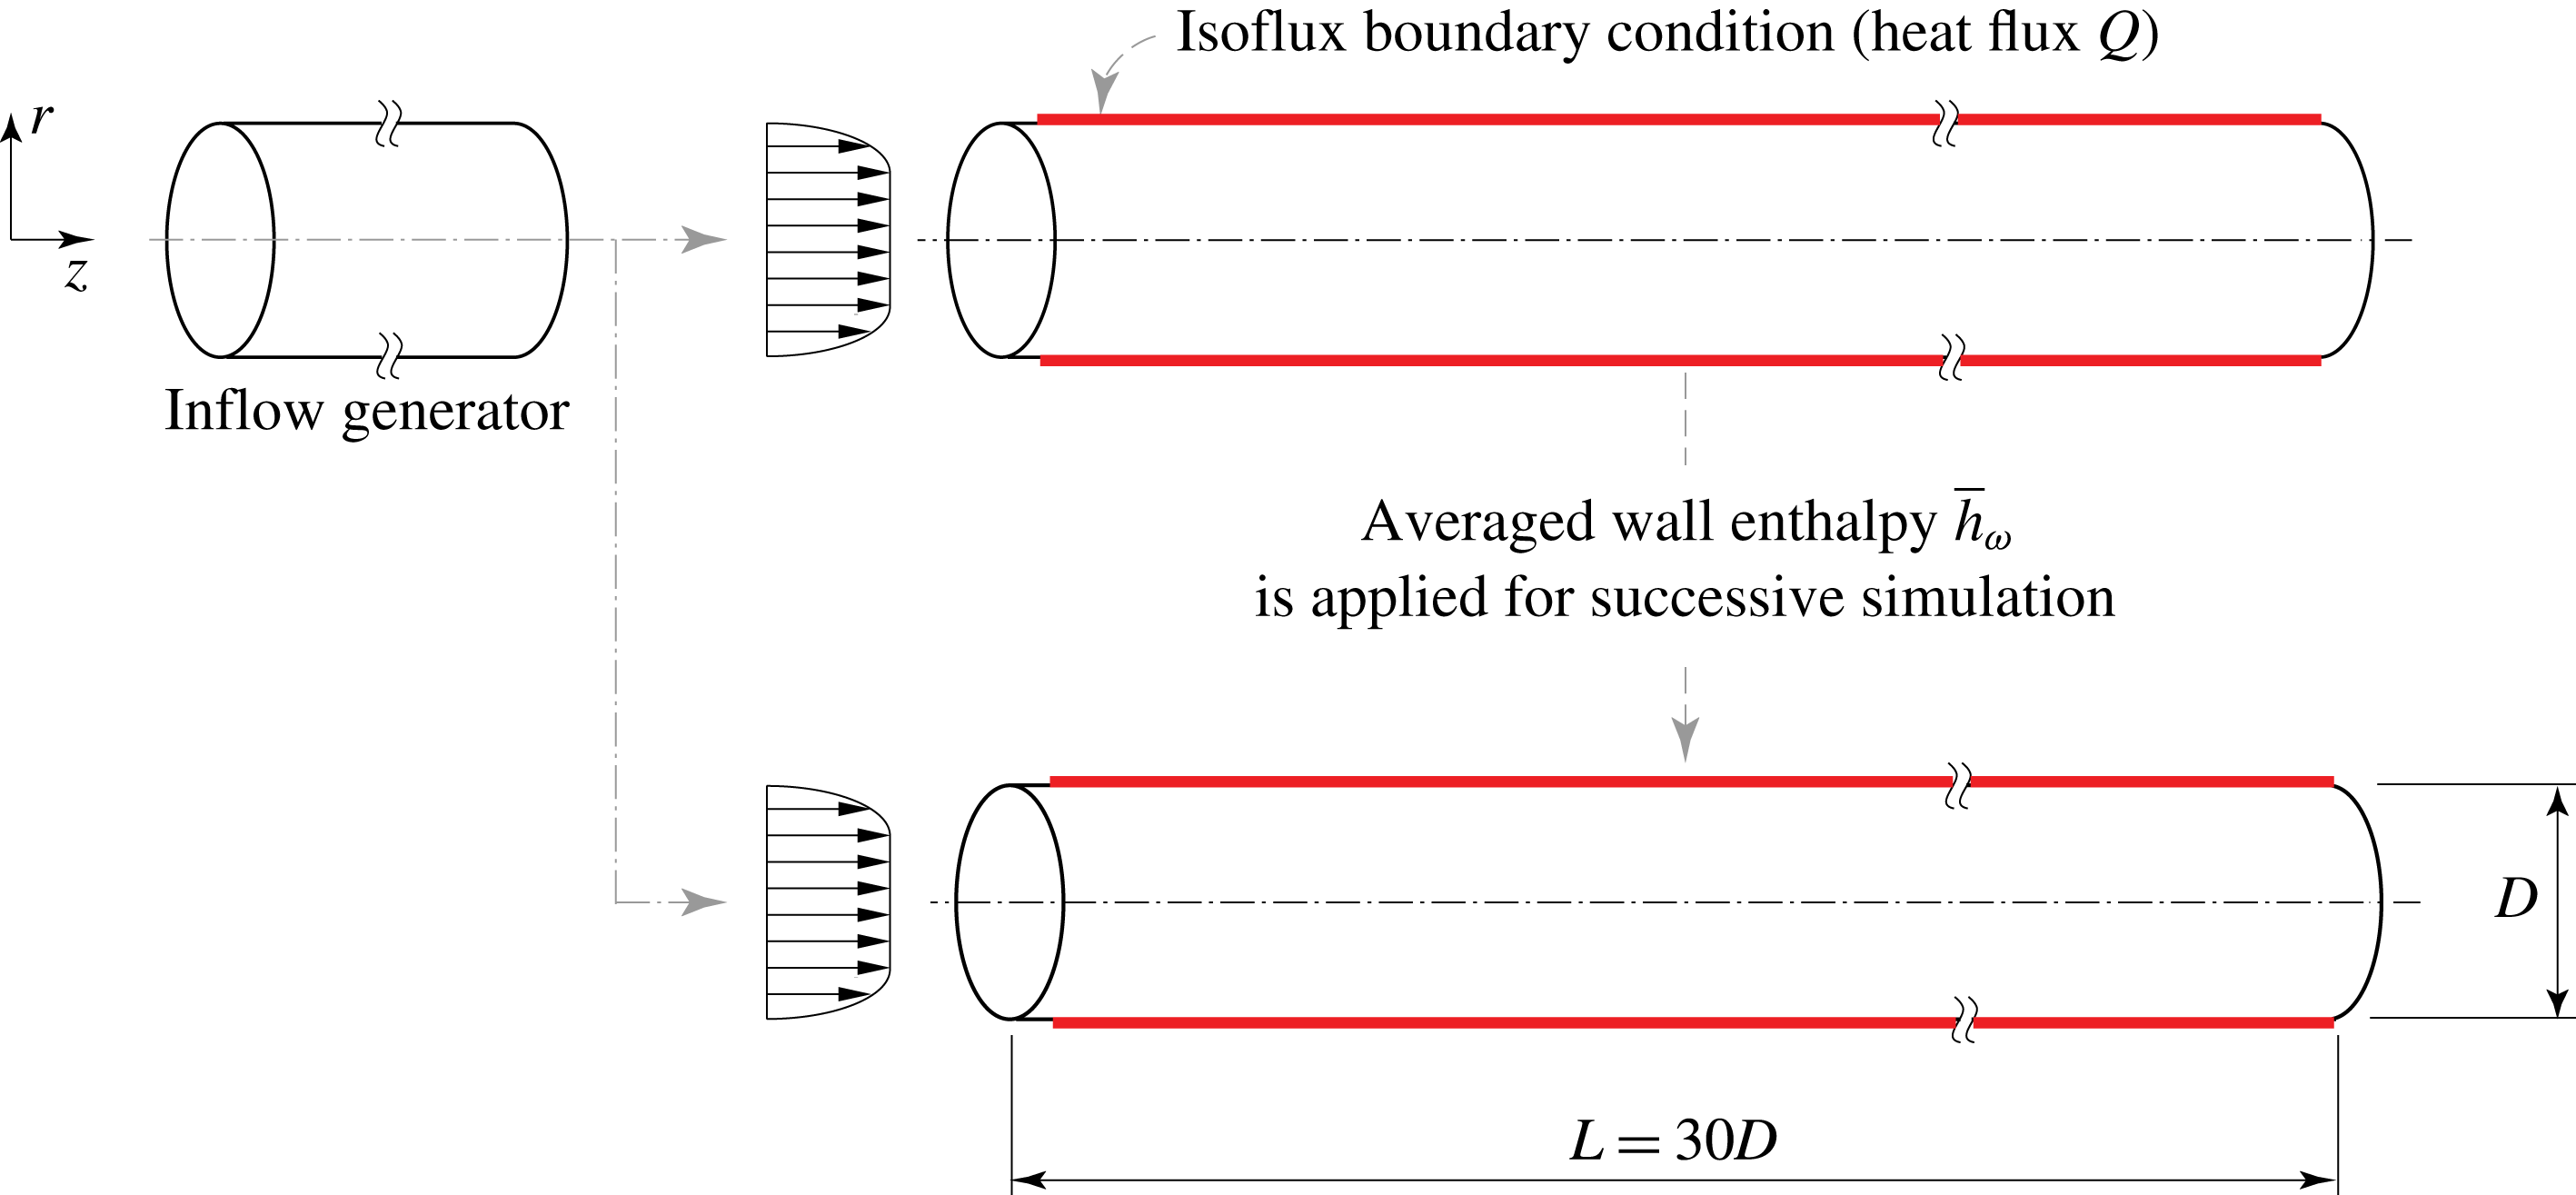
Figure 2. Simulation set-up: an inflow generator is used to provide a fully developed turbulent flow for the developing pipe flows. A simulation with constant heat flux is performed first, which then provides the averaged wall enthalpy for a successive simulation.
Table 1. Case studies corresponding to thermal wall boundary conditions and fluid properties.

4 Numerical details
The numerical scheme used in this work is the same as that given in Nemati et al. (Reference Nemati, Patel, Boersma and Pecnik2015). The governing equations are solved using a staggered arrangement of the velocity components with respect to scalars in space. A second-order central difference scheme is used to discretize the spatial derivatives. The Koren slope limiter (Koren Reference Koren1993) is used for the advection term in the energy equation to ensure smooth solutions in regions with sharp enthalpy gradients. The integration in time is performed similar to the method developed by Najm, Wyckoff & Knio (Reference Najm, Wyckoff and Knio1998). The second-order Crank–Nicolson scheme is applied for the implicit terms (spatial derivatives in the circumferential direction in diffusive terms), and for the explicit terms the Adams–Bashforth (first sub-step) and Adams–Moulton (second sub-step) schemes are used.
The inflow conditions for the developing pipe are generated separately with a periodic adiabatic pipe flow simulation with a pipe length of
![]() $5D^{\ast }$
. A no-slip boundary condition is specified for the velocity components at the wall and a convective outflow boundary condition is used for the velocities and the enthalpy. A constant heat flux of
$5D^{\ast }$
. A no-slip boundary condition is specified for the velocity components at the wall and a convective outflow boundary condition is used for the velocities and the enthalpy. A constant heat flux of
![]() $Q=2.4$
is imposed at the wall for the cases with a fluctuating wall temperature (
$Q=2.4$
is imposed at the wall for the cases with a fluctuating wall temperature (
![]() $K\rightarrow \infty$
) over a length of
$K\rightarrow \infty$
) over a length of
![]() $L^{\ast }$
. The temperature at the inlet of the pipe is set to
$L^{\ast }$
. The temperature at the inlet of the pipe is set to
![]() $T_{0}^{\ast }=301.15$
K, which corresponds to
$T_{0}^{\ast }=301.15$
K, which corresponds to
![]() $h_{0}^{\ast }=274.68~\text{kJ}~\text{kg}^{-1}$
and
$h_{0}^{\ast }=274.68~\text{kJ}~\text{kg}^{-1}$
and
![]() $Pr_{0}=3.19$
for the supercritical fluid case. The Reynolds number based on pipe diameter and friction velocity at the inlet is
$Pr_{0}=3.19$
for the supercritical fluid case. The Reynolds number based on pipe diameter and friction velocity at the inlet is
![]() $Re_{{\it\tau}0}=360$
. The conditions for the constant property cases have the same Reynolds and Prandtl number of 360 and 3.19, which are constant in space.
$Re_{{\it\tau}0}=360$
. The conditions for the constant property cases have the same Reynolds and Prandtl number of 360 and 3.19, which are constant in space.
Several equations of state can be used to model the real gas behaviour of fluids. Currently, the most accurate equations of state in the thermodynamic region close to the critical point are multiparameter equations of state, such as the one developed by Kunz & Wagner (Reference Kunz and Wagner2012) for
![]() $\text{CO}_{2}$
, as used in this work. The relations for the viscosity and thermal conductivity are given in Fenghour, Wakeham & Vesovic (Reference Fenghour, Wakeham and Vesovic1998) and Vesovic et al. (Reference Vesovic, Wakeham, Olchowy, Sengers, Watson and Millat1990), respectively. These multiparameter equations of state and the models for the transport properties are implemented in the NIST REFPROP database (Lemmon, Huber & McLinden Reference Lemmon, Huber and McLinden2013). Because the thermodynamic pressure is constant in time and space, the density, dynamic viscosity, thermal conductivity and temperature are tabulated as a function of enthalpy and then calculated each time step using a third-order spline interpolation along the isobar of
$\text{CO}_{2}$
, as used in this work. The relations for the viscosity and thermal conductivity are given in Fenghour, Wakeham & Vesovic (Reference Fenghour, Wakeham and Vesovic1998) and Vesovic et al. (Reference Vesovic, Wakeham, Olchowy, Sengers, Watson and Millat1990), respectively. These multiparameter equations of state and the models for the transport properties are implemented in the NIST REFPROP database (Lemmon, Huber & McLinden Reference Lemmon, Huber and McLinden2013). Because the thermodynamic pressure is constant in time and space, the density, dynamic viscosity, thermal conductivity and temperature are tabulated as a function of enthalpy and then calculated each time step using a third-order spline interpolation along the isobar of
![]() $P_{0}=80$
bar.
$P_{0}=80$
bar.
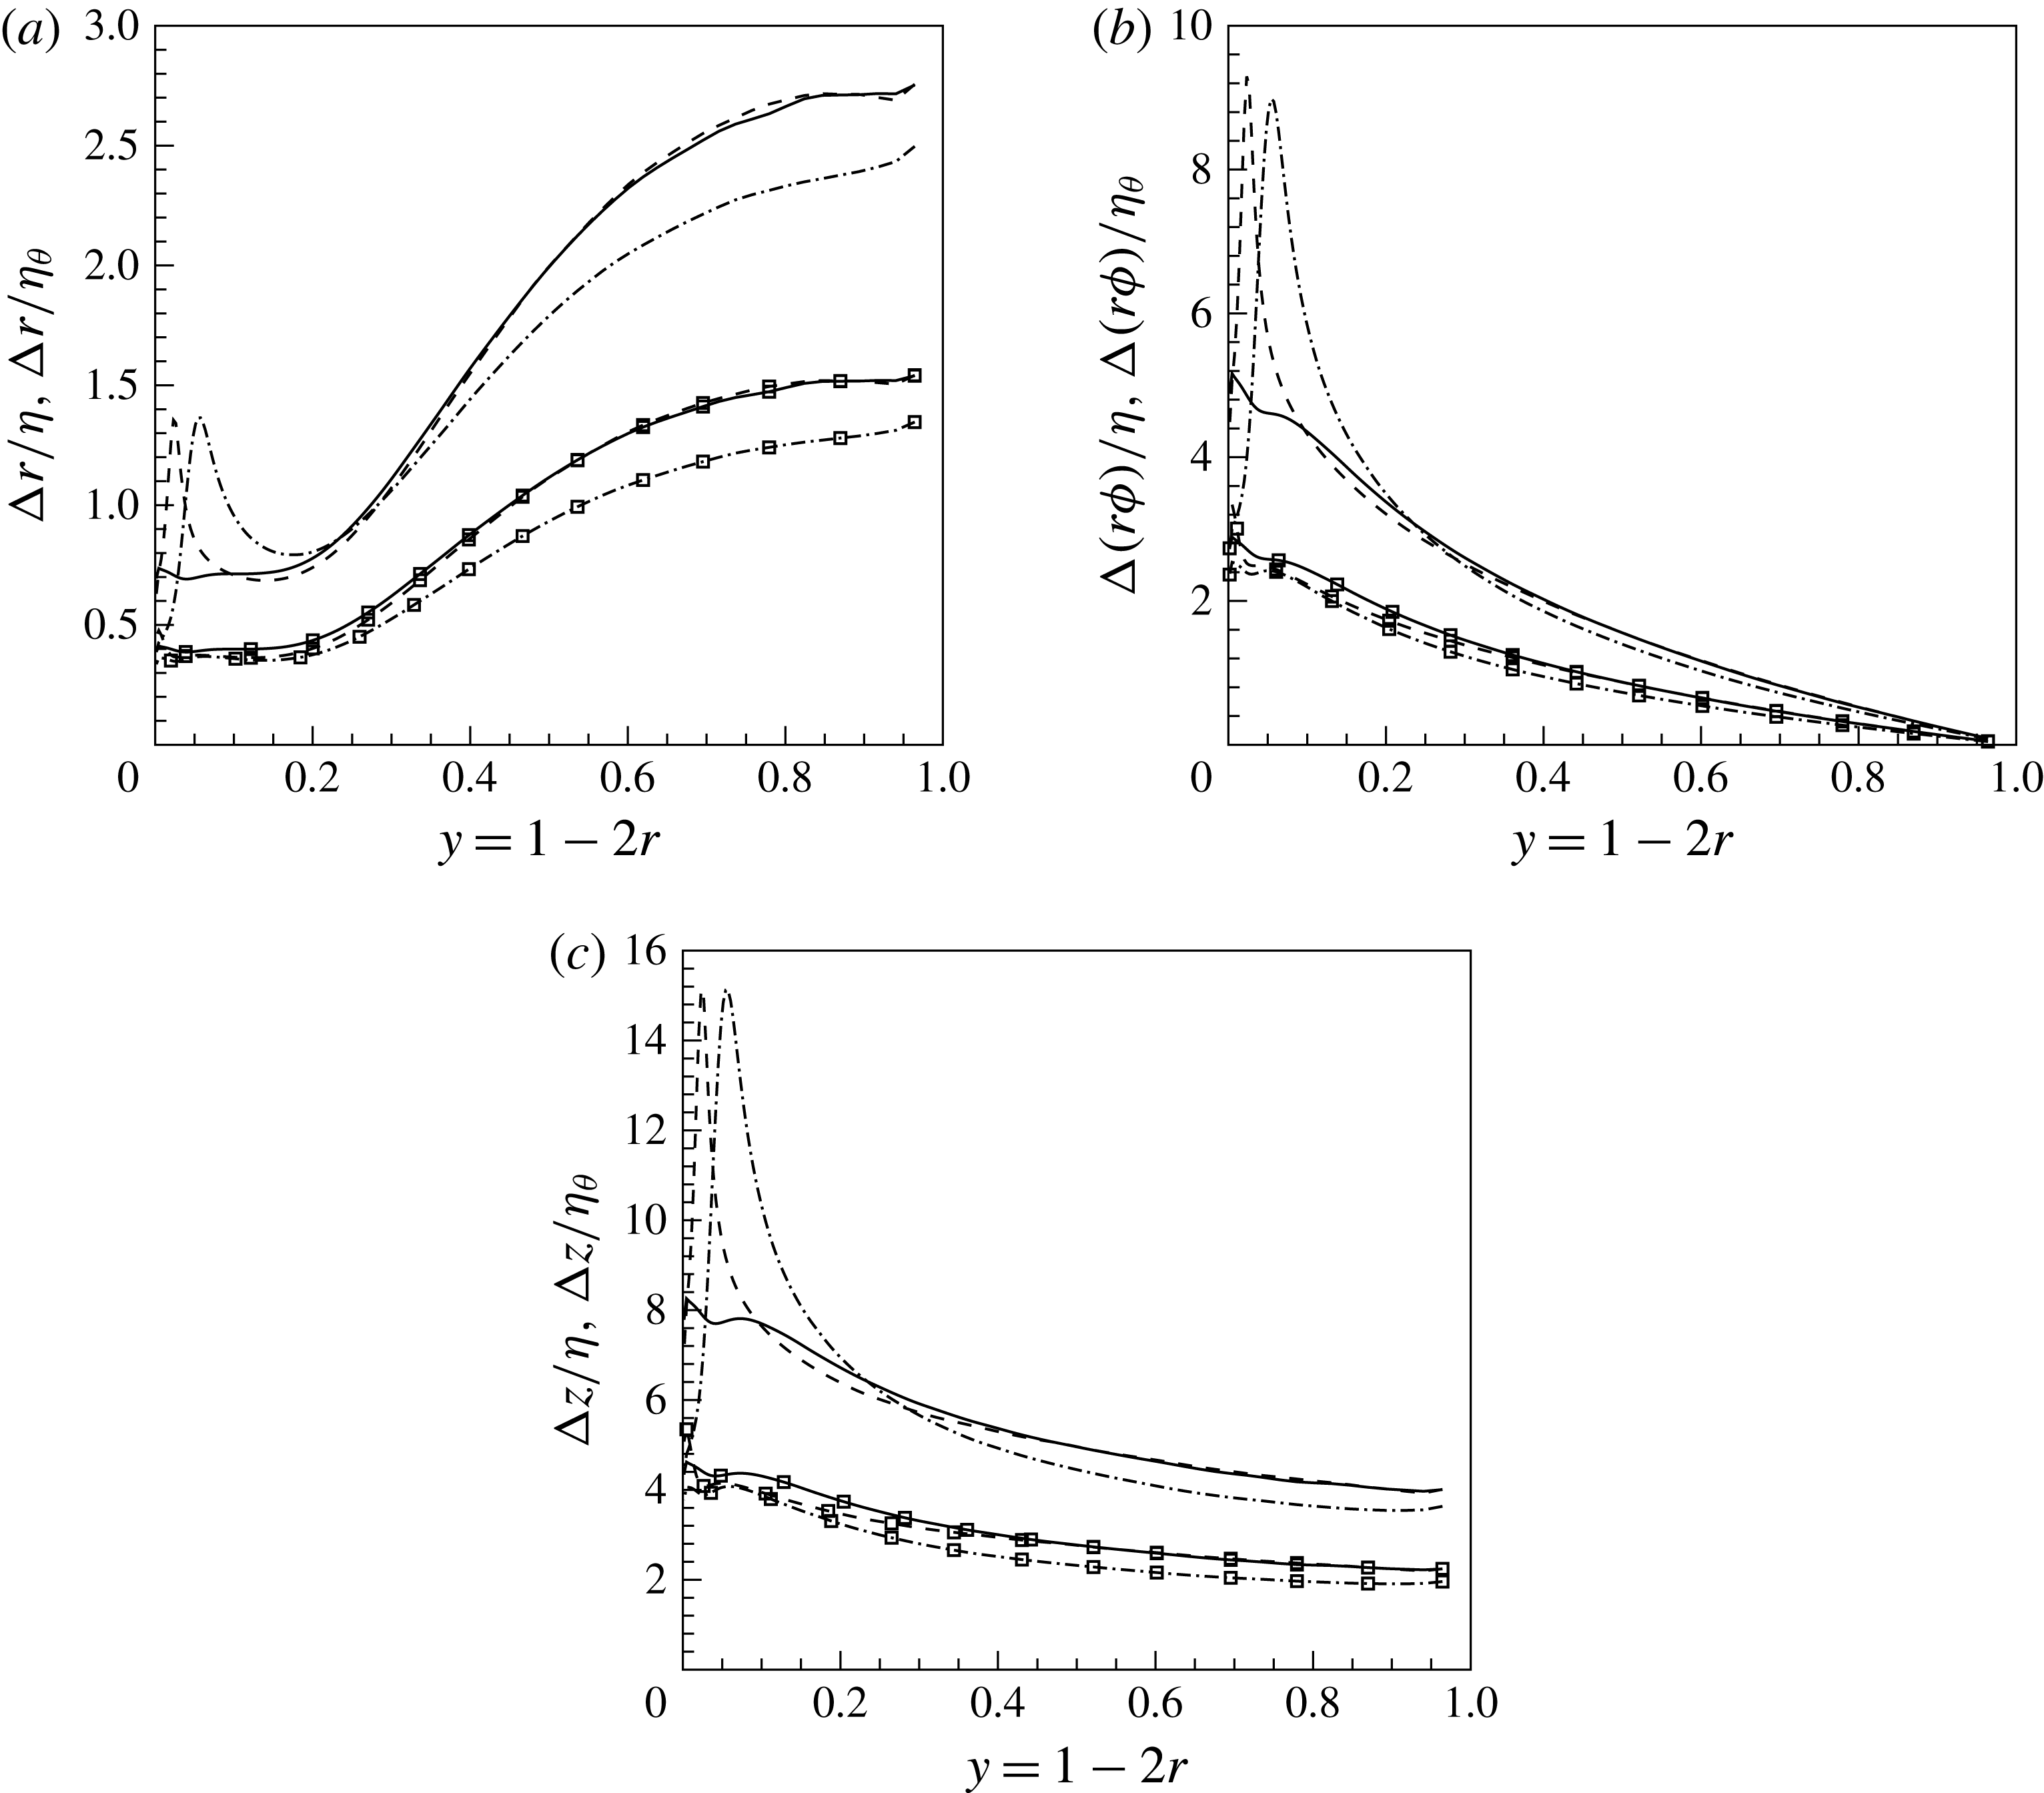
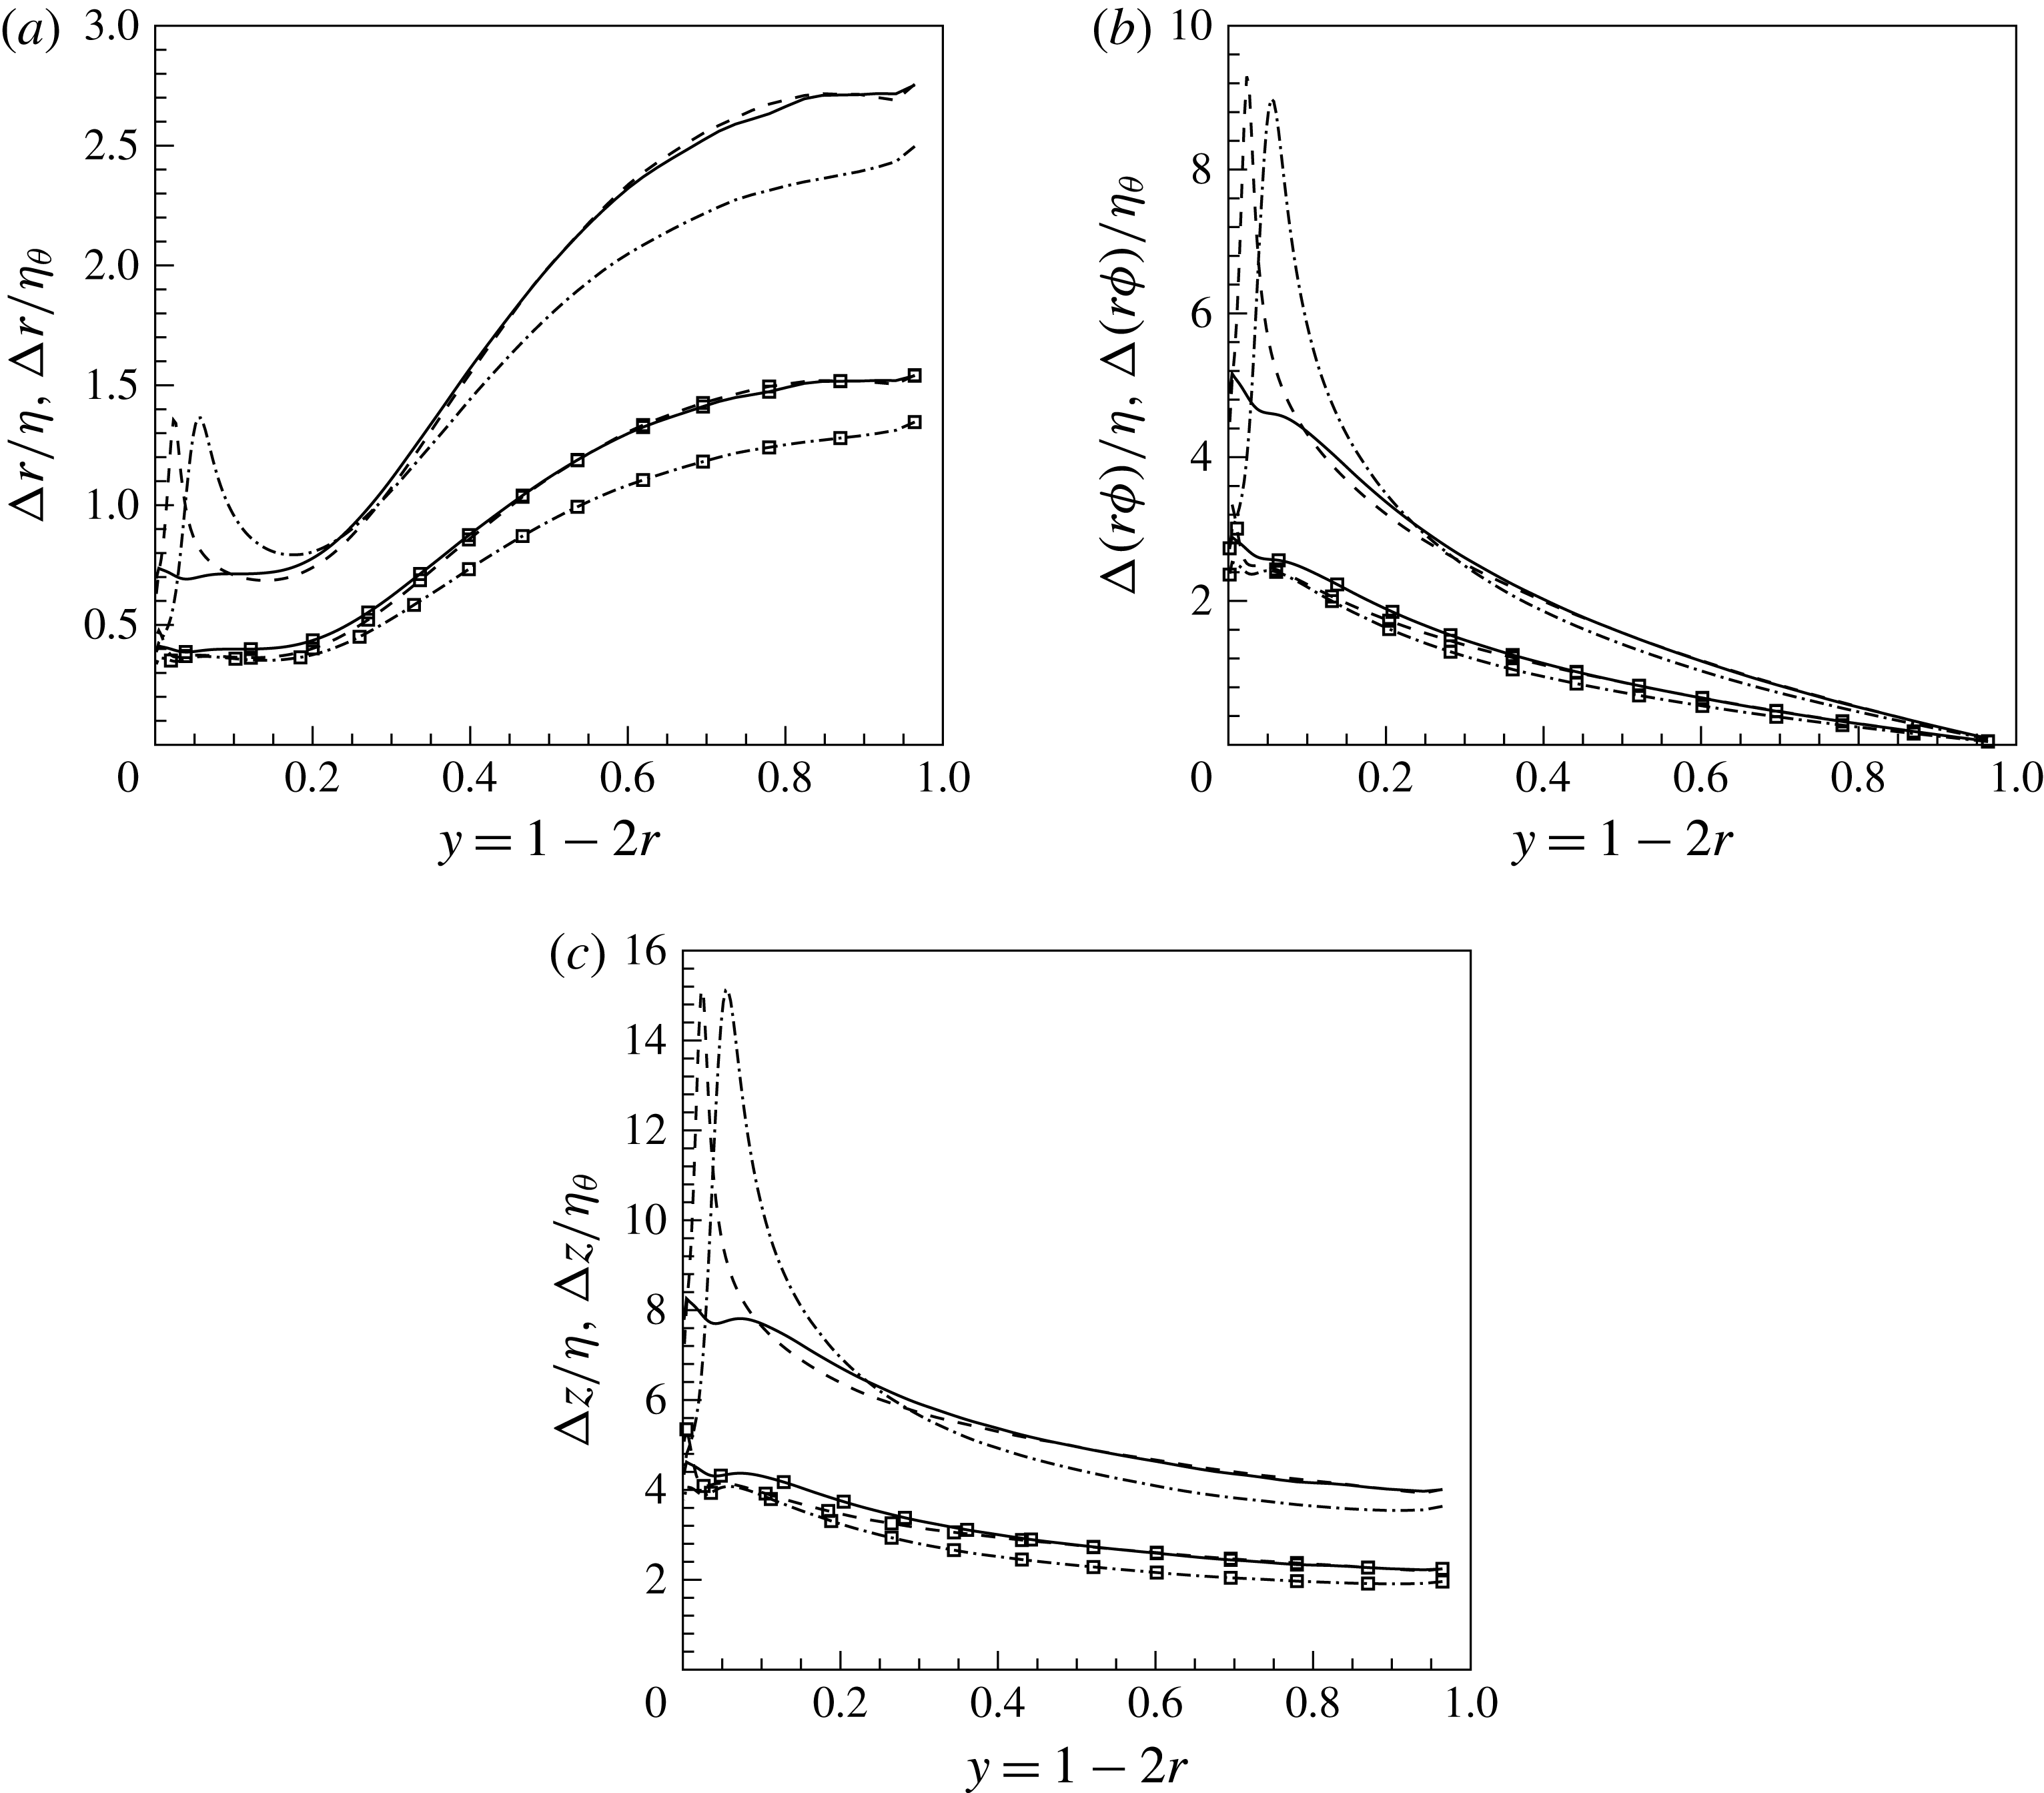
Figure 3. Spatial resolution normalized by Kolmogorov scale
![]() ${\it\eta}=(\overline{{\it\nu}}^{3}/{\it\epsilon})^{1/4}$
(lines with symbols) and thermal scales
${\it\eta}=(\overline{{\it\nu}}^{3}/{\it\epsilon})^{1/4}$
(lines with symbols) and thermal scales
![]() ${\it\eta}_{{\it\theta}}={\it\eta}/\sqrt{Pr}$
(lines) for
${\it\eta}_{{\it\theta}}={\it\eta}/\sqrt{Pr}$
(lines) for
![]() $\text{SC}_{K\rightarrow \infty }$
. (a) Radial, (b) circumferential and (c) streamwise resolution; (——)
$\text{SC}_{K\rightarrow \infty }$
. (a) Radial, (b) circumferential and (c) streamwise resolution; (——)
![]() $z=0$
(
$z=0$
(
![]() $\text{CP}_{K\rightarrow \infty }$
and
$\text{CP}_{K\rightarrow \infty }$
and
![]() $\text{CP}_{K\rightarrow 0}$
), (– – –)
$\text{CP}_{K\rightarrow 0}$
), (– – –)
![]() $z=5$
, (— ⋅ —)
$z=5$
, (— ⋅ —)
![]() $z=20$
.
$z=20$
.

Figure 4. Instantaneous enthalpy fluctuations
![]() $h^{\prime }$
in
$h^{\prime }$
in
![]() ${\it\phi}{-}z$
at
${\it\phi}{-}z$
at
![]() $y^{+}=2.5$
(based on inlet condition). (a)
$y^{+}=2.5$
(based on inlet condition). (a)
![]() $\text{SC}_{K\rightarrow \infty }$
and (b)
$\text{SC}_{K\rightarrow \infty }$
and (b)
![]() $\text{SC}_{K\rightarrow 0}$
.
$\text{SC}_{K\rightarrow 0}$
.
The mesh for the pipe for cases
![]() $\text{SC}_{K\rightarrow \infty }$
and
$\text{SC}_{K\rightarrow \infty }$
and
![]() $\text{SC}_{K\rightarrow 0}$
(see table 1) is
$\text{SC}_{K\rightarrow 0}$
(see table 1) is
![]() $126\times 288\times 1728$
in radial, circumferential and axial directions, respectively, and has a length of
$126\times 288\times 1728$
in radial, circumferential and axial directions, respectively, and has a length of
![]() $L^{\ast }=30D^{\ast }$
. For the constant property cases (
$L^{\ast }=30D^{\ast }$
. For the constant property cases (
![]() $\text{CP}_{K\rightarrow \infty }$
and
$\text{CP}_{K\rightarrow \infty }$
and
![]() $\text{CP}_{K\rightarrow 0}$
) a shorter pipe of
$\text{CP}_{K\rightarrow 0}$
) a shorter pipe of
![]() $L^{\ast }=20D^{\ast }$
and a mesh size of
$L^{\ast }=20D^{\ast }$
and a mesh size of
![]() $126\times 288\times 1152$
was selected. A uniform grid spacing is used in axial and circumferential directions, while the radial grid is non-uniform and finer close to the wall. The corresponding grid resolutions are
$126\times 288\times 1152$
was selected. A uniform grid spacing is used in axial and circumferential directions, while the radial grid is non-uniform and finer close to the wall. The corresponding grid resolutions are
![]() $0.55~(\text{wall})\leqslant {\rm\Delta}r^{+}\leqslant 4.31~(\text{centre})$
,
$0.55~(\text{wall})\leqslant {\rm\Delta}r^{+}\leqslant 4.31~(\text{centre})$
,
![]() $(D/2{\rm\Delta}{\it\phi})^{+}=3.93$
and
$(D/2{\rm\Delta}{\it\phi})^{+}=3.93$
and
![]() ${\rm\Delta}z^{+}=6.25$
in wall units based on the inlet. The thermal scales are expected to be smaller than the Kolmogorov length scale since the Prandtl number
${\rm\Delta}z^{+}=6.25$
in wall units based on the inlet. The thermal scales are expected to be smaller than the Kolmogorov length scale since the Prandtl number
![]() $Pr>1$
. The Prandtl number at the inlet is
$Pr>1$
. The Prandtl number at the inlet is
![]() $Pr_{0}=3.19$
, whereas very close to the wall it is approximately unity. In a thin region away from the wall, where the enthalpy corresponds to the pseudo-critical value, the Prandtl number exhibits a maximum value of 14. Therefore, the radial mesh distribution has been kept constant until
$Pr_{0}=3.19$
, whereas very close to the wall it is approximately unity. In a thin region away from the wall, where the enthalpy corresponds to the pseudo-critical value, the Prandtl number exhibits a maximum value of 14. Therefore, the radial mesh distribution has been kept constant until
![]() $y^{+}\leqslant 30$
where the flow, depending on streamwise location, crosses the pseudo-critical point. For most of the remaining flow
$y^{+}\leqslant 30$
where the flow, depending on streamwise location, crosses the pseudo-critical point. For most of the remaining flow
![]() $Pr\approx 4$
. Based on Tennekes & Lumley (Reference Tennekes and Lumley1972), the relation between the smallest velocity scales
$Pr\approx 4$
. Based on Tennekes & Lumley (Reference Tennekes and Lumley1972), the relation between the smallest velocity scales
![]() ${\it\eta}$
and the thermal structures
${\it\eta}$
and the thermal structures
![]() ${\it\eta}_{{\it\theta}}$
is given as
${\it\eta}_{{\it\theta}}$
is given as
![]() ${\it\eta}_{{\it\theta}}={\it\eta}/\sqrt{Pr}$
. Thus, the mesh resolution should be approximately twice – and at the location of the pseudo-critical temperature four times (see figure 1
c) – as fine as required to resolve the velocity field. The mesh resolution in terms of the Kolmogorov
${\it\eta}_{{\it\theta}}={\it\eta}/\sqrt{Pr}$
. Thus, the mesh resolution should be approximately twice – and at the location of the pseudo-critical temperature four times (see figure 1
c) – as fine as required to resolve the velocity field. The mesh resolution in terms of the Kolmogorov
![]() ${\it\eta}$
and thermal scales
${\it\eta}$
and thermal scales
![]() ${\it\eta}_{{\it\theta}}$
is shown in figure 3, where it can be seen that the Kolmogorov scales are well resolved in all directions (lines with symbols). The resolution for the thermal scales (lines) is
${\it\eta}_{{\it\theta}}$
is shown in figure 3, where it can be seen that the Kolmogorov scales are well resolved in all directions (lines with symbols). The resolution for the thermal scales (lines) is
![]() $0.5<{\rm\Delta}y/{\it\eta}_{{\it\theta}}<2.8$
in the wall-normal direction,
$0.5<{\rm\Delta}y/{\it\eta}_{{\it\theta}}<2.8$
in the wall-normal direction,
![]() $0.2<{\it\Delta}(r{\it\phi})/{\it\eta}_{{\it\theta}}<9$
in the circumferential direction and
$0.2<{\it\Delta}(r{\it\phi})/{\it\eta}_{{\it\theta}}<9$
in the circumferential direction and
![]() $4<{\rm\Delta}x/{\it\eta}_{{\it\theta}}<15$
in the streamwise direction. The local maxima of the lines correspond to the locations of the pseudo-critical point, where the spatial resolution indicates that the thermal scales are slightly under-resolved. However, a detailed grid independency study in our previous work (Nemati et al.
Reference Nemati, Patel, Boersma and Pecnik2015) showed that the first -and second-order statistics exhibited insignificant differences for a coarser mesh with half the number of grid points in the circumferential direction. A comparable mesh resolution has been used by Zonta, Marchioli & Soldati (Reference Zonta, Marchioli and Soldati2012) and Lee et al. (Reference Lee, Yoon Jung, Jin Sung and Zaki2013). For example, the mesh resolution used by Lee et al. (Reference Lee, Yoon Jung, Jin Sung and Zaki2013) is
$4<{\rm\Delta}x/{\it\eta}_{{\it\theta}}<15$
in the streamwise direction. The local maxima of the lines correspond to the locations of the pseudo-critical point, where the spatial resolution indicates that the thermal scales are slightly under-resolved. However, a detailed grid independency study in our previous work (Nemati et al.
Reference Nemati, Patel, Boersma and Pecnik2015) showed that the first -and second-order statistics exhibited insignificant differences for a coarser mesh with half the number of grid points in the circumferential direction. A comparable mesh resolution has been used by Zonta, Marchioli & Soldati (Reference Zonta, Marchioli and Soldati2012) and Lee et al. (Reference Lee, Yoon Jung, Jin Sung and Zaki2013). For example, the mesh resolution used by Lee et al. (Reference Lee, Yoon Jung, Jin Sung and Zaki2013) is
![]() $0.599<{\rm\Delta}y/{\it\eta}_{{\it\theta}}<2.99$
in wall-normal direction,
$0.599<{\rm\Delta}y/{\it\eta}_{{\it\theta}}<2.99$
in wall-normal direction,
![]() ${\rm\Delta}z/{\it\eta}_{{\it\theta}}=7.9$
in spanwise direction and
${\rm\Delta}z/{\it\eta}_{{\it\theta}}=7.9$
in spanwise direction and
![]() ${\rm\Delta}x/{\it\eta}_{{\it\theta}}=12.4$
in streamwise direction.
${\rm\Delta}x/{\it\eta}_{{\it\theta}}=12.4$
in streamwise direction.
The computer program is parallelized using the 2DECOMP&FFT library for two-dimensional pencil decomposition (Li & Laizet Reference Li and Laizet2010). The simulations are performed using 1152 processors on 48 bullx B720 nodes. The time step for both inflow generator and developing pipe simulations was set to
![]() ${\rm\Delta}t=2\times 10^{-5}$
and the corresponding maximum Courant number was 0.1. Statistics were sampled after 10 time units. The time averages were taken over 25 time units, which corresponds to 12 flow through times (
${\rm\Delta}t=2\times 10^{-5}$
and the corresponding maximum Courant number was 0.1. Statistics were sampled after 10 time units. The time averages were taken over 25 time units, which corresponds to 12 flow through times (
![]() $30D$
). The samples were taken every 500 time steps.
$30D$
). The samples were taken every 500 time steps.
5 Results and discussion
5.1 Instantaneous fields
The effects of the thermal wall boundary condition on turbulence can be visually highlighted by instantaneous enthalpy fluctuations in a plane parallel to the wall (
![]() ${\it\phi}{-}z$
), as depicted in figure 4. The plane is located at
${\it\phi}{-}z$
), as depicted in figure 4. The plane is located at
![]() $y^{+}=2.5$
(based on inlet conditions), which corresponds to a wall-normal position of
$y^{+}=2.5$
(based on inlet conditions), which corresponds to a wall-normal position of
![]() $y=1-2r=0.012$
. It should be noted that all simulations use an identical inflow velocity field and that the enthalpy fluctuations are plotted at the same time instant.
$y=1-2r=0.012$
. It should be noted that all simulations use an identical inflow velocity field and that the enthalpy fluctuations are plotted at the same time instant.
As seen in figure 4, turbulent structures are clearly observed in enthalpy fluctuations and differences between
![]() $\text{SC}_{K\rightarrow \infty }$
and
$\text{SC}_{K\rightarrow \infty }$
and
![]() $\text{SC}_{K\rightarrow 0}$
are visible. The regions of low and high enthalpy fluctuations are stronger for
$\text{SC}_{K\rightarrow 0}$
are visible. The regions of low and high enthalpy fluctuations are stronger for
![]() $\text{SC}_{K\rightarrow \infty }$
as compared to
$\text{SC}_{K\rightarrow \infty }$
as compared to
![]() $\text{SC}_{K\rightarrow 0}$
. Similar differences in near-wall scalar fluctuations for incompressible boundary layers were reported by Kong et al. (Reference Kong, Choi and Lee2000) and Li et al. (Reference Li, Schlatter, Brandt and Henningson2009). The plot also shows a decrease in streamwise coherency for
$\text{SC}_{K\rightarrow 0}$
. Similar differences in near-wall scalar fluctuations for incompressible boundary layers were reported by Kong et al. (Reference Kong, Choi and Lee2000) and Li et al. (Reference Li, Schlatter, Brandt and Henningson2009). The plot also shows a decrease in streamwise coherency for
![]() $\text{SC}_{K\rightarrow 0}$
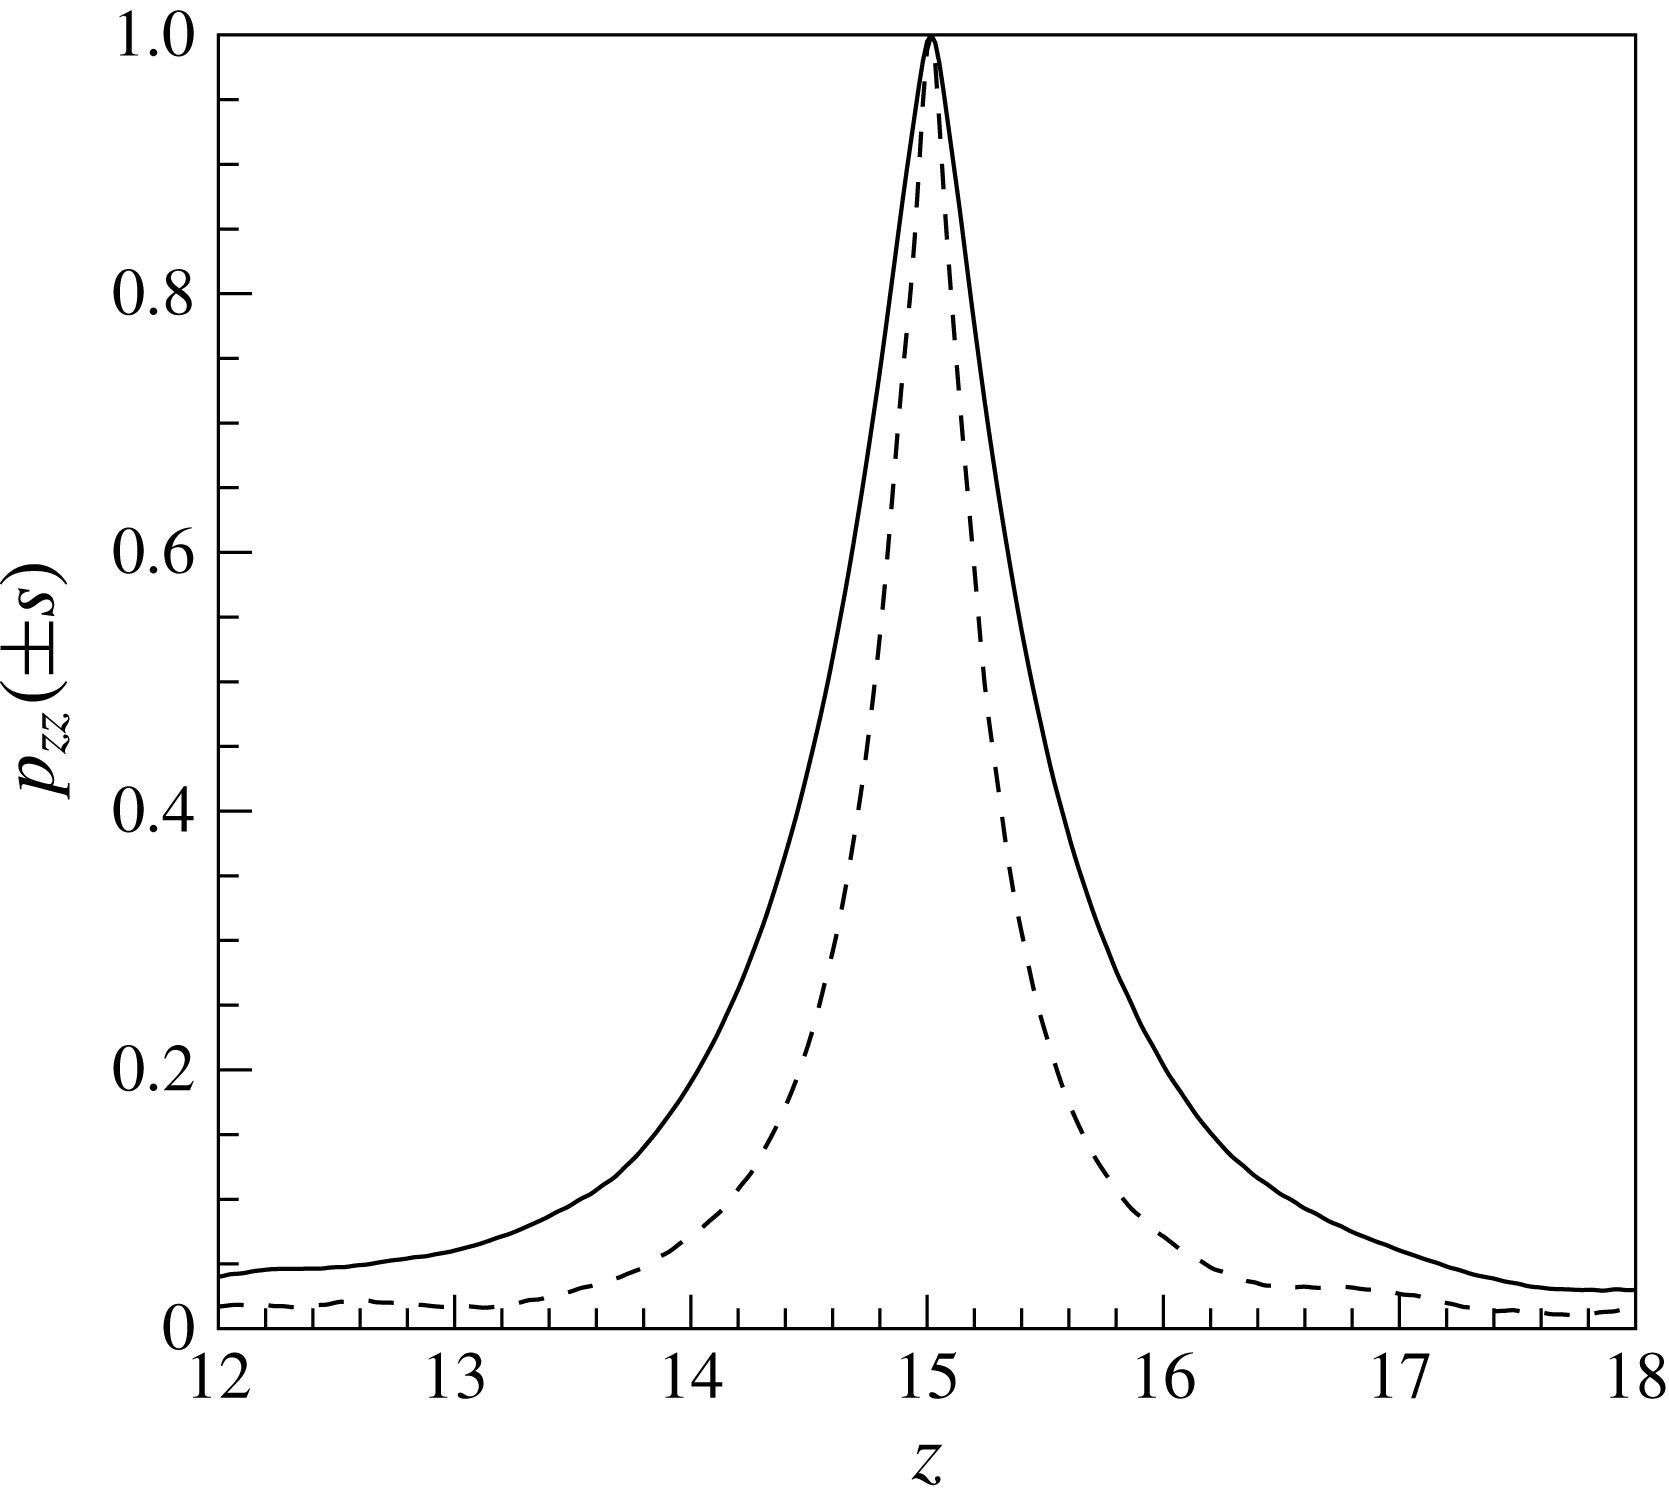
. In order to quantify the change in coherency, figure 5 shows the streamwise autocorrelation function, defined as
$\text{SC}_{K\rightarrow 0}$
. In order to quantify the change in coherency, figure 5 shows the streamwise autocorrelation function, defined as
at
![]() $y^{+}=2.5$
(based on inlet condition) for both
$y^{+}=2.5$
(based on inlet condition) for both
![]() $\text{SC}_{K\rightarrow \infty }$
and
$\text{SC}_{K\rightarrow \infty }$
and
![]() $\text{SC}_{K\rightarrow 0}$
cases. It can be seen that the autocorrelation function clearly indicates shorter structures for case
$\text{SC}_{K\rightarrow 0}$
cases. It can be seen that the autocorrelation function clearly indicates shorter structures for case
![]() $\text{SC}_{K\rightarrow 0}$
as compared to
$\text{SC}_{K\rightarrow 0}$
as compared to
![]() $\text{SC}_{K\rightarrow \infty }$
. Furthermore, small-scale structures (ripples) can be observed in figure 4, which emerge after approximately
$\text{SC}_{K\rightarrow \infty }$
. Furthermore, small-scale structures (ripples) can be observed in figure 4, which emerge after approximately
![]() $z>10$
at the shear layers between the streaks that separate hot and cold fluid regions (see also the supplementary movie available at http://dx.doi.org/10.1017/jfm.2016.411). The strong gradients of viscosity and density across the shear layer cause destabilising effects (Govindarajan & Sahu Reference Govindarajan and Sahu2014). Similar small-scale structures were also observed in Duan, Beekman & Martin (Reference Duan, Beekman and Martin2010) for the case with strong wall cooling.
$z>10$
at the shear layers between the streaks that separate hot and cold fluid regions (see also the supplementary movie available at http://dx.doi.org/10.1017/jfm.2016.411). The strong gradients of viscosity and density across the shear layer cause destabilising effects (Govindarajan & Sahu Reference Govindarajan and Sahu2014). Similar small-scale structures were also observed in Duan, Beekman & Martin (Reference Duan, Beekman and Martin2010) for the case with strong wall cooling.
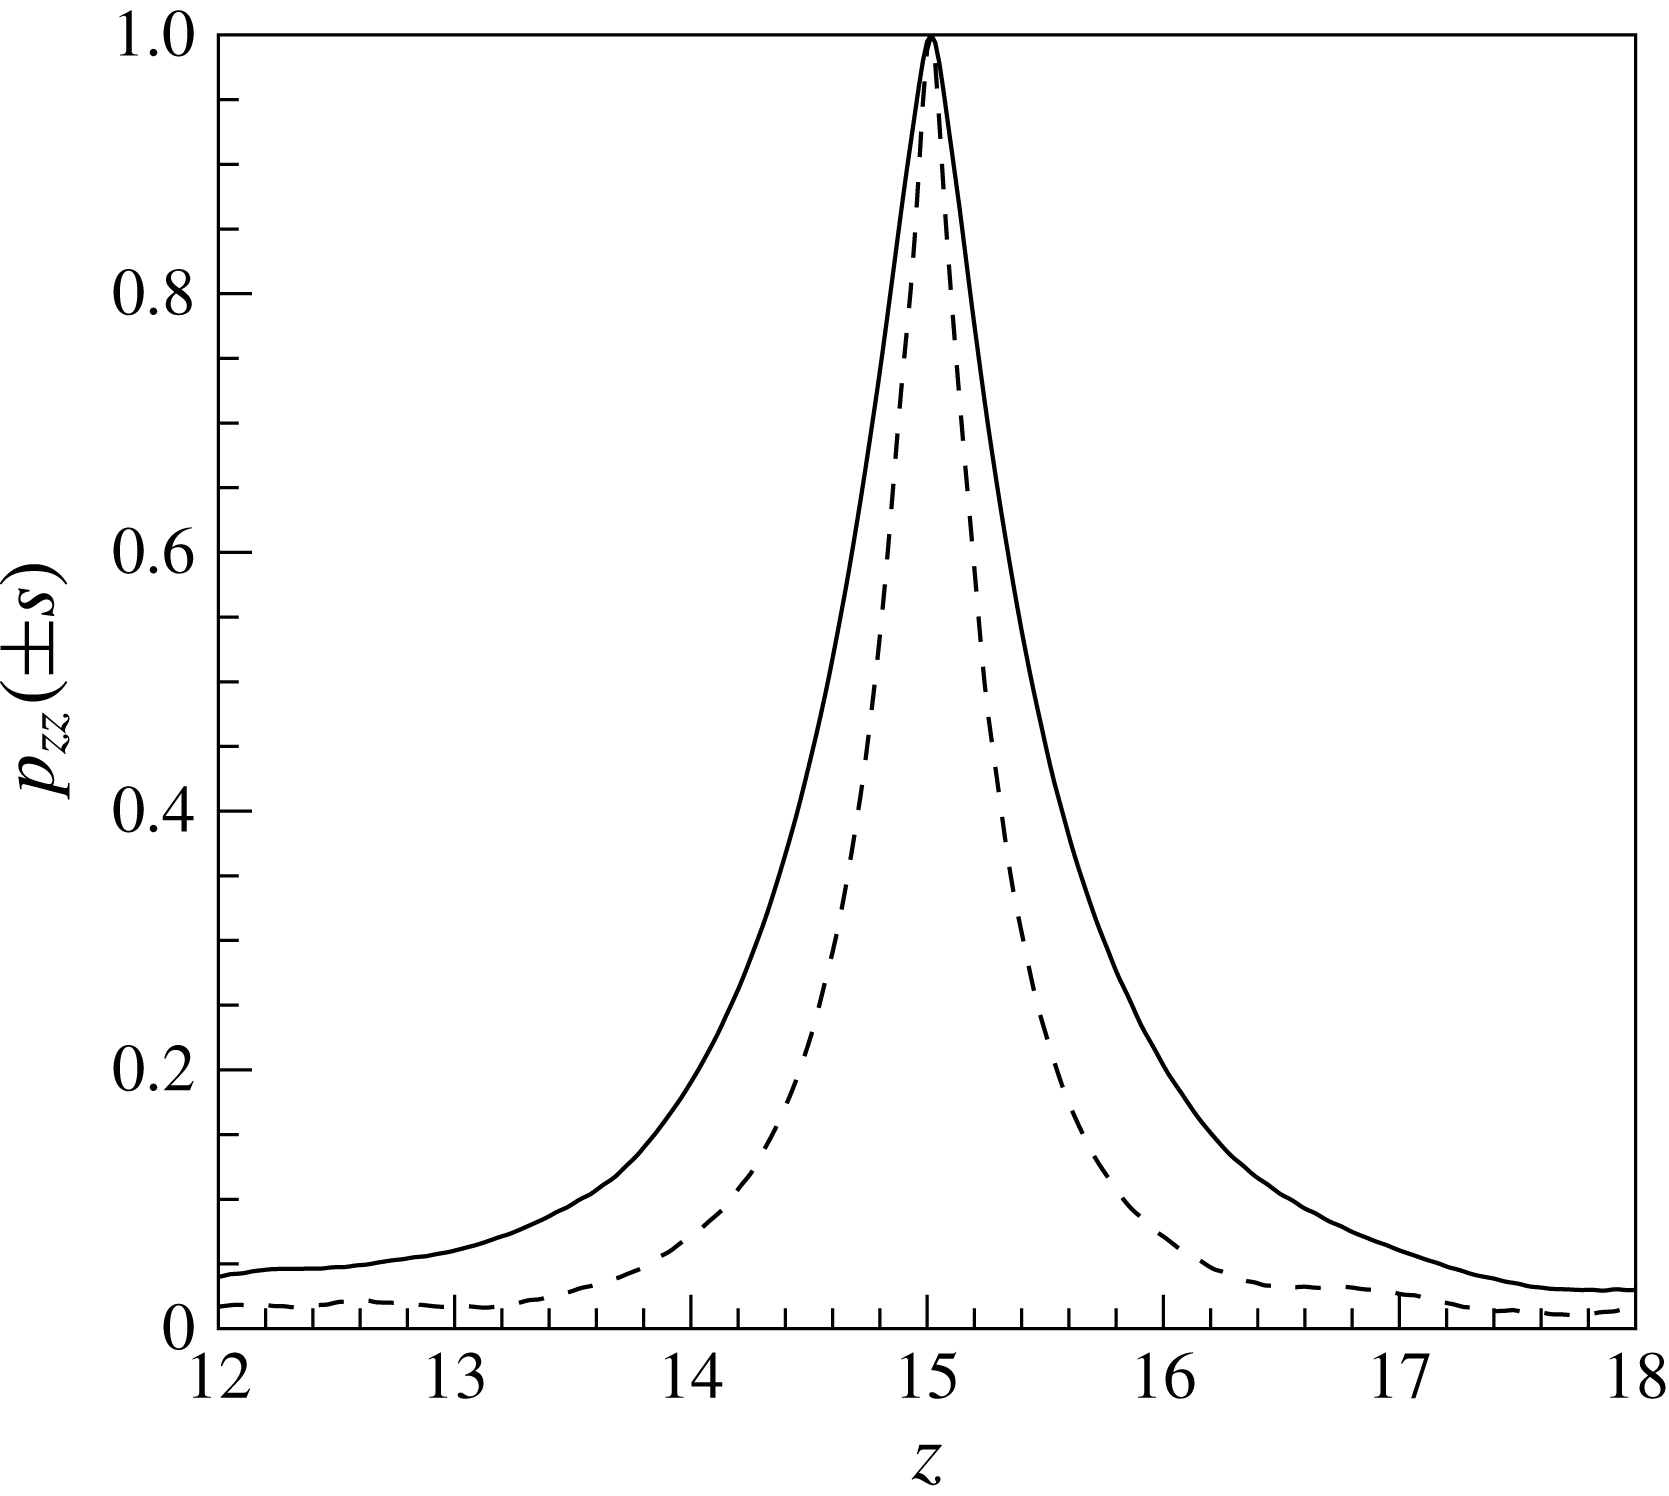
Figure 5. Two-point spatial correlation of enthalpy fluctuations
![]() $p_{zz}(\pm s)$
at
$p_{zz}(\pm s)$
at
![]() $y^{+}=2.5$
(based on inlet condition); (——)
$y^{+}=2.5$
(based on inlet condition); (——)
![]() $\text{SC}_{K\rightarrow \infty }$
and (– – –)
$\text{SC}_{K\rightarrow \infty }$
and (– – –)
![]() $\text{SC}_{K\rightarrow 0}$
.
$\text{SC}_{K\rightarrow 0}$
.
5.2 Mean flow and turbulence statistics
The mean quantities are obtained by taking a statistical average over time and the homogeneous circumferential direction using Reynolds and Favre averaging. Velocity components
![]() $u_{i}$
and enthalpy
$u_{i}$
and enthalpy
![]() $h$
are Favre averaged, whereas stress tensors
$h$
are Favre averaged, whereas stress tensors
![]() ${\it\tau}_{ij}$
, pressure
${\it\tau}_{ij}$
, pressure
![]() $p$
, heat flux
$p$
, heat flux
![]() $q_{i}$
and thermophysical properties are Reynolds averaged. Reynolds averaging decomposes any generic variable
$q_{i}$
and thermophysical properties are Reynolds averaged. Reynolds averaging decomposes any generic variable
![]() ${\it\chi}$
into its mean
${\it\chi}$
into its mean
![]() $\overline{{\it\chi}}$
and its fluctuating
$\overline{{\it\chi}}$
and its fluctuating
![]() ${\it\chi}^{\prime }$
part, as
${\it\chi}^{\prime }$
part, as
![]() ${\it\chi}=\overline{{\it\chi}}+{\it\chi}^{\prime }$
, with
${\it\chi}=\overline{{\it\chi}}+{\it\chi}^{\prime }$
, with
![]() $\overline{{\it\chi}^{\prime }}=0$
. For Favre averaging the generic variable is decomposed into a mean
$\overline{{\it\chi}^{\prime }}=0$
. For Favre averaging the generic variable is decomposed into a mean
![]() $\widetilde{{\it\chi}}$
and a fluctuating part
$\widetilde{{\it\chi}}$
and a fluctuating part
![]() ${\it\chi}^{\prime \prime }$
using a density weighted average defied as
${\it\chi}^{\prime \prime }$
using a density weighted average defied as
![]() $\widetilde{{\it\chi}}=\overline{{\it\rho}{\it\chi}}/\overline{{\it\rho}}$
, where
$\widetilde{{\it\chi}}=\overline{{\it\rho}{\it\chi}}/\overline{{\it\rho}}$
, where
![]() $\overline{{\it\rho}{\it\chi}^{\prime \prime }}=0$
.
$\overline{{\it\rho}{\it\chi}^{\prime \prime }}=0$
.
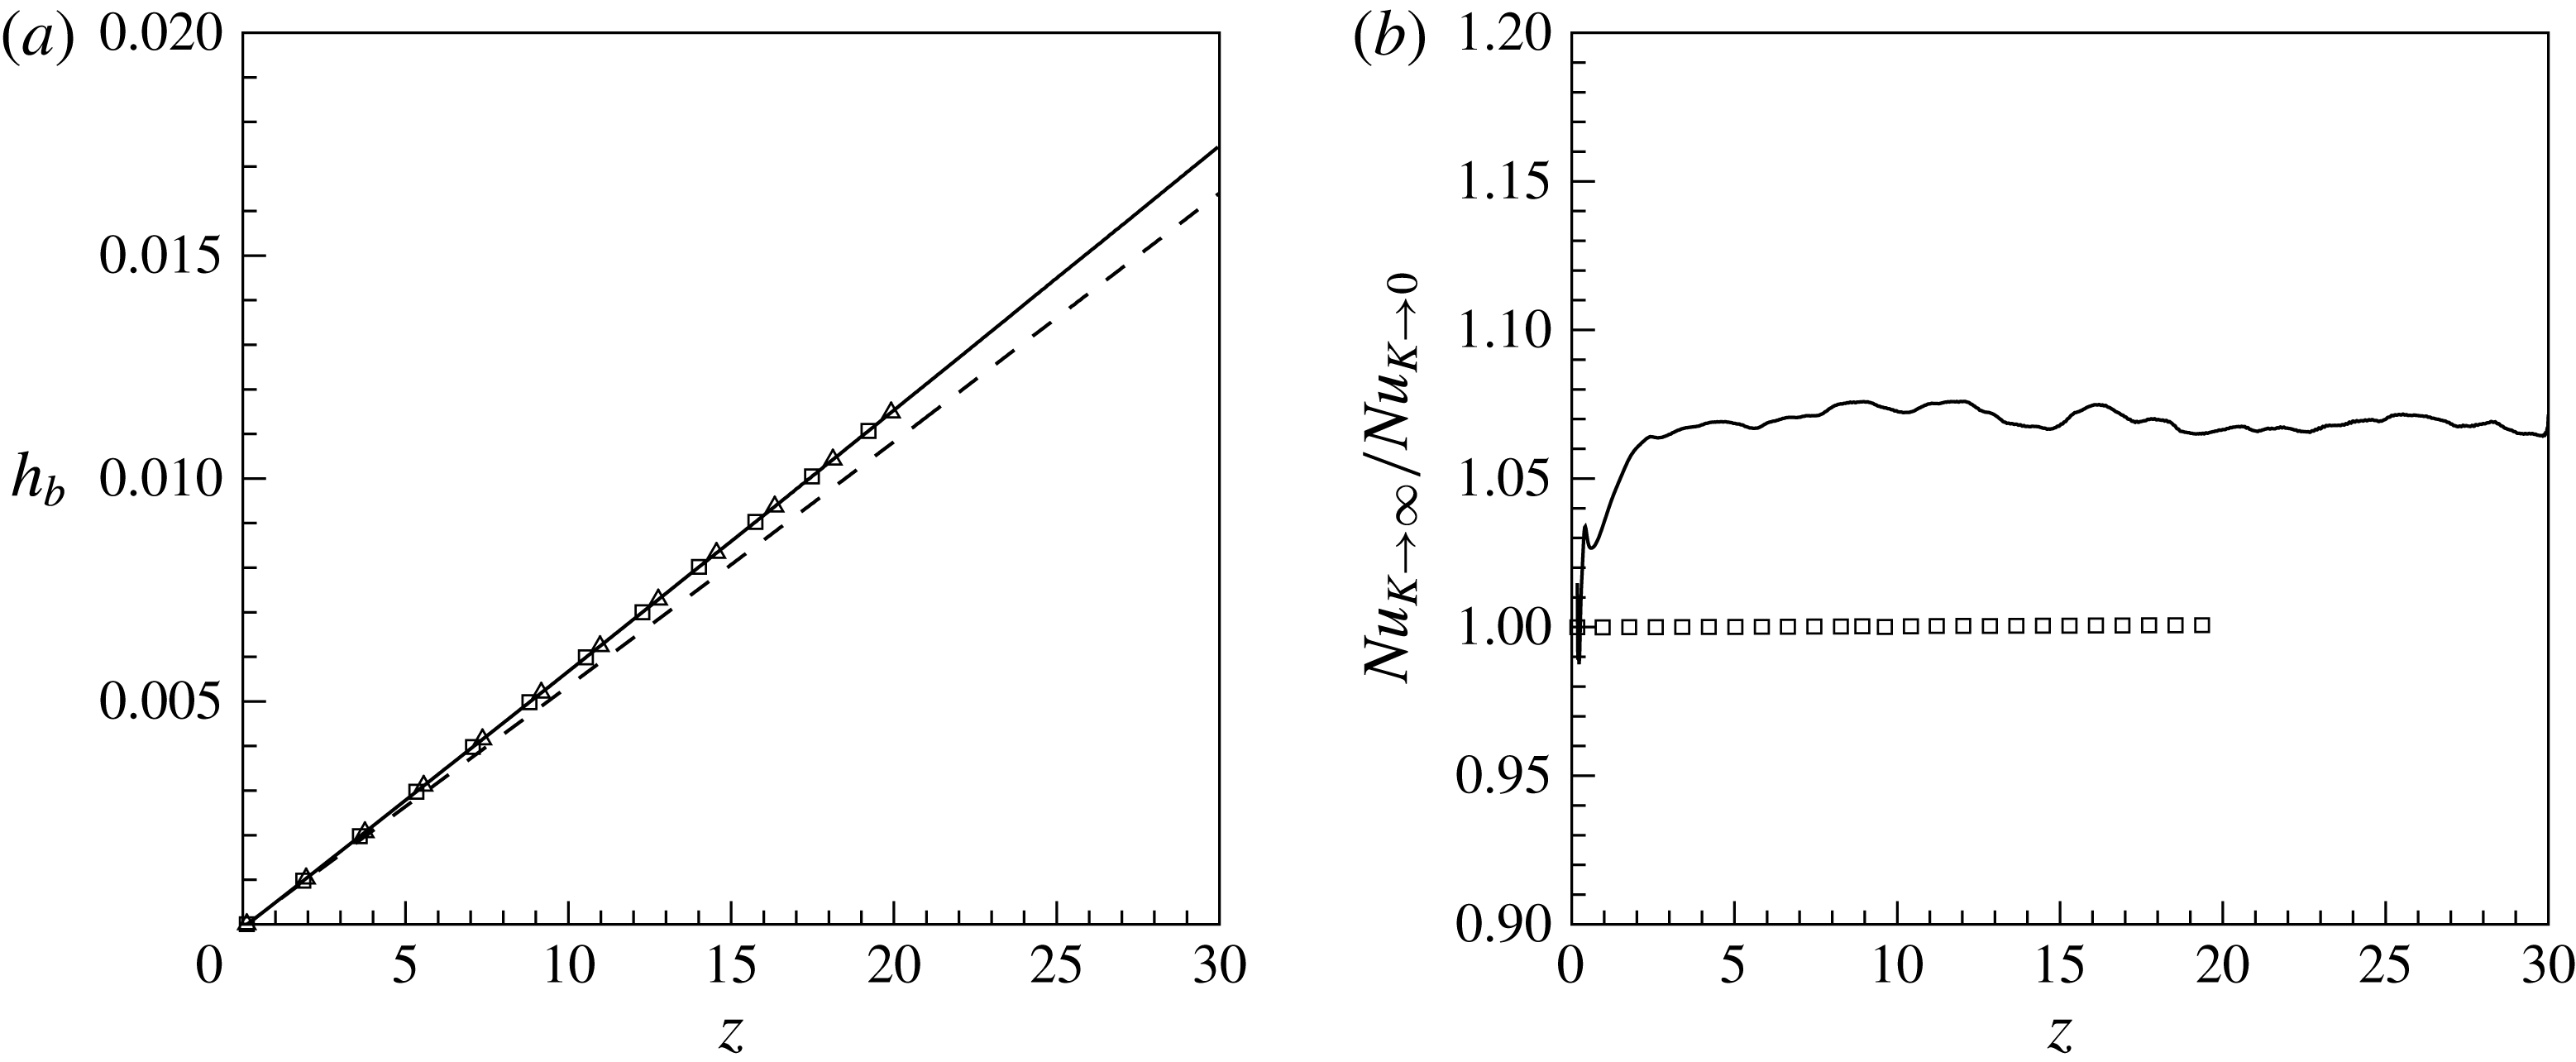
Figure 6(a) shows the distribution of bulk enthalpy in the streamwise direction for all four cases. Based on the overall energy conservation, it follows that for cases with constant wall heat flux (cases
![]() $\text{SC}_{K\rightarrow \infty }$
and
$\text{SC}_{K\rightarrow \infty }$
and
![]() $\text{CP}_{K\rightarrow \infty }$
) the distribution of the bulk enthalpy increases linearly as a function of
$\text{CP}_{K\rightarrow \infty }$
) the distribution of the bulk enthalpy increases linearly as a function of
![]() $z$
, namely
$z$
, namely
![]() $h_{b}=4Qz/(Re_{b0}Pr_{0})$
. The bulk enthalpy is defined as
$h_{b}=4Qz/(Re_{b0}Pr_{0})$
. The bulk enthalpy is defined as
![]() $h_{b}=\int _{0}^{R}\overline{{\it\rho}u_{z}h}r\,\text{d}r/\int _{0}^{R}\overline{{\it\rho}u_{z}}r\,\text{d}r$
. As can be seen, the symbols for the constant property cases
$h_{b}=\int _{0}^{R}\overline{{\it\rho}u_{z}h}r\,\text{d}r/\int _{0}^{R}\overline{{\it\rho}u_{z}}r\,\text{d}r$
. As can be seen, the symbols for the constant property cases
![]() $\text{CP}_{K\rightarrow \infty }$
and
$\text{CP}_{K\rightarrow \infty }$
and
![]() $\text{CP}_{K\rightarrow 0}$
overlap, which highlights that the boundary condition has no influence on the global energy balance. This result agrees well with the observation from previous studies (Kays & Crawford Reference Kays and Crawford1993; Li et al.
Reference Li, Schlatter, Brandt and Henningson2009) and also confirms the consistency of applying the thermal boundary conditions, as described in § 3. For the two supercritical fluid cases, however, the bulk enthalpy distributions are affected by the thermal boundary conditions. In figure 6(a) it can be seen that less energy is transferred to the fluid if the enthalpy at the wall is non-fluctuating (
$\text{CP}_{K\rightarrow 0}$
overlap, which highlights that the boundary condition has no influence on the global energy balance. This result agrees well with the observation from previous studies (Kays & Crawford Reference Kays and Crawford1993; Li et al.
Reference Li, Schlatter, Brandt and Henningson2009) and also confirms the consistency of applying the thermal boundary conditions, as described in § 3. For the two supercritical fluid cases, however, the bulk enthalpy distributions are affected by the thermal boundary conditions. In figure 6(a) it can be seen that less energy is transferred to the fluid if the enthalpy at the wall is non-fluctuating (
![]() $\text{SC}_{K\rightarrow 0}$
), and in figure 6(b) the Nusselt number ratio (
$\text{SC}_{K\rightarrow 0}$
), and in figure 6(b) the Nusselt number ratio (
![]() $Nu_{K\rightarrow \infty }/Nu_{K\rightarrow 0}$
) shows that
$Nu_{K\rightarrow \infty }/Nu_{K\rightarrow 0}$
) shows that
![]() $Nu_{K\rightarrow \infty }$
is approximately 7 % higher for the case with the fluctuating wall enthalpy boundary condition. The Nusselt number is defined as
$Nu_{K\rightarrow \infty }$
is approximately 7 % higher for the case with the fluctuating wall enthalpy boundary condition. The Nusselt number is defined as
 $$\begin{eqnarray}Nu=\frac{\left.\overline{{\it\alpha}\displaystyle \frac{\partial h}{\partial r}}\right|_{w}D}{{\it\alpha}_{b}(\overline{h}_{w}-h_{b})}.\end{eqnarray}$$
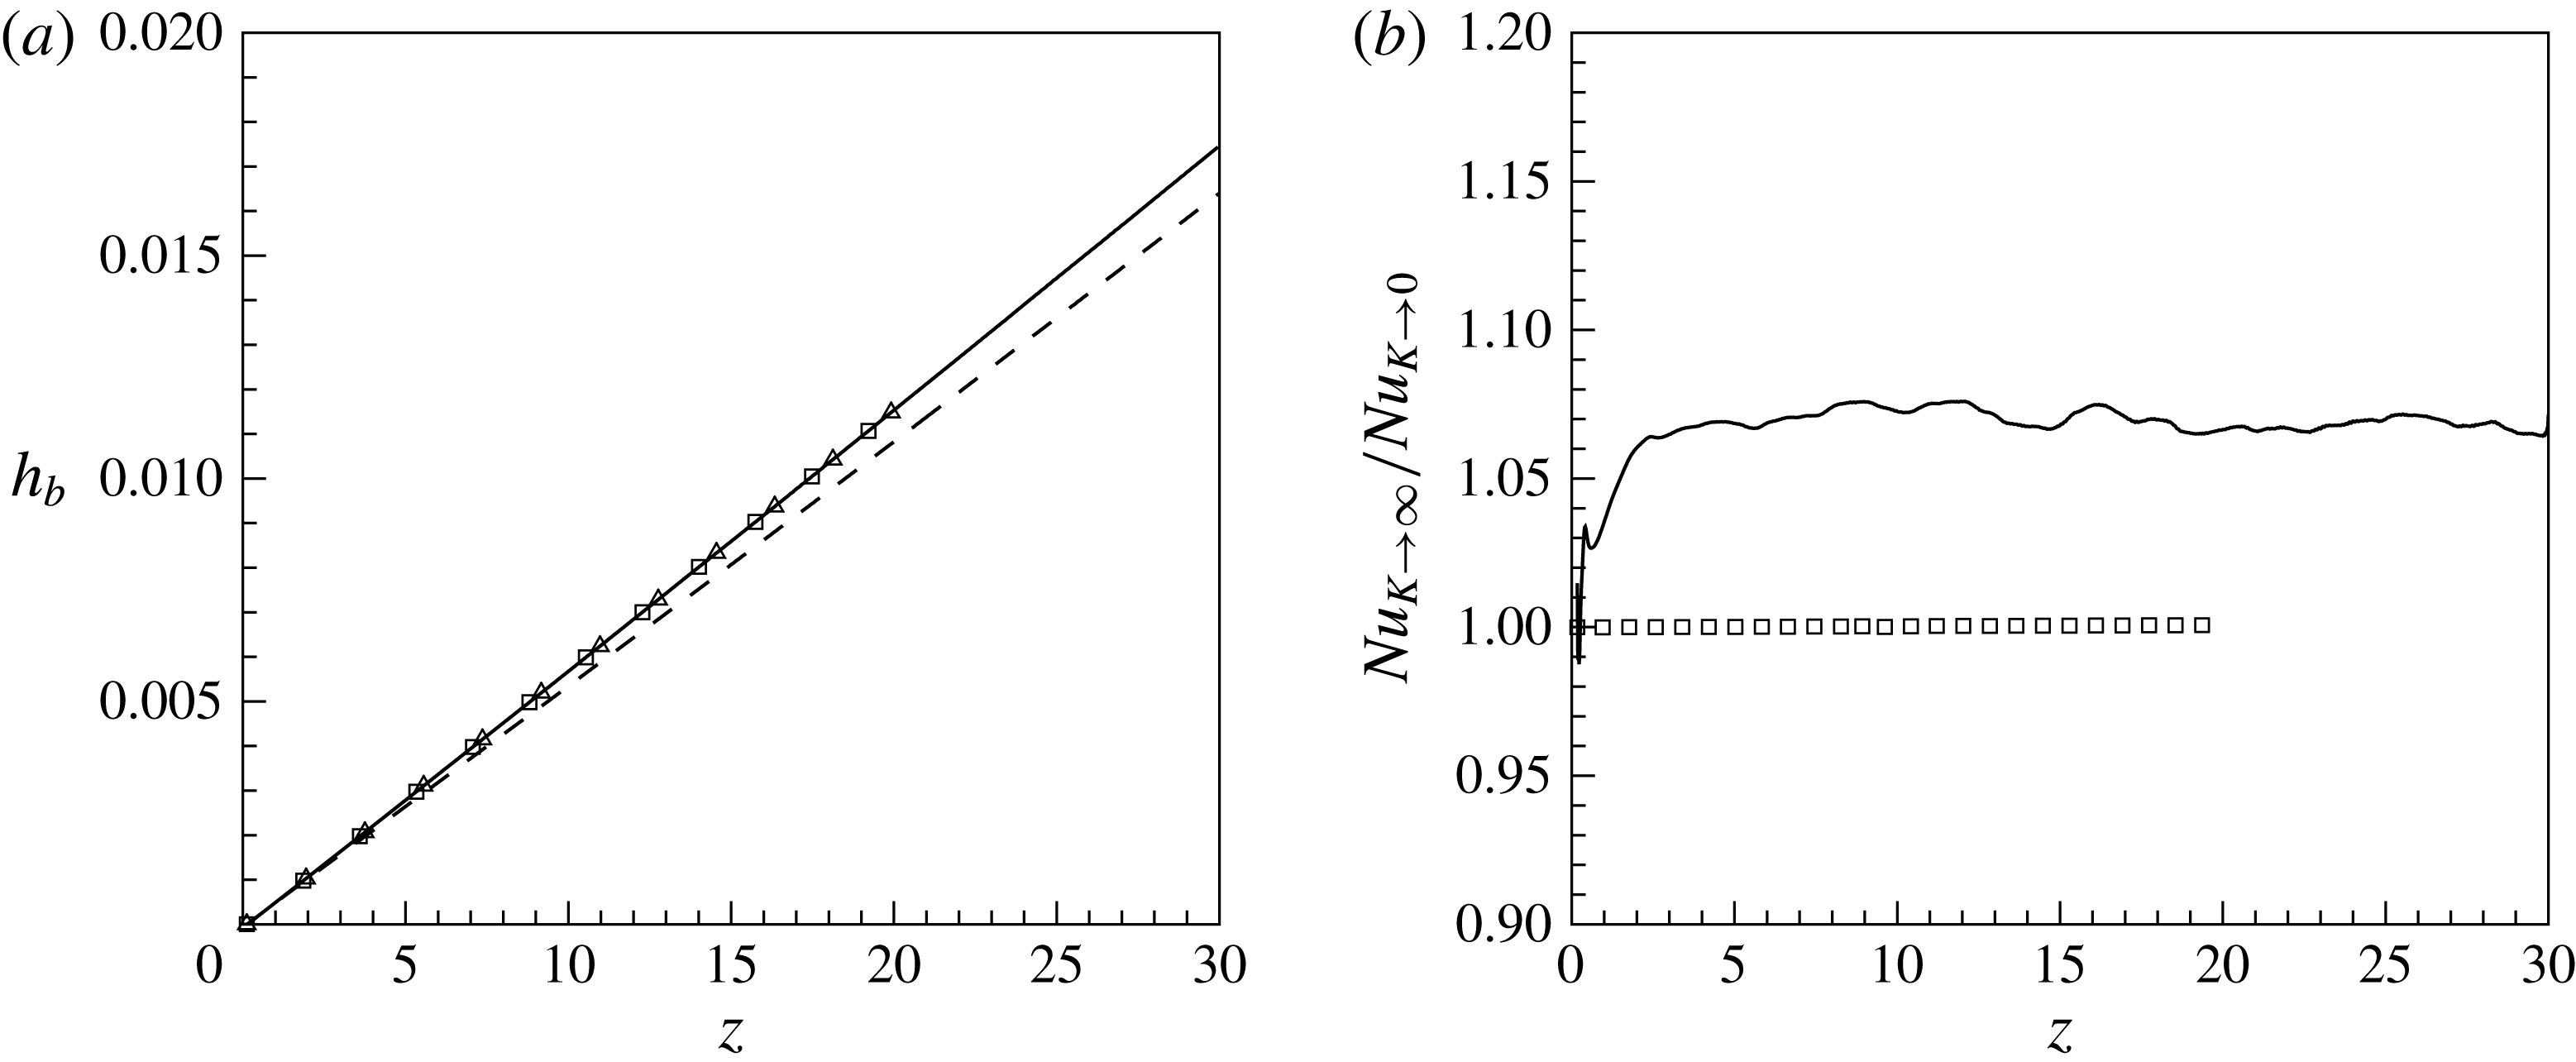
Figure 6. (a) Comparison of streamwise distributions of the bulk enthalpy
![]() $h_{b}$
, (——)
$h_{b}$
, (——)
![]() $\text{SC}_{K\rightarrow \infty }$
, (– – –)
$\text{SC}_{K\rightarrow \infty }$
, (– – –)
![]() $\text{SC}_{K\rightarrow 0}$
, (▫)
$\text{SC}_{K\rightarrow 0}$
, (▫)
![]() $\text{CP}_{K\rightarrow \infty }$
and (▵)
$\text{CP}_{K\rightarrow \infty }$
and (▵)
![]() $\text{CP}_{K\rightarrow 0}$
; and (b) Nusselt number ratio along the pipe, (——) supercritical fluid, (▫) constant property fluid.
$\text{CP}_{K\rightarrow 0}$
; and (b) Nusselt number ratio along the pipe, (——) supercritical fluid, (▫) constant property fluid.

Figure 7. (a) Mean enthalpy
![]() $\tilde{h}/\tilde{h}_{w}$
and (b) streamwise velocity
$\tilde{h}/\tilde{h}_{w}$
and (b) streamwise velocity
![]() $\tilde{u} _{z}$
at
$\tilde{u} _{z}$
at
![]() $z=15$
; (——)
$z=15$
; (——)
![]() $\text{SC}_{K\rightarrow \infty }$
, (– – –)
$\text{SC}_{K\rightarrow \infty }$
, (– – –)
![]() $\text{SC}_{K\rightarrow 0}$
, (▫)
$\text{SC}_{K\rightarrow 0}$
, (▫)
![]() $\text{CP}_{K\rightarrow \infty }$
and (▵)
$\text{CP}_{K\rightarrow \infty }$
and (▵)
![]() $\text{CP}_{K\rightarrow 0}$
.
$\text{CP}_{K\rightarrow 0}$
.
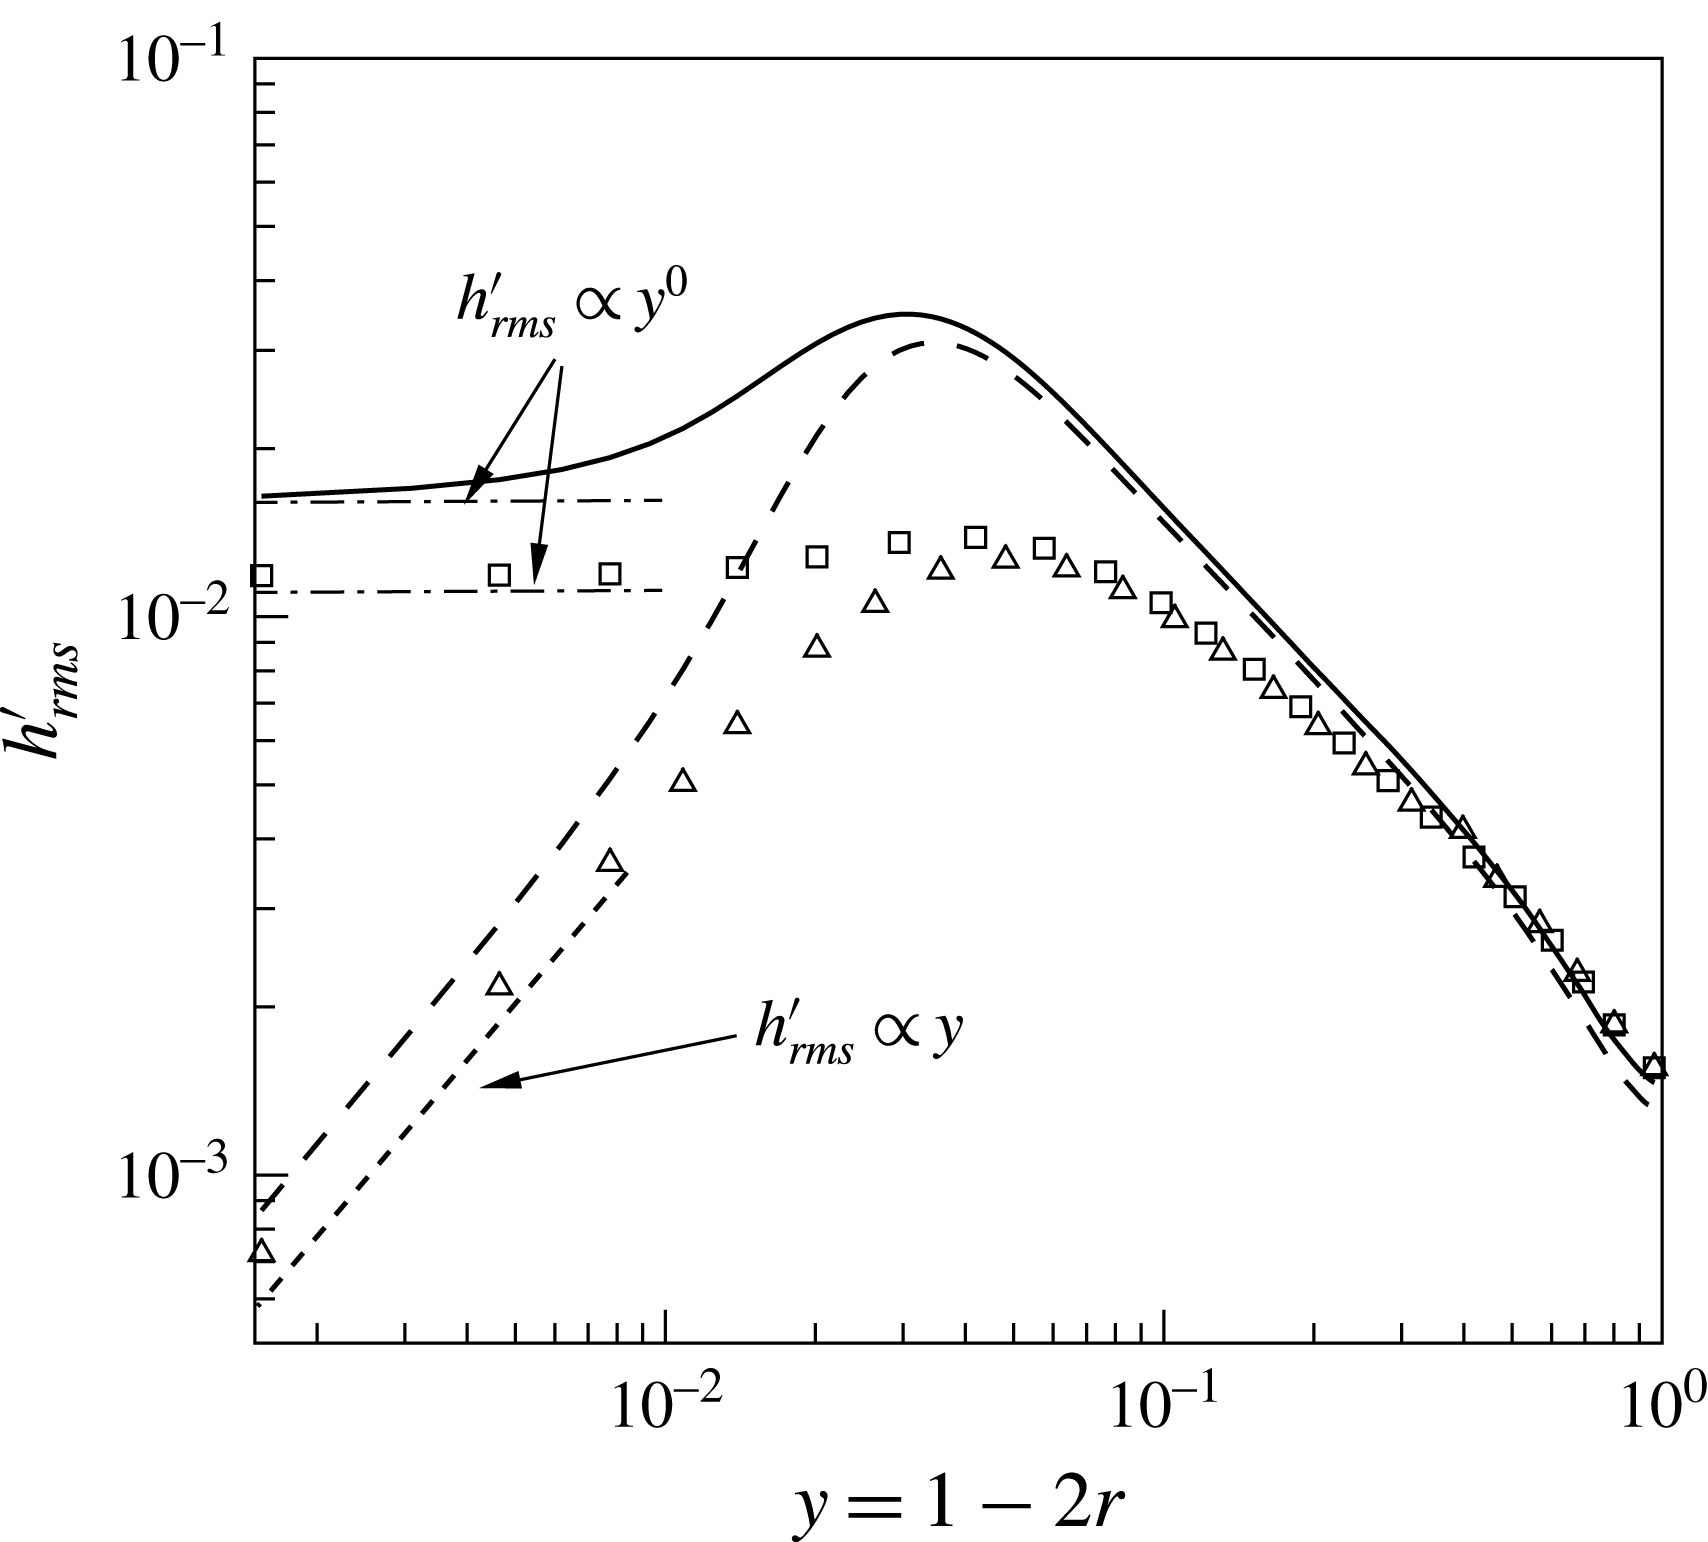
Figure 8. Enthalpy fluctuations
![]() $h_{rms}^{\prime }$
at
$h_{rms}^{\prime }$
at
![]() $z=15$
; (——)
$z=15$
; (——)
![]() $\text{SC}_{K\rightarrow \infty }$
, (– – –)
$\text{SC}_{K\rightarrow \infty }$
, (– – –)
![]() $\text{SC}_{K\rightarrow 0}$
, (▫)
$\text{SC}_{K\rightarrow 0}$
, (▫)
![]() $\text{CP}_{K\rightarrow \infty }$
and (▵)
$\text{CP}_{K\rightarrow \infty }$
and (▵)
![]() $\text{CP}_{K\rightarrow 0}$
.
$\text{CP}_{K\rightarrow 0}$
.
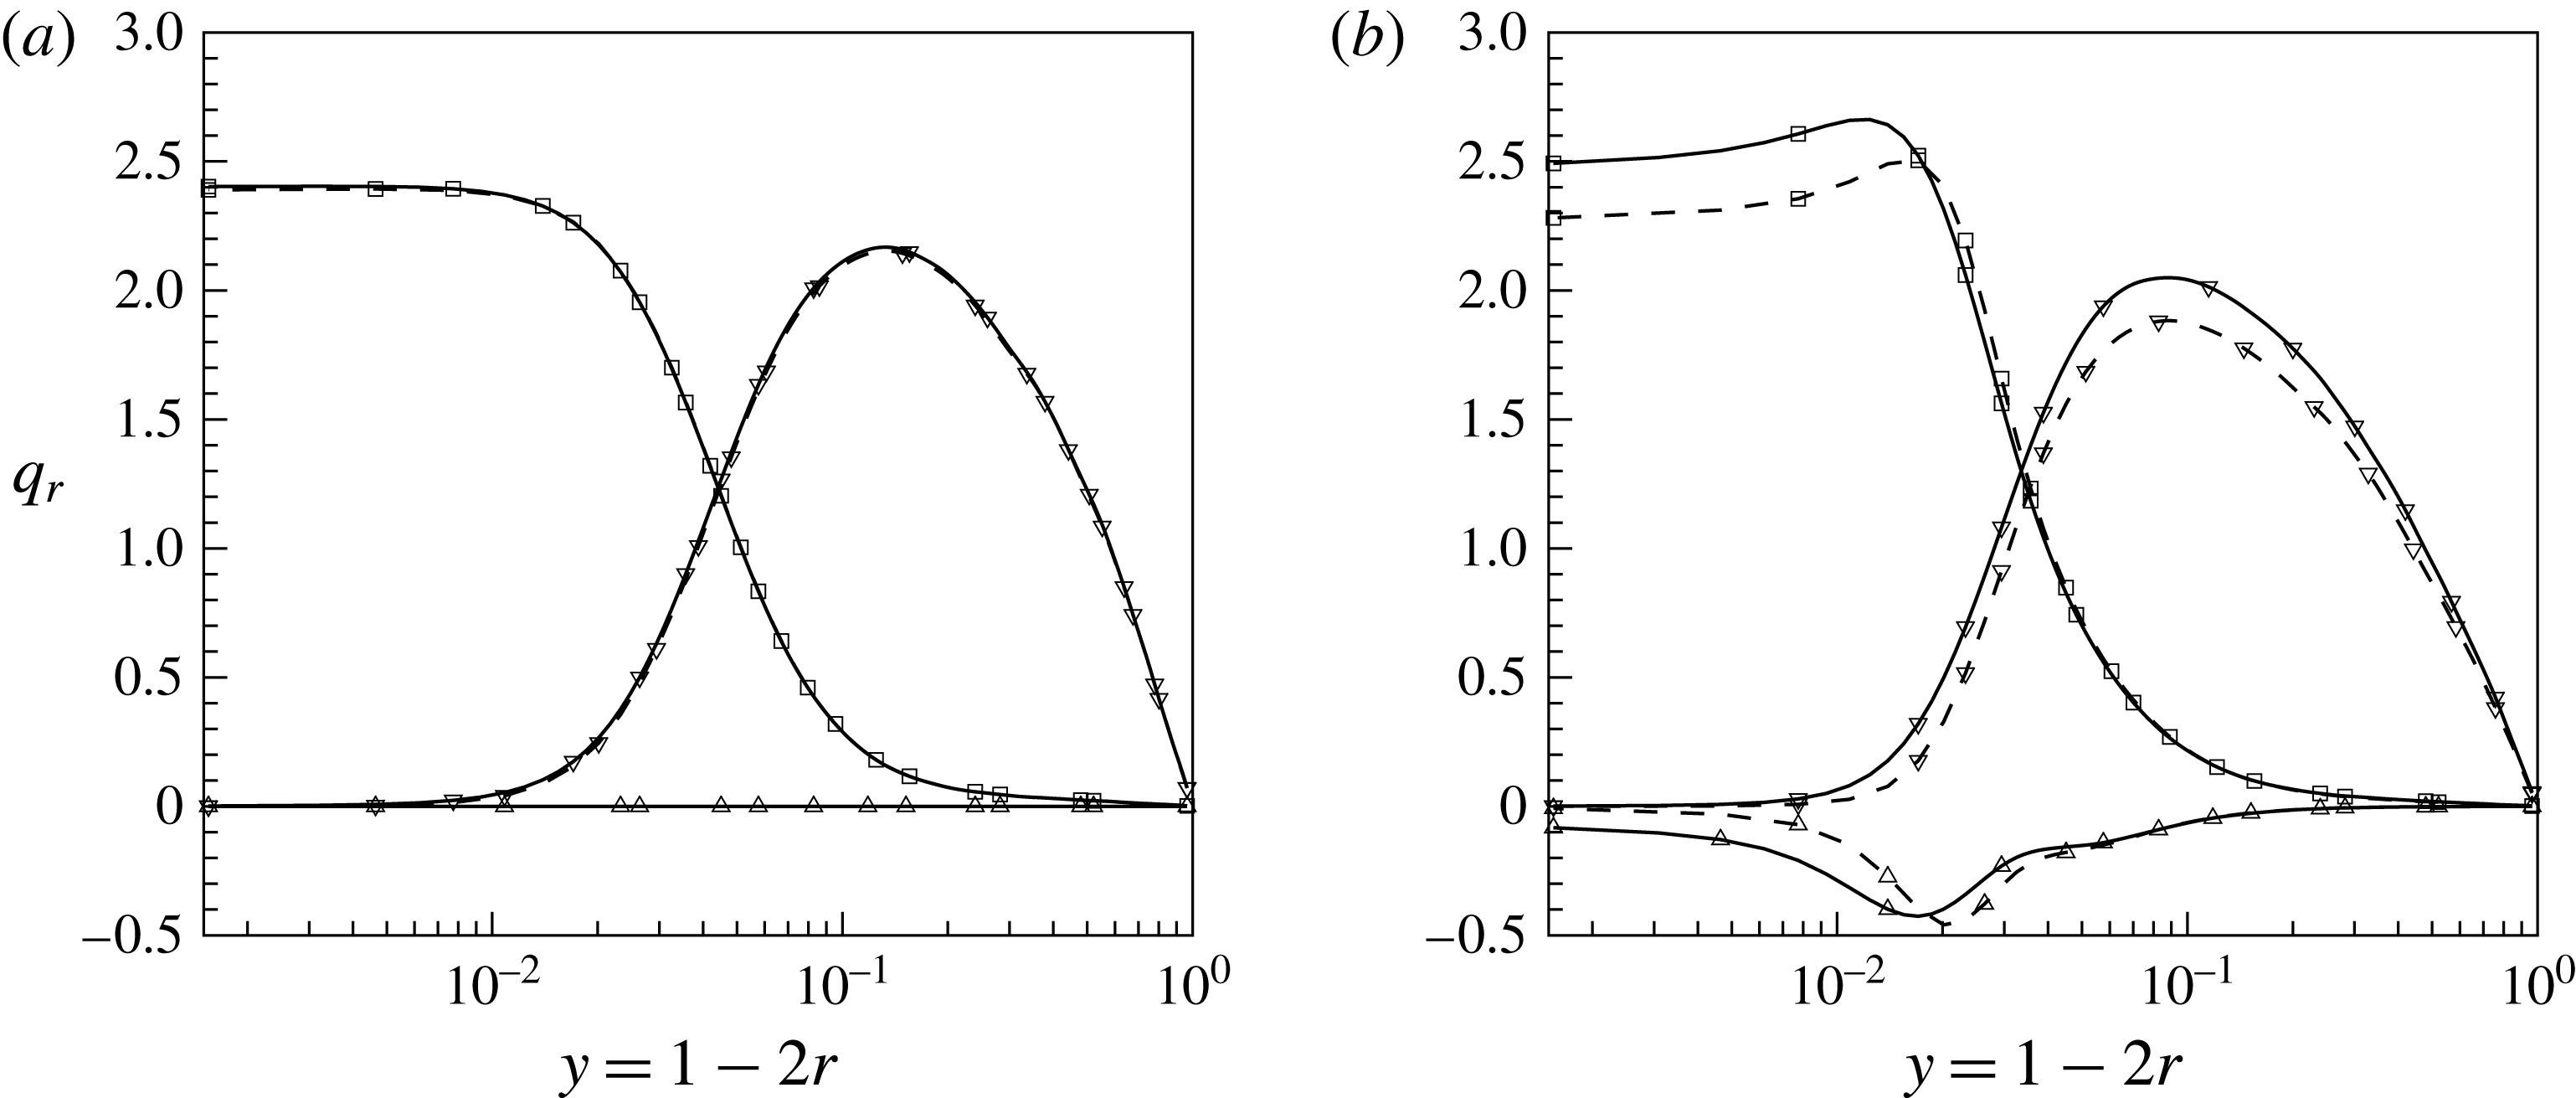
Figure 9. Wall-normal heat flux
![]() $q_{r}$
at
$q_{r}$
at
![]() $z=15$
(a)
$z=15$
(a)
![]() $\text{CP}_{K\rightarrow \infty }$
and
$\text{CP}_{K\rightarrow \infty }$
and
![]() $\text{CP}_{K\rightarrow 0}$
and (b)
$\text{CP}_{K\rightarrow 0}$
and (b)
![]() $\text{SC}_{K\rightarrow \infty }$
and
$\text{SC}_{K\rightarrow \infty }$
and
![]() $\text{SC}_{K\rightarrow 0}$
; (——)
$\text{SC}_{K\rightarrow 0}$
; (——)
![]() $\text{SC}_{K\rightarrow \infty }$
and
$\text{SC}_{K\rightarrow \infty }$
and
![]() $\text{CP}_{K\rightarrow \infty }$
, (– – –)
$\text{CP}_{K\rightarrow \infty }$
, (– – –)
![]() $\text{SC}_{K\rightarrow 0}$
and
$\text{SC}_{K\rightarrow 0}$
and
![]() $\text{CP}_{K\rightarrow 0}$
, (▫)
$\text{CP}_{K\rightarrow 0}$
, (▫)
![]() $\overline{{\it\alpha}}\partial \overline{h}/\partial r$
, (▵)
$\overline{{\it\alpha}}\partial \overline{h}/\partial r$
, (▵)
![]() $\overline{{\it\alpha}^{\prime }\partial h^{\prime }/\partial r}$
, (▿)
$\overline{{\it\alpha}^{\prime }\partial h^{\prime }/\partial r}$
, (▿)
![]() $-\overline{{\it\rho}u_{r}^{\prime \prime }h^{\prime \prime }}Re_{{\it\tau}0}Pr_{0}$
.
$-\overline{{\it\rho}u_{r}^{\prime \prime }h^{\prime \prime }}Re_{{\it\tau}0}Pr_{0}$
.
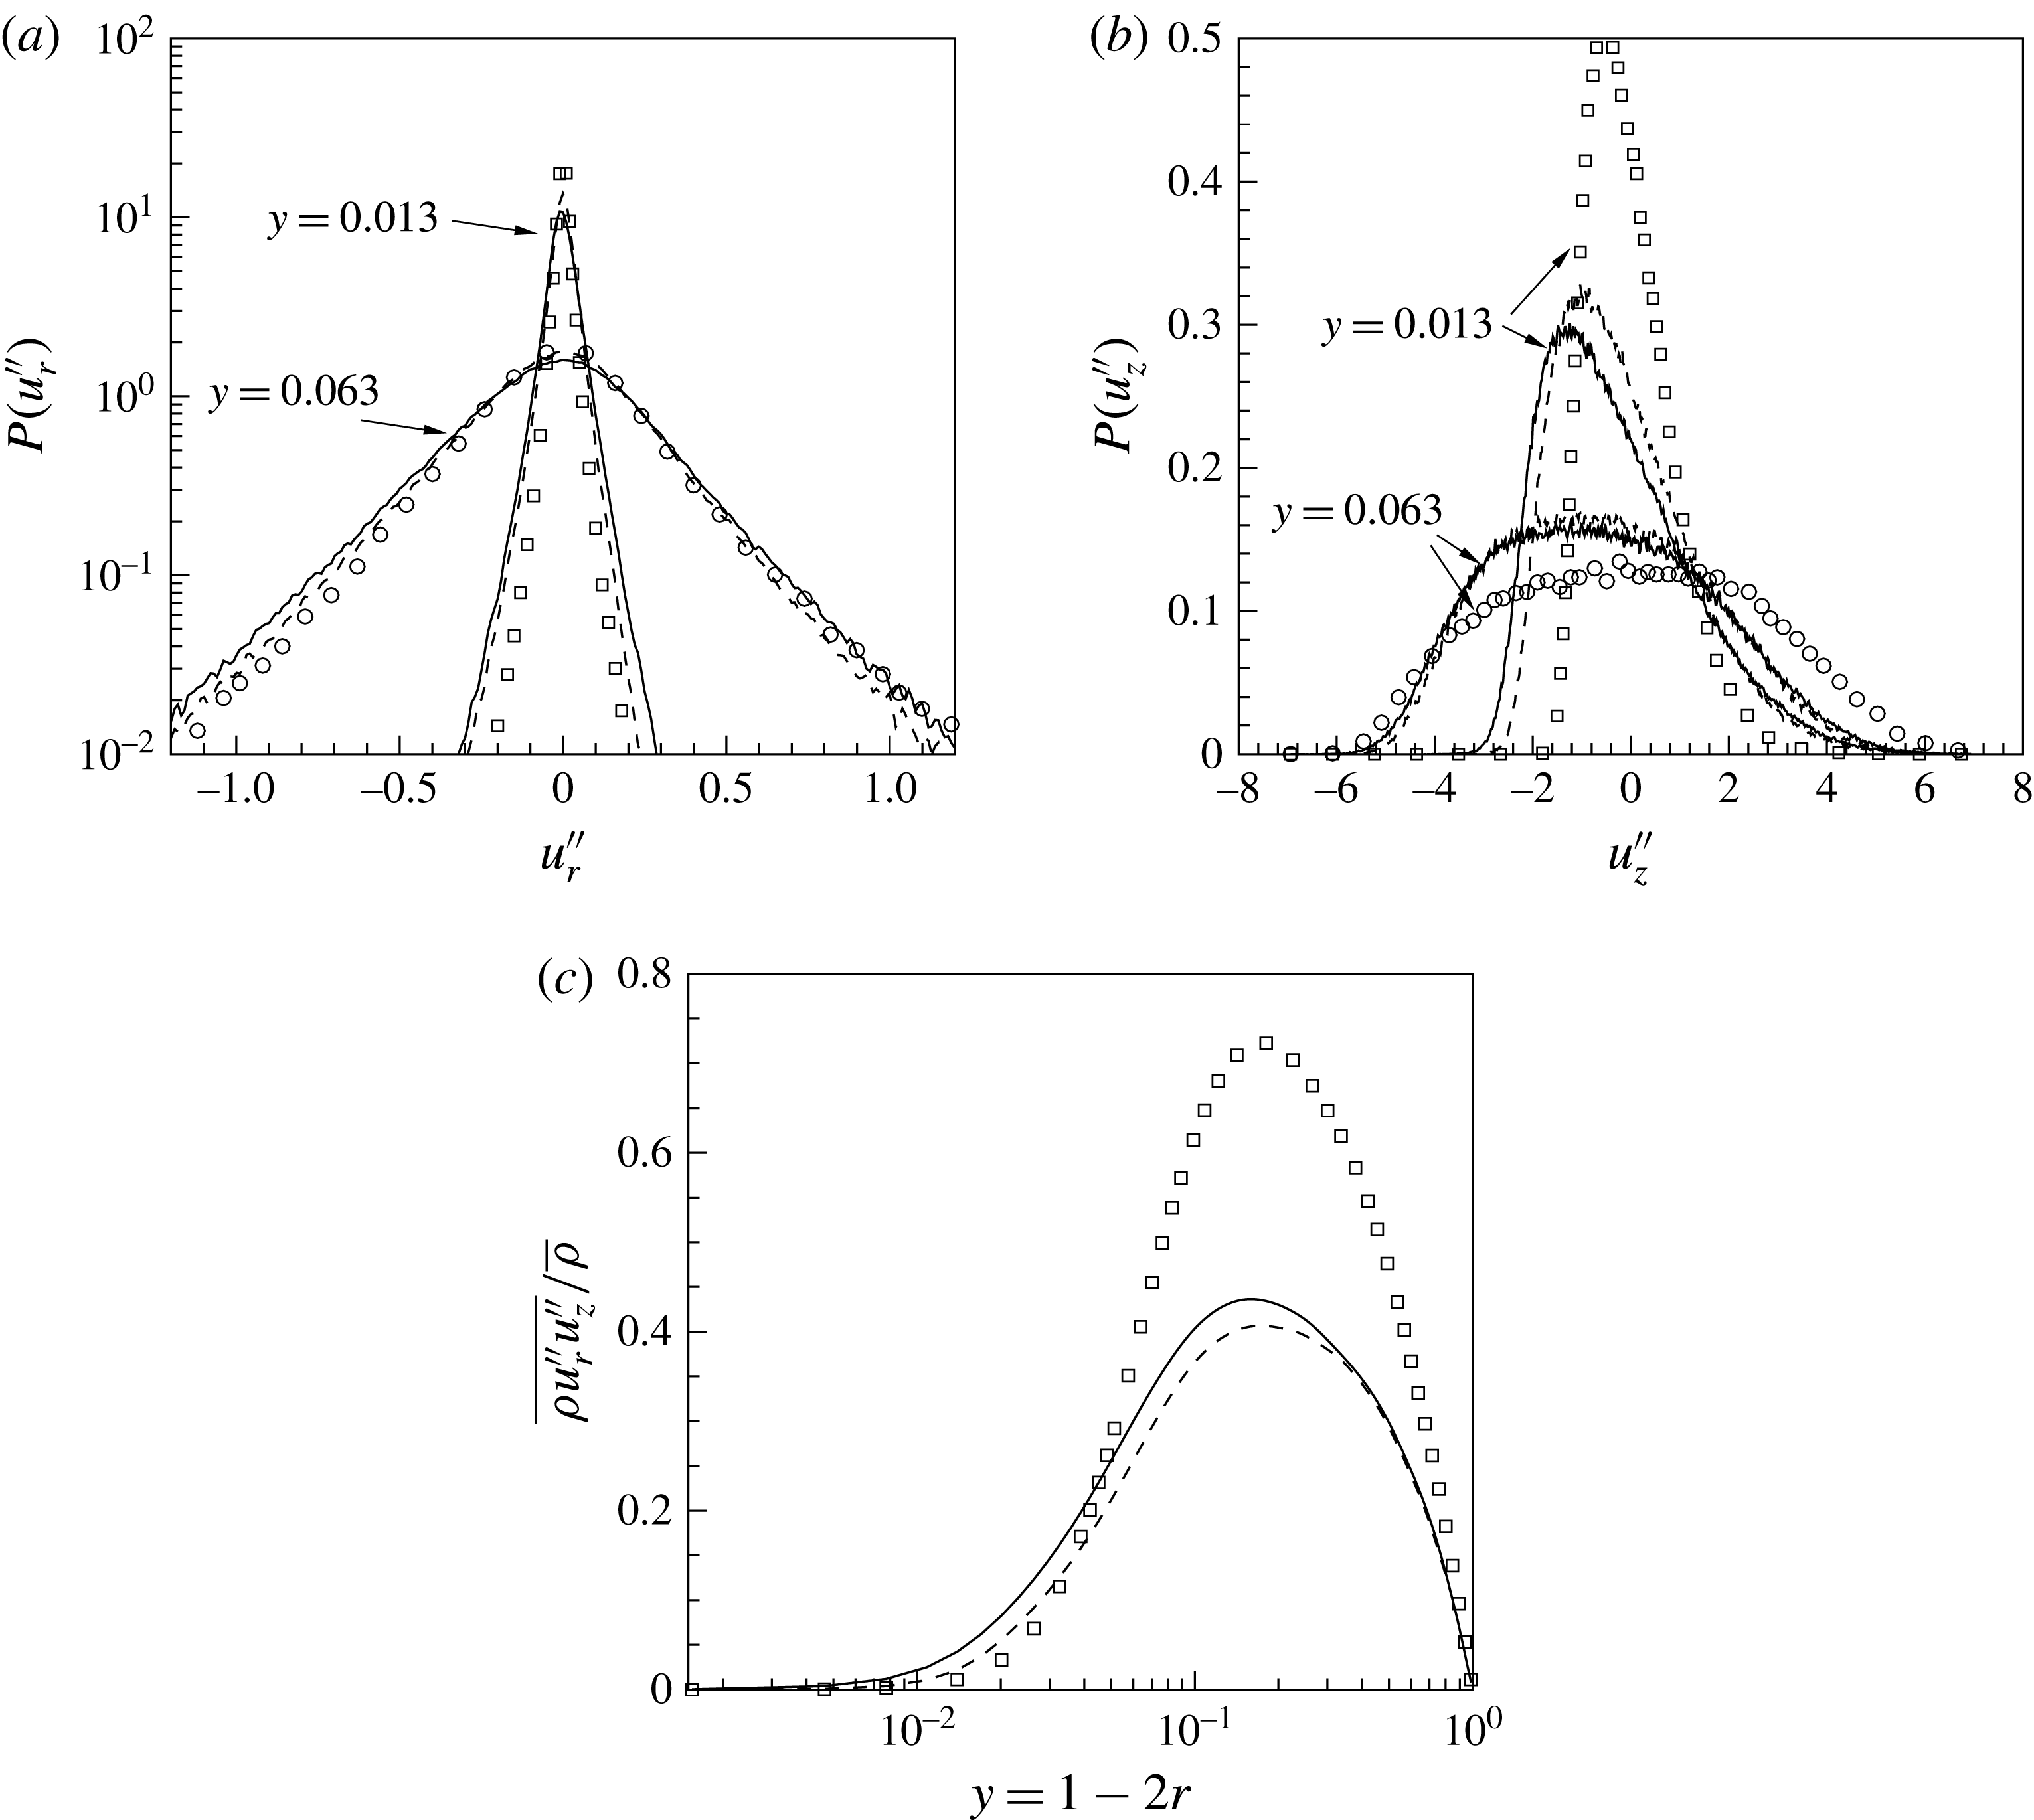
Figure 10. (a) PDF of radial velocity fluctuations
![]() $u_{r}^{\prime \prime }$
, (b) PDF of streamwise velocity fluctuations
$u_{r}^{\prime \prime }$
, (b) PDF of streamwise velocity fluctuations
![]() $u_{z}^{\prime \prime }$
, at two different wall-normal positions, and (c) turbulent shear stress profile
$u_{z}^{\prime \prime }$
, at two different wall-normal positions, and (c) turbulent shear stress profile
![]() $\overline{{\it\rho}u_{r}^{\prime \prime }u_{z}^{\prime \prime }}$
; (——)
$\overline{{\it\rho}u_{r}^{\prime \prime }u_{z}^{\prime \prime }}$
; (——)
![]() $\text{SC}_{K\rightarrow \infty }$
, (– – –)
$\text{SC}_{K\rightarrow \infty }$
, (– – –)
![]() $\text{SC}_{K\rightarrow 0}$
and symbols
$\text{SC}_{K\rightarrow 0}$
and symbols
![]() $\text{CP}_{K\rightarrow \infty }$
(
$\text{CP}_{K\rightarrow \infty }$
(
![]() $\text{CP}_{K\rightarrow 0}$
) at
$\text{CP}_{K\rightarrow 0}$
) at
![]() $z=15$
.
$z=15$
.
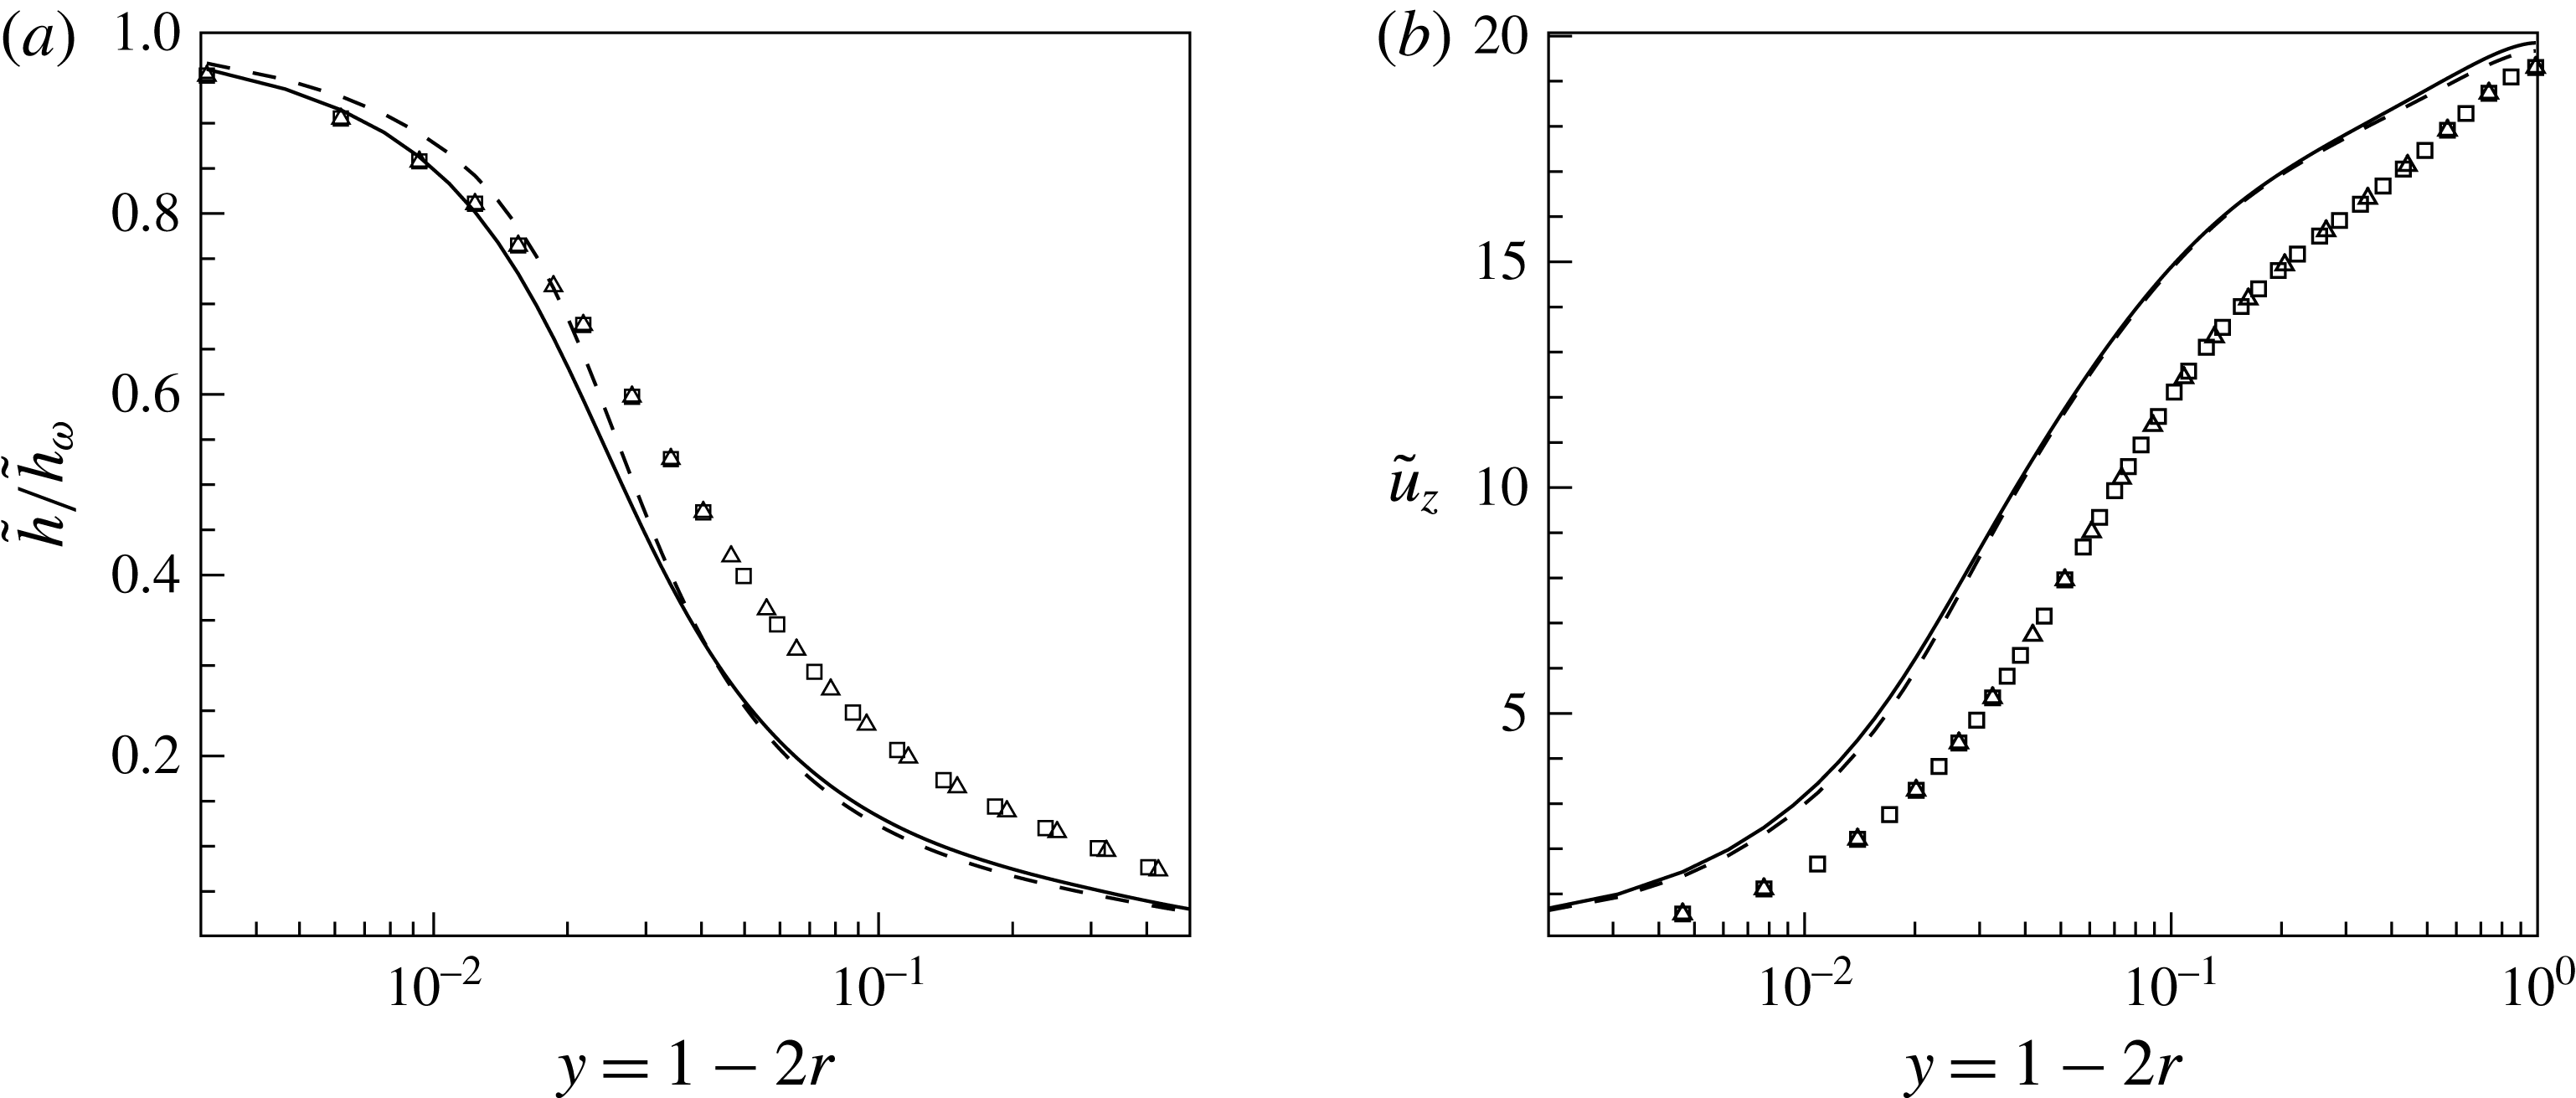
To investigate this Nusselt number dependency on the wall boundary condition, we will first analyse mean profiles for the enthalpy, velocity and several turbulence correlations. Figure 7 shows the radial distribution of the mean enthalpy – normalised by the value at the wall – and streamwise velocity for all cases investigated at a streamwise location of
![]() $z=15$
. Hereafter, all radial profiles are shown at
$z=15$
. Hereafter, all radial profiles are shown at
![]() $z=15$
, since this location is representative of almost the entire length of the pipe, except very close to the inlet where the heating of the pipe starts (the region between
$z=15$
, since this location is representative of almost the entire length of the pipe, except very close to the inlet where the heating of the pipe starts (the region between
![]() $z=0$
and
$z=0$
and
![]() $z\approx 3$
). While the constant property cases show no difference with respect to the applied boundary condition, the supercritical cases indicate a small difference. There are higher enthalpy gradients at the wall for
$z\approx 3$
). While the constant property cases show no difference with respect to the applied boundary condition, the supercritical cases indicate a small difference. There are higher enthalpy gradients at the wall for
![]() $\text{SC}_{K\rightarrow \infty }$
, which support the results of a higher heat flux from the wall. The mean streamwise velocity shows only slightly higher values for
$\text{SC}_{K\rightarrow \infty }$
, which support the results of a higher heat flux from the wall. The mean streamwise velocity shows only slightly higher values for
![]() $\text{SC}_{K\rightarrow \infty }$
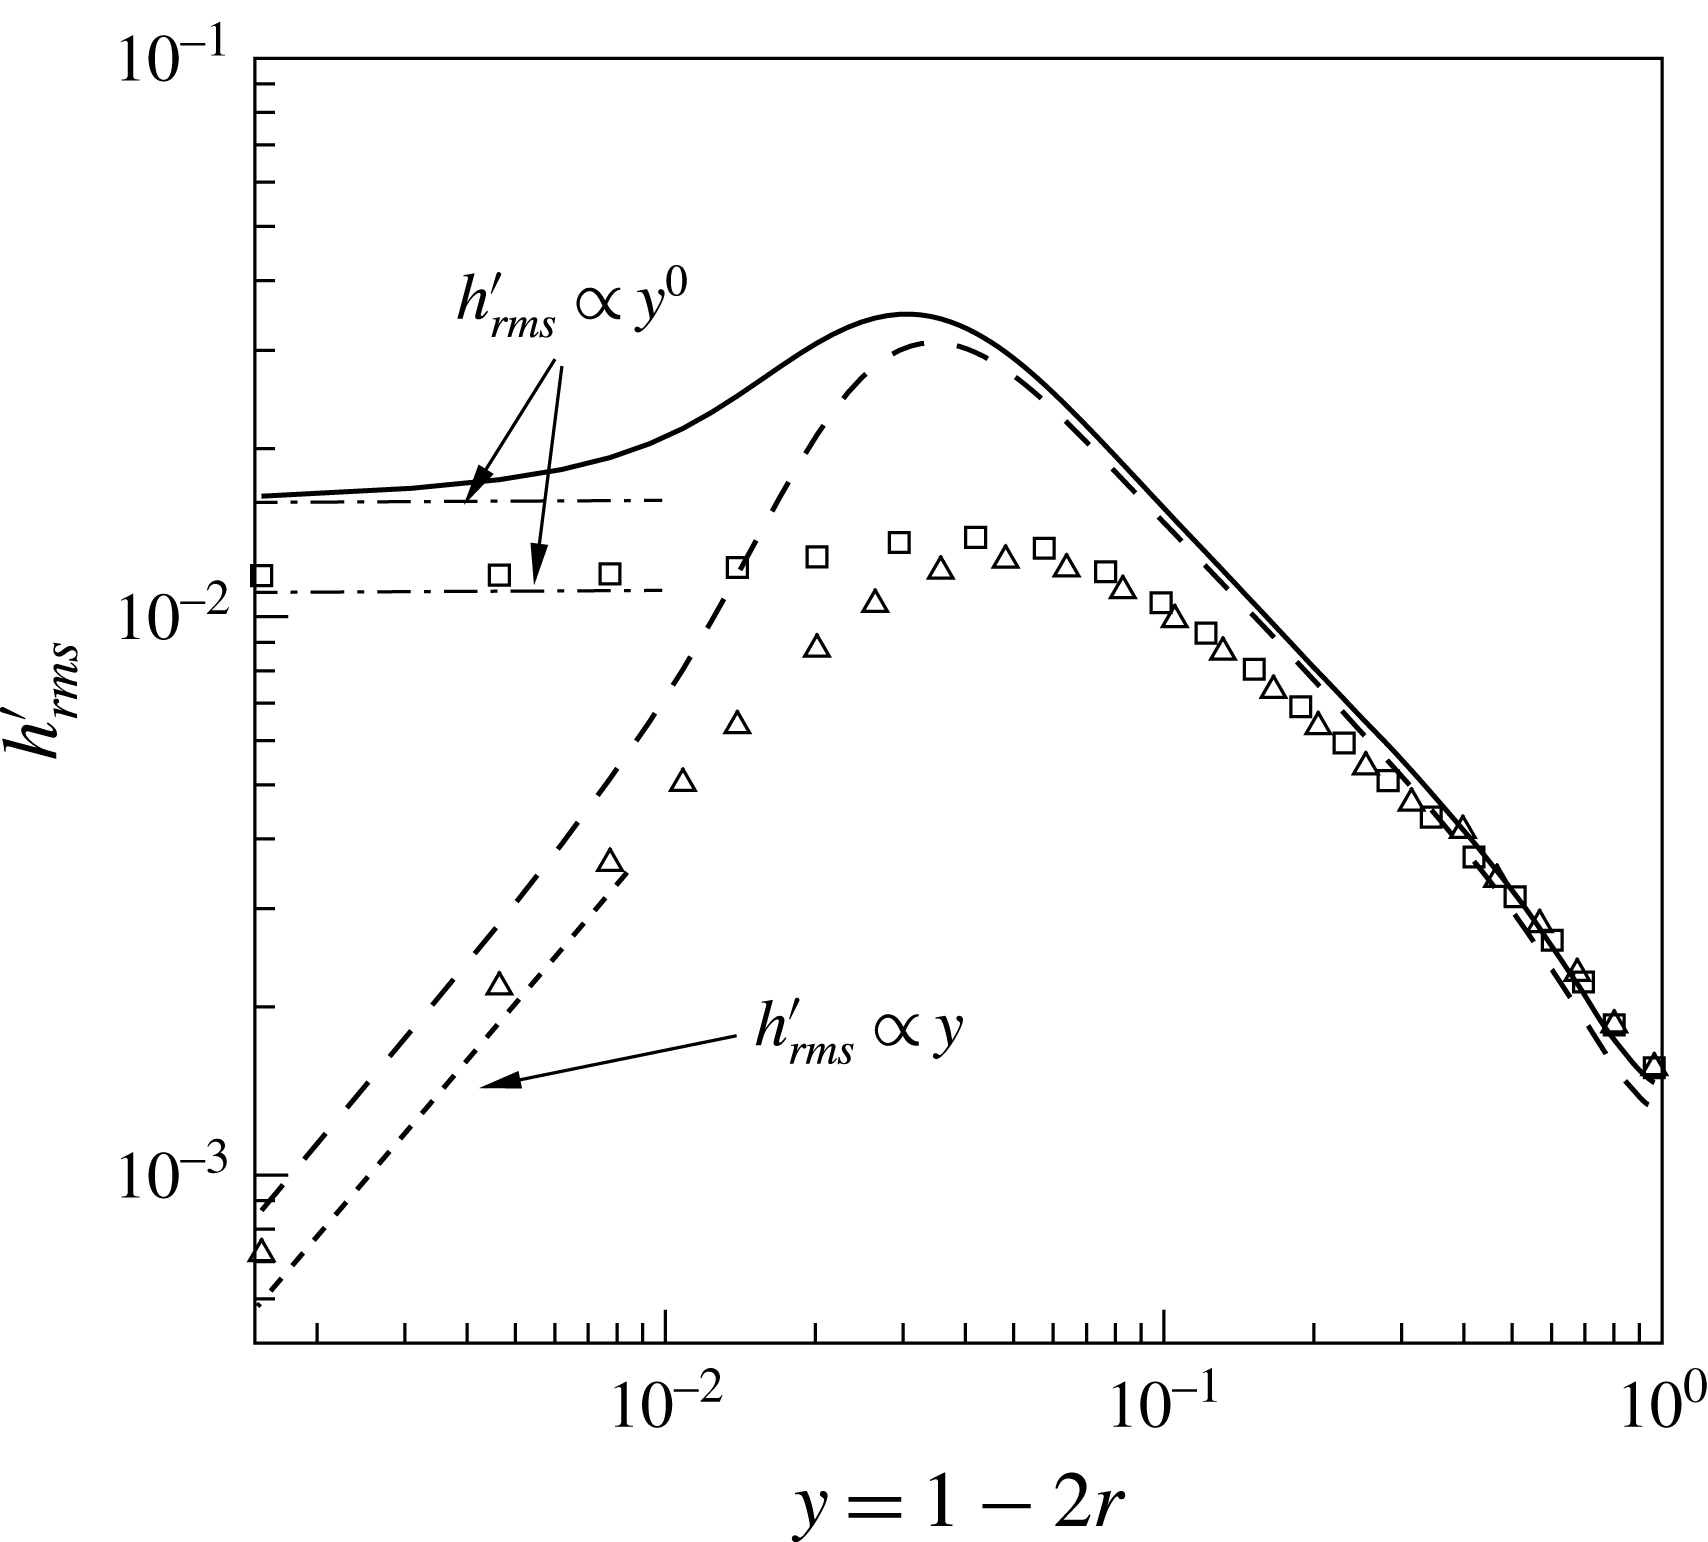
in the near-wall region. Larger differences are obtained for the enthalpy variance
$\text{SC}_{K\rightarrow \infty }$
in the near-wall region. Larger differences are obtained for the enthalpy variance
![]() $h_{rms}^{\prime }$
as shown in figure 8 for all four cases at the same streamwise location of
$h_{rms}^{\prime }$
as shown in figure 8 for all four cases at the same streamwise location of
![]() $z=15$
. For
$z=15$
. For
![]() $\text{CP}_{K\rightarrow \infty }$
the variance at the wall is non-zero and its slope is zero, while for the case
$\text{CP}_{K\rightarrow \infty }$
the variance at the wall is non-zero and its slope is zero, while for the case
![]() $\text{CP}_{K\rightarrow 0}$
the value at the wall is zero and its slope is proportional to
$\text{CP}_{K\rightarrow 0}$
the value at the wall is zero and its slope is proportional to
![]() $y$
. Similar observations were made in Kong et al. (Reference Kong, Choi and Lee2000), Tiselj et al. (Reference Tiselj, Pogrebnyak, Li, Mosyak and Hetsroni2001b
), Li et al. (Reference Li, Schlatter, Brandt and Henningson2009). The supercritical cases show higher variances for both cases. However, the main difference is that for case
$y$
. Similar observations were made in Kong et al. (Reference Kong, Choi and Lee2000), Tiselj et al. (Reference Tiselj, Pogrebnyak, Li, Mosyak and Hetsroni2001b
), Li et al. (Reference Li, Schlatter, Brandt and Henningson2009). The supercritical cases show higher variances for both cases. However, the main difference is that for case
![]() $\text{SC}_{K\rightarrow \infty }$
, the slope of the enthalpy variance at the wall is non-zero. This can be explained by using Reynolds decomposition for the instantaneous heat flux:
$\text{SC}_{K\rightarrow \infty }$
, the slope of the enthalpy variance at the wall is non-zero. This can be explained by using Reynolds decomposition for the instantaneous heat flux:
after multiplication with
![]() $h^{\prime }$
, substituting
$h^{\prime }$
, substituting
![]() $y=1-2r$
and time averaging we obtain
$y=1-2r$
and time averaging we obtain
 $$\begin{eqnarray}\left.\frac{\partial \overline{h^{\prime 2}}}{\partial y}\right|_{w}=\left.-\frac{\overline{{\it\alpha}^{\prime }h^{\prime }\displaystyle \frac{\partial h}{\partial y}}}{\overline{{\it\alpha}}}\right|_{w}.\end{eqnarray}$$
Note, for the case
![]() $\text{SC}_{K\rightarrow \infty }$
the wall heat flux
$\text{SC}_{K\rightarrow \infty }$
the wall heat flux
![]() $Q$
is constant, and thus the term
$Q$
is constant, and thus the term
![]() $h^{\prime }Q$
vanishes after averaging. When the property fluctuations are present, as they are in case
$h^{\prime }Q$
vanishes after averaging. When the property fluctuations are present, as they are in case
![]() $\text{SC}_{K\rightarrow \infty }$
(
$\text{SC}_{K\rightarrow \infty }$
(
![]() ${\it\alpha}^{\prime }\neq 0$
), the right-hand side of (5.4) does not vanish – the consequence is that the gradient of
${\it\alpha}^{\prime }\neq 0$
), the right-hand side of (5.4) does not vanish – the consequence is that the gradient of
![]() $h_{rms}^{\prime }$
at the wall is non-zero (see solid line in figure 8). The enthalpy variance for the case
$h_{rms}^{\prime }$
at the wall is non-zero (see solid line in figure 8). The enthalpy variance for the case
![]() $\text{SC}_{K\rightarrow 0}$
shows a similar behaviour as for
$\text{SC}_{K\rightarrow 0}$
shows a similar behaviour as for
![]() $\text{CP}_{K\rightarrow 0}$
, because the fixed wall enthalpy boundary conditions results in zero and negligible property fluctuations at and close to the wall, respectively.
$\text{CP}_{K\rightarrow 0}$
, because the fixed wall enthalpy boundary conditions results in zero and negligible property fluctuations at and close to the wall, respectively.
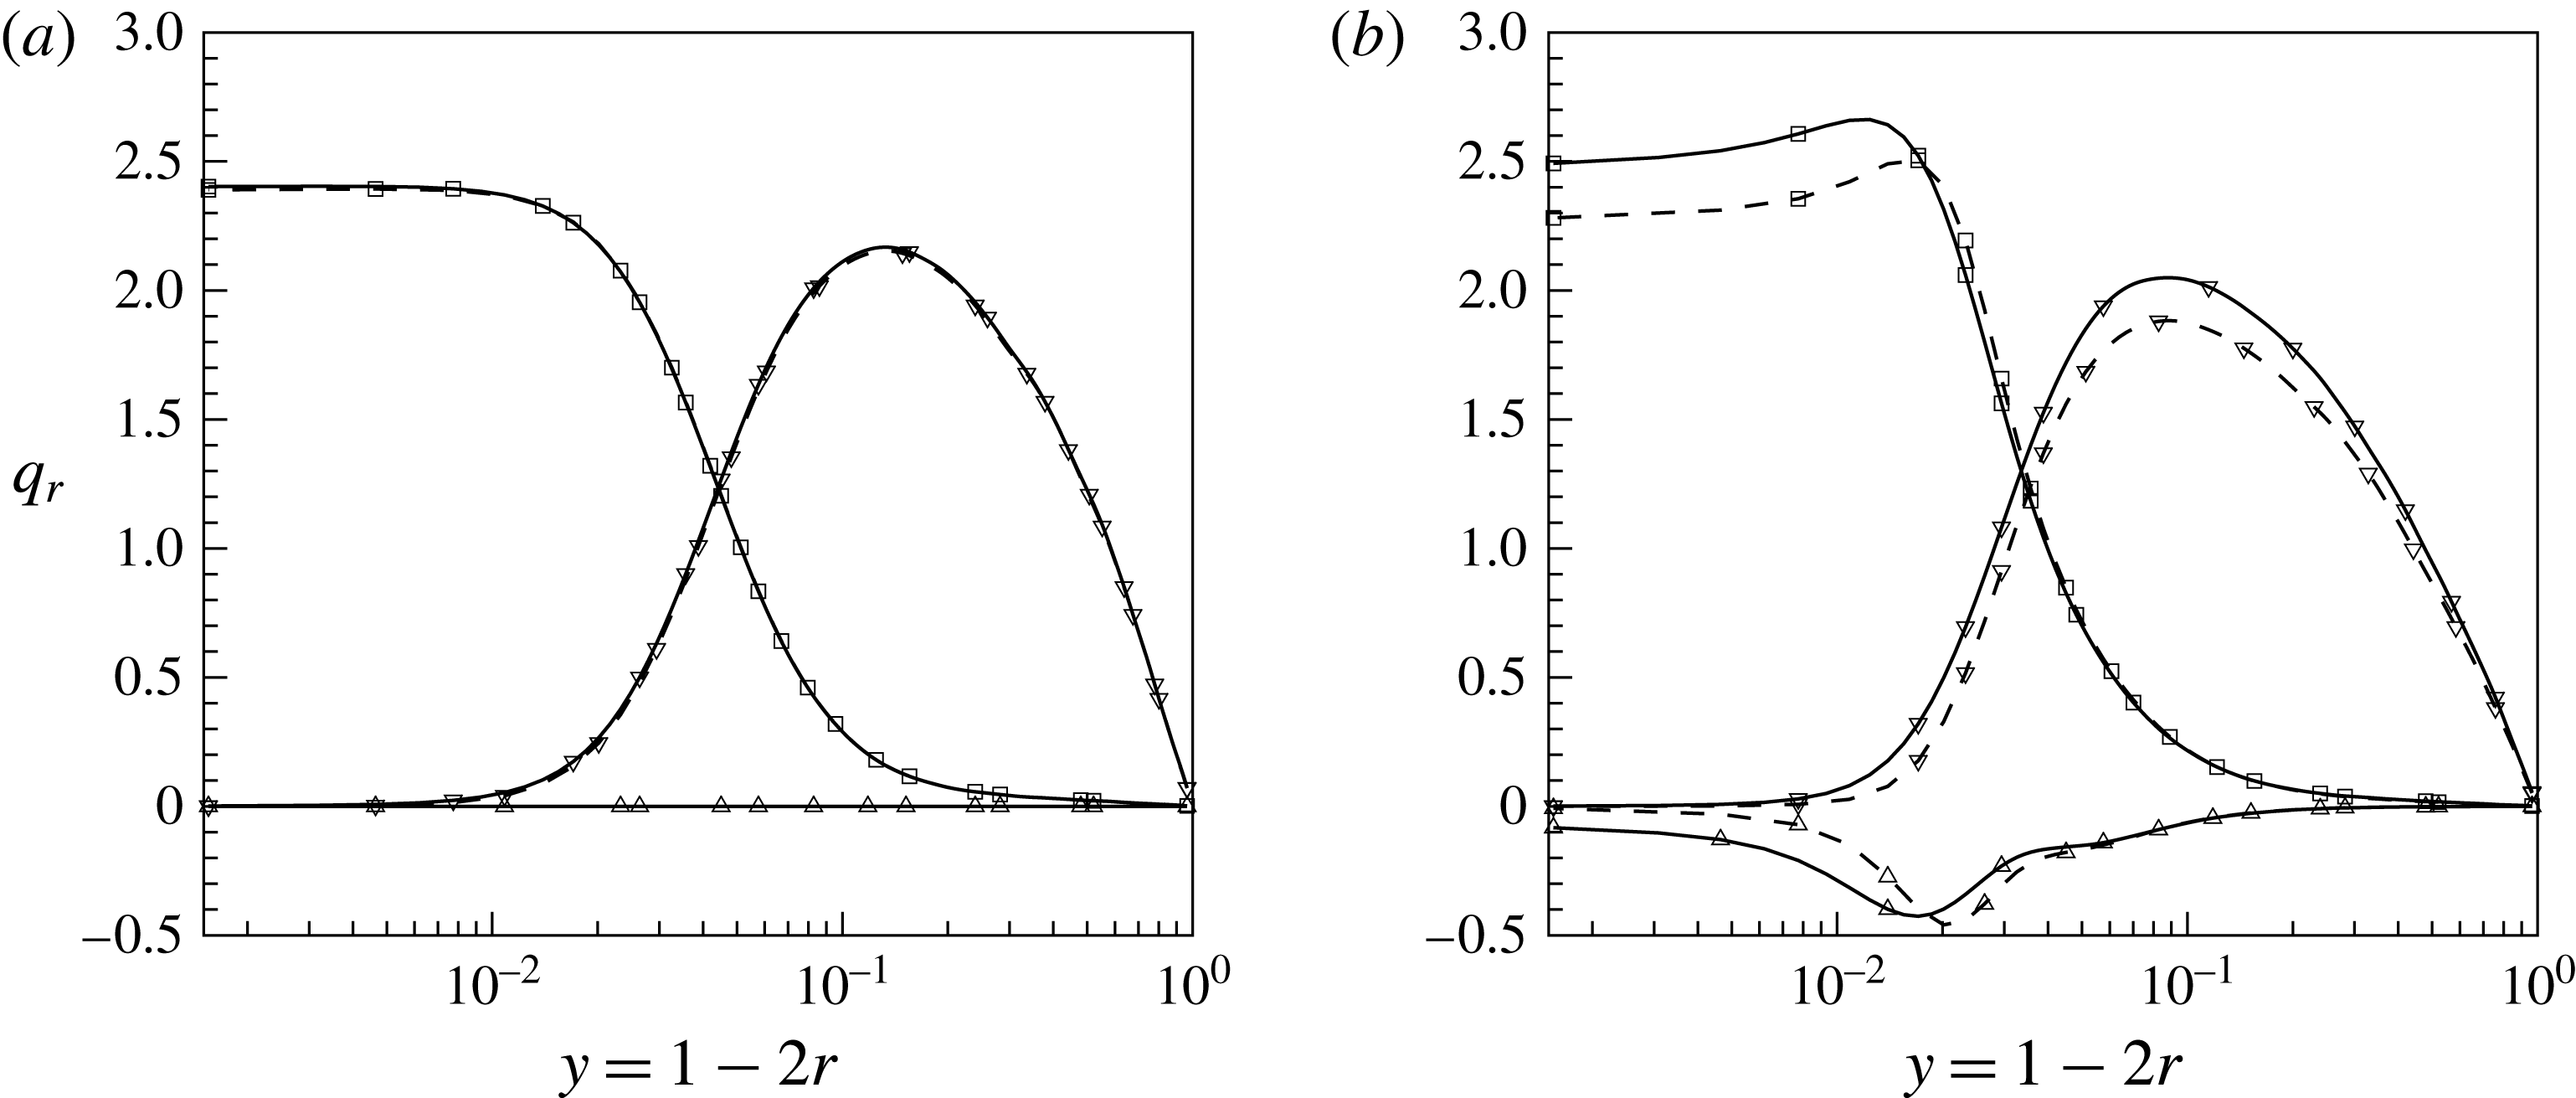
Next, components of the total radial heat flux are compared for different thermal wall boundary conditions. Using Reynolds decomposition, the heat flux can be decomposed as
where
![]() $\overline{{\it\alpha}}\partial \overline{h}/\partial r$
is the averaged molecular heat flux,
$\overline{{\it\alpha}}\partial \overline{h}/\partial r$
is the averaged molecular heat flux,
![]() $\overline{{\it\rho}u_{r}^{\prime \prime }h^{\prime \prime }}$
is the turbulent heat flux and
$\overline{{\it\rho}u_{r}^{\prime \prime }h^{\prime \prime }}$
is the turbulent heat flux and
![]() $\overline{{\it\alpha}^{\prime }\partial h^{\prime }/\partial r}$
is an additional averaging term due to property fluctuations. Their profiles for all cases are shown in figure 9 at
$\overline{{\it\alpha}^{\prime }\partial h^{\prime }/\partial r}$
is an additional averaging term due to property fluctuations. Their profiles for all cases are shown in figure 9 at
![]() $z=15$
. As can be seen in figure 9(a), the averaged molecular heat flux for the constant property cases is 2.4 at the wall, which corresponds to the specified heat flux value for the case
$z=15$
. As can be seen in figure 9(a), the averaged molecular heat flux for the constant property cases is 2.4 at the wall, which corresponds to the specified heat flux value for the case
![]() $\text{CP}_{K\rightarrow \infty }$
; and the different thermal wall boundary conditions (cases
$\text{CP}_{K\rightarrow \infty }$
; and the different thermal wall boundary conditions (cases
![]() $\text{CP}_{K\rightarrow \infty }$
and
$\text{CP}_{K\rightarrow \infty }$
and
![]() $\text{CP}_{K\rightarrow 0}$
) have no effect on the overall heat transfer since
$\text{CP}_{K\rightarrow 0}$
) have no effect on the overall heat transfer since
![]() $Pr\geqslant 1$
. For the supercritical case
$Pr\geqslant 1$
. For the supercritical case
![]() $\text{SC}_{K\rightarrow \infty }$
, however, the averaged molecular heat flux at the wall is substantially higher than the specified value of 2.4 (see figure 9
b). The additional term
$\text{SC}_{K\rightarrow \infty }$
, however, the averaged molecular heat flux at the wall is substantially higher than the specified value of 2.4 (see figure 9
b). The additional term
![]() $\overline{{\it\alpha}^{\prime }\partial h^{\prime }/\partial r}$
in (5.5) causes a negative heat flux contribution of approximately
$\overline{{\it\alpha}^{\prime }\partial h^{\prime }/\partial r}$
in (5.5) causes a negative heat flux contribution of approximately
![]() $-0.1$
. For the case
$-0.1$
. For the case
![]() $\text{SC}_{K\rightarrow 0}$
the wall value for the averaged molecular heat flux
$\text{SC}_{K\rightarrow 0}$
the wall value for the averaged molecular heat flux
![]() $\overline{{\it\alpha}}\partial \overline{h}/\partial r$
is below 2.4 and the additional term
$\overline{{\it\alpha}}\partial \overline{h}/\partial r$
is below 2.4 and the additional term
![]() $\overline{{\it\alpha}^{\prime }\partial h^{\prime }/\partial r}=0$
. This confirms the decreased heat transfer rate as shown in figure 6 when the constant heat flux boundary condition
$\overline{{\it\alpha}^{\prime }\partial h^{\prime }/\partial r}=0$
. This confirms the decreased heat transfer rate as shown in figure 6 when the constant heat flux boundary condition
![]() $\text{SC}_{K\rightarrow \infty }$
is replaced by its corresponding averaged wall enthalpy in case
$\text{SC}_{K\rightarrow \infty }$
is replaced by its corresponding averaged wall enthalpy in case
![]() $\text{SC}_{K\rightarrow 0}$
.
$\text{SC}_{K\rightarrow 0}$
.
The effect of thermal wall boundary conditions on the averaged heat flux and the additional term is limited to the near-wall region
![]() $y\leqslant 0.03$
, while the turbulent heat flux is affected over the entire cross-section of the pipe. It can be seen that
$y\leqslant 0.03$
, while the turbulent heat flux is affected over the entire cross-section of the pipe. It can be seen that
![]() $-\overline{{\it\rho}u_{r}^{\prime \prime }h^{\prime \prime }}$
for
$-\overline{{\it\rho}u_{r}^{\prime \prime }h^{\prime \prime }}$
for
![]() $\text{SC}_{K\rightarrow 0}$
is lower than for
$\text{SC}_{K\rightarrow 0}$
is lower than for
![]() $\text{SC}_{K\rightarrow \infty }$
. This difference stems from the correlation between enthalpy
$\text{SC}_{K\rightarrow \infty }$
. This difference stems from the correlation between enthalpy
![]() $h^{\prime }$
and density
$h^{\prime }$
and density
![]() ${\it\rho}^{\prime }$
fluctuations, whereby enhanced density fluctuations
${\it\rho}^{\prime }$
fluctuations, whereby enhanced density fluctuations
![]() ${\it\rho}^{\prime }$
cause increased mass fluctuations and consequently larger velocity fluctuations.
${\it\rho}^{\prime }$
cause increased mass fluctuations and consequently larger velocity fluctuations.
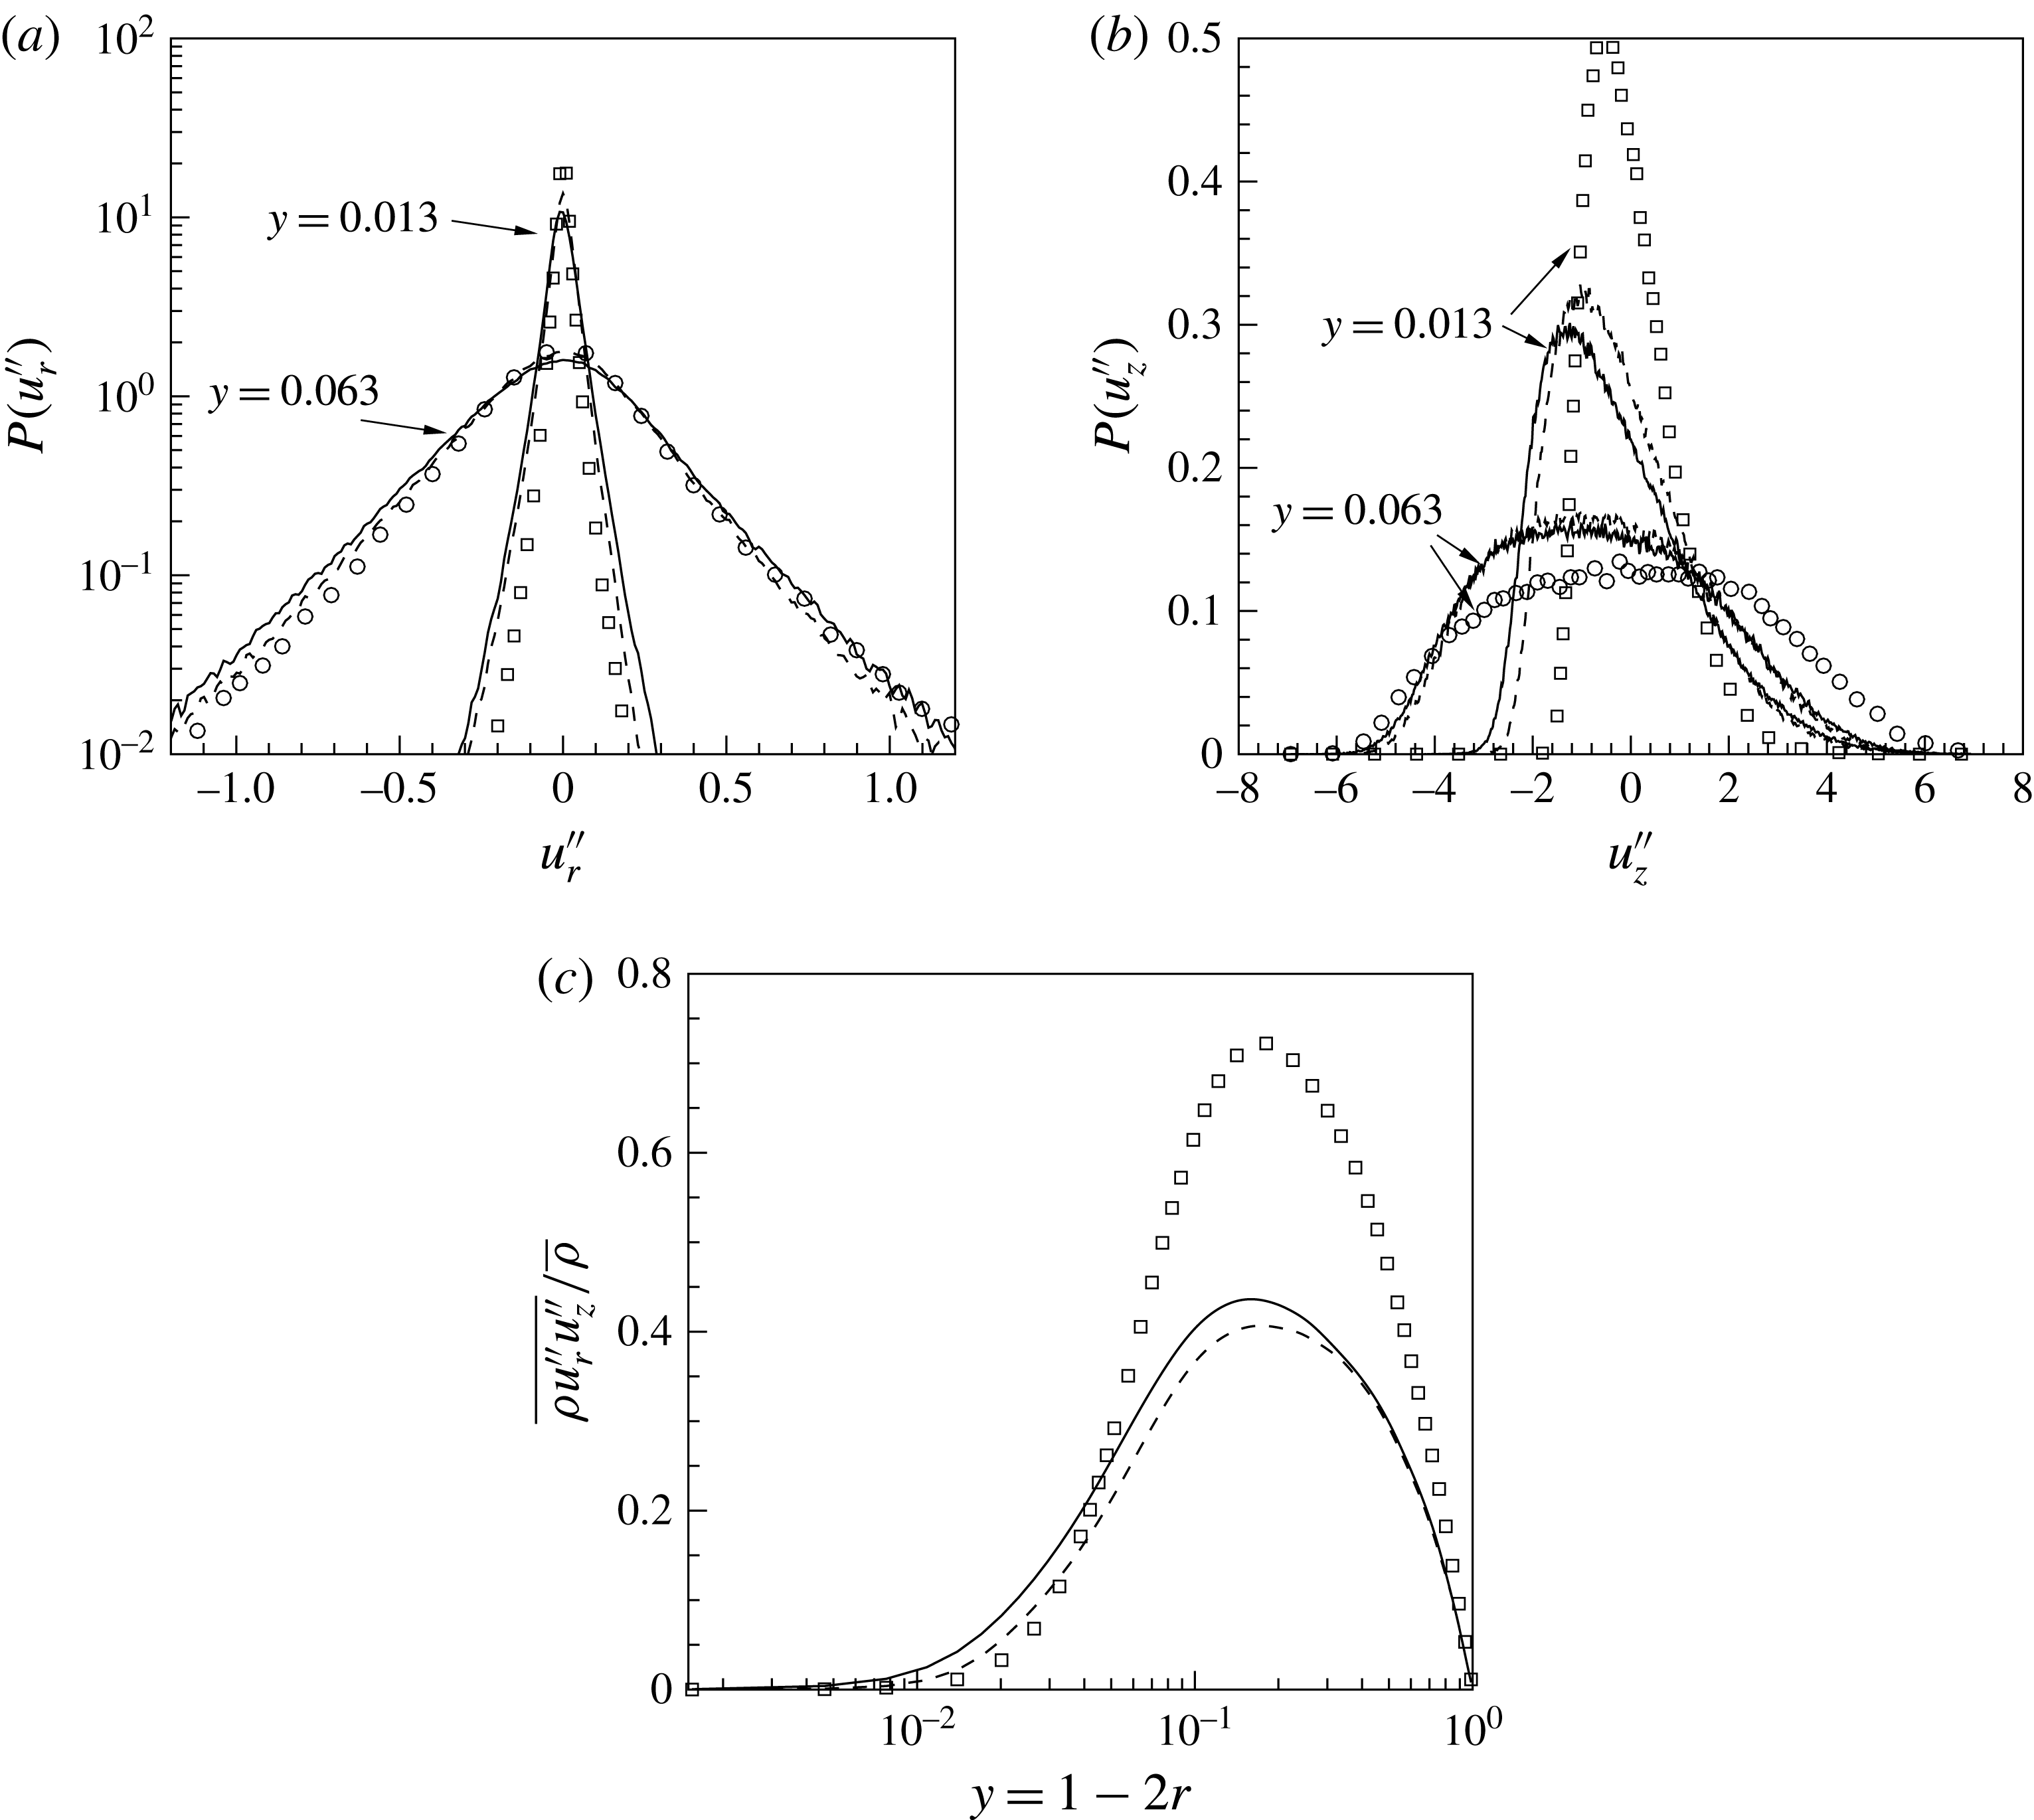
This is quantified in figure 10 by means of probability density functions (PDF) of radial
![]() $u_{r}^{\prime \prime }$
and streamwise
$u_{r}^{\prime \prime }$
and streamwise
![]() $u_{z}^{\prime \prime }$
velocity fluctuations and the turbulent shear stress. The radial
$u_{z}^{\prime \prime }$
velocity fluctuations and the turbulent shear stress. The radial
![]() $u_{r}^{\prime \prime }$
and streamwise
$u_{r}^{\prime \prime }$
and streamwise
![]() $u_{z}^{\prime \prime }$
velocity fluctuations are compared at two different wall-normal locations for the cases
$u_{z}^{\prime \prime }$
velocity fluctuations are compared at two different wall-normal locations for the cases
![]() $\text{SC}_{K\rightarrow \infty }$
and
$\text{SC}_{K\rightarrow \infty }$
and
![]() $\text{SC}_{K\rightarrow 0}$
in figures 10(a) and 10(b). Two observations can be made. First, both radial and streamwise velocity fluctuations are higher for
$\text{SC}_{K\rightarrow 0}$
in figures 10(a) and 10(b). Two observations can be made. First, both radial and streamwise velocity fluctuations are higher for
![]() $\text{SC}_{K\rightarrow \infty }$
than for
$\text{SC}_{K\rightarrow \infty }$
than for
![]() $\text{SC}_{K\rightarrow 0}$
(however, more pronounced in streamwise velocity), which again can be linked to the effect of higher density fluctuations in
$\text{SC}_{K\rightarrow 0}$
(however, more pronounced in streamwise velocity), which again can be linked to the effect of higher density fluctuations in
![]() $\text{SC}_{K\rightarrow \infty }$
. Second, the velocity fluctuations for both cases increase close to the wall, while they decrease close to the centre if compared to the
$\text{SC}_{K\rightarrow \infty }$
. Second, the velocity fluctuations for both cases increase close to the wall, while they decrease close to the centre if compared to the
![]() $\text{CP}_{K\rightarrow 0}$
(
$\text{CP}_{K\rightarrow 0}$
(
![]() $\text{CP}_{K\rightarrow \infty }$
). The latter observation can also be seen from the profile of the Reynolds shear stress, which is plotted in figure 10(c) at the same streamwise position for different cases. As discussed in our previous work (Nemati et al.
Reference Nemati, Patel, Boersma and Pecnik2015), this is due to flow acceleration using thermal expansion, which results in an increase in the bulk velocity. In laminar flows, the thermal expansion increases the convective heat transfer because of flow acceleration. In turbulent convection the effects are opposite (Kim, He & Jackson Reference Kim, He and Jackson2008). Although the flow acceleration increases the velocity close to the wall, it reduces turbulence production. The wall-normal velocity gradient in the viscous dominant region increases, where it has a small influence on the turbulence production, while further away from the wall the velocity gradient decreases and thus also decreases the turbulence production.
$\text{CP}_{K\rightarrow \infty }$
). The latter observation can also be seen from the profile of the Reynolds shear stress, which is plotted in figure 10(c) at the same streamwise position for different cases. As discussed in our previous work (Nemati et al.
Reference Nemati, Patel, Boersma and Pecnik2015), this is due to flow acceleration using thermal expansion, which results in an increase in the bulk velocity. In laminar flows, the thermal expansion increases the convective heat transfer because of flow acceleration. In turbulent convection the effects are opposite (Kim, He & Jackson Reference Kim, He and Jackson2008). Although the flow acceleration increases the velocity close to the wall, it reduces turbulence production. The wall-normal velocity gradient in the viscous dominant region increases, where it has a small influence on the turbulence production, while further away from the wall the velocity gradient decreases and thus also decreases the turbulence production.
5.3 Quadrant analysis
In order to identify the fractional contributions of instantaneous fluctuations to turbulence statistics, such as the turbulent heat flux
![]() $\overline{{\it\rho}u_{r}^{\prime \prime }h^{\prime \prime }}$
and the turbulent shear stress
$\overline{{\it\rho}u_{r}^{\prime \prime }h^{\prime \prime }}$
and the turbulent shear stress
![]() $\overline{{\it\rho}u_{r}^{\prime \prime }u_{z}^{\prime \prime }}$
, a quadrant analysis is performed next. For this technique,
$\overline{{\it\rho}u_{r}^{\prime \prime }u_{z}^{\prime \prime }}$
, a quadrant analysis is performed next. For this technique,
![]() $\overline{{\it\rho}u_{r}^{\prime \prime }h^{\prime \prime }}$
and
$\overline{{\it\rho}u_{r}^{\prime \prime }h^{\prime \prime }}$
and
![]() $\overline{{\it\rho}u_{r}^{\prime \prime }u_{z}^{\prime \prime }}$
are conditionally averaged into four quadrants of
$\overline{{\it\rho}u_{r}^{\prime \prime }u_{z}^{\prime \prime }}$
are conditionally averaged into four quadrants of
![]() $\sqrt{{\it\rho}}u_{r}^{\prime \prime }-\sqrt{{\it\rho}}h^{\prime \prime }$
and
$\sqrt{{\it\rho}}u_{r}^{\prime \prime }-\sqrt{{\it\rho}}h^{\prime \prime }$
and
![]() $\sqrt{{\it\rho}}u_{r}^{\prime \prime }-\sqrt{{\it\rho}}u_{z}^{\prime \prime }$
planes, respectively, as shown in figure 11. The first quadrant
$\sqrt{{\it\rho}}u_{r}^{\prime \prime }-\sqrt{{\it\rho}}u_{z}^{\prime \prime }$
planes, respectively, as shown in figure 11. The first quadrant
![]() $Q1$
is associated with sweep events since cold and high-speed fluid moves toward the wall and the third quadrant
$Q1$
is associated with sweep events since cold and high-speed fluid moves toward the wall and the third quadrant
![]() $Q3$
indicates ejections, which are hot fluids with low streamwise velocity moving away from the wall. The second quadrant
$Q3$
indicates ejections, which are hot fluids with low streamwise velocity moving away from the wall. The second quadrant
![]() $Q2$
contains outward motions of high-speed and cold fluids, while the fourth quadrant
$Q2$
contains outward motions of high-speed and cold fluids, while the fourth quadrant
![]() $Q4$
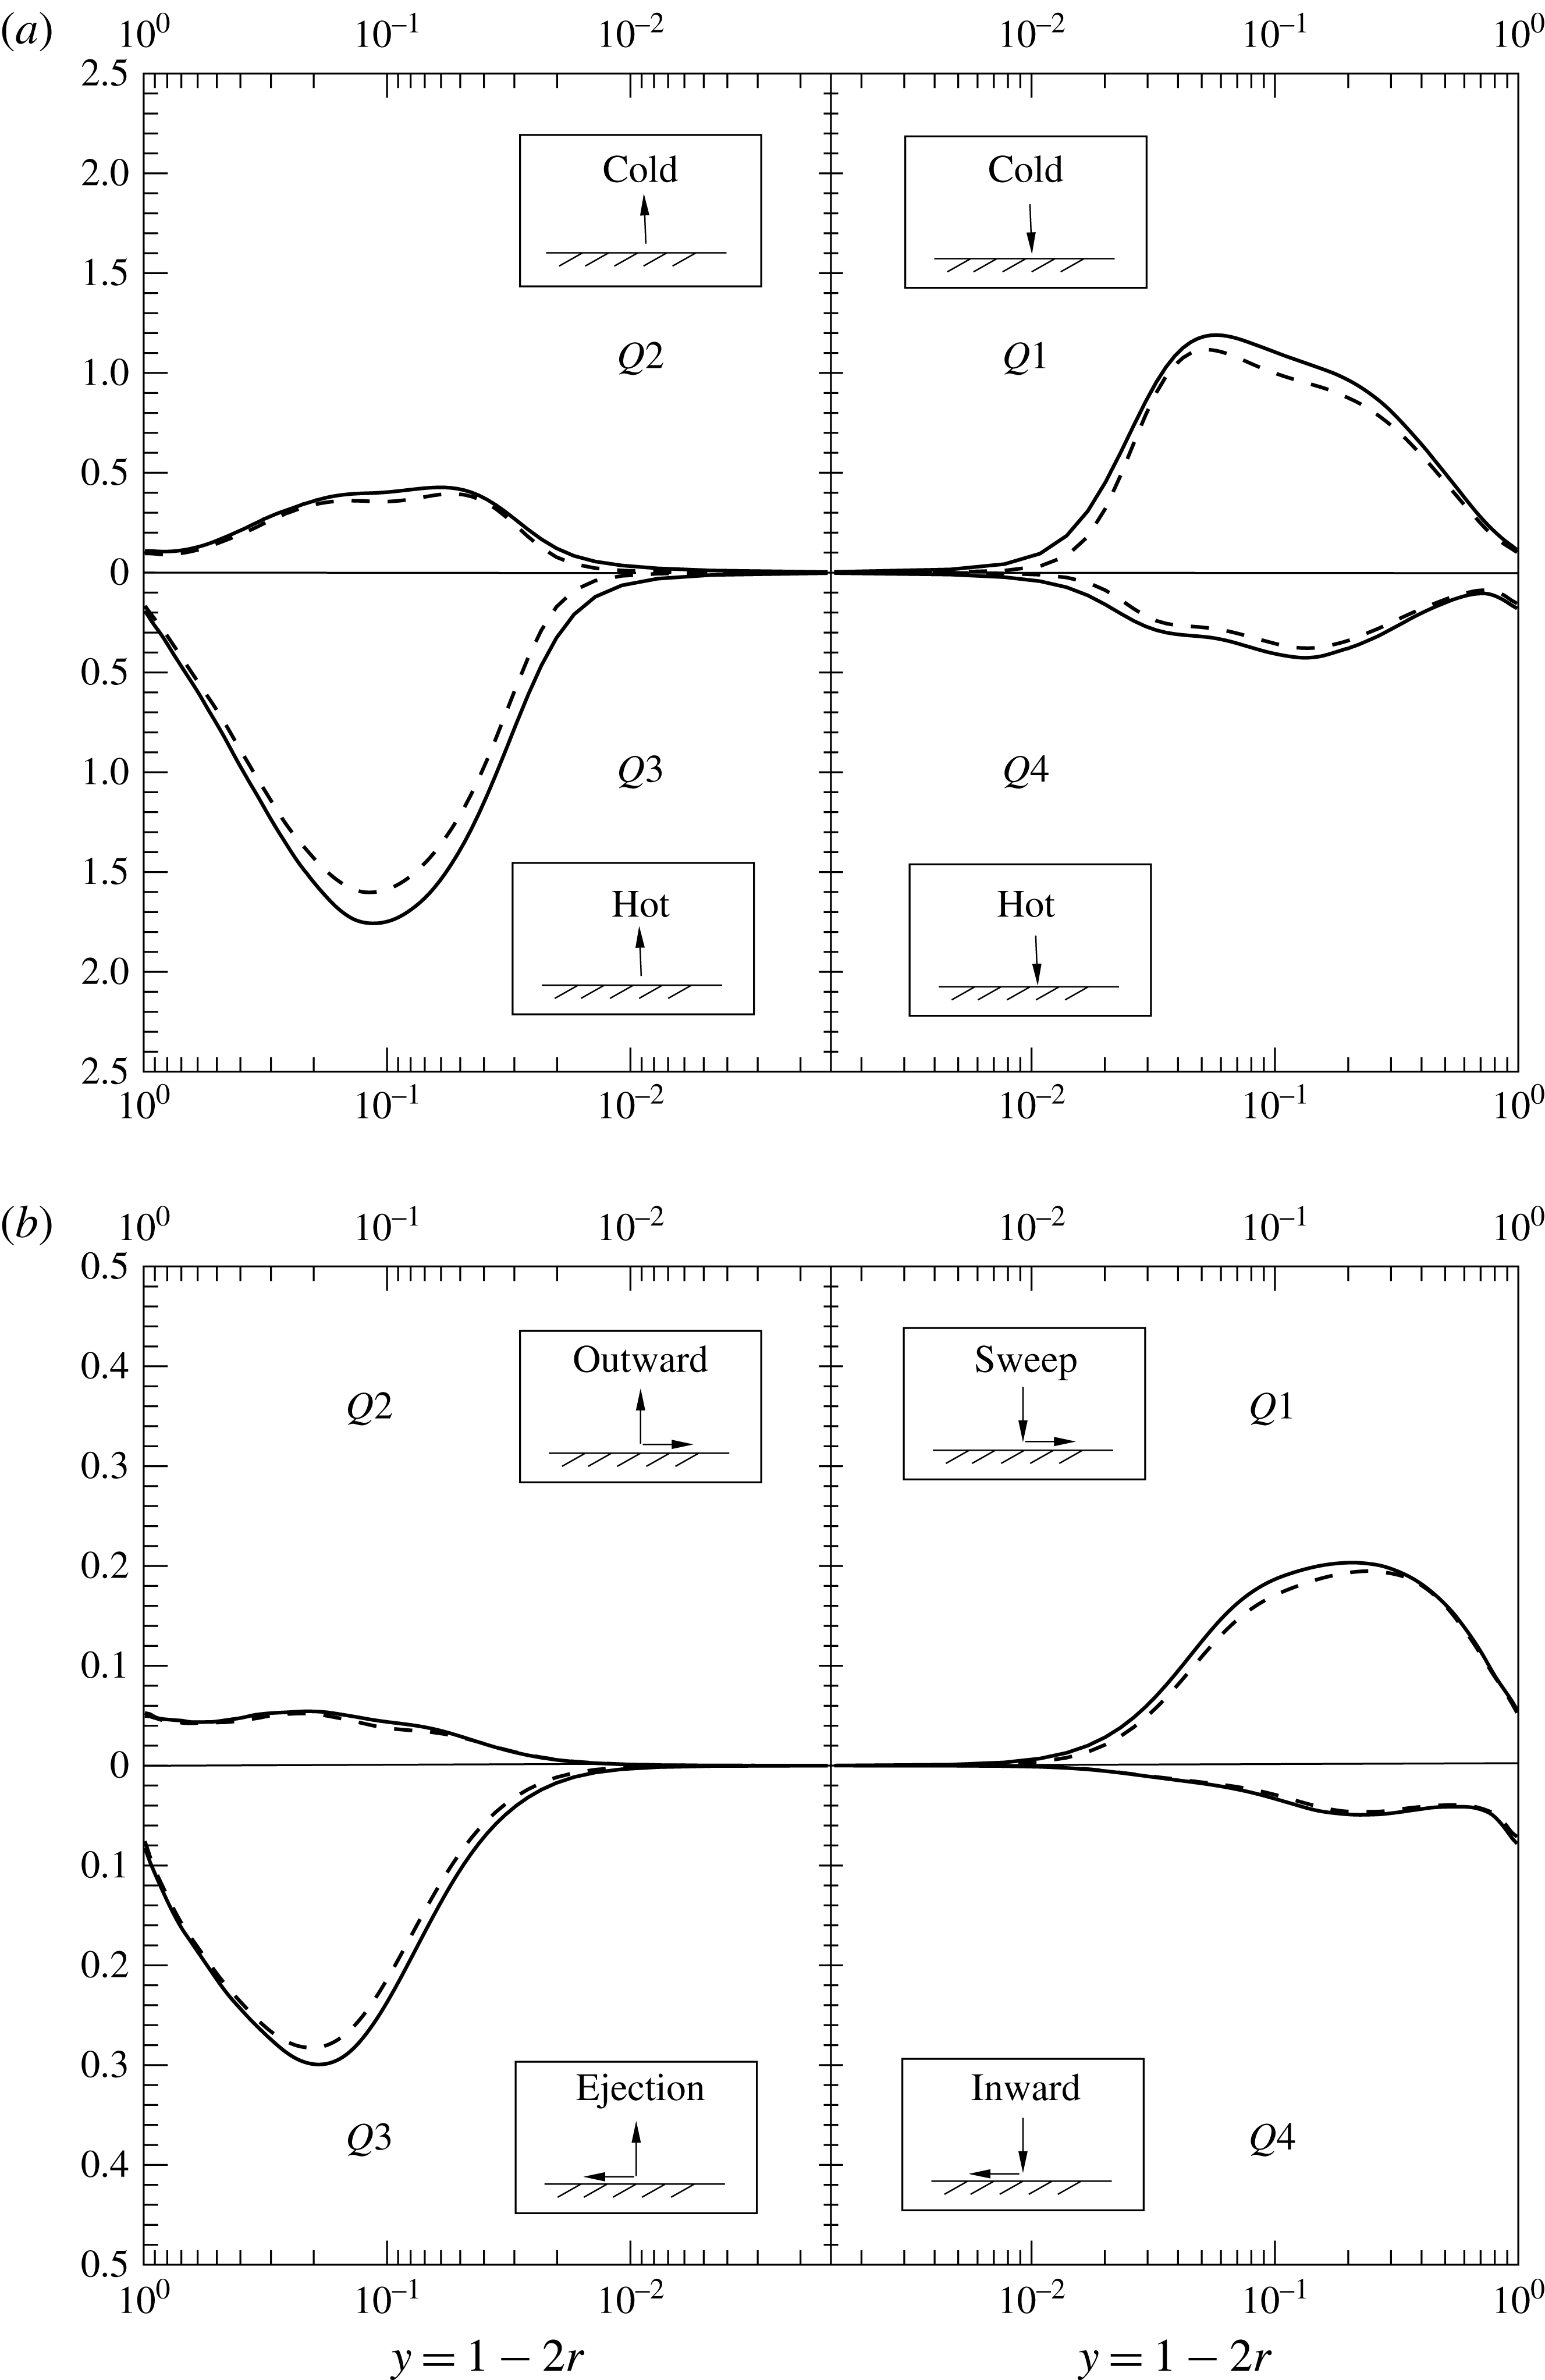
contains events of inward motions with low-speed hot fluids. Figure 11(a) shows the contributions from each quadrant to the radial turbulent heat flux
$Q4$
contains events of inward motions with low-speed hot fluids. Figure 11(a) shows the contributions from each quadrant to the radial turbulent heat flux
![]() $\overline{{\it\rho}u_{r}^{\prime \prime }h^{\prime \prime }}$
plotted as a function of wall-normal coordinate. In the case of non-fluctuating wall temperature (case
$\overline{{\it\rho}u_{r}^{\prime \prime }h^{\prime \prime }}$
plotted as a function of wall-normal coordinate. In the case of non-fluctuating wall temperature (case
![]() $\text{SC}_{K\rightarrow 0}$
), all contributions to the turbulent heat flux are attenuated. It can be seen that the
$\text{SC}_{K\rightarrow 0}$
), all contributions to the turbulent heat flux are attenuated. It can be seen that the
![]() $Q1$
and
$Q1$
and
![]() $Q3$
events, which have the largest contributions, are smaller for case
$Q3$
events, which have the largest contributions, are smaller for case
![]() $\text{SC}_{K\rightarrow 0}$
than for
$\text{SC}_{K\rightarrow 0}$
than for
![]() $\text{SC}_{K\rightarrow \infty }$
. In other words, for the case
$\text{SC}_{K\rightarrow \infty }$
. In other words, for the case
![]() $\text{SC}_{K\rightarrow 0}$
the hot fluid has less tendency to leave the wall, which consequently leads to the lower heat transfer.
$\text{SC}_{K\rightarrow 0}$
the hot fluid has less tendency to leave the wall, which consequently leads to the lower heat transfer.
The fractional contributions to the Reynolds shear stress
![]() $\overline{{\it\rho}u_{r}^{\prime \prime }u_{z}^{\prime \prime }}$
are shown in figure 11(b) for
$\overline{{\it\rho}u_{r}^{\prime \prime }u_{z}^{\prime \prime }}$
are shown in figure 11(b) for
![]() $\text{SC}_{K\rightarrow \infty }$
and
$\text{SC}_{K\rightarrow \infty }$
and
![]() $\text{SC}_{K\rightarrow 0}$
. Similar to the turbulent heat flux, all contributions to the Reynolds shear stress are decreased when the fluctuating wall temperature (
$\text{SC}_{K\rightarrow 0}$
. Similar to the turbulent heat flux, all contributions to the Reynolds shear stress are decreased when the fluctuating wall temperature (
![]() $\text{SC}_{K\rightarrow \infty }$
) is changed to the non-fluctuating wall temperature condition (
$\text{SC}_{K\rightarrow \infty }$
) is changed to the non-fluctuating wall temperature condition (
![]() $\text{SC}_{K\rightarrow 0}$
). Sweep
$\text{SC}_{K\rightarrow 0}$
). Sweep
![]() $Q1$
and ejection
$Q1$
and ejection
![]() $Q3$
events, which have positive contributions to the Reynolds shear stress, show the largest differences. Choi, Moin & Kim (Reference Choi, Moin and Kim1994) reported that reduction in
$Q3$
events, which have positive contributions to the Reynolds shear stress, show the largest differences. Choi, Moin & Kim (Reference Choi, Moin and Kim1994) reported that reduction in
![]() $Q1$
and
$Q1$
and
![]() $Q3$
events result in skin friction reduction.
$Q3$
events result in skin friction reduction.
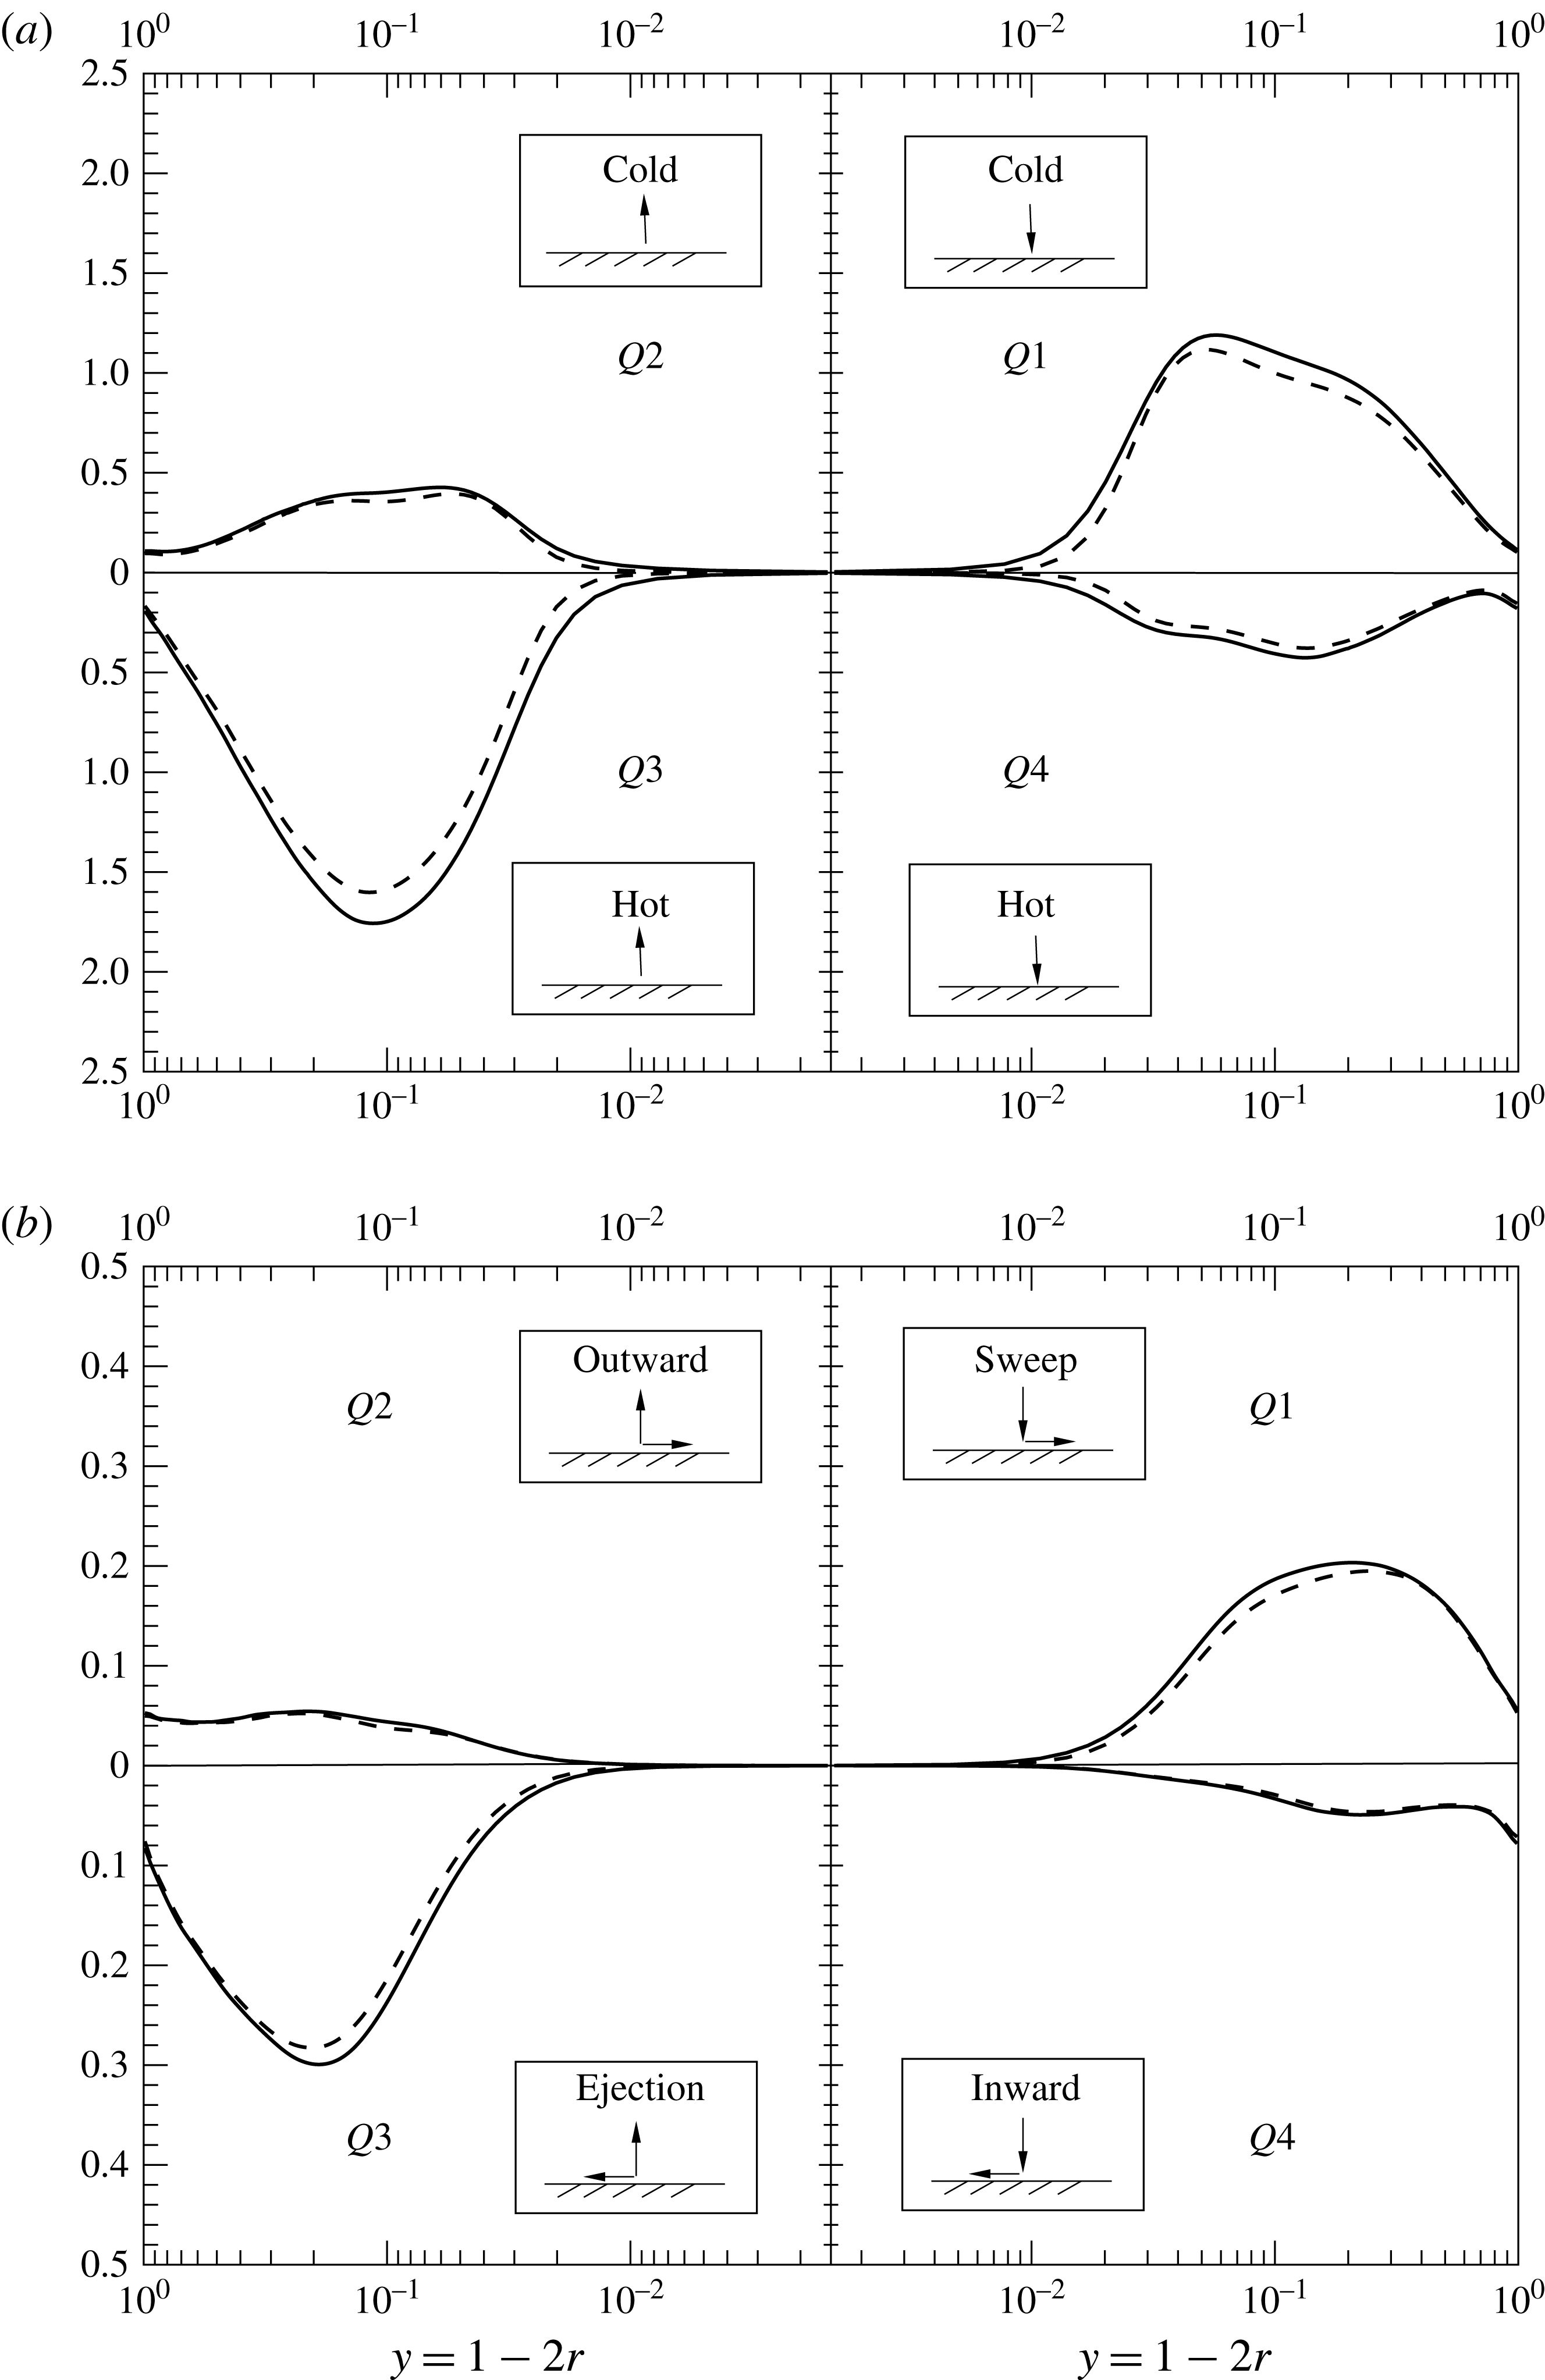
Figure 11. Fractional contribution to the (a) radial turbulent heat flux
![]() $\overline{{\it\rho}u_{r}^{\prime \prime }h^{\prime \prime }}$
and (b) Reynolds shear stress
$\overline{{\it\rho}u_{r}^{\prime \prime }h^{\prime \prime }}$
and (b) Reynolds shear stress
![]() $\overline{{\it\rho}u_{r}^{\prime \prime }u_{z}^{\prime \prime }}$
at
$\overline{{\it\rho}u_{r}^{\prime \prime }u_{z}^{\prime \prime }}$
at
![]() $z=15$
; (——)
$z=15$
; (——)
![]() $\text{SC}_{K\rightarrow \infty }$
, (– – –)
$\text{SC}_{K\rightarrow \infty }$
, (– – –)
![]() $\text{SC}_{K\rightarrow 0}$
.
$\text{SC}_{K\rightarrow 0}$
.
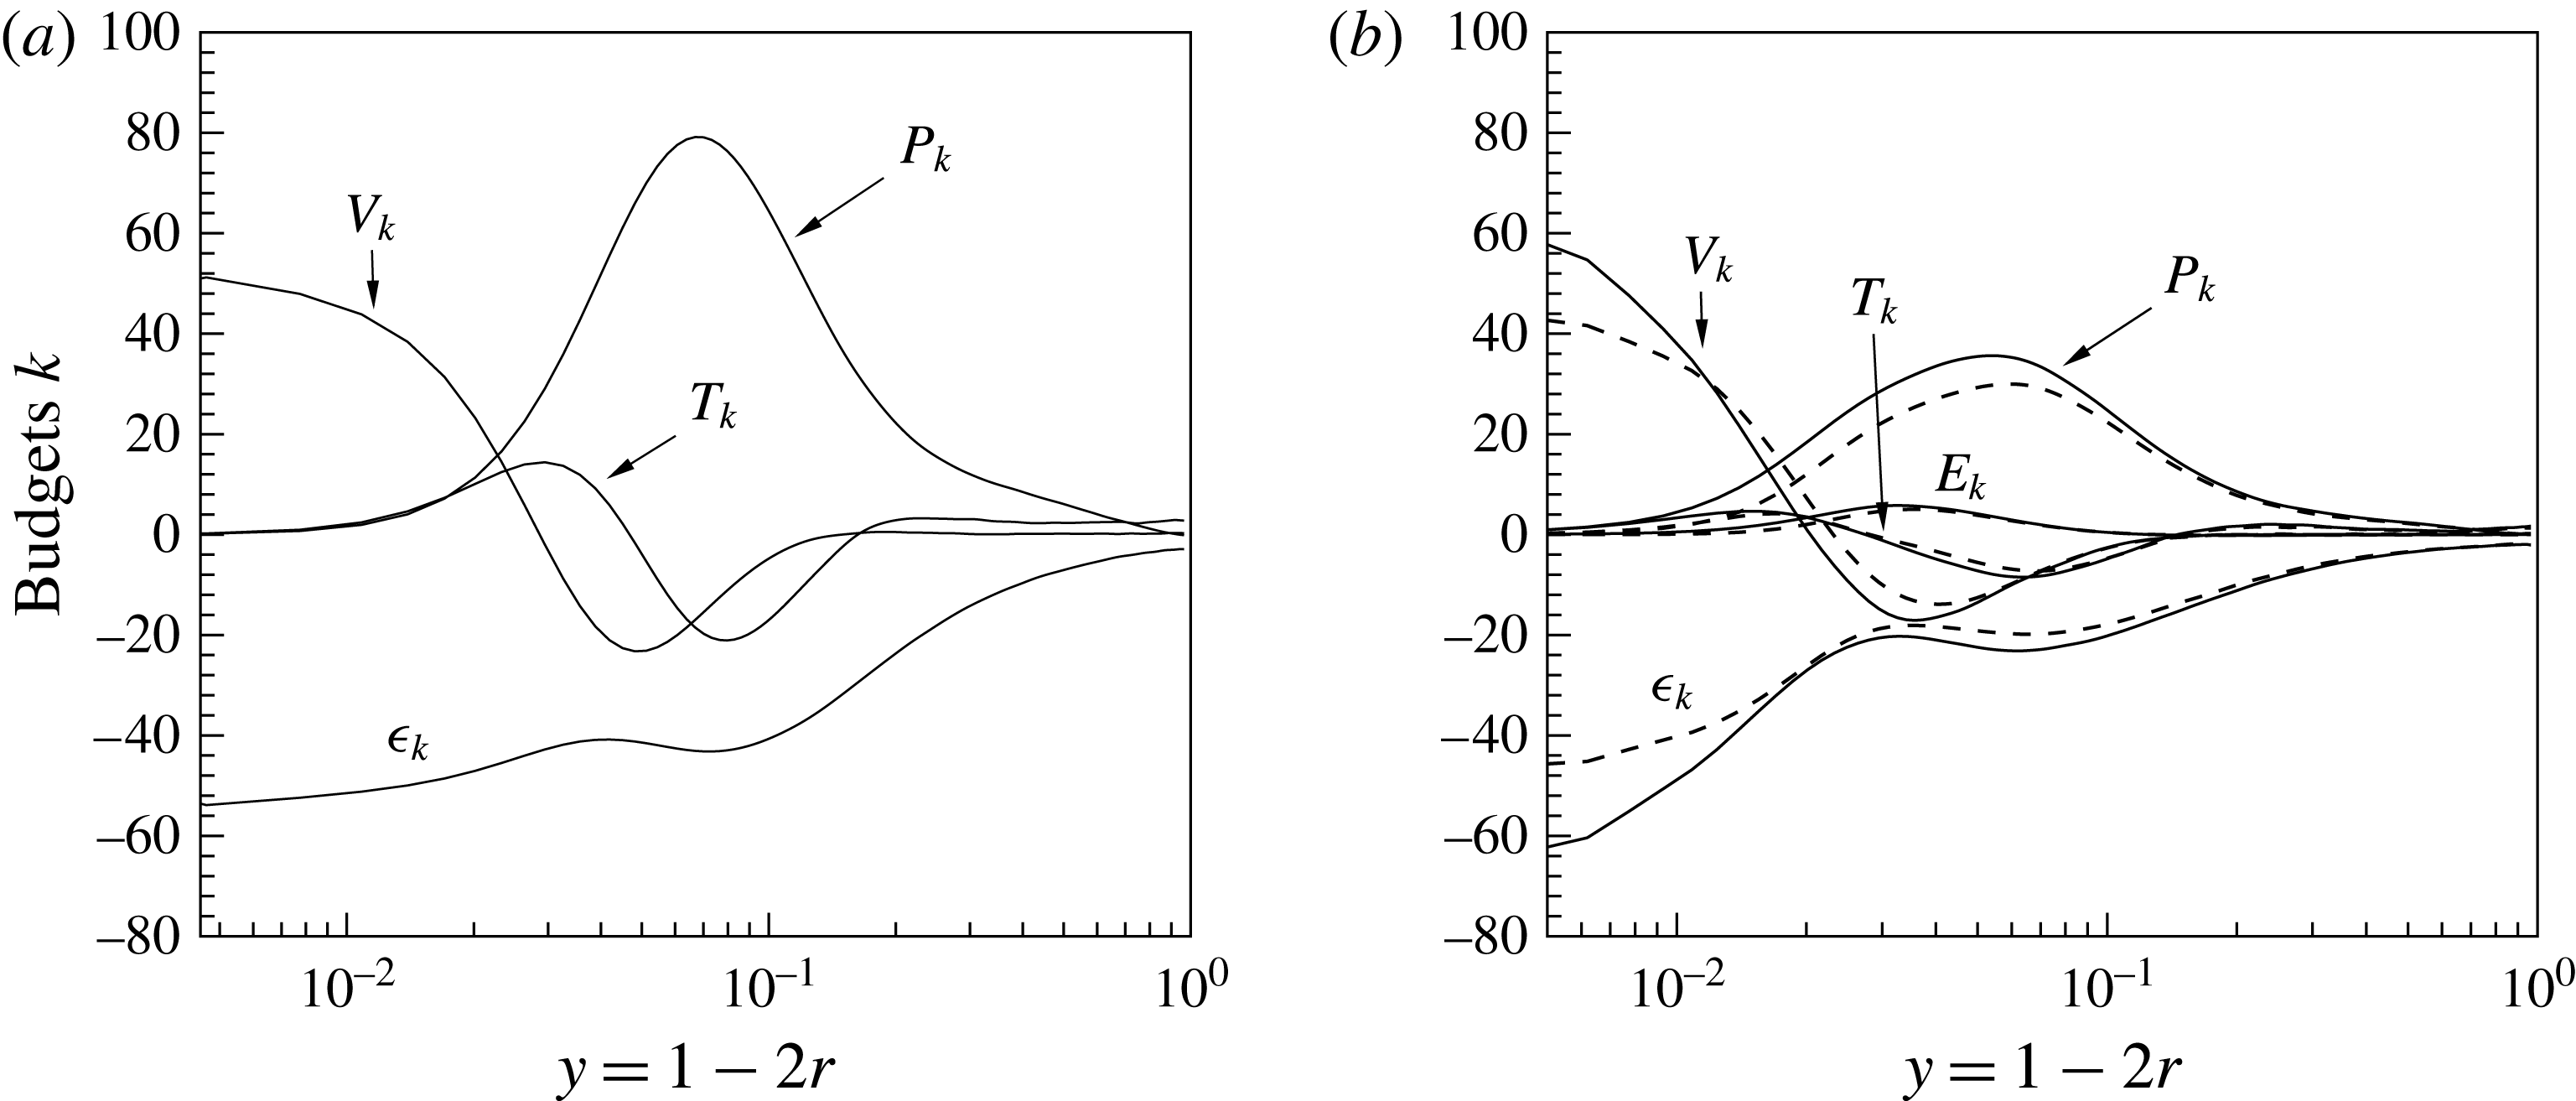
Figure 12. Turbulence kinetic energy
![]() $k=1/2\widetilde{u_{i}^{\prime \prime }u_{i}^{\prime \prime }}$
budgets at
$k=1/2\widetilde{u_{i}^{\prime \prime }u_{i}^{\prime \prime }}$
budgets at
![]() $z=15$
(a)
$z=15$
(a)
![]() $\text{CP}_{K\rightarrow \infty }$
(
$\text{CP}_{K\rightarrow \infty }$
(
![]() $\text{CP}_{K\rightarrow 0}$
), (b) (——)
$\text{CP}_{K\rightarrow 0}$
), (b) (——)
![]() $\text{SC}_{K\rightarrow \infty }$
and (– – –)
$\text{SC}_{K\rightarrow \infty }$
and (– – –)
![]() $\text{SC}_{K\rightarrow 0}$
. Note, the profiles for
$\text{SC}_{K\rightarrow 0}$
. Note, the profiles for
![]() $\text{CP}_{K\rightarrow \infty }$
(
$\text{CP}_{K\rightarrow \infty }$
(
![]() $\text{CP}_{K\rightarrow 0}$
) are equivalent to
$\text{CP}_{K\rightarrow 0}$
) are equivalent to
![]() $z=0$
for the SC cases.
$z=0$
for the SC cases.
5.4 Turbulence budgets
To study the effect of different enthalpy wall boundary conditions on the averaged transport equation for turbulence kinetic energy and wall-normal turbulent heat flux, their budgets are examined next. The evolution equation for the Favre-averaged turbulence kinetic energy is
![]() $k=1/2\widetilde{u_{i}^{\prime \prime }u_{i}^{\prime \prime }}$
can be written as follows (Huang, Coleman & Bradshaw Reference Huang, Coleman and Bradshaw1995):
$k=1/2\widetilde{u_{i}^{\prime \prime }u_{i}^{\prime \prime }}$
can be written as follows (Huang, Coleman & Bradshaw Reference Huang, Coleman and Bradshaw1995):
with
 $$\begin{eqnarray}\left.\begin{array}{@{}c@{}}\displaystyle C_{k}=\frac{\partial \overline{{\it\rho}}\tilde{u} _{j}k}{\partial x_{j}},\quad P_{k}=-\overline{{\it\rho}u_{i}^{\prime \prime }u_{j}^{\prime \prime }}\frac{\partial \tilde{u} _{j}}{\partial x_{i}},\quad T_{k}=-\frac{1}{2}\frac{\partial \overline{{\it\rho}u_{i}^{\prime \prime }u_{i}^{\prime \prime }u_{j}^{\prime \prime }}}{\partial x_{j}},\\ \displaystyle {\it\Pi}_{k}=-\frac{\partial \overline{p^{\prime }u_{j}^{\prime \prime }}}{\partial x_{j}},\quad {\it\Phi}_{k}=\overline{p^{\prime }\frac{\partial u_{j}^{\prime \prime }}{\partial x_{j}}},\quad V_{k}=\frac{1}{Re_{{\it\tau}0}}\frac{\partial \overline{{\it\tau}_{ij}^{\prime }u_{i}^{\prime \prime }}}{\partial x_{j}},\\ \displaystyle {\it\epsilon}_{k}=-\frac{1}{Re_{{\it\tau}0}}\overline{{\it\tau}_{ij}^{\prime }\frac{\partial u_{i}^{\prime \prime }}{\partial x_{j}}},\quad E_{k}^{(1)}=\overline{u_{i}^{\prime \prime }}\frac{1}{Re_{{\it\tau}0}}\frac{\partial \overline{{\it\tau}}_{ij}}{\partial x_{j}},\quad E_{k}^{(2)}=-\overline{u_{i}^{\prime \prime }}\frac{\partial \overline{p}}{\partial x_{i}},\end{array}\right\}\end{eqnarray}$$
where
The terms in (5.7) are mean convection
![]() $C_{k}$
, turbulence production
$C_{k}$
, turbulence production
![]() $P_{k}$
, turbulence diffusion
$P_{k}$
, turbulence diffusion
![]() $T_{k}$
, pressure diffusion
$T_{k}$
, pressure diffusion
![]() ${\it\Pi}_{k}$
, pressure dilatation
${\it\Pi}_{k}$
, pressure dilatation
![]() ${\it\Phi}_{k}$
, viscous diffusion of turbulence kinetic energy
${\it\Phi}_{k}$
, viscous diffusion of turbulence kinetic energy
![]() $V_{k}$
, turbulence dissipation
$V_{k}$
, turbulence dissipation
![]() ${\it\epsilon}_{k}$
and
${\it\epsilon}_{k}$
and
![]() $E_{k}^{(l)}(l=1,2)$
are additional terms due to density and velocity fluctuations. These terms are referred to as additional correlations and result from turbulent fluctuations that are responsible for energy exchange between mean and turbulence kinetic energy (see Huang et al.
Reference Huang, Coleman and Bradshaw1995). Emphasis is given to
$E_{k}^{(l)}(l=1,2)$
are additional terms due to density and velocity fluctuations. These terms are referred to as additional correlations and result from turbulent fluctuations that are responsible for energy exchange between mean and turbulence kinetic energy (see Huang et al.
Reference Huang, Coleman and Bradshaw1995). Emphasis is given to
![]() $P_{k}$
,
$P_{k}$
,
![]() $T_{k}$
,
$T_{k}$
,
![]() $V_{k}$
,
$V_{k}$
,
![]() ${\it\epsilon}_{k}$
and
${\it\epsilon}_{k}$
and
![]() $E_{k}=\sum _{l=1}^{2}E_{k}^{(l)}$
and their profiles are shown in figure 12 for all cases at
$E_{k}=\sum _{l=1}^{2}E_{k}^{(l)}$
and their profiles are shown in figure 12 for all cases at
![]() $z=15$
. Note, the budgets for the constant property cases shown in figure 12(a) do not change in the streamwise direction, since the energy equation is a passive scalar and the velocity field is unaffected by the heat transfer. Thus, the profiles in figure 12(a) also correspond to the inlet condition for the supercritical cases as shown in figure 12(b).
$z=15$
. Note, the budgets for the constant property cases shown in figure 12(a) do not change in the streamwise direction, since the energy equation is a passive scalar and the velocity field is unaffected by the heat transfer. Thus, the profiles in figure 12(a) also correspond to the inlet condition for the supercritical cases as shown in figure 12(b).
As discussed in our previous work (Nemati et al.
Reference Nemati, Patel, Boersma and Pecnik2015), flow acceleration due to thermal expansion causes a decrease in turbulence for the supercritical cases. The production rate in figure 12(b) is substantially lower than for the constant property case in figure 12(a). The turbulence dissipation also shows a reduction for both supercritical cases, except for
![]() $\text{SC}_{K\rightarrow \infty }$
very close to the wall. An equivalent effect has been observed in Zonta et al. (Reference Zonta, Marchioli and Soldati2012), where they studied the effect of viscosity variations on turbulence statistics in fully developed channel flows. They observed that on the hot side of the channel (low viscosity) the turbulent dissipation decreases above the viscous sublayer, but increases between the viscous sublayer and the wall. The turbulent diffusion
$\text{SC}_{K\rightarrow \infty }$
very close to the wall. An equivalent effect has been observed in Zonta et al. (Reference Zonta, Marchioli and Soldati2012), where they studied the effect of viscosity variations on turbulence statistics in fully developed channel flows. They observed that on the hot side of the channel (low viscosity) the turbulent dissipation decreases above the viscous sublayer, but increases between the viscous sublayer and the wall. The turbulent diffusion
![]() $T_{k}$
is reduced due to the reduction in turbulence caused by flow acceleration and thermal expansion.
$T_{k}$
is reduced due to the reduction in turbulence caused by flow acceleration and thermal expansion.
With respect to the different boundary conditions, it can be seen that the turbulence production
![]() $P_{k}$
experiences a larger reduction for the non-fluctuating wall enthalpy case
$P_{k}$
experiences a larger reduction for the non-fluctuating wall enthalpy case
![]() $\text{SC}_{K\rightarrow 0}$
as compared to
$\text{SC}_{K\rightarrow 0}$
as compared to
![]() $\text{SC}_{K\rightarrow \infty }$
. This can be further analysed by expanding
$\text{SC}_{K\rightarrow \infty }$
. This can be further analysed by expanding
![]() $P_{k}$
, in cylindrical coordinates, to
$P_{k}$
, in cylindrical coordinates, to
The product of Reynolds shear stress and streamwise velocity gradient is the dominant source of turbulence kinetic energy production (fourth term in (5.9)). Based on the results discussed in § 5.2, the higher
![]() $P_{k}$
in
$P_{k}$
in
![]() $\text{SC}_{K\rightarrow \infty }$
can thus be explained by the higher Reynolds shear stress
$\text{SC}_{K\rightarrow \infty }$
can thus be explained by the higher Reynolds shear stress
![]() $\overline{{\it\rho}u_{r}^{\prime \prime }u_{z}^{\prime \prime }}$
(figure 10
c), since the streamwise velocity gradient shows only small differences in the near-wall region (figure 7
b). The turbulence dissipation in
$\overline{{\it\rho}u_{r}^{\prime \prime }u_{z}^{\prime \prime }}$
(figure 10
c), since the streamwise velocity gradient shows only small differences in the near-wall region (figure 7
b). The turbulence dissipation in
![]() $\text{SC}_{K\rightarrow 0}$
is slightly smaller over the entire cross-section of the pipe, than it is for
$\text{SC}_{K\rightarrow 0}$
is slightly smaller over the entire cross-section of the pipe, than it is for
![]() $\text{SC}_{K\rightarrow \infty }$
, but larger differences are observed very close to the wall. This is a direct consequence of the higher gradients in velocity fluctuations for case
$\text{SC}_{K\rightarrow \infty }$
, but larger differences are observed very close to the wall. This is a direct consequence of the higher gradients in velocity fluctuations for case
![]() $\text{SC}_{K\rightarrow \infty }$
. The larger dissipation in the near-wall region is balanced with a higher energy transfer due to viscous diffusion in the near-wall region for case
$\text{SC}_{K\rightarrow \infty }$
. The larger dissipation in the near-wall region is balanced with a higher energy transfer due to viscous diffusion in the near-wall region for case
![]() $\text{SC}_{K\rightarrow \infty }$
. The turbulence diffusion
$\text{SC}_{K\rightarrow \infty }$
. The turbulence diffusion
![]() $T_{k}$
, and the additional terms are less affected by the thermal boundary condition. As can be seen, the additional terms
$T_{k}$
, and the additional terms are less affected by the thermal boundary condition. As can be seen, the additional terms
![]() $E_{k}^{(1)}$
and
$E_{k}^{(1)}$
and
![]() $E_{k}^{(2)}$
contribute to the production and sink of turbulence kinetic energy, respectively. Figure 13 shows the largest components of
$E_{k}^{(2)}$
contribute to the production and sink of turbulence kinetic energy, respectively. Figure 13 shows the largest components of
![]() $E_{k}^{(1)}$
and
$E_{k}^{(1)}$
and
![]() $E_{k}^{(2)}$
at
$E_{k}^{(2)}$
at
![]() $z=15$
for
$z=15$
for
![]() $\text{SC}_{K\rightarrow \infty }$
and
$\text{SC}_{K\rightarrow \infty }$
and
![]() $\text{SC}_{K\rightarrow 0}$
. The term
$\text{SC}_{K\rightarrow 0}$
. The term
![]() $\overline{u_{z}^{\prime \prime }}(\partial r\overline{{\it\tau}}_{rz}/r\partial r)/Re_{{\it\tau}0}$
(part of
$\overline{u_{z}^{\prime \prime }}(\partial r\overline{{\it\tau}}_{rz}/r\partial r)/Re_{{\it\tau}0}$
(part of
![]() $E_{k}^{(1)}$
) corresponds to a source (energy is received from the mean flow), whereas the term
$E_{k}^{(1)}$
) corresponds to a source (energy is received from the mean flow), whereas the term
![]() $-\overline{u_{z}^{\prime \prime }}\partial \overline{p}/\partial z$
(part of
$-\overline{u_{z}^{\prime \prime }}\partial \overline{p}/\partial z$
(part of
![]() $E_{k}^{(2)}$
) corresponds to a sink (energy is transferred to the mean flow) of turbulent kinetic energy. Comparing these two additional terms for the cases
$E_{k}^{(2)}$
) corresponds to a sink (energy is transferred to the mean flow) of turbulent kinetic energy. Comparing these two additional terms for the cases
![]() $\text{SC}_{K\rightarrow \infty }$
and
$\text{SC}_{K\rightarrow \infty }$
and
![]() $\text{SC}_{K\rightarrow 0}$
, it is possible to observe a reduction in magnitude for
$\text{SC}_{K\rightarrow 0}$
, it is possible to observe a reduction in magnitude for
![]() $\text{SC}_{K\rightarrow 0}$
that stems from the difference in streamwise velocity fluctuations (see figure 10
b) in the near-wall region.
$\text{SC}_{K\rightarrow 0}$
that stems from the difference in streamwise velocity fluctuations (see figure 10
b) in the near-wall region.
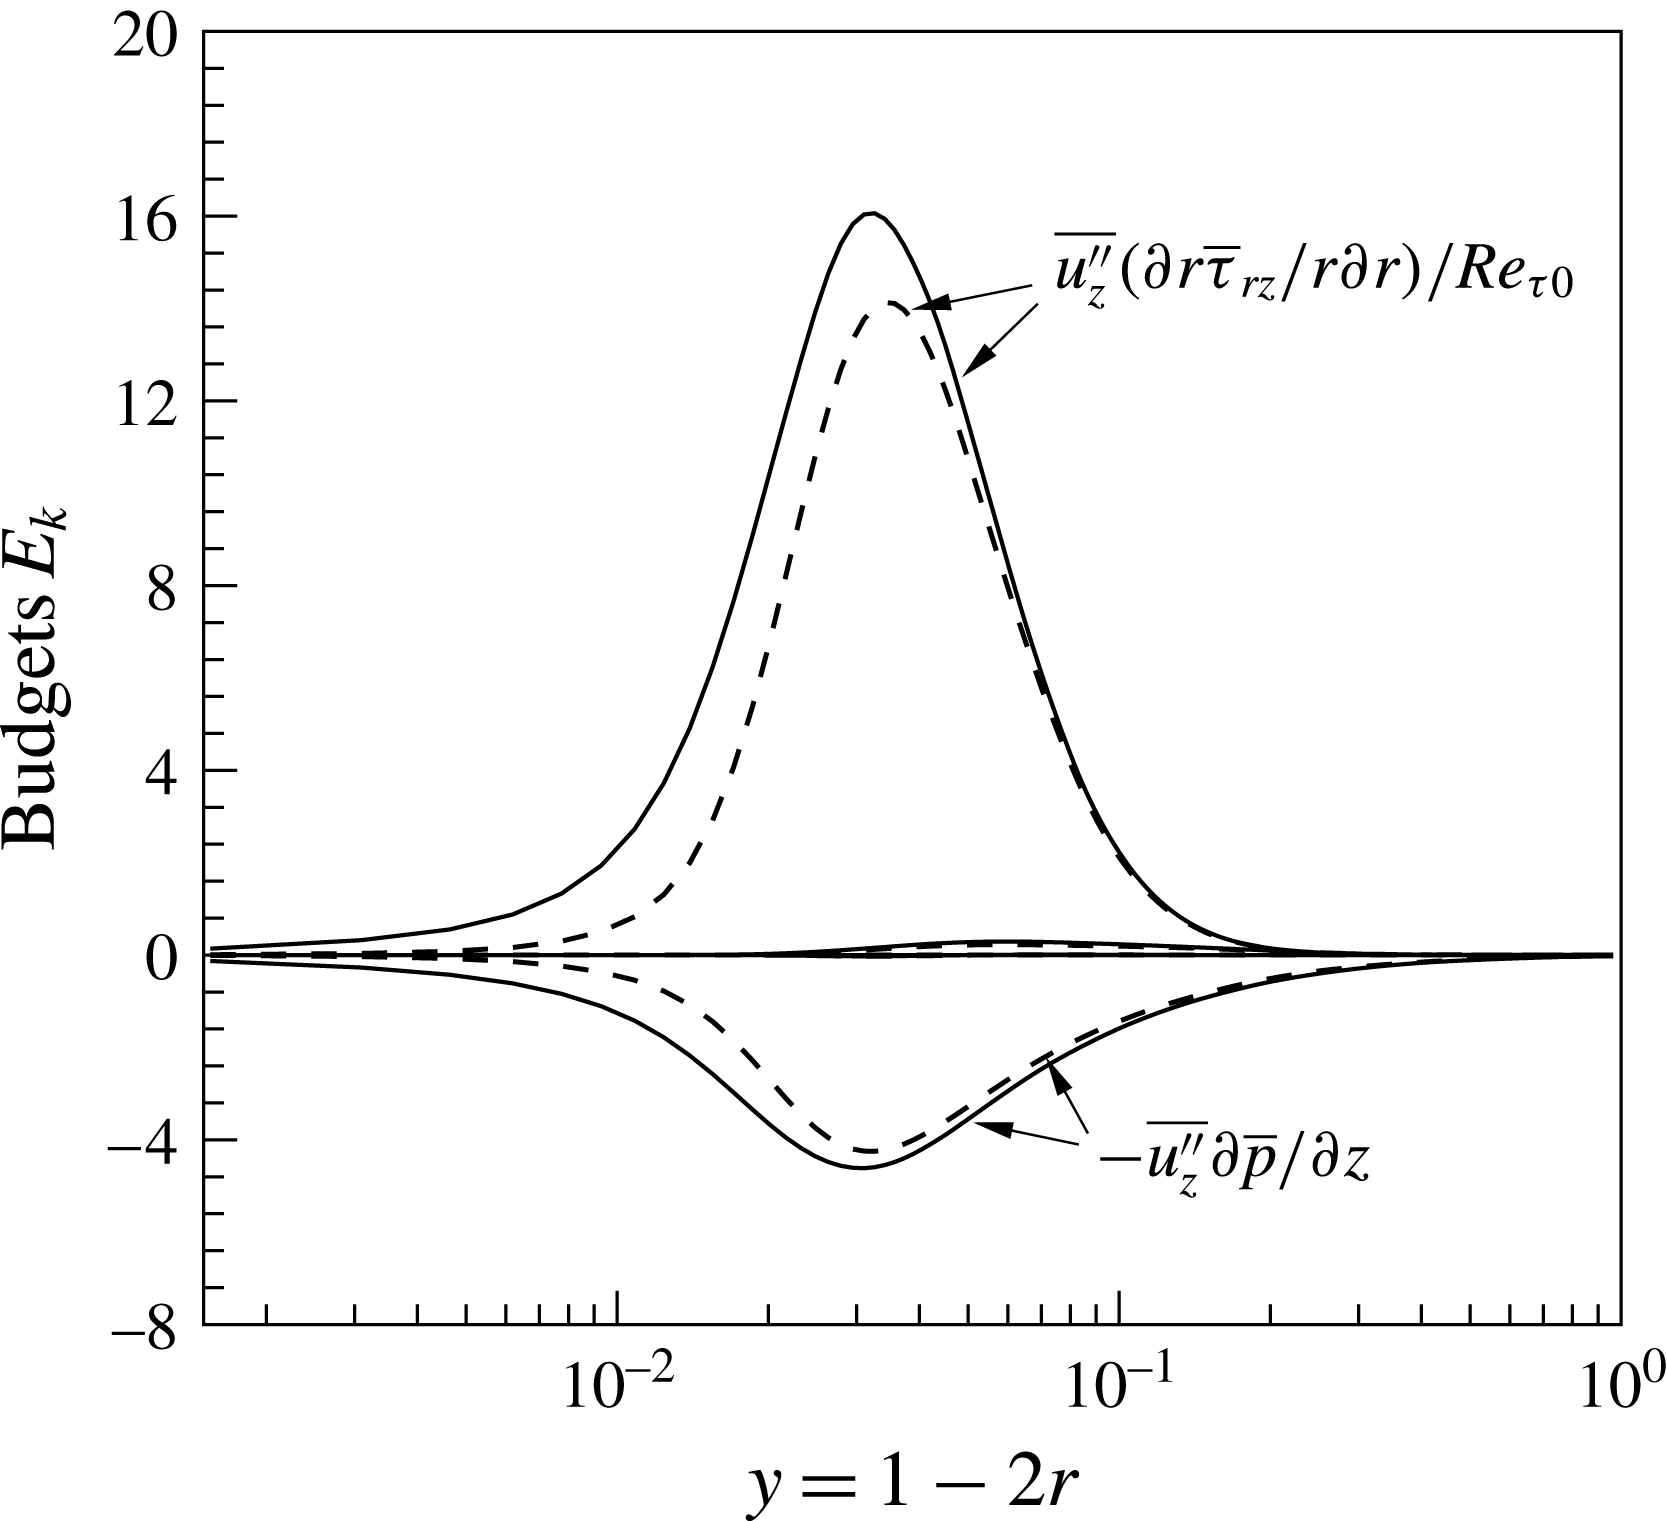
Figure 13. Largest components of
![]() $E_{k}^{(1)}$
and
$E_{k}^{(1)}$
and
![]() $E_{k}^{(2)}$
; (——)
$E_{k}^{(2)}$
; (——)
![]() $\text{SC}_{K\rightarrow \infty }$
, (– – –)
$\text{SC}_{K\rightarrow \infty }$
, (– – –)
![]() $\text{SC}_{K\rightarrow 0}$
.
$\text{SC}_{K\rightarrow 0}$
.
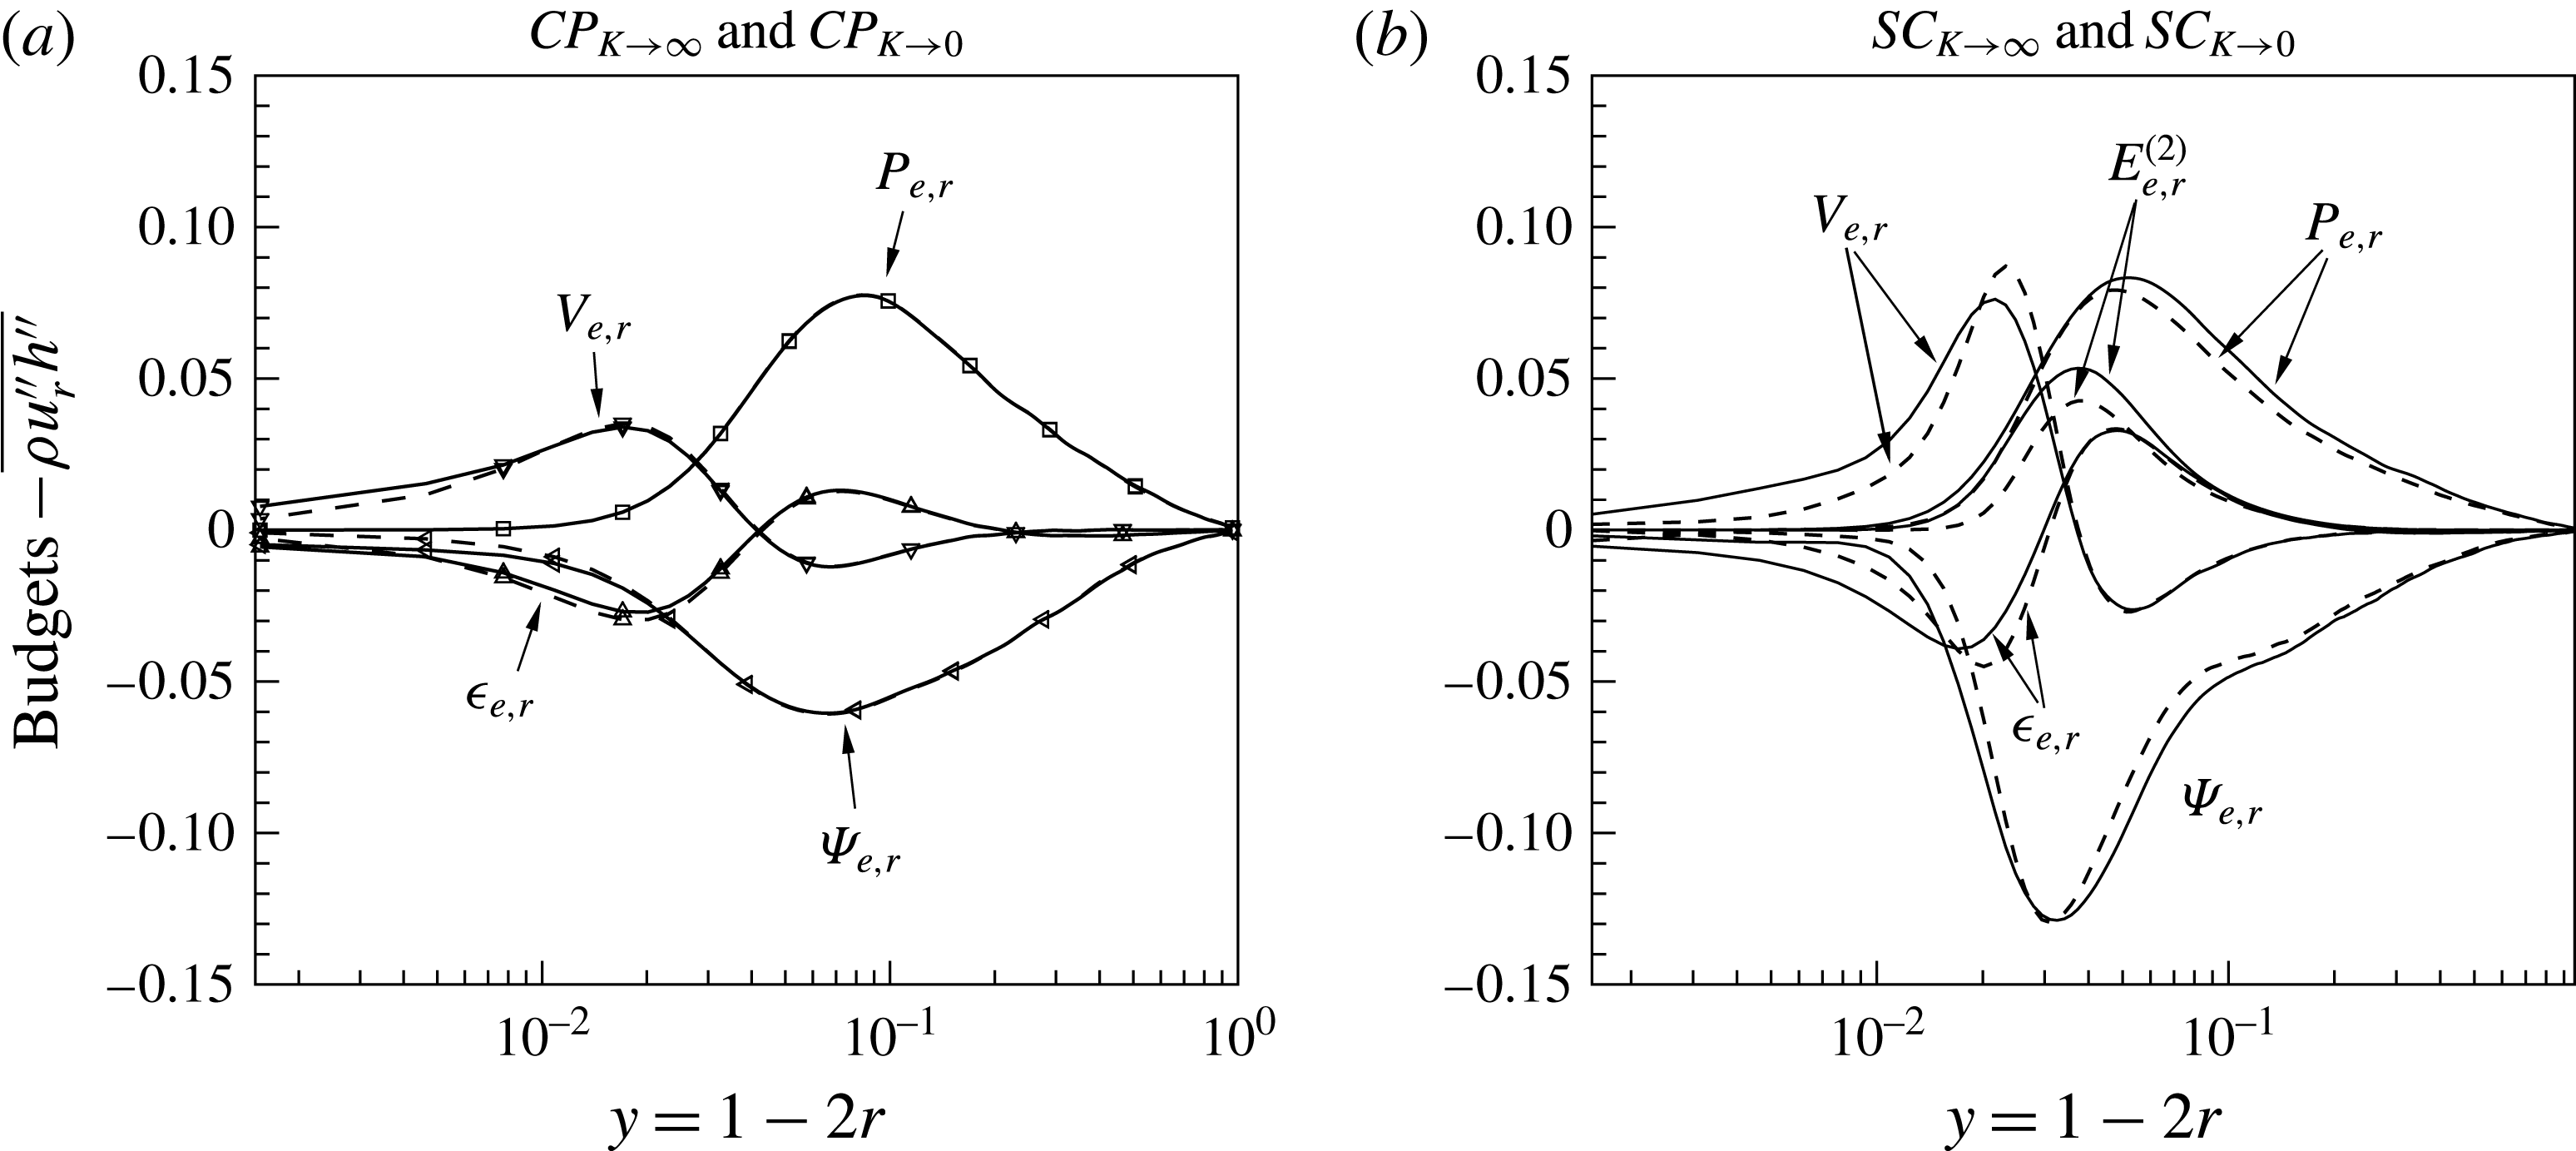
Figure 14. Wall-normal turbulent heat flux
![]() $-\overline{{\it\rho}u_{r}^{\prime \prime }h^{\prime \prime }}$
budgets at
$-\overline{{\it\rho}u_{r}^{\prime \prime }h^{\prime \prime }}$
budgets at
![]() $z=15$
, (——)
$z=15$
, (——)
![]() $\text{SC}_{K\rightarrow \infty }$
and
$\text{SC}_{K\rightarrow \infty }$
and
![]() $\text{CP}_{K\rightarrow \infty }$
, (– – –)
$\text{CP}_{K\rightarrow \infty }$
, (– – –)
![]() $\text{SC}_{K\rightarrow 0}$
and
$\text{SC}_{K\rightarrow 0}$
and
![]() $\text{CP}_{K\rightarrow 0}$
.
$\text{CP}_{K\rightarrow 0}$
.
Similar to the turbulence kinetic energy, an evolution equation for the Favre-averaged turbulent heat flux can be formulated as:
with
 $$\begin{eqnarray}\left.\begin{array}{@{}c@{}}\displaystyle C_{e,i}=\frac{\partial \tilde{u} _{j}\overline{{\it\rho}u_{i}^{\prime \prime }h^{\prime \prime }}}{\partial x_{j}},\quad P_{e,i}=-\overline{{\it\rho}u_{j}^{\prime \prime }h^{\prime \prime }}\frac{\partial \tilde{u} _{i}}{\partial x_{j}}-\overline{{\it\rho}u_{i}^{\prime \prime }u_{j}^{\prime \prime }}\frac{\partial \tilde{h}}{\partial x_{j}},\quad T_{e,i}=-\frac{\partial \overline{{\it\rho}u_{i}^{\prime \prime }u_{j}^{\prime \prime }h^{\prime \prime }}}{\partial x_{j}},\\ \displaystyle {\it\Psi}_{e,i}=-\overline{h^{\prime \prime }\frac{\partial p^{\prime }}{\partial x_{i}}},\quad V_{e,i}=\frac{1}{Re_{{\it\tau}0}}\frac{\partial \overline{{\it\tau}_{ij}^{\prime }h^{\prime \prime }}}{\partial x_{j}}+\frac{1}{Re_{{\it\tau}0}Pr_{0}}\frac{\partial \overline{q_{j}^{\prime }u_{i}^{\prime \prime }}}{\partial x_{j}},\\ \displaystyle {\it\epsilon}_{e,i}=-\frac{1}{Re_{{\it\tau}0}}\overline{{\it\tau}_{ij}^{\prime }\frac{\partial h^{\prime \prime }}{\partial x_{j}}}-\frac{1}{Re_{{\it\tau}0}Pr_{0}}\overline{q_{j}^{\prime }\frac{\partial u_{i}^{\prime \prime }}{\partial x_{j}}},\\ \displaystyle E_{e,i}^{(1)}=\overline{h^{\prime \prime }}\left(\frac{1}{Re_{{\it\tau}0}}\frac{\partial \overline{{\it\tau}}_{ij}}{\partial x_{j}}-\frac{\partial \overline{p}}{\partial x_{i}}\right),\quad E_{e,i}^{(2)}=\frac{1}{Re_{{\it\tau}0}Pr_{0}}\overline{u_{i}^{\prime \prime }}\frac{\partial \overline{q}_{j}}{\partial x_{j}},\end{array}\right\}\end{eqnarray}$$
where
Here the terms are mean convection
![]() $C_{e,i}$
, production
$C_{e,i}$
, production
![]() $P_{e,i}$
, turbulence diffusion
$P_{e,i}$
, turbulence diffusion
![]() $T_{e,i}$
, enthalpy–pressure-gradient correlation
$T_{e,i}$
, enthalpy–pressure-gradient correlation
![]() ${\it\Psi}_{e,i}$
, molecular diffusion
${\it\Psi}_{e,i}$
, molecular diffusion
![]() $V_{e,i}$
, dissipation of turbulent heat flux
$V_{e,i}$
, dissipation of turbulent heat flux
![]() ${\it\epsilon}_{e,i}$
and
${\it\epsilon}_{e,i}$
and
![]() $E_{e,i}^{(l)}(l=1,2)$
are additional terms that stem from density, velocity and enthalpy fluctuations. Figure 14 shows profiles of
$E_{e,i}^{(l)}(l=1,2)$
are additional terms that stem from density, velocity and enthalpy fluctuations. Figure 14 shows profiles of
![]() $P_{e,r}$
,
$P_{e,r}$
,
![]() ${\it\Psi}_{e,r}$
,
${\it\Psi}_{e,r}$
,
![]() $V_{e,r}$
,
$V_{e,r}$
,
![]() ${\it\epsilon}_{e,r}$
and
${\it\epsilon}_{e,r}$
and
![]() $E_{e,r}^{(2)}$
(remaining terms are insignificant) for the constant property and the supercritical pressure cases with different wall enthalpy boundary conditions at
$E_{e,r}^{(2)}$
(remaining terms are insignificant) for the constant property and the supercritical pressure cases with different wall enthalpy boundary conditions at
![]() $z=15$
. It is evident from figure 14(a) that the budgets for the constant property cases with different boundary conditions collapse over a wide range. Only minor differences between
$z=15$
. It is evident from figure 14(a) that the budgets for the constant property cases with different boundary conditions collapse over a wide range. Only minor differences between
![]() $\text{CP}_{K\rightarrow \infty }$
and
$\text{CP}_{K\rightarrow \infty }$
and
![]() $\text{CP}_{K\rightarrow 0}$
appear for the dissipation
$\text{CP}_{K\rightarrow 0}$
appear for the dissipation
![]() ${\it\epsilon}_{e,r}$
, viscous diffusion
${\it\epsilon}_{e,r}$
, viscous diffusion
![]() $V_{e,r}$
and enthalpy–pressure-gradient correlation
$V_{e,r}$
and enthalpy–pressure-gradient correlation
![]() ${\it\Psi}_{e,r}$
very close to the wall. This is due to the wall enthalpy fluctuations in case
${\it\Psi}_{e,r}$
very close to the wall. This is due to the wall enthalpy fluctuations in case
![]() $\text{CP}_{K\rightarrow \infty }$
. The production
$\text{CP}_{K\rightarrow \infty }$
. The production
![]() $P_{e,r}$
does not change, because it contains products of turbulent heat flux and velocity gradients, and turbulent stresses and enthalpy gradients, see (5.11). Because none of these terms change (see figures 7
a and 9
a) with respect to thermal boundary conditions, also
$P_{e,r}$
does not change, because it contains products of turbulent heat flux and velocity gradients, and turbulent stresses and enthalpy gradients, see (5.11). Because none of these terms change (see figures 7
a and 9
a) with respect to thermal boundary conditions, also
![]() $P_{e,r}$
is unaffected. The terms
$P_{e,r}$
is unaffected. The terms
![]() ${\it\epsilon}_{e,r}$
,
${\it\epsilon}_{e,r}$
,
![]() $V_{e,r}$
and
$V_{e,r}$
and
![]() ${\it\Psi}_{e,r}$
contain products of
${\it\Psi}_{e,r}$
contain products of
![]() $h^{\prime \prime }$
with velocity and pressure gradients. Because,
$h^{\prime \prime }$
with velocity and pressure gradients. Because,
![]() $h^{\prime \prime }$
is affected by the thermal boundary conditions, also
$h^{\prime \prime }$
is affected by the thermal boundary conditions, also
![]() ${\it\epsilon}_{e,r}$
,
${\it\epsilon}_{e,r}$
,
![]() $V_{e,r}$
and
$V_{e,r}$
and
![]() ${\it\Psi}_{e,r}$
change.
${\it\Psi}_{e,r}$
change.
If the constant property and the supercritical fluid cases are compared, it can be seen that, although the production
![]() $P_{e,r}$
of the turbulent heat flux are nearly the same for both fluids, the main destruction
$P_{e,r}$
of the turbulent heat flux are nearly the same for both fluids, the main destruction
![]() ${\it\Psi}_{e,r}$
substantially differs. For the supercritical fluid cases
${\it\Psi}_{e,r}$
substantially differs. For the supercritical fluid cases
![]() $\text{SC}_{K\rightarrow \infty }$
and
$\text{SC}_{K\rightarrow \infty }$
and
![]() $\text{SC}_{K\rightarrow 0}$
the enthalpy–pressure-gradient correlation
$\text{SC}_{K\rightarrow 0}$
the enthalpy–pressure-gradient correlation
![]() ${\it\Psi}_{e,r}$
is mainly balanced by
${\it\Psi}_{e,r}$
is mainly balanced by
![]() $P_{e,r}$
and the additional term
$P_{e,r}$
and the additional term
![]() $E_{e,r}^{(2)}$
, which is a source of turbulent heat flux that only appears for the supercritical fluid cases. Unlike for the constant property cases shown in figure 14(a), the effect of thermal wall boundary conditions on the turbulent heat flux budgets is larger for the variable property cases in figure 14(b). Similar to the turbulence kinetic energy budgets, the production for case
$E_{e,r}^{(2)}$
, which is a source of turbulent heat flux that only appears for the supercritical fluid cases. Unlike for the constant property cases shown in figure 14(a), the effect of thermal wall boundary conditions on the turbulent heat flux budgets is larger for the variable property cases in figure 14(b). Similar to the turbulence kinetic energy budgets, the production for case
![]() $\text{SC}_{K\rightarrow \infty }$
is larger than for
$\text{SC}_{K\rightarrow \infty }$
is larger than for
![]() $\text{SC}_{K\rightarrow 0}$
. The enthalpy–pressure-gradient correlation
$\text{SC}_{K\rightarrow 0}$
. The enthalpy–pressure-gradient correlation
![]() ${\it\Psi}_{e,r}$
shows larger values for
${\it\Psi}_{e,r}$
shows larger values for
![]() $\text{SC}_{K\rightarrow \infty }$
than for
$\text{SC}_{K\rightarrow \infty }$
than for
![]() $\text{SC}_{K\rightarrow 0}$
case. The decreased enthalpy–pressure-gradient correlation for
$\text{SC}_{K\rightarrow 0}$
case. The decreased enthalpy–pressure-gradient correlation for
![]() $\text{SC}_{K\rightarrow 0}$
is mainly because of the decreased enthalpy fluctuation, while the gradient of the pressure fluctuations does not show major differences (not shown here). The additional term
$\text{SC}_{K\rightarrow 0}$
is mainly because of the decreased enthalpy fluctuation, while the gradient of the pressure fluctuations does not show major differences (not shown here). The additional term
![]() $E_{e,r}^{(2)}$
, the dissipation
$E_{e,r}^{(2)}$
, the dissipation
![]() ${\it\epsilon}_{e,r}$
and the viscous diffusion
${\it\epsilon}_{e,r}$
and the viscous diffusion
![]() $V_{e,r}$
show larger values in the near-wall region for case
$V_{e,r}$
show larger values in the near-wall region for case
![]() $\text{SC}_{K\rightarrow \infty }$
, which is due to the higher velocity and enthalpy fluctuations.
$\text{SC}_{K\rightarrow \infty }$
, which is due to the higher velocity and enthalpy fluctuations.
5.5 Decomposition of skin friction coefficient and Nusselt number
To quantify the individual laminar and turbulent contributions to the total skin friction and heat transfer we derive and apply the Fukagata, Iwamoto & Kasagi (FIK) identity for the heated pipe that contains the fluid at supercritical pressure. The FIK identity was derived by Fukagata et al. (Reference Fukagata, Iwamoto and Kasagi2002) to investigate componential contributions that different dynamical effects have on global integral quantities. Since then it has been used extensively to study drag reduction mechanisms and active control strategies in fully developed channel and pipe flows (Fukagata & Kasagi Reference Fukagata and Kasagi2003), developing turbulent boundary layers with suction and blowing (Kametani & Fukagata Reference Kametani and Fukagata2011), heated developing turbulent boundary layers (Lee et al. Reference Lee, Yoon Jung, Jin Sung and Zaki2013) and compressible flows (Gomez, Flutet & Sagaut Reference Gomez, Flutet and Sagaut2009). Fukagata, Iwamoto & Kasagi (Reference Fukagata, Iwamoto and Kasagi2005) also used the same approach to derive an identity relation for the Nusselt number and turbulent heat flux in fully developed incompressible channel flows.
In this work we re-derive the FIK identity to take into account the strong property fluctuations in supercritical fluids, by integrating the streamwise momentum and enthalpy equations twice in the radial direction. The FIK identity for the skin friction reads:
 $$\begin{eqnarray}\displaystyle C_{f,FIK} & = & \displaystyle \underbrace{-\frac{2}{{\it\rho}_{b}U_{b}^{2}Re_{{\it\tau}0}}\int _{0}^{R}r\overline{{\it\mu}}\overline{S}_{rz}r\,\text{d}r}_{C_{I}}+\underbrace{\frac{2}{{\it\rho}_{b}U_{b}^{2}}\int _{0}^{R}r\overline{{\it\rho}u_{r}^{\prime \prime }u_{z}^{\prime \prime }}r\,\text{d}r}_{C_{II}}\nonumber\\ \displaystyle & & \displaystyle +\,\underbrace{\frac{1}{{\it\rho}_{b}U_{b}^{2}}\int _{0}^{R}(R^{2}-r^{2})\left\langle \frac{\partial \overline{p}}{\partial z}\right\rangle r\,\text{d}r}_{C_{III}}\nonumber\\ \displaystyle & & \displaystyle +\,\underbrace{\frac{1}{{\it\rho}_{b}U_{b}^{2}}\int _{0}^{R}r\overline{{\it\rho}}\tilde{u} _{r}\tilde{u} _{z}r\,\text{d}r}_{C_{IV}}+\underbrace{\frac{1}{{\it\rho}_{b}U_{b}^{2}}\int _{0}^{R}(R^{2}-r^{2})\left\langle \frac{\partial \overline{{\it\rho}}\tilde{u} _{z}\tilde{u} _{z}}{\partial z}\right\rangle r\,\text{d}r}_{C_{V}}\nonumber\\ \displaystyle & & \displaystyle +\,\underbrace{\frac{1}{{\it\rho}_{b}U_{b}^{2}}\int _{0}^{R}(R^{2}-r^{2})\left\langle \frac{\partial \overline{{\it\rho}u_{z}^{\prime \prime }u_{z}^{\prime \prime }}}{\partial z}\right\rangle r\,\text{d}r}_{C_{VI}}\nonumber\\ \displaystyle & & \displaystyle \underbrace{-\,\frac{1}{{\it\rho}_{b}U_{b}^{2}Re_{{\it\tau}0}}\int _{0}^{R}(R^{2}-r^{2})\left\langle \frac{1}{r}\frac{\partial r\overline{{\it\mu}^{\prime }S^{\prime }}_{rz}}{\partial r}\right\rangle r\,\text{d}r}_{C_{VII}}\nonumber\\ \displaystyle & & \displaystyle \underbrace{-\,\frac{1}{{\it\rho}_{b}U_{b}^{2}Re_{{\it\tau}0}}\int _{0}^{R}(R^{2}-r^{2})\left\langle \frac{\partial \overline{{\it\mu}}\overline{S}_{zz}}{\partial z}\right\rangle r\,\text{d}r}_{C_{VIII}}\nonumber\\ \displaystyle & & \displaystyle \underbrace{-\,\frac{1}{{\it\rho}_{b}U_{b}^{2}Re_{{\it\tau}0}}\int _{0}^{R}(R^{2}-r^{2})\left\langle \frac{\partial \overline{{\it\mu}^{\prime }S^{\prime }}_{zz}}{\partial z}\right\rangle r\,\text{d}r}_{C_{IX}},\end{eqnarray}$$
where
![]() $\langle ~\rangle$
indicates the following operation
$\langle ~\rangle$
indicates the following operation
Equation (5.13) shows that the skin friction coefficient can be decomposed into a laminar contribution
![]() $C_{I}$
, which for a constant property fluid is identical to the analytical solution for laminar flows
$C_{I}$
, which for a constant property fluid is identical to the analytical solution for laminar flows
![]() $16/Re_{b0}$
, a turbulent contribution
$16/Re_{b0}$
, a turbulent contribution
![]() $C_{II}$
and several inhomogeneous contributions
$C_{II}$
and several inhomogeneous contributions
![]() $C_{II}$
–
$C_{II}$
–
![]() $C_{IX}$
. The merit of this equation is that different contributions to skin friction can be compared for fluids with constant or variable properties.
$C_{IX}$
. The merit of this equation is that different contributions to skin friction can be compared for fluids with constant or variable properties.

Figure 15. Componential contributions to the skin friction. The lines indicate the individual terms as given in (5.13) and the symbols indicate the locally computed skin friction
![]() $C_{f}$
, (a) (——)
$C_{f}$
, (a) (——)
![]() $\text{CP}_{K\rightarrow \infty }$
, (– – –)
$\text{CP}_{K\rightarrow \infty }$
, (– – –)
![]() $\text{CP}_{K\rightarrow 0}$
; (b) (——)
$\text{CP}_{K\rightarrow 0}$
; (b) (——)
![]() $\text{SC}_{K\rightarrow \infty }$
, (– – –)
$\text{SC}_{K\rightarrow \infty }$
, (– – –)
![]() $\text{SC}_{K\rightarrow 0}$
.
$\text{SC}_{K\rightarrow 0}$
.
The results of (5.13) are plotted in figure 15 (note, insignificant terms are not shown). In order to verify the FIK derivation, the sum of all terms is compared first with the locally calculated wall shear stress
![]() $C_{f}=2{\it\tau}_{w}/({\it\rho}_{b}U_{b}^{2})$
for
$C_{f}=2{\it\tau}_{w}/({\it\rho}_{b}U_{b}^{2})$
for
![]() $\text{CP}_{K\rightarrow \infty }$
,
$\text{CP}_{K\rightarrow \infty }$
,
![]() $\text{SC}_{K\rightarrow \infty }$
and
$\text{SC}_{K\rightarrow \infty }$
and
![]() $\text{SC}_{K\rightarrow 0}$
. An excellent agreement is obtained ensuring correctness and consistency (symbols and line overlap). As expected, for
$\text{SC}_{K\rightarrow 0}$
. An excellent agreement is obtained ensuring correctness and consistency (symbols and line overlap). As expected, for
![]() $\text{CP}_{K\rightarrow \infty }$
(results for
$\text{CP}_{K\rightarrow \infty }$
(results for
![]() $\text{CP}_{K\rightarrow 0}$
are identical and thus not shown) the laminar and turbulent contributions are
$\text{CP}_{K\rightarrow 0}$
are identical and thus not shown) the laminar and turbulent contributions are
![]() $0.00302=16/Re_{b0}$
and 0.00620, respectively. These contributions are identical to the results of a fully developed pipe flow that have also been reported by Fukagata et al. (Reference Fukagata, Iwamoto and Kasagi2002).
$0.00302=16/Re_{b0}$
and 0.00620, respectively. These contributions are identical to the results of a fully developed pipe flow that have also been reported by Fukagata et al. (Reference Fukagata, Iwamoto and Kasagi2002).
Unlike for the constant property cases, the inhomogeneous contributions play a significant role for the skin friction in the supercritical cases (see figure 15
b). The term related to the streamwise momentum flux
![]() $C_{V}$
is negative at the inlet and becomes positive at
$C_{V}$
is negative at the inlet and becomes positive at
![]() $z\approx 7$
. At the beginning of the pipe, the thermal boundary layer is very thin. The density rapidly decreases close to the wall and the mass flux increases. To satisfy the mass flux balance, the velocity in the core region decreases, which also causes a decrease of momentum flux
$z\approx 7$
. At the beginning of the pipe, the thermal boundary layer is very thin. The density rapidly decreases close to the wall and the mass flux increases. To satisfy the mass flux balance, the velocity in the core region decreases, which also causes a decrease of momentum flux
![]() $\overline{{\it\rho}}\tilde{u} _{z}\tilde{u} _{z}$
. Proceeding downstream, the thermal boundary layer grows until a net positive value of
$\overline{{\it\rho}}\tilde{u} _{z}\tilde{u} _{z}$
. Proceeding downstream, the thermal boundary layer grows until a net positive value of
![]() $C_{V}$
is reached at
$C_{V}$
is reached at
![]() $z\approx 7$
(note, the weighting factor
$z\approx 7$
(note, the weighting factor
![]() $r(R^{2}-r^{2})$
within the integral is zero at the wall and
$r(R^{2}-r^{2})$
within the integral is zero at the wall and
![]() $R^{2}$
at the cell centre). In contrast to
$R^{2}$
at the cell centre). In contrast to
![]() $C_{V}$
, the magnitude of the term
$C_{V}$
, the magnitude of the term
![]() $C_{IV}$
(the product of the mean density, mean wall-normal and streamwise velocities) experiences a sharp increase in the inlet region and shows a peak value of 0.33 at
$C_{IV}$
(the product of the mean density, mean wall-normal and streamwise velocities) experiences a sharp increase in the inlet region and shows a peak value of 0.33 at
![]() $z=0.7$
. Afterwards
$z=0.7$
. Afterwards
![]() $C_{IV}$
decreases and reaches a negative value of
$C_{IV}$
decreases and reaches a negative value of
![]() $-0.09$
at
$-0.09$
at
![]() $z=17$
. This can be explained by the sharp changes of streamwise velocity in the near-wall region, which results in a high positive wall-normal velocity close to the inlet and negative wall-normal velocity further downstream. The contributions of
$z=17$
. This can be explained by the sharp changes of streamwise velocity in the near-wall region, which results in a high positive wall-normal velocity close to the inlet and negative wall-normal velocity further downstream. The contributions of
![]() $C_{I}$
(laminar) and
$C_{I}$
(laminar) and
![]() $C_{II}$
(turbulent) to the skin friction show a decreasing trend, due to the reduction in mean viscosity and Reynolds shear stress, respectively.
$C_{II}$
(turbulent) to the skin friction show a decreasing trend, due to the reduction in mean viscosity and Reynolds shear stress, respectively.
Figure 15(b) shows that the skin friction for
![]() $\text{SC}_{K\rightarrow \infty }$
is higher along the pipe than for
$\text{SC}_{K\rightarrow \infty }$
is higher along the pipe than for
![]() $\text{SC}_{K\rightarrow 0}$
. Comparing the individual contributions for
$\text{SC}_{K\rightarrow 0}$
. Comparing the individual contributions for
![]() $\text{SC}_{K\rightarrow \infty }$
and
$\text{SC}_{K\rightarrow \infty }$
and
![]() $\text{SC}_{K\rightarrow 0}$
, it can be seen that the major difference in
$\text{SC}_{K\rightarrow 0}$
, it can be seen that the major difference in
![]() $C_{f,FIK}$
stems from the turbulent contribution
$C_{f,FIK}$
stems from the turbulent contribution
![]() $C_{II}$
.
$C_{II}$
.
As explained in § 5.3, the lower values of
![]() $C_{II}$
for
$C_{II}$
for
![]() $\text{SC}_{K\rightarrow 0}$
are due to the lower Reynolds shear stress, as also shown in figure 11(b). In conclusion, the non-fluctuating wall enthalpy boundary condition causes the skin friction for case
$\text{SC}_{K\rightarrow 0}$
are due to the lower Reynolds shear stress, as also shown in figure 11(b). In conclusion, the non-fluctuating wall enthalpy boundary condition causes the skin friction for case
![]() $\text{SC}_{K\rightarrow 0}$
to reduce by approximately 6 %.
$\text{SC}_{K\rightarrow 0}$
to reduce by approximately 6 %.
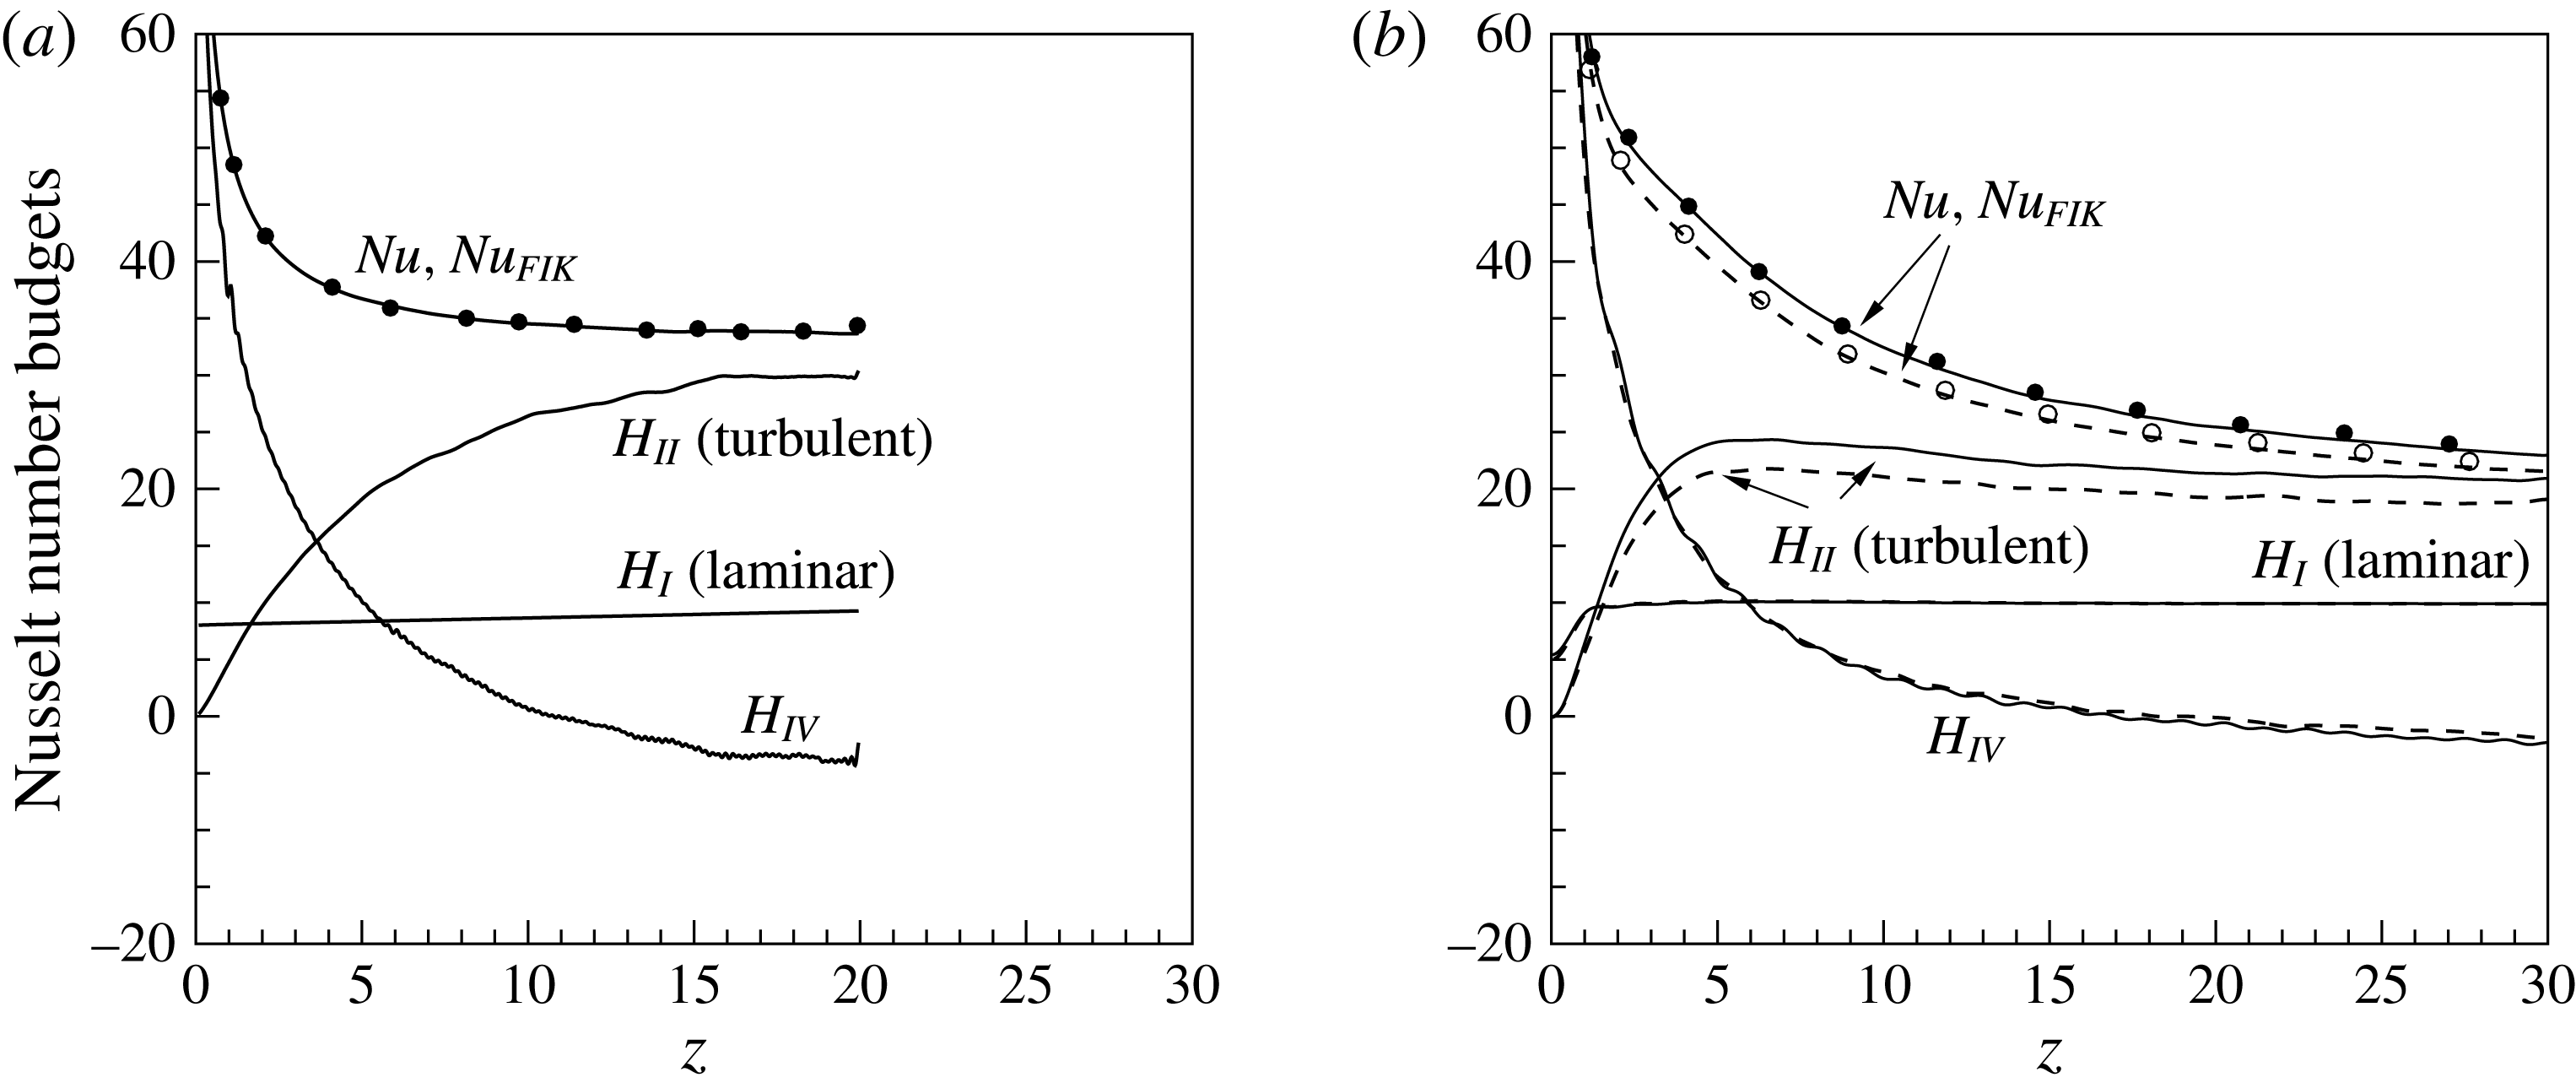
Figure 16. Componential contributions to the Nusselt number. The lines indicate the individual terms in (5.15) and the symbols indicate the locally computed Nusselt number
![]() $Nu$
, (a) (——)
$Nu$
, (a) (——)
![]() $\text{CP}_{K\rightarrow \infty }$
; (b) (——)
$\text{CP}_{K\rightarrow \infty }$
; (b) (——)
![]() $\text{SC}_{K\rightarrow \infty }$
, (– – –)
$\text{SC}_{K\rightarrow \infty }$
, (– – –)
![]() $\text{SC}_{K\rightarrow 0}$
.
$\text{SC}_{K\rightarrow 0}$
.
Similar to the skin friction, the FIK identity for the Nusselt number reads:
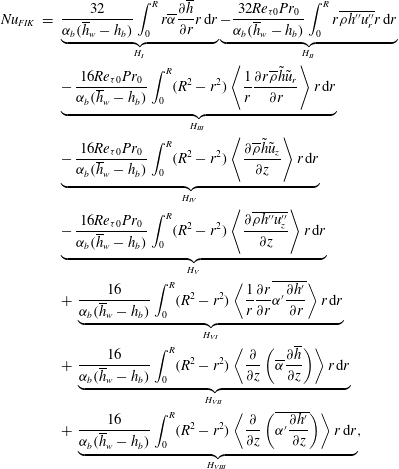 $$\begin{eqnarray}\displaystyle Nu_{FIK} & = & \displaystyle \underbrace{\frac{32}{{\it\alpha}_{b}(\overline{h}_{w}-h_{b})}\int _{0}^{R}r\overline{{\it\alpha}}\frac{\partial \overline{h}}{\partial r}r\,\text{d}r}_{H_{I}}\underbrace{-\frac{32Re_{{\it\tau}0}Pr_{0}}{{\it\alpha}_{b}(\overline{h}_{w}-h_{b})}\int _{0}^{R}r\overline{{\it\rho}h^{\prime \prime }u_{r}^{\prime \prime }}r\,\text{d}r}_{H_{II}}\nonumber\\ \displaystyle & & \displaystyle \underbrace{-\,\frac{16Re_{{\it\tau}0}Pr_{0}}{{\it\alpha}_{b}(\overline{h}_{w}-h_{b})}\int _{0}^{R}(R^{2}-r^{2})\left\langle \frac{1}{r}\frac{\partial r\overline{{\it\rho}}\tilde{h}\tilde{u} _{r}}{\partial r}\right\rangle r\,\text{d}r}_{H_{III}}\nonumber\\ \displaystyle & & \displaystyle \underbrace{-\,\frac{16Re_{{\it\tau}0}Pr_{0}}{{\it\alpha}_{b}(\overline{h}_{w}-h_{b})}\int _{0}^{R}(R^{2}-r^{2})\left\langle \frac{\partial \overline{{\it\rho}}\tilde{h}\tilde{u} _{z}}{\partial z}\right\rangle r\,\text{d}r}_{H_{IV}}\nonumber\\ \displaystyle & & \displaystyle \underbrace{-\,\frac{16Re_{{\it\tau}0}Pr_{0}}{{\it\alpha}_{b}(\overline{h}_{w}-h_{b})}\int _{0}^{R}(R^{2}-r^{2})\left\langle \frac{\partial \overline{{\it\rho}h^{\prime \prime }u_{z}^{\prime \prime }}}{\partial z}\right\rangle r\,\text{d}r}_{H_{V}}\nonumber\\ \displaystyle & & \displaystyle +\,\underbrace{\frac{16}{{\it\alpha}_{b}(\overline{h}_{w}-h_{b})}\int _{0}^{R}(R^{2}-r^{2})\left\langle \frac{1}{r}\frac{\partial r}{\partial r}\overline{{\it\alpha}^{\prime }\frac{\partial h^{\prime }}{\partial r}}\right\rangle r\,\text{d}r}_{H_{VI}}\nonumber\\ \displaystyle & & \displaystyle +\,\underbrace{\frac{16}{{\it\alpha}_{b}(\overline{h}_{w}-h_{b})}\int _{0}^{R}(R^{2}-r^{2})\left\langle \frac{\partial }{\partial z}\left(\overline{{\it\alpha}}\frac{\partial \overline{h}}{\partial z}\right)\right\rangle r\,\text{d}r}_{H_{VII}}\nonumber\\ \displaystyle & & \displaystyle +\,\underbrace{\frac{16}{{\it\alpha}_{b}(\overline{h}_{w}-h_{b})}\int _{0}^{R}(R^{2}-r^{2})\left\langle \frac{\partial }{\partial z}\left(\overline{{\it\alpha}^{\prime }\frac{\partial h^{\prime }}{\partial z}}\right)\right\rangle r\,\text{d}r}_{H_{VIII}},\end{eqnarray}$$
where
![]() $H_{I}$
is the laminar,
$H_{I}$
is the laminar,
![]() $H_{II}$
is the turbulent and the remaining terms are inhomogeneous contributions to the Nusselt number. The comparison of componential contribution to Nusselt number for
$H_{II}$
is the turbulent and the remaining terms are inhomogeneous contributions to the Nusselt number. The comparison of componential contribution to Nusselt number for
![]() $\text{CP}_{K\rightarrow \infty }$
,
$\text{CP}_{K\rightarrow \infty }$
,
![]() $\text{SC}_{K\rightarrow \infty }$
and
$\text{SC}_{K\rightarrow \infty }$
and
![]() $\text{SC}_{K\rightarrow 0}$
are shown in figure 16 (the negligible terms are not shown). As for the skin friction discussed above, the FIK derivation for the Nusselt number is first verified. The sum of all terms is compared with the locally calculated Nusselt number for
$\text{SC}_{K\rightarrow 0}$
are shown in figure 16 (the negligible terms are not shown). As for the skin friction discussed above, the FIK derivation for the Nusselt number is first verified. The sum of all terms is compared with the locally calculated Nusselt number for
![]() $\text{CP}_{K\rightarrow \infty }$
,
$\text{CP}_{K\rightarrow \infty }$
,
![]() $\text{SC}_{K\rightarrow \infty }$
and
$\text{SC}_{K\rightarrow \infty }$
and
![]() $\text{SC}_{K\rightarrow 0}$
. An excellent agreement is obtained, ensuring correctness and consistency of the derivation (symbols and line overlap). The most significant contributions to the Nusselt number, in terms of relative magnitude, are attributed to the radial turbulent heat flux
$\text{SC}_{K\rightarrow 0}$
. An excellent agreement is obtained, ensuring correctness and consistency of the derivation (symbols and line overlap). The most significant contributions to the Nusselt number, in terms of relative magnitude, are attributed to the radial turbulent heat flux
![]() $H_{II}$
, the laminar part
$H_{II}$
, the laminar part
![]() $H_{I}$
, and the contribution of the mean streamwise enthalpy flux
$H_{I}$
, and the contribution of the mean streamwise enthalpy flux
![]() $H_{IV}$
. It is evident that downstream from the inlet, the radial turbulent heat flux
$H_{IV}$
. It is evident that downstream from the inlet, the radial turbulent heat flux
![]() $H_{II}$
has the largest contribution to the Nusselt number. The second largest term is the laminar contribution
$H_{II}$
has the largest contribution to the Nusselt number. The second largest term is the laminar contribution
![]() $H_{I}$
and the term
$H_{I}$
and the term
![]() $H_{IV}$
has a positive contribution to Nusselt number at inlet region and it becomes negative further downstream. This is attributed to the growth of the enthalpy profile (thermal boundary layer) and its product with streamwise velocity. Figure 16(b) also shows the influence of different thermal boundary conditions on the componential contributions to the Nusselt number for case
$H_{IV}$
has a positive contribution to Nusselt number at inlet region and it becomes negative further downstream. This is attributed to the growth of the enthalpy profile (thermal boundary layer) and its product with streamwise velocity. Figure 16(b) also shows the influence of different thermal boundary conditions on the componential contributions to the Nusselt number for case
![]() $\text{SC}_{K\rightarrow \infty }$
and
$\text{SC}_{K\rightarrow \infty }$
and
![]() $\text{SC}_{K\rightarrow 0}$
. It is evident that the boundary condition solely affects the turbulent radial heat flux
$\text{SC}_{K\rightarrow 0}$
. It is evident that the boundary condition solely affects the turbulent radial heat flux
![]() $H_{II}$
, thus causing the Nusselt number to reduce for the non-fluctuating wall enthalpy case
$H_{II}$
, thus causing the Nusselt number to reduce for the non-fluctuating wall enthalpy case
![]() $\text{SC}_{K\rightarrow 0}$
by approximately 7 %.
$\text{SC}_{K\rightarrow 0}$
by approximately 7 %.
6 Conclusion
In this work we used DNS to investigate the effect of thermal wall boundary conditions on developing turbulent pipe flows with
![]() $\text{CO}_{2}$
at a thermodynamic supercritical pressure of
$\text{CO}_{2}$
at a thermodynamic supercritical pressure of
![]() $P_{0}=80$
bar. The Reynolds number based on pipe diameter and inlet friction velocity is
$P_{0}=80$
bar. The Reynolds number based on pipe diameter and inlet friction velocity is
![]() $Re_{{\it\tau}0}=360$
and the inlet Prandtl number is
$Re_{{\it\tau}0}=360$
and the inlet Prandtl number is
![]() $Pr_{0}=3.19$
. Two different wall boundary conditions are studied, namely a case with fluctuating (
$Pr_{0}=3.19$
. Two different wall boundary conditions are studied, namely a case with fluctuating (
![]() $\text{SC}_{K\rightarrow \infty }$
) and non-fluctuating (
$\text{SC}_{K\rightarrow \infty }$
) and non-fluctuating (
![]() $\text{SC}_{K\rightarrow 0}$
) wall enthalpy. The boundary conditions correspond to the upper and lower limit of thermal effusivity ratio
$\text{SC}_{K\rightarrow 0}$
) wall enthalpy. The boundary conditions correspond to the upper and lower limit of thermal effusivity ratio
![]() $K$
, respectively. To incorporate both thermal wall boundary conditions, first, a simulation with a constant heat flux boundary condition (
$K$
, respectively. To incorporate both thermal wall boundary conditions, first, a simulation with a constant heat flux boundary condition (
![]() $\text{SC}_{K\rightarrow \infty }$
) is performed. Then, for the other simulation, the mean wall enthalpy obtained from the first simulation is used as the thermal wall boundary condition (
$\text{SC}_{K\rightarrow \infty }$
) is performed. Then, for the other simulation, the mean wall enthalpy obtained from the first simulation is used as the thermal wall boundary condition (
![]() $\text{SC}_{K\rightarrow 0}$
).
$\text{SC}_{K\rightarrow 0}$
).
To compare the effects of different thermal boundary conditions on heat transfer to supercritical fluid cases, we also performed DNS with constant property fluids that have the same Reynolds number and Prandtl number as the supercritical fluid cases at the inlet of the pipe. The results show that the wall temperature fluctuations at the wall have very limited effect on the mean enthalpy and Nusselt number for constant property cases. This result is in agreement with existing literature, where it was shown that the Nusselt number is independent of the thermal boundary condition if
![]() $Pr\geqslant 1$
.
$Pr\geqslant 1$
.
In contrast to the constant property cases, the heat transfer to supercritical fluids with
![]() $Pr\geqslant 1$
strongly depends on the thermal wall boundary condition. A significant increase in Nusselt number and bulk enthalpy is observed if thermal fluctuations are allowed at the wall. We found that the wall enthalpy fluctuations cause strong fluctuations in density, viscosity and thermal conductivity, which consequently promote mass and velocity fluctuations that increase turbulent shear stress and turbulent heat flux. A quadrant analysis and FIK identities for both quantities confirms this result, which shows that the turbulent shear stress and turbulent heat flux are attenuated for the non-fluctuating wall temperature case. The present work provides clear evidence that thermal effusivity ratio has a large impact on Nusselt number and skin friction for fluids with large property variations.
$Pr\geqslant 1$
strongly depends on the thermal wall boundary condition. A significant increase in Nusselt number and bulk enthalpy is observed if thermal fluctuations are allowed at the wall. We found that the wall enthalpy fluctuations cause strong fluctuations in density, viscosity and thermal conductivity, which consequently promote mass and velocity fluctuations that increase turbulent shear stress and turbulent heat flux. A quadrant analysis and FIK identities for both quantities confirms this result, which shows that the turbulent shear stress and turbulent heat flux are attenuated for the non-fluctuating wall temperature case. The present work provides clear evidence that thermal effusivity ratio has a large impact on Nusselt number and skin friction for fluids with large property variations.
Acknowledgements
We acknowledge that the results of this research have been achieved using the PRACE Research Infrastructure resource Cartesius based in The Netherlands at SURFsara. We also wish to thank Dr G. Brethouwer for his comments on an earlier version of the manuscript.
Supplementary movie
Supplementary movie is available at http://dx.doi.org/10.1017/jfm.2016.411.


