


1 Introduction
Cardiovascular disease (CVD) is a leading cause of mortality worldwide. An early marker of this disease involves endothelial dysfunction: the endothelium loses the ability to maintain homoeostasis and, thus, vessel health is compromised. A key to protecting vessel health occurs at the interface between circulating blood and the endothelium. Strategically located at this interface is the endothelial glycocalyx layer (EGL). This layer is a hydrated gel-like layer of membrane-bound macromolecules that is expressed on the luminal surface of, and regulated by, vascular endothelial cells. This layer is present throughout the circulatory system and has been a focus of recent research due to the increasing understanding of the role it plays in the physiology and pathophysiology of blood vessels (Curry & Adamson Reference Curry and Adamson2012; Tarbell, Simon & Curry Reference Tarbell, Simon and Curry2014).
The EGL is thought to protect the vascular wall from stresses produced by direct exposure to blood flow, or from CVD risk factors, such as hypercholesterolaemia. However, the EGL is more than an inert physical barrier; it plays essential roles in transducing biological signals and mechanical cues from outside the cell to inside the cell. For example, the composition and physical extent of the EGL influence the bioavailability of the signalling molecule nitric oxide (NO). Diminished bioavailability or abnormalities in NO signalling are hallmarks of endothelial dysfunction, which can lead to an increased susceptibility to CVD. The susceptibility of the vessel wall to disease is attributable to the adaptive capacity of the vascular wall to the local microenvironment, which includes the near-wall microfluidics.
The EGL is also speculated to have an important effect in diabetes. Using a dye tracer method, Nieuwdorp et al. (Reference Nieuwdorp, van Haeften, Gouverneur, Mooij, van Lieshout, Levi, Meijers, Holleman, Hoekstra and Vink2006) found that acute hyperglycaemia appears to halve the EGL volume in healthy volunteers. Acute hyperglycaemia occurs when an excessive concentration of glucose is present in the blood. In diabetics, hyperglycaemia leads to increased rates of vascular dysfunction. Perrin, Harper & Bates (Reference Perrin, Harper and Bates2007) reviewed the possible role that the EGL has in controlling microvascular permeability and its role in diabetic vascular dysfunction.
The exact thickness of the EGL in the microvasculature is still a matter of debate, as some studies have shown the EGL to have a thickness of up to 0.4–
 $0.5~{\rm\mu}\text{m}$
(Vink & Duling Reference Vink and Duling1996), while others have measured an average thickness of
$0.5~{\rm\mu}\text{m}$
(Vink & Duling Reference Vink and Duling1996), while others have measured an average thickness of
 $1.5~{\rm\mu}\text{m}$
(Yen et al.
Reference Yen, Cai, Zeng, Tarbell and Fu2012). However, despite this relatively thin surface glycocalyx, recent studies have shown that the EGL has a substantial impact on microvascular haemodynamics. This can be seen through the manner in which the EGL alters the blood velocity profiles within microvessels, which has been shown to occur in venules from mouse cremaster muscle by Long et al. (Reference Long, Smith, Pries, Ley and Damiano2004) using microparticle image velocimetry. This alteration of the blood velocity profiles has important implications, as it modifies the fluid shear stress borne by the endothelium.
$1.5~{\rm\mu}\text{m}$
(Yen et al.
Reference Yen, Cai, Zeng, Tarbell and Fu2012). However, despite this relatively thin surface glycocalyx, recent studies have shown that the EGL has a substantial impact on microvascular haemodynamics. This can be seen through the manner in which the EGL alters the blood velocity profiles within microvessels, which has been shown to occur in venules from mouse cremaster muscle by Long et al. (Reference Long, Smith, Pries, Ley and Damiano2004) using microparticle image velocimetry. This alteration of the blood velocity profiles has important implications, as it modifies the fluid shear stress borne by the endothelium.
The EGL is also believed to play a vital role in regulating transendothelial mass transport. For a long time the classic Starling principle has been used to describe the balance of hydrostatic and osmotic pressure across the endothelium. However, the advent of more precise measurements for tissue oncotic pressure revealed inconsistencies with the classic Starling principle (Michel Reference Michel1997), which led Michel (Reference Michel1997) and Weinbaum (Reference Weinbaum1998) to suggest revisions to the Starling principle and then Hu & Weinbaum (Reference Hu and Weinbaum1999) to develop a two-dimensional mathematical model for this revision. Experiments on frog mesentery capillaries (Hu et al. Reference Hu, Adamson, Liu, Curry and Weinbaum2000) and later Adamson et al. (Reference Adamson, Lenz, Zhang, Adamson, Weinbaum and Curry2004) definitively showed support for the revised Starling principle over its classical version in rat mesenteric venules. Under this revised Starling principle, it is the EGL that acts as the molecular sieve that forms the osmotic barrier rather than the whole endothelial wall. Imaging experiments by Squire et al. (Reference Squire, Chew, Nneji, Neal, Barry and Michel2001) showed structures in the EGL that could account for the EGL’s role as a molecular sieve. The structures proposed consist of a square array of 20 nm spaced fibre-like core proteins, of length 150–400 nm. Spaced every 20 nm along these fibres are molecular structures 10–12 nm in diameter, which might represent aggregated glycosaminoglycans (GAGs) or plasma proteins. It was shown that this structural arrangement better accounts for the measured EGL reflection coefficients than those predicted assuming GAG side chains between the fibres. Weinbaum et al. (Reference Weinbaum, Zhang, Yuefeng Han and Cowin2003) subsequently demonstrated that a hexagon lattice, rather than a square one, better accounts for the hydraulic resistivity of the EGL. They also argued that the EGL’s sieving capabilities imply an inherent bending rigidity to the core proteins, which also helps to maintain the EGL’s structural configuration in the presence of Brownian effects. For a more complete review of this area, see Levick & Michel (Reference Levick and Michel2010).
The transmural flux of fluid itself through the endothelium primarily takes place through interendothelium clefts which are approximately
 $O(0.01)~{\rm\mu}\text{m}$
in width (Clough & Michel Reference Clough and Michel1998) (although, in fact, flow takes place through even smaller gaps in the tight junction strands that sit within the clefts). There has been recent interest in better understanding these fluxes in connection with the transport of low-density lipoproteins (LDLs) from the blood, across the endothelium and into the vessel wall. Here, they can form lipid-rich plaques, which lead to the onset of diseases such as atherosclerosis. The plasma that carries the LDLs is much more easily able to transit the endothelium than the LDLs themselves, and this leads to an LDL accumulation (concentration polarisation layer) on the endothelium. This in turn is believed to result in a greater transport of LDL into the vessel wall. The fact that plasma flow is localised to these interendothelium clefts led some to speculate that this would provide a mechanism for spatially heterogeneous concentration polarisation layers in the vasculature. Vincent, Sherwin & Weinberg (Reference Vincent, Sherwin and Weinberg2008) modelled the flux through the intercellular clefts in a two-dimensional geometry of periodically repeating cells, before later incorporating this into an LDL transport model (Vincent, Sherwin & Weinberg Reference Vincent, Sherwin and Weinberg2009). Their results predicted that for physiologically relevant parameters, diffusion would overcome any tendency of the LDLs to localise about the clefts, leading to a largely homogeneous coating of LDLs on the endothelium. However, this conclusion was drawn in the absence of an EGL, which, when included in the model, was shown to have the potential for heterogeneous LDL layers on the endothelium. The exact extent and form of the heterogeneity, however, were seen to depend upon the as-yet-unknown interactions between the LDLs and the EGL (Vincent, Sherwin & Weinberg Reference Vincent, Sherwin and Weinberg2010).
$O(0.01)~{\rm\mu}\text{m}$
in width (Clough & Michel Reference Clough and Michel1998) (although, in fact, flow takes place through even smaller gaps in the tight junction strands that sit within the clefts). There has been recent interest in better understanding these fluxes in connection with the transport of low-density lipoproteins (LDLs) from the blood, across the endothelium and into the vessel wall. Here, they can form lipid-rich plaques, which lead to the onset of diseases such as atherosclerosis. The plasma that carries the LDLs is much more easily able to transit the endothelium than the LDLs themselves, and this leads to an LDL accumulation (concentration polarisation layer) on the endothelium. This in turn is believed to result in a greater transport of LDL into the vessel wall. The fact that plasma flow is localised to these interendothelium clefts led some to speculate that this would provide a mechanism for spatially heterogeneous concentration polarisation layers in the vasculature. Vincent, Sherwin & Weinberg (Reference Vincent, Sherwin and Weinberg2008) modelled the flux through the intercellular clefts in a two-dimensional geometry of periodically repeating cells, before later incorporating this into an LDL transport model (Vincent, Sherwin & Weinberg Reference Vincent, Sherwin and Weinberg2009). Their results predicted that for physiologically relevant parameters, diffusion would overcome any tendency of the LDLs to localise about the clefts, leading to a largely homogeneous coating of LDLs on the endothelium. However, this conclusion was drawn in the absence of an EGL, which, when included in the model, was shown to have the potential for heterogeneous LDL layers on the endothelium. The exact extent and form of the heterogeneity, however, were seen to depend upon the as-yet-unknown interactions between the LDLs and the EGL (Vincent, Sherwin & Weinberg Reference Vincent, Sherwin and Weinberg2010).
On this subject, it is perhaps worth noting the earlier study by Vink, Constantinescu & Spaan (Reference Vink, Constantinescu and Spaan2000), who showed that oxidised LDLs appear to cause degradation of the EGL in the microvasculature of hamster cremaster muscle. Another study showed that a high-fat high-cholesterol diet reduced the EGL thickness in mouse arteries (van den Berg et al. Reference van den Berg, Spaan, Rolf and Vink2006). This association between the EGL and atherosclerosis is reviewed more fully in Gouverneur et al. (Reference Gouverneur, Berg, Nieuwdorp, Stroes and Vink2006), with emphasis on the effects of fluid shear stress reducing the EGL thickness, diminishing its protective effect in the vasculature.
The EGL is also implicated in the immune response, having been found to be involved in the leukocyte adhesion cascade. This cascade is a sequence of adhesion and activation events, which begins with capture of a leukocyte and ends with the extravasation of the leukocyte. One issue with this cascade is that the endothelial adhesion molecules appear to be buried deep within the EGL (Ley Reference Ley, Tuma, Durn and L.2008). Therefore, Smith et al. (Reference Smith, Long, Damiano and Ley2003) suggested that capture may be initiated at the entrance of postcapillary venules, where the EGL is sufficiently compressed as a leukocyte exits a capillary. In the absence of such EGL compression, the depth through which microvilli of the leukocyte can penetrate into the EGL becomes critical to whether it becomes adhered, or rolls freely through the vessel. As these microvilli are comparable in length to the EGL thickness, adhesion is geometrically possible. However, resistance to penetration from the EGL must also be factored in. Using a spherical model to predict the viscous forces on the microvilli, as developed by Feng, Ganatos & Weinbaum (Reference Feng, Ganatos and Weinbaum1998), Zhao, Chien & Weinbaum (Reference Zhao, Chien and Weinbaum2001) predicted that the microvilli would only penetrate 1–20 nm into the EGL, when the latter was modelled as fibres with GAG side chains. Under the revised ultrastructural model of Weinbaum et al. (Reference Weinbaum, Zhang, Yuefeng Han and Cowin2003) with aggregated GAGs (see above), the penetration depths could perhaps be a factor of three smaller. In either case, it is likely that a non-compressed EGL forms a barrier to leukocyte capture, except possibly in regions of low shear (such as postcapillary venules) or flow reversal. To promote capture in other regions, modification of the EGL may be a necessary first step of the leukocyte adhesion cascade. As a result, restoration of the EGL has the potential to become a therapeutic strategy.
Mechanotransduction of forces from the blood flow to the endothelium is yet another process thought to be mediated by the EGL. It has been established that the endothelial cell morphology changes in the presence of blood flow, becoming more elongated in the direction of the flow than in the absence of flow (Nerem, Levesque & Cornhill Reference Nerem, Levesque and Cornhill1981; Barbee, Davies & Lal Reference Barbee, Davies and Lal1994). It is believed that this cell remodelling is caused by transmission of fluid shear stresses to the actin cortical cytoskeleton of the endothelial cells via the EGL which is anchored to the dense peripheral actin band within the cell. This, in turn, can cause the adherens junctions between endothelial cells to rupture, leading to reorganisation of the endothelium. Due to the fact that fluid shear stress is much diminished by the presence of the EGL, it is now thought that much of the mechanical stress is carried through the solid components of the EGL. Indeed, a force balance model developed by Tarbell & Shi (Reference Tarbell and Shi2013) (for a glycocalyx-coated cell in an extracellular matrix) predicts solid stresses that are one to two orders of magnitude larger than the fluid stresses. Using the ultrastructural model proposed by Squire et al. (Reference Squire, Chew, Nneji, Neal, Barry and Michel2001) as a starting point, Weinbaum et al. (Reference Weinbaum, Zhang, Yuefeng Han and Cowin2003) investigated what magnitude forces and torques the EGL could be capable of exerting upon the underlying cortical cytoskeleton, by explicitly modelling the core proteins as fluid-damped linearly elastic beams. By fitting to the EGL recovery times measured following the passage of a cell through the vessel, they predicted a flexural rigidity of
 $700~\text{pN}~\text{nm}^{2}$
for the EGL’s core proteins (more recent estimates obtained using nonlinear beam models have put this value at
$700~\text{pN}~\text{nm}^{2}$
for the EGL’s core proteins (more recent estimates obtained using nonlinear beam models have put this value at
 $490~\text{pN}~\text{nm}^{2}$
(Han et al.
Reference Han, Weinbaum, Spaan and Vimk2006)). They found that although the drag on a single core protein was too small to be likely to generate any significant deformation of the underlying actin cortical cytoskeleton, the combined drag from an entire EGL brush (which consists of multiple core proteins emanating from a common focal point) could generate forces capable of disturbing an endothelial cell’s actin arrangement. Furthermore, the torque transmitted by the brushes to the actin cortical cytoskeleton could be significant. More recently, Dabagh et al. (Reference Dabagh, Jalali, Butler and Tarbell2014) have employed multiscale modelling to examine the stress amplifications through various components within a monolayer of endothelial cells, including a (uniform) EGL, adherens junctions, cell nuclei and various other intracellular organelles. They found that a 250–600 fold increase of stress can occur at the adherens junctions under
$490~\text{pN}~\text{nm}^{2}$
(Han et al.
Reference Han, Weinbaum, Spaan and Vimk2006)). They found that although the drag on a single core protein was too small to be likely to generate any significant deformation of the underlying actin cortical cytoskeleton, the combined drag from an entire EGL brush (which consists of multiple core proteins emanating from a common focal point) could generate forces capable of disturbing an endothelial cell’s actin arrangement. Furthermore, the torque transmitted by the brushes to the actin cortical cytoskeleton could be significant. More recently, Dabagh et al. (Reference Dabagh, Jalali, Butler and Tarbell2014) have employed multiscale modelling to examine the stress amplifications through various components within a monolayer of endothelial cells, including a (uniform) EGL, adherens junctions, cell nuclei and various other intracellular organelles. They found that a 250–600 fold increase of stress can occur at the adherens junctions under
 $10~\text{dyne}~\text{cm}^{-2}$
of applied shear stress.
$10~\text{dyne}~\text{cm}^{-2}$
of applied shear stress.
The role of the EGL in endothelial remodelling was further highlighted by Florian et al. (Reference Florian, Kosky, Ainslie, Pang, Dull and Tarbell2003), who demonstrated a drop in NOx production by the endothelial cells when the heparan sulphate component of the EGL was degraded by heparinase. Since endothelial cells produce NOx in response to applied shear stresses, this implies that the endothelial cells had become partially desensitised to shear forces under these conditions. This notion was later further supported by the study of Thi et al. (Reference Thi, Tarbell, Weinbaum and Spray2004), who showed that the dense peripheral actin band (DPAB) was no longer disrupted in the presence of fluid shear when the EGL heparan sulphate had been degraded by heparinase. Moreover, Yao, Rabodzey & Dewey (Reference Yao, Rabodzey and Dewey2007) showed that endothelial cells do not align to the flow direction under similar treatment by heparinase. The same study also showed that the EGL appears to be thicker at the cell–cell junctions when subjected to laminar flow, as compared with a relatively uniform thickness over the whole cell under no flow conditions. They hypothesised that this is due to the EGL redistributing to the cell–cell junctions to reduce the shear stress gradients experienced by endothelial cells under flow.
In elucidating all of the above EGL functions, the difficulty in measuring in vivo the distribution of the EGL, and the shear stresses exerted upon the vessel walls, means that models have played an important role. Explicit modelling of the EGL’s complex structure is, of course, not practical, and instead effective continuum models are used. One of the earliest models for the flow through microvessels that accounts for the EGL was developed by Barry, Parkerf & Aldis (Reference Barry, Parkerf and Aldis1991). Flow in the lumen was modelled using the full Navier–Stokes equations, whereas the behaviour of the EGL was described using biphasic mixture theory. Here, the EGL is separated into two components, a solid phase and a fluid phase. Wei et al. (Reference Wei, Waters, Liu and Grotberg2003) later used a similar biphasic mixture theory model to consider the influence upon the haemodynamics of the endothelial topology, by considering a two-dimensional vessel with poroelastic-lined wavy walls. Here, the aspect ratio of the vessel was considered to be such that a lubrication theory approximation could be applied. This constraint was relaxed in the subsequent model of Sumets et al. (Reference Sumets, Cater, Long and Clarke2015), who developed a boundary integral representation of the full biphasic mixture theory equations. However, in all of these modelling studies, two-dimensional vessel geometries were assumed.
There have been a number of studies that have considered three-dimensional geometries, often for the cases where a cell occupies the vessel. The influence of a spherical cell in the vessel upon EGL dynamics was modelled by Wang & Parker (Reference Wang and Parker1995) using biphasic mixture theory, although in this case the EGL coated the cell rather than the vessel walls. The EGL-lined vessel in the presence of an (uncoated) cell was considered shortly afterwards by Damiano et al. (Reference Damiano, Duling, Ley and Skalak1996), who took advantage of a thin cell–vessel gap to justify a lubrication theory approximation. Damiano (Reference Damiano1998) and Secomb, Hsu & Pries (Reference Secomb, Hsu and Pries1998) both extended the original model by Damiano et al. (Reference Damiano, Duling, Ley and Skalak1996) to allow for more general axisymmetric shapes for red blood cells rather than assuming simple spheres.
Near the vessel walls under normal flow conditions it has been shown that there is a cell-depleted layer several microns thick (the exact thickness depending upon the vessel diameter and haematocrit) (Kim et al.
Reference Kim, Kong, Popel, Intaglietta and Johnson2007). Therefore, in vessels larger than
 $20~{\rm\mu}\text{m}$
in diameter, this has led to the development of two-layer viscosity models as an alternative to explicitly considering the presence of red blood cells (Pries et al.
Reference Pries, Secomb, Gessner, Sperandio, Gross and Gaehtgens1994). In such models, the fluid within the lumen consists of a high-viscosity core to capture the presence of red blood cells, and a lower-viscosity outer (or cell-depleted) region. A modification of this two-layer model treats the viscosity of the cell-depleted layer as initially unknown, and larger in magnitude than that of blood plasma alone. This factors in the occasional intrusion of red blood cells into the cell-depleted layer (Sharan & Popel Reference Sharan and Popel2001). Smith et al. (Reference Smith, Long, Damiano and Ley2003) and Long et al. (Reference Long, Smith, Pries, Ley and Damiano2004) have also fitted velocity profiles from in vivo experimental data obtained using microparticle image velocimetry data. This allowed them to deduce information about the EGL thickness, as well as to deduce viscosity profiles in the lumen.
$20~{\rm\mu}\text{m}$
in diameter, this has led to the development of two-layer viscosity models as an alternative to explicitly considering the presence of red blood cells (Pries et al.
Reference Pries, Secomb, Gessner, Sperandio, Gross and Gaehtgens1994). In such models, the fluid within the lumen consists of a high-viscosity core to capture the presence of red blood cells, and a lower-viscosity outer (or cell-depleted) region. A modification of this two-layer model treats the viscosity of the cell-depleted layer as initially unknown, and larger in magnitude than that of blood plasma alone. This factors in the occasional intrusion of red blood cells into the cell-depleted layer (Sharan & Popel Reference Sharan and Popel2001). Smith et al. (Reference Smith, Long, Damiano and Ley2003) and Long et al. (Reference Long, Smith, Pries, Ley and Damiano2004) have also fitted velocity profiles from in vivo experimental data obtained using microparticle image velocimetry data. This allowed them to deduce information about the EGL thickness, as well as to deduce viscosity profiles in the lumen.
The cell-depleted layer forms when there is sufficient flow through the vessel. However, when this flow is especially slow or arrested, the effective radius of the red blood cells increases, such that they can penetrate into the EGL. Then, when the flow again increases, the red blood cells can pop out of the EGL (Vink & Duling Reference Vink and Duling1996). Complete consideration of such effects requires modelling of the red blood cells as elastic bodies, although Feng & Weinbaum (Reference Feng and Weinbaum2000) were able to describe the essential role of lubrication pressures in the EGL by considering a planar cell geometry. Secomb, Hsu & Pries (Reference Secomb, Hsu and Pries2001) subsequently developed a model that included membrane resistance and elastic bending resistance to shear deformations of the cell. This allowed them to consider a wide range of red blood cells under various velocity conditions, and to illustrate their effects on red blood cell deformation.
Other EGL models have been used to predict the deformation of the EGL in the wake of a leukocyte (Damiano & Stace Reference Damiano and Stace2005) and finite-strain deformation of the EGL (Han et al. Reference Han, Weinbaum, Spaan and Vimk2006). However, the models of EGL-lined microvessels to date have typically assumed idealised geometries, for example axisymmetric tubes with a circular cross-section, sinusoidal undulations or two-dimensional channels. While these undoubtedly provide some important initial insights into the dominant dynamics within the EGL, our intention here is to investigate three-dimensional vessel geometries that are informed by biological data. In what follows, we first demonstrate the ability of a low-permeability EGL model to well approximate the hydrodynamics of the EGL. Using this model, we then predict the fluid and solid shear stresses exerted upon the endothelium for a selection of EGL configurations. In doing so, it is hoped that we will be able to inform the current discussion around the impact of EGL redistribution and mechanical transduction through the EGL.
2 Model formulation
A schematic of the model geometry is shown in figure 1. Blood flows through a tube that is lined by endothelial cells, making its surface topology non-uniform. In what follows, we represent this endothelial surface by
 $S_{w}$
. It is assumed to be rigid and non-permeable. The region bounded by this endothelial surface, and through which blood flows, can be divided into two parts, regions I and II. Region I is the vessel lumen through which blood flows unhindered, and its volume will denoted by
$S_{w}$
. It is assumed to be rigid and non-permeable. The region bounded by this endothelial surface, and through which blood flows, can be divided into two parts, regions I and II. Region I is the vessel lumen through which blood flows unhindered, and its volume will denoted by
 $V_{l}$
. Region II is the EGL, which we model as a porous medium, and has volume denoted as
$V_{l}$
. Region II is the EGL, which we model as a porous medium, and has volume denoted as
 $V_{e}$
. These two regions are separated by the surface
$V_{e}$
. These two regions are separated by the surface
 $S_{i}$
which forms the interface between the blood flow within the lumen and that within the EGL. The ends of the domain are bounded by inlet and outlet surfaces
$S_{i}$
which forms the interface between the blood flow within the lumen and that within the EGL. The ends of the domain are bounded by inlet and outlet surfaces
 $\mathscr{S}_{0}$
and
$\mathscr{S}_{0}$
and
 $\mathscr{S}_{\infty }$
respectively.
$\mathscr{S}_{\infty }$
respectively.

Figure 1. Diagrams showing the geometry. We modelled a microvessel as a tube with a non-uniform wall shape, due to the presence of endothelial cells and the EGL. The vessel itself can be divided into two regions, Region I is the free lumen (represented by the volume
 $V_{l}$
). Region II is the porous EGL, which is represented by the volume
$V_{l}$
). Region II is the porous EGL, which is represented by the volume
 $V_{e}$
. These two regions are separated by the surface
$V_{e}$
. These two regions are separated by the surface
 $S_{i}$
, which forms the interface between the two regions. The apical side of the endothelium is represented by the surface
$S_{i}$
, which forms the interface between the two regions. The apical side of the endothelium is represented by the surface
 $S_{w}$
. We consider two possible EGL distributions. (a) Model A: the EGL has redistributed to the relatively flat regions between cell nuclei. The minimum EGL thickness,
$S_{w}$
. We consider two possible EGL distributions. (a) Model A: the EGL has redistributed to the relatively flat regions between cell nuclei. The minimum EGL thickness,
 $t_{min}$
, occurs at the top of the endothelial cells. (b) Model B: the non-redistributed EGL, which has constant thickness
$t_{min}$
, occurs at the top of the endothelial cells. (b) Model B: the non-redistributed EGL, which has constant thickness
 $t_{min}$
with respect to the endothelial cells.
$t_{min}$
with respect to the endothelial cells.
Following earlier studies, for example, Wei et al. (Reference Wei, Waters, Liu and Grotberg2003), we model the fluid flowing through the vessel as an incompressible Newtonian fluid with no body forces. This is effectively modelling the blood plasma, which can be considered as a Newtonian fluid, since for vessels at these scales blood cells need to be modelled explicitly (following several earlier studies, we focus here upon the blood plasma alone). The density of blood plasma,
 ${\it\rho}_{l}$
, is roughly of the order of that of water, and so
${\it\rho}_{l}$
, is roughly of the order of that of water, and so
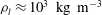 ${\it\rho}_{l}\approx 10^{3}~\text{kg}~\text{m}^{-3}$
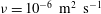
. Similarly, its viscosity
${\it\rho}_{l}\approx 10^{3}~\text{kg}~\text{m}^{-3}$
. Similarly, its viscosity
 ${\it\mu}_{l}\approx 10^{-3}~\text{Pa}~\text{s}$
.
${\it\mu}_{l}\approx 10^{-3}~\text{Pa}~\text{s}$
.
The characteristic length of the microvessel is
 $L$
, and its average radius is
$L$
, and its average radius is
 $R\sim 30~{\rm\mu}\text{m}$
. In what follows, all distances will be non-dimensionalised on this radius, i.e.
$R\sim 30~{\rm\mu}\text{m}$
. In what follows, all distances will be non-dimensionalised on this radius, i.e.
 $\boldsymbol{x}=\boldsymbol{x}^{\ast }/R$
. A typical velocity for flow through the vessel is
$\boldsymbol{x}=\boldsymbol{x}^{\ast }/R$
. A typical velocity for flow through the vessel is
 $U=1~\text{mm}~\text{s}^{-1}$
(Long et al.
Reference Long, Smith, Pries, Ley and Damiano2004). Using these values, we find that the Reynolds number is
$U=1~\text{mm}~\text{s}^{-1}$
(Long et al.
Reference Long, Smith, Pries, Ley and Damiano2004). Using these values, we find that the Reynolds number is
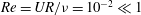 $Re=UR/{\it\nu}=10^{-2}\ll 1$
(where
$Re=UR/{\it\nu}=10^{-2}\ll 1$
(where
 ${\it\nu}=10^{-6}~\text{m}^{2}~\text{s}^{-1}$
is the kinematic viscosity of blood plasma, assumed here to be similar to that of water). Hence, the flow in both the lumen and the EGL can be assumed to be linear.
${\it\nu}=10^{-6}~\text{m}^{2}~\text{s}^{-1}$
is the kinematic viscosity of blood plasma, assumed here to be similar to that of water). Hence, the flow in both the lumen and the EGL can be assumed to be linear.
2.1 Region I: the lumen
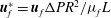
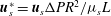
In the lumen, we non-dimensionalise flow velocities by
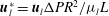 $\boldsymbol{u}_{l}^{\ast }=\boldsymbol{u}_{l}{\rm\Delta}PR^{2}/{\it\mu}_{l}L$
, where
$\boldsymbol{u}_{l}^{\ast }=\boldsymbol{u}_{l}{\rm\Delta}PR^{2}/{\it\mu}_{l}L$
, where
 ${\rm\Delta}P$
is the average pressure drop between the inlet and the outlet of the microvessel, and lumen pressures and stresses by
${\rm\Delta}P$
is the average pressure drop between the inlet and the outlet of the microvessel, and lumen pressures and stresses by
 $P_{l}^{\ast }=P_{l}{\rm\Delta}PR/L$
,
$P_{l}^{\ast }=P_{l}{\rm\Delta}PR/L$
,
 ${\bf\sigma}_{l}^{\ast }={\bf\sigma}_{l}{\rm\Delta}PR/L$
. Under these non-dimensionalisations, the flow in the lumen,
${\bf\sigma}_{l}^{\ast }={\bf\sigma}_{l}{\rm\Delta}PR/L$
. Under these non-dimensionalisations, the flow in the lumen,
 $V_{l}$
, satisfies Stokes flow,
$V_{l}$
, satisfies Stokes flow,
 $$\begin{eqnarray}\displaystyle {\rm\nabla}^{2}\boldsymbol{u}_{l}=\boldsymbol{{\rm\nabla}}P_{l},\quad \boldsymbol{{\rm\nabla}}\boldsymbol{\cdot }\boldsymbol{u}_{l},=0. & & \displaystyle\end{eqnarray}$$
This flow can be expressed in the following boundary integral form (Pozrikidis Reference Pozrikidis2002):
 $$\begin{eqnarray}\displaystyle (u_{l}(\boldsymbol{x}_{0}))_{j} & = & \displaystyle -\frac{1}{4{\rm\pi}}\int _{\mathscr{S}_{1}}f_{i}(\boldsymbol{x})\,G_{ij}^{(1)}(\boldsymbol{x}-\boldsymbol{x}_{0})\,\text{d}S(\boldsymbol{x})\nonumber\\ \displaystyle & & \displaystyle +\,\frac{1}{4{\rm\pi}}\unicode[STIX]{x2A0D}_{\mathscr{S}_{1}}(u_{l}(\boldsymbol{x}))_{i}\,T_{ijk}^{(1)}(\boldsymbol{x}-\boldsymbol{x}_{0})n_{k}(\boldsymbol{x})\,\text{d}S(\boldsymbol{x}),\end{eqnarray}$$
(with repeated indices denoting summation). The symbol
 $\unicode[STIX]{x2A0D}$
denotes that the second integral is defined in the sense of a Cauchy principal integral, and
$\unicode[STIX]{x2A0D}$
denotes that the second integral is defined in the sense of a Cauchy principal integral, and
 $i,j,k=1,\ldots ,3$
. Here,
$i,j,k=1,\ldots ,3$
. Here,
 $\boldsymbol{x}_{0}\in \mathscr{S}_{1}$
, where
$\boldsymbol{x}_{0}\in \mathscr{S}_{1}$
, where
 $\mathscr{S}_{1}$
represents the entire surface bounding region I. The unit normal vector in this equation,
$\mathscr{S}_{1}$
represents the entire surface bounding region I. The unit normal vector in this equation,
 $\boldsymbol{n}$
, is taken to be the inward pointing normal. Moreover,
$\boldsymbol{n}$
, is taken to be the inward pointing normal. Moreover,
 $\boldsymbol{f}(\boldsymbol{x})={\bf\sigma}_{\boldsymbol{l}}\boldsymbol{\cdot }\boldsymbol{n}$
is the traction vector, and
$\boldsymbol{f}(\boldsymbol{x})={\bf\sigma}_{\boldsymbol{l}}\boldsymbol{\cdot }\boldsymbol{n}$
is the traction vector, and
 $G_{ij}^{(1)}$
and
$G_{ij}^{(1)}$
and
 $T_{ijk}^{(1)}$
are the three-dimensional Stokeslet and stresslet for Stokes flow respectively, as given by Pozrikidis (Reference Pozrikidis2002).
$T_{ijk}^{(1)}$
are the three-dimensional Stokeslet and stresslet for Stokes flow respectively, as given by Pozrikidis (Reference Pozrikidis2002).
The above formulation assumes that only plasma flows through the lumen, which may be intermittently the case in capillaries, where red blood cells flow through in single file. However, in larger microvessels such as postcapillary venules, multiple red blood cells may be present at any point along the vessel. A cell-depleted layer has been observed in such vessels, where the concentration of red blood cells is low (Kim et al. Reference Kim, Kong, Popel, Intaglietta and Johnson2007). This has led to the development of two-layer models. These two-layer models involve prescribing a spatially varying viscosity, which takes larger values in the core of the lumen where red blood cells are present, and a lower value in the cell-depleted layer close to the vessel wall. Such models have been shown to well approximate the experimentally observed distribution of red blood cells in the vessel (Pries et al. Reference Pries, Secomb, Gessner, Sperandio, Gross and Gaehtgens1994). We will present some results where such a two-layer viscosity profile has been used, in order to gauge the potential influence of red blood cells in the lumen upon the EGL’s impact. We use the model of Sharan & Popel (Reference Sharan and Popel2001), where the viscosity in the cell depletion layer is an emergent quantity, and is greater than that of plasma alone, due to the occasional intrusion of red blood cells into this depletion layer. Although Sharan & Popel (Reference Sharan and Popel2001) developed their two-layer model in the absence of an EGL, we shall see that in the low-permeability physiological regime, the lumen flow at the EGL interface satisfies the same conditions as on a solid surface (see 3.1), at leading order. As such, we take the thickness of the cell-depleted layer to be independent of the depth of the EGL.
2.2 Region II: the EGL
Region II consists of the EGL, which is a porous medium that allows vessel fluid to flow through it, but not freely. We model the poroelastohydrodynamics in the EGL using biphasic mixture theory (Drew Reference Drew1983; Ehlers & Bluhm Reference Ehlers and Bluhm2002; Kolev Reference Kolev2002), which consists of a fluid phase and a solid phase. We shall consider each phase in turn.
2.2.1 Fluid phase
Since elastic velocities can be assumed to be small in this setting, the fluid phase of the EGL can be modelled using Brinkman’s equations (Hariprasad & Secomb Reference Hariprasad and Secomb2012). Non-dimensionalising volume-averaged flow velocities in the EGL according to
 $\boldsymbol{u}_{f}^{\ast }=\boldsymbol{u}_{f}{\rm\Delta}PR^{2}/{\it\mu}_{f}L$
, and pressures and stresses by
$\boldsymbol{u}_{f}^{\ast }=\boldsymbol{u}_{f}{\rm\Delta}PR^{2}/{\it\mu}_{f}L$
, and pressures and stresses by
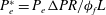 $P_{e}^{\ast }=P_{e}{\rm\Delta}PR/{\it\phi}_{f}L$
,
$P_{e}^{\ast }=P_{e}{\rm\Delta}PR/{\it\phi}_{f}L$
,
 ${\bf\sigma}_{f}^{\ast }={\bf\sigma}_{f}{\rm\Delta}PR/L$
(where
${\bf\sigma}_{f}^{\ast }={\bf\sigma}_{f}{\rm\Delta}PR/L$
(where
 ${\it\phi}_{f}$
is the fluid fraction in the EGL), the flow equations in the EGL consequently take the non-dimensional form
${\it\phi}_{f}$
is the fluid fraction in the EGL), the flow equations in the EGL consequently take the non-dimensional form
 $$\begin{eqnarray}\displaystyle {\rm\nabla}^{2}\boldsymbol{u}_{f}-{\it\lambda}^{2}\boldsymbol{u}_{f}=\boldsymbol{{\rm\nabla}}P_{e},\quad \boldsymbol{{\rm\nabla}}\boldsymbol{\cdot }\boldsymbol{u}_{f}=0, & & \displaystyle\end{eqnarray}$$
where
 ${\it\lambda}^{2}=R^{2}/K_{P}$
,
${\it\lambda}^{2}=R^{2}/K_{P}$
,
 $K_{P}$
is the Darcy permeability within the EGL and
$K_{P}$
is the Darcy permeability within the EGL and
 ${\it\mu}_{f}$
is the dynamic viscosity of the fluid in the EGL. (Weinbaum et al. (Reference Weinbaum, Zhang, Yuefeng Han and Cowin2003) give an expression for the permeability in terms of the radius and spacing of the core proteins in the EGL’s ultrastructure.) We shall use
${\it\mu}_{f}$
is the dynamic viscosity of the fluid in the EGL. (Weinbaum et al. (Reference Weinbaum, Zhang, Yuefeng Han and Cowin2003) give an expression for the permeability in terms of the radius and spacing of the core proteins in the EGL’s ultrastructure.) We shall use
 ${\it\delta}$
to denote a characteristic EGL thickness.
${\it\delta}$
to denote a characteristic EGL thickness.
As was the case for Stokes flow in the lumen, there is a boundary integral representation for Brinkman flow in the EGL (Pozrikidis Reference Pozrikidis1992),
 $$\begin{eqnarray}\displaystyle (u_{f}(\boldsymbol{x}_{0}))_{j} & = & \displaystyle -\frac{1}{4{\rm\pi}}\int _{\mathscr{S}_{2}}g_{i}(\boldsymbol{x})\,G_{ij}^{(2)}(\boldsymbol{x}-\boldsymbol{x}_{0})\,\text{d}S(\boldsymbol{x})\nonumber\\ \displaystyle & & \displaystyle +\,\frac{1}{4{\rm\pi}}\unicode[STIX]{x2A0D}_{\mathscr{S}_{2}}(u_{f}(\boldsymbol{x}))_{i}\,T_{ijk}^{(2)}(\boldsymbol{x}-\boldsymbol{x}_{0})n_{k}(\boldsymbol{x})\,\text{d}S(\boldsymbol{x}),\end{eqnarray}$$
where
 $G_{ij}^{(2)}$
and
$G_{ij}^{(2)}$
and
 $T_{ij}^{(2)}$
are the Brinkman flow Stokeslet and stresslet respectively, as given by Pozrikidis (Reference Pozrikidis1992), and
$T_{ij}^{(2)}$
are the Brinkman flow Stokeslet and stresslet respectively, as given by Pozrikidis (Reference Pozrikidis1992), and
 $\boldsymbol{g}(\boldsymbol{x})={\bf\sigma}_{\boldsymbol{f}}\boldsymbol{\cdot }\boldsymbol{n}$
. Here,
$\boldsymbol{g}(\boldsymbol{x})={\bf\sigma}_{\boldsymbol{f}}\boldsymbol{\cdot }\boldsymbol{n}$
. Here,
 $\boldsymbol{x}_{0}\in \mathscr{S}_{2}$
, where
$\boldsymbol{x}_{0}\in \mathscr{S}_{2}$
, where
 $\mathscr{S}_{2}$
represents the entire surface bounding region II.
$\mathscr{S}_{2}$
represents the entire surface bounding region II.
2.2.2 Solid phase
The solid phase of the EGL can be modelled as a linear elastic solid with extra forcing terms due to momentum transfer between the two phases (Damiano et al.
Reference Damiano, Duling, Ley and Skalak1996). Non-dimensionalising the solid displacements in the EGL according to
 $\boldsymbol{u}_{s}^{\ast }=\boldsymbol{u}_{s}{\rm\Delta}PR^{2}/{\it\mu}_{s}L$
and the stresses by
$\boldsymbol{u}_{s}^{\ast }=\boldsymbol{u}_{s}{\rm\Delta}PR^{2}/{\it\mu}_{s}L$
and the stresses by
 ${\bf\sigma}_{s}^{\ast }={\bf\sigma}_{s}{\rm\Delta}PR/L$
, Navier’s equation in the EGL takes the form
${\bf\sigma}_{s}^{\ast }={\bf\sigma}_{s}{\rm\Delta}PR/L$
, Navier’s equation in the EGL takes the form
 $$\begin{eqnarray}\frac{1}{1-2{\it\nu}}\boldsymbol{{\rm\nabla}}(\boldsymbol{{\rm\nabla}}\boldsymbol{\cdot }\boldsymbol{u}_{s})+{\rm\nabla}^{2}\boldsymbol{u}_{s}=\frac{{\it\phi}_{s}}{{\it\phi}_{f}}\boldsymbol{{\rm\nabla}}P_{e}-{\it\lambda}^{2}\boldsymbol{u}_{f},\end{eqnarray}$$
where
 ${\it\nu}$
is the Poisson’s ratio of the solid phase of the EGL. The pressure forcing on the right-hand side of (2.5) arises due to the presence of the fluid phase in the EGL, and the fluid velocity forcing arises due to momentum transfer between the two phases.
${\it\nu}$
is the Poisson’s ratio of the solid phase of the EGL. The pressure forcing on the right-hand side of (2.5) arises due to the presence of the fluid phase in the EGL, and the fluid velocity forcing arises due to momentum transfer between the two phases.
As before, there is a boundary integral representation for Navier’s equation, with
 $$\begin{eqnarray}\displaystyle (u_{s}(\boldsymbol{x}_{0}))_{j} & = & \displaystyle -\frac{1}{8{\rm\pi}(1-{\it\nu})}\int _{\mathscr{S}_{2}}h_{i}(\boldsymbol{x})\,G_{ij}^{(3)}(\boldsymbol{x}-\boldsymbol{x}_{0})\,\text{d}S(\boldsymbol{x})\nonumber\\ \displaystyle & & \displaystyle +\,\frac{1}{8{\rm\pi}(1-{\it\nu})}\unicode[STIX]{x2A0D}_{\mathscr{S}_{2}}(u_{s}(\boldsymbol{x}))_{i}\,T_{ijk}^{(3)}(\boldsymbol{x}-\boldsymbol{x}_{0})n_{k}(\boldsymbol{x})\,\text{d}S(\boldsymbol{x})\nonumber\\ \displaystyle & & \displaystyle -\,\frac{(1-2{\it\nu}){\it\phi}_{s}}{8{\rm\pi}(1-{\it\nu}){\it\phi}_{f}}\int _{\mathscr{S}_{2}}\frac{\partial P_{e}}{\partial \boldsymbol{n}}(\boldsymbol{x})\frac{(\boldsymbol{x}-\boldsymbol{x}_{0})_{j}}{r}\,\text{d}S(\boldsymbol{x})\nonumber\\ \displaystyle & & \displaystyle -\,\frac{(1-{\it\nu}){\it\phi}_{s}}{4{\rm\pi}(1-{\it\nu}){\it\phi}_{f}}\int _{\mathscr{S}_{2}}P_{e}(\boldsymbol{x})\left(\frac{{\it\delta}_{jk}}{r}+\frac{(\boldsymbol{x}-\boldsymbol{x}_{0})_{j}(\boldsymbol{x}-\boldsymbol{x}_{0})_{k}}{r^{3}}\right)n_{k}\,\text{d}S(\boldsymbol{x})\nonumber\\ \displaystyle & & \displaystyle -\,\frac{{\it\lambda}^{2}}{8{\rm\pi}(1-{\it\nu})}\int _{\mathscr{S}_{2}}f_{i}(\boldsymbol{x})\,G_{ij}^{(4)}(\boldsymbol{x}-\boldsymbol{x}_{0})\,\text{d}S(\boldsymbol{x})\nonumber\\ \displaystyle & & \displaystyle +\,\frac{{\it\lambda}^{2}}{8{\rm\pi}(1-{\it\nu})}\int _{\mathscr{S}_{2}}(u_{f}(\boldsymbol{x}))_{i}\,T_{ijk}^{(4)}(\boldsymbol{x}-\boldsymbol{x}_{0})n_{k}(\boldsymbol{x})\,\text{d}S(\boldsymbol{x}),\end{eqnarray}$$
where
 $G_{ij}^{(3)}$
and
$G_{ij}^{(3)}$
and
 $T_{ij}^{(3)}$
are the linear elasticity Green’s functions, as given by Pozrikidis (Reference Pozrikidis2002),
$T_{ij}^{(3)}$
are the linear elasticity Green’s functions, as given by Pozrikidis (Reference Pozrikidis2002),
 $\boldsymbol{h}(\boldsymbol{x})={\bf\sigma}_{\boldsymbol{s}}\boldsymbol{\cdot }\boldsymbol{n}$
, and
$\boldsymbol{h}(\boldsymbol{x})={\bf\sigma}_{\boldsymbol{s}}\boldsymbol{\cdot }\boldsymbol{n}$
, and
 $G_{ij}^{(4)}$
and
$G_{ij}^{(4)}$
and
 $T_{ij}^{(4)}$
are given by Sumets et al. (Reference Sumets, Cater, Long and Clarke2015). The forcing terms have been converted to boundary integrals using the approach developed by Sumets et al. (Reference Sumets, Cater, Long and Clarke2015).
$T_{ij}^{(4)}$
are given by Sumets et al. (Reference Sumets, Cater, Long and Clarke2015). The forcing terms have been converted to boundary integrals using the approach developed by Sumets et al. (Reference Sumets, Cater, Long and Clarke2015).
2.3 Boundary conditions
The flow boundary conditions on the surface of the endothelium, which is assumed to be impermeable and stationary, are the usual no-slip and no-penetration conditions
 $$\begin{eqnarray}\boldsymbol{u}_{f}=\mathbf{0}\quad \text{on }S_{w}.\end{eqnarray}$$
Similarly, the solid phase is assumed to be attached to the endothelium, and so the solid phase is assumed to have no displacement on the surface of the endothelium,
 $$\begin{eqnarray}\boldsymbol{u}_{s}=\mathbf{0}\quad \text{on }S_{w}.\end{eqnarray}$$
The flow boundary conditions on the interface between the EGL and the lumen are as those given in Damiano et al. (Reference Damiano, Long, El-Khatib and Stace2004). Specifically, the homogenised velocity (fluid and solid velocity weighted by their respective volume fractions) is assumed to be continuous across the interface,
 $$\begin{eqnarray}{\it\phi}_{f}\boldsymbol{u}_{f}+{\it\phi}_{s}\dot{\boldsymbol{u}}_{s}=\boldsymbol{u}_{l}\quad \text{on }S_{i}.\end{eqnarray}$$
Under the assumption that we can neglect the elastic velocities (which are very small in this context), as we did in the momentum transfer terms, this leads to our second boundary condition for the fluid phase,
 $$\begin{eqnarray}{\it\phi}_{f}\boldsymbol{u}_{f}=\boldsymbol{u}_{l}\quad \text{on }S_{i}.\end{eqnarray}$$
The traction on the interface is shared between the two phases according to the volume fractions. For the fluid phase, this gives
 $$\begin{eqnarray}{\bf\sigma}_{f}\boldsymbol{\cdot }\boldsymbol{n}={\it\phi}_{f}{\bf\sigma}_{l}\boldsymbol{\cdot }\boldsymbol{n}\quad \text{on }S_{i},\end{eqnarray}$$
where
 ${\bf\sigma}_{l}=-P_{l}\unicode[STIX]{x1D644}+(\boldsymbol{{\rm\nabla}}\boldsymbol{u}_{l}+(\boldsymbol{{\rm\nabla}}\boldsymbol{u}_{l})^{\text{T}})$
and
${\bf\sigma}_{l}=-P_{l}\unicode[STIX]{x1D644}+(\boldsymbol{{\rm\nabla}}\boldsymbol{u}_{l}+(\boldsymbol{{\rm\nabla}}\boldsymbol{u}_{l})^{\text{T}})$
and
 ${\bf\sigma}_{f}=-P_{e}\unicode[STIX]{x1D644}+(\boldsymbol{{\rm\nabla}}\boldsymbol{u}_{f}+(\boldsymbol{{\rm\nabla}}\boldsymbol{u}_{f})^{\text{T}})$
(T denotes a transpose) are the stress tensors for flow within the lumen and the EGL respectively,
${\bf\sigma}_{f}=-P_{e}\unicode[STIX]{x1D644}+(\boldsymbol{{\rm\nabla}}\boldsymbol{u}_{f}+(\boldsymbol{{\rm\nabla}}\boldsymbol{u}_{f})^{\text{T}})$
(T denotes a transpose) are the stress tensors for flow within the lumen and the EGL respectively,
 $\unicode[STIX]{x1D644}$
is the
$\unicode[STIX]{x1D644}$
is the
 $3\times 3$
identity matrix and
$3\times 3$
identity matrix and
 $\boldsymbol{n}$
is the inward unit normal to the surface
$\boldsymbol{n}$
is the inward unit normal to the surface
 $S_{i}$
for each region respectively. Similarly, for the solid phase this gives
$S_{i}$
for each region respectively. Similarly, for the solid phase this gives
 $$\begin{eqnarray}\left({\bf\sigma}_{s}-\frac{{\it\phi}_{s}}{{\it\phi}_{f}}P_{e}\unicode[STIX]{x1D644}\right)\boldsymbol{\cdot }\boldsymbol{n}={\it\phi}_{s}{\bf\sigma}_{l}\boldsymbol{\cdot }\boldsymbol{n}\quad \text{on }S_{i},\end{eqnarray}$$
where
 ${\bf\sigma}_{s}=2{\it\nu}/(1-2{\it\nu})(\boldsymbol{{\rm\nabla}}\boldsymbol{\cdot }\boldsymbol{u}_{s})\unicode[STIX]{x1D644}+(\boldsymbol{{\rm\nabla}}\boldsymbol{u}_{s}+(\boldsymbol{{\rm\nabla}}\boldsymbol{u}_{s})^{\text{T}})$
is the stress tensor of a linear elastic solid and
${\bf\sigma}_{s}=2{\it\nu}/(1-2{\it\nu})(\boldsymbol{{\rm\nabla}}\boldsymbol{\cdot }\boldsymbol{u}_{s})\unicode[STIX]{x1D644}+(\boldsymbol{{\rm\nabla}}\boldsymbol{u}_{s}+(\boldsymbol{{\rm\nabla}}\boldsymbol{u}_{s})^{\text{T}})$
is the stress tensor of a linear elastic solid and
 ${\bf\sigma}_{s}-({\it\phi}_{s}/{\it\phi}_{f})P_{e}\unicode[STIX]{x1D644}$
is the total stress tensor of the solid phase of the EGL. Combination of (2.11) and (2.12) gives
${\bf\sigma}_{s}-({\it\phi}_{s}/{\it\phi}_{f})P_{e}\unicode[STIX]{x1D644}$
is the total stress tensor of the solid phase of the EGL. Combination of (2.11) and (2.12) gives
 $({\bf\sigma}_{f}+{\bf\sigma}_{s}-({\it\phi}_{s}/{\it\phi}_{f})P_{e}\unicode[STIX]{x1D644})\boldsymbol{\cdot }\boldsymbol{n}={\bf\sigma}_{l}\boldsymbol{\cdot }\boldsymbol{n}$
, which shows that the total traction of the biphasic mixture balances the traction exerted on the interface by the fluid flow inside the lumen.
$({\bf\sigma}_{f}+{\bf\sigma}_{s}-({\it\phi}_{s}/{\it\phi}_{f})P_{e}\unicode[STIX]{x1D644})\boldsymbol{\cdot }\boldsymbol{n}={\bf\sigma}_{l}\boldsymbol{\cdot }\boldsymbol{n}$
, which shows that the total traction of the biphasic mixture balances the traction exerted on the interface by the fluid flow inside the lumen.
We are also required to specify flow conditions on the inlet,
 $\mathscr{S}_{0}$
, and outlet,
$\mathscr{S}_{0}$
, and outlet,
 $\mathscr{S}_{\infty }$
, surfaces,
$\mathscr{S}_{\infty }$
, surfaces,
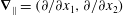
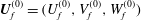
 $$\begin{eqnarray}\boldsymbol{u}(\mathscr{S}_{0})=\boldsymbol{U}_{0},\quad \boldsymbol{u}(\mathscr{S}_{\infty })=\boldsymbol{U}_{1},\end{eqnarray}$$
where here
 $\boldsymbol{u}$
represents either
$\boldsymbol{u}$
represents either
 $\boldsymbol{u}_{l}$
or
$\boldsymbol{u}_{l}$
or
 $\boldsymbol{u}_{f}$
, depending upon whether
$\boldsymbol{u}_{f}$
, depending upon whether
 $\mathscr{S}_{0}$
or
$\mathscr{S}_{0}$
or
 $\mathscr{S}_{\infty }$
intersects region I or II respectively. See (4.1) in § 4.1 for the form of these inlet and outlet conditions.
$\mathscr{S}_{\infty }$
intersects region I or II respectively. See (4.1) in § 4.1 for the form of these inlet and outlet conditions.
Similarly, we specify displacement conditions on the portions of the inlet and outlet surfaces that intersect with the EGL,
 $\mathscr{S}_{0}^{\prime }$
and
$\mathscr{S}_{0}^{\prime }$
and
 $\mathscr{S}_{\infty }^{\prime }$
respectively,
$\mathscr{S}_{\infty }^{\prime }$
respectively,
 $$\begin{eqnarray}\boldsymbol{u}_{s}(\mathscr{S}_{0}^{\prime })=\boldsymbol{V}_{0},\quad \boldsymbol{u}_{s}(\mathscr{S}_{\infty }^{\prime })=\boldsymbol{V}_{1}.\end{eqnarray}$$
We prescribe specific forms for these displacements in (4.2).
3 Low-permeability limit (
 ${\it\lambda}\gg 1$
)
${\it\lambda}\gg 1$
)

When the EGL has very low permeability,
 ${\it\lambda}\gg 1$
, we expect viscous effects to be confined to thin layers close to solid surfaces and interfaces. Consequently, numerical treatment of the full flow equations (2.2) and (2.4) becomes challenging and expensive. Hence, in this regime we pursue a complementary asymptotic description of the poroelastohydrodynamics. We begin in §§ 3.1 and 3.2 by considering the flows in the lumen and fluid phase of the EGL, before treating the solid phase of the EGL in § 3.3. Finally, we consider a two-layer viscosity model for the flow in the lumen in § 3.4.
${\it\lambda}\gg 1$
, we expect viscous effects to be confined to thin layers close to solid surfaces and interfaces. Consequently, numerical treatment of the full flow equations (2.2) and (2.4) becomes challenging and expensive. Hence, in this regime we pursue a complementary asymptotic description of the poroelastohydrodynamics. We begin in §§ 3.1 and 3.2 by considering the flows in the lumen and fluid phase of the EGL, before treating the solid phase of the EGL in § 3.3. Finally, we consider a two-layer viscosity model for the flow in the lumen in § 3.4.
3.1 Lumen
In the lumen, we approximate the flow velocity and pressure by the following expansion (where we are required go to
 $O({\it\lambda}^{-2})$
in
$O({\it\lambda}^{-2})$
in
 $\boldsymbol{u}_{l}$
in order to satisfy the continuity of velocity conditions):
$\boldsymbol{u}_{l}$
in order to satisfy the continuity of velocity conditions):
 $$\begin{eqnarray}\boldsymbol{u}_{l}=\boldsymbol{u}_{l}^{(0)}+{\it\lambda}^{-1}\boldsymbol{u}_{l}^{(1)}+{\it\lambda}^{-2}\boldsymbol{u}_{l}^{(2)}+O({\it\lambda}^{-3}),\quad P_{l}=P_{l}^{(0)}+{\it\lambda}^{-1}P_{l}^{(1)}+O({\it\lambda}^{-2}),\end{eqnarray}$$
where (
 $i=1,\ldots ,3$
)
$i=1,\ldots ,3$
)
 $$\begin{eqnarray}\mathbf{0}=-\boldsymbol{{\rm\nabla}}P^{(i)}+{\rm\nabla}^{2}\boldsymbol{u}^{(i)}.\end{eqnarray}$$
As we shall see from the scalings in the EGL, leading-order flow is required to satisfy homogeneous boundary conditions,
 $$\begin{eqnarray}\boldsymbol{u}^{(0)}(S_{i})=\mathbf{0}.\end{eqnarray}$$
Moreover, the first-order flow correction must satisfy no-penetration conditions at the interface,
 $$\begin{eqnarray}\boldsymbol{u}^{(1)}(S_{i})\boldsymbol{\cdot }\boldsymbol{n}=0.\end{eqnarray}$$
However, as will be shown in § 3.2.3, non-zero tangential components at the interface are driven by flows within a viscous layer adjacent to the lumen–EGL interface.
3.2 EGL: fluid phase
The flow in the EGL can be considered to consist of three distinct asymptotic regions: (i) a core flow, which is governed by pressure (i.e. a Darcy flow, where viscous effects are negligible); (ii) a thin viscous region adjacent to the endothelium, which ensures that the no-slip condition is satisfied; (iii) a thin viscous region adjacent to the lumen–EGL interface, where continuity of traction is enforced. We consider each of these regions in turn below.
3.2.1 EGL core
In the fluid phase of the EGL core, we rescale according to
 $$\begin{eqnarray}\displaystyle \boldsymbol{u}_{f}={\it\lambda}^{-2}\boldsymbol{u}_{f}^{(0)}+O({\it\lambda}^{-3}),\quad P=P_{e}^{(0)}+O({\it\lambda}^{-1}). & & \displaystyle\end{eqnarray}$$
The leading-order flow in the EGL is consequently governed by Darcy’s equations,
 $$\begin{eqnarray}\displaystyle \boldsymbol{u}_{f}^{(0)}=-\boldsymbol{{\rm\nabla}}P_{e}^{(0)},\quad \boldsymbol{{\rm\nabla}}\boldsymbol{\cdot }\boldsymbol{u}_{f}^{(0)}=0. & & \displaystyle\end{eqnarray}$$
This flow is entirely driven by the kinematics, and can be reformulated in terms of pressure alone. Taking the divergence of the momentum equation yields
 $$\begin{eqnarray}\displaystyle {\rm\nabla}^{2}P_{e}^{(0)}=0. & & \displaystyle\end{eqnarray}$$
On the endothelial surface, we can satisfy the impermeability condition
 $$\begin{eqnarray}\displaystyle \boldsymbol{{\rm\nabla}}P_{e}^{(0)}(S_{w})\boldsymbol{\cdot }\boldsymbol{n}=0, & & \displaystyle\end{eqnarray}$$
but not the no-slip condition. Enforcement of this condition also necessitates the presence of another thin viscous region, this time adjacent to
 $S_{w}$
.
$S_{w}$
.
The pressure problem described in (3.7)–(3.8) can also be formulated in the well-known boundary integral form for a harmonic function:
 $$\begin{eqnarray}\displaystyle p(\boldsymbol{x}_{0})=\int _{\mathscr{S}_{2}}\boldsymbol{{\rm\nabla}}p(\boldsymbol{x})\boldsymbol{\cdot }\boldsymbol{n}(\boldsymbol{x})G(\boldsymbol{x},\boldsymbol{x}_{0})\,\text{d}S(\boldsymbol{x})-\unicode[STIX]{x2A0D}_{\mathscr{S}_{2}}\boldsymbol{{\rm\nabla}}G(\boldsymbol{x},\boldsymbol{x}_{0})\boldsymbol{\cdot }\boldsymbol{n}(\boldsymbol{x})p(\boldsymbol{x})\,\text{d}S(\boldsymbol{x}), & & \displaystyle\end{eqnarray}$$
where
 $\boldsymbol{x}_{0}\in \mathscr{S}_{2}$
,
$\boldsymbol{x}_{0}\in \mathscr{S}_{2}$
,
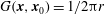 $G(\boldsymbol{x},\boldsymbol{x}_{0})=1/2{\rm\pi}r$
, with
$G(\boldsymbol{x},\boldsymbol{x}_{0})=1/2{\rm\pi}r$
, with
 $r=|\boldsymbol{x}-\boldsymbol{x}_{0}|$
.
$r=|\boldsymbol{x}-\boldsymbol{x}_{0}|$
.
3.2.2 EGL layer I: endothelial surface
In order to satisfy the no-slip condition, let us consider a local Cartesian coordinate system
 $(x_{1},x_{2},x_{3})$
, where
$(x_{1},x_{2},x_{3})$
, where
 $x_{3}$
lies in a direction normal to the surface. If we rescale according to
$x_{3}$
lies in a direction normal to the surface. If we rescale according to
 $$\begin{eqnarray}\displaystyle x_{1}=X_{1},\quad x_{2}=X_{2},\quad x_{3}={\it\lambda}^{-1}X_{3},\quad \boldsymbol{u}_{f}=({\it\lambda}^{-2}U_{f},{\it\lambda}^{-2}V_{f},{\it\lambda}^{-3}W_{f}), & & \displaystyle\end{eqnarray}$$
the Brinkman equations (2.3), at leading order in
 ${\it\lambda}$
, take the form
${\it\lambda}$
, take the form
 $$\begin{eqnarray}\displaystyle U_{f}=-\frac{\partial P_{e}}{\partial X_{1}}+\frac{\partial ^{2}U_{f}}{\partial X_{3}^{2}},\quad V_{f}=-\frac{\partial P_{e}}{\partial X_{2}}+\frac{\partial ^{2}V_{f}}{\partial X_{3}^{2}},\quad 0=\frac{\partial P_{e}}{\partial X_{3}},\quad \frac{\partial U_{f}}{\partial X_{1}}+\frac{\partial V_{f}}{\partial X_{2}}+\frac{\partial W_{f}}{\partial X_{3}}=0. & & \displaystyle \nonumber\\ \displaystyle & & \displaystyle\end{eqnarray}$$
These are subject to the following boundary and matching conditions:
 $$\begin{eqnarray}U_{f}(X_{3}=0)=0,\quad V_{f}(X_{3}=0)=0,\quad W_{f}(X_{3}=0)=0,\end{eqnarray}$$
 $$\begin{eqnarray}(U_{f}(X_{3}\rightarrow \infty ),\quad V_{f}(X_{3}\rightarrow \infty ))=\boldsymbol{v}_{s},\quad W_{f}(X_{3}\rightarrow \infty )=0,\end{eqnarray}$$
where
 $\boldsymbol{v}_{s}(x_{1},x_{2})=(u_{s},v_{s})=\boldsymbol{v}_{f}-(\boldsymbol{v}_{f}\boldsymbol{\cdot }\boldsymbol{n})\boldsymbol{n}$
is the slip velocity induced in the Darcy region described by (3.7)–(3.8). The leading-order flow in this viscous region is consequently given by
$\boldsymbol{v}_{s}(x_{1},x_{2})=(u_{s},v_{s})=\boldsymbol{v}_{f}-(\boldsymbol{v}_{f}\boldsymbol{\cdot }\boldsymbol{n})\boldsymbol{n}$
is the slip velocity induced in the Darcy region described by (3.7)–(3.8). The leading-order flow in this viscous region is consequently given by
 $$\begin{eqnarray}\displaystyle (U_{f}(X_{3}),V_{f}(X_{3}))=\boldsymbol{v}_{s}(1-\exp (-X_{3})),\quad W_{f}=(\boldsymbol{{\rm\nabla}}_{\Vert }\boldsymbol{\cdot }\boldsymbol{v}_{s})(1-X_{3}-\exp (-X_{3})), & & \displaystyle \nonumber\\ \displaystyle & & \displaystyle\end{eqnarray}$$
where
 $\boldsymbol{{\rm\nabla}}_{\Vert }=(\partial /\partial x_{1},\partial /\partial x_{2})$
. The leading-order tractions are then given by
$\boldsymbol{{\rm\nabla}}_{\Vert }=(\partial /\partial x_{1},\partial /\partial x_{2})$
. The leading-order tractions are then given by
 $$\begin{eqnarray}\displaystyle {\bf\sigma}\boldsymbol{\cdot }\boldsymbol{n}(S_{w})=({\it\lambda}^{-1}\partial U_{f}/\partial X_{3},{\it\lambda}^{-1}\partial V_{f}/\partial X_{3},-P_{e})=({\it\lambda}^{-1}u_{s}(S_{w}),{\it\lambda}^{-1}v_{s}(S_{w}),-P_{e}). & & \displaystyle\end{eqnarray}$$
3.2.3 EGL layer II: EGL interface
Here, we instead define (
 $x_{1},x_{2},x_{3}$
) to be a local coordinate system on the EGL interface, with
$x_{1},x_{2},x_{3}$
) to be a local coordinate system on the EGL interface, with
 $x_{3}$
in the direction of the local unit normal. In order to enforce continuity of the tangential components of traction, i.e.
$x_{3}$
in the direction of the local unit normal. In order to enforce continuity of the tangential components of traction, i.e.
 ${\it\phi}_{f}\boldsymbol{t}\boldsymbol{\cdot }{\bf\sigma}_{l}\boldsymbol{\cdot }\boldsymbol{n}(S_{i})=\boldsymbol{t}\boldsymbol{\cdot }{\bf\sigma}_{f}\boldsymbol{\cdot }\boldsymbol{n}(S_{i})$
, where
${\it\phi}_{f}\boldsymbol{t}\boldsymbol{\cdot }{\bf\sigma}_{l}\boldsymbol{\cdot }\boldsymbol{n}(S_{i})=\boldsymbol{t}\boldsymbol{\cdot }{\bf\sigma}_{f}\boldsymbol{\cdot }\boldsymbol{n}(S_{i})$
, where
 $\boldsymbol{t}$
is a local unit tangent, we rescale according to
$\boldsymbol{t}$
is a local unit tangent, we rescale according to
 $$\begin{eqnarray}\displaystyle x_{1}=X_{1},\quad x_{2}=X_{2},\quad x_{3}={\it\lambda}^{-1}X_{3},\quad P_{e}=P_{e}^{(0)}+({\it\lambda}^{-1}), & & \displaystyle\end{eqnarray}$$
 $$\begin{eqnarray}\displaystyle \left.\begin{array}{@{}c@{}}\displaystyle u_{f}={\it\lambda}^{-1}U_{f}^{(0)}+{\it\lambda}^{-2}U_{f}^{(1)}+O({\it\lambda}^{-3})+O({\it\lambda}^{-4}),\\ \displaystyle v_{f}={\it\lambda}^{-1}V_{f}^{(0)}+{\it\lambda}^{-2}V_{f}^{(1)}+O({\it\lambda}^{-3})+O({\it\lambda}^{-4}),\\ \displaystyle w_{f}={\it\lambda}^{-2}W_{f}^{(0)}+{\it\lambda}^{-3}W_{f}^{(1)}+O({\it\lambda}^{-4}).\end{array}\right\} & & \displaystyle\end{eqnarray}$$
The leading-order flow in this viscous layer is then governed by
 $$\begin{eqnarray}\displaystyle U_{f}^{(0)}=\frac{\partial ^{2}U_{f}^{(0)}}{\partial X_{3}^{2}},\quad V_{f}^{(0)}=\frac{\partial ^{2}V_{f}^{(0)}}{\partial X_{3}^{2}},\quad 0=\frac{\partial P_{e}^{(0)}}{\partial X_{3}},\quad \frac{\partial U_{f}^{(0)}}{\partial X_{1}}+\frac{\partial V_{f}^{(0)}}{\partial X_{2}}+\frac{\partial W_{f}^{(0)}}{\partial X_{3}}=0, & & \displaystyle \nonumber\\ \displaystyle & & \displaystyle\end{eqnarray}$$
subject to the boundary condition
 $$\begin{eqnarray}\displaystyle (U_{f}^{(0)}(X_{3}=0),V_{f}^{(0)}(X_{3}=0))=\frac{1}{{\it\phi}_{f}}(u_{l}^{(1)}(S_{i}),v_{l}^{(1)}(S_{i})),\quad W_{f}^{(0)}(X_{3}=0)=\frac{1}{{\it\phi}_{f}}w_{l}^{(2)}(S_{i}), & & \displaystyle \nonumber\\ \displaystyle & & \displaystyle\end{eqnarray}$$
and matching conditions which recognise that the flow in the EGL is an order of magnitude smaller than in this viscous layer,
 $$\begin{eqnarray}\displaystyle \boldsymbol{U}_{f}^{(0)}(X_{3}\rightarrow \infty )=\mathbf{0}, & & \displaystyle\end{eqnarray}$$
where
 $\boldsymbol{U}_{f}^{(0)}=(U_{f}^{(0)},V_{f}^{(0)},W_{f}^{(0)})$
. These are solved by
$\boldsymbol{U}_{f}^{(0)}=(U_{f}^{(0)},V_{f}^{(0)},W_{f}^{(0)})$
. These are solved by
 $$\begin{eqnarray}\displaystyle U_{f}^{(0)}=\frac{1}{{\it\phi}_{f}}u_{l}^{(1)}(S_{i})\exp (-X_{3}),\quad V_{f}^{(0)}=\frac{1}{{\it\phi}_{f}}v_{l}^{(1)}(S_{i})\exp (-X_{3}), & & \displaystyle\end{eqnarray}$$
 $$\begin{eqnarray}\displaystyle W_{f}^{(0)}=\frac{1}{{\it\phi}_{f}}\left(\boldsymbol{{\rm\nabla}}_{\Vert }\boldsymbol{\cdot }(u_{l}^{(1)},v_{l}^{(1)})\right)\exp (-X_{3}). & & \displaystyle\end{eqnarray}$$
Continuity of traction at
 $O(1)$
then gives at this order
$O(1)$
then gives at this order
 $$\begin{eqnarray}\displaystyle {\it\phi}_{f}({\it\sigma}_{l}^{(0)})_{13}=\frac{\partial U_{f}^{(0)}}{\partial X_{3}}(X_{3}=0)=-\frac{u_{l}^{(1)}}{{\it\phi}_{f}},\quad {\it\phi}_{f}({\it\sigma}_{l}^{(0)})_{23}=\frac{\partial V_{f}^{(0)}}{\partial X_{3}}(X_{3}=0)=-\frac{v_{l}^{(1)}}{{\it\phi}_{f}}, & & \displaystyle \nonumber\\ \displaystyle & & \displaystyle\end{eqnarray}$$
 $$\begin{eqnarray}\displaystyle {\it\phi}_{f}({\it\sigma}_{l}^{(0)})_{33}=-P_{e}^{(0)} & & \displaystyle\end{eqnarray}$$
for
 $\boldsymbol{x}$
on
$\boldsymbol{x}$
on
 $S_{w}$
. As can be seen, enforcing continuity of tangential components of traction provides boundary conditions for the correction to the leading-order flow in the lumen. Continuity of the normal component of traction provides the required remaining boundary condition for pressure in the Darcy region. The ability of this viscous layer to ensure continuity of tangential velocities at
$S_{w}$
. As can be seen, enforcing continuity of tangential components of traction provides boundary conditions for the correction to the leading-order flow in the lumen. Continuity of the normal component of traction provides the required remaining boundary condition for pressure in the Darcy region. The ability of this viscous layer to ensure continuity of tangential velocities at
 $O({\it\lambda}^{-2})$
in light of the slip velocities induced in the Darcy region at
$O({\it\lambda}^{-2})$
in light of the slip velocities induced in the Darcy region at
 $S_{i}$
requires us to consider the corrections to this leading-order flow. Moreover, continuity of normal velocity gives a permeability condition for the
$S_{i}$
requires us to consider the corrections to this leading-order flow. Moreover, continuity of normal velocity gives a permeability condition for the
 $O({\it\lambda}^{-2})$
lumen flow,
$O({\it\lambda}^{-2})$
lumen flow,
 $$\begin{eqnarray}\displaystyle w_{l}^{(2)}(S_{i})=\boldsymbol{{\rm\nabla}}_{\Vert }\boldsymbol{\cdot }(u_{l}^{(1)}(S_{i}),v_{l}^{(1)}(S_{i})). & & \displaystyle\end{eqnarray}$$
The flow corrections in this region are governed by
 $$\begin{eqnarray}\displaystyle U_{f}^{(1)}=-\frac{\partial P_{e}^{(0)}}{\partial \bar{x}_{1}}+\frac{\partial ^{2}U_{f}^{(1)}}{\partial X_{3}^{2}},\quad V_{f}^{(1)}=-\frac{\partial P_{e}^{(0)}}{\partial \bar{x}_{2}}+\frac{\partial ^{2}V_{f}^{(1)}}{\partial X_{3}^{2}},\quad \frac{\partial P_{e}^{(1)}}{\partial X_{3}}=\frac{\partial ^{2}W_{f}^{(0)}}{\partial X_{3}^{2}}-W_{f}^{(0)}, & & \displaystyle \nonumber\\ \displaystyle & & \displaystyle\end{eqnarray}$$
 $$\begin{eqnarray}\displaystyle \frac{\partial U_{f}^{(1)}}{\partial X_{1}}+\frac{\partial V_{f}^{(1)}}{\partial X_{2}}+\frac{\partial W_{f}^{(1)}}{\partial X_{3}}=0. & & \displaystyle\end{eqnarray}$$
The resulting flows allow us to bring to rest the slip flow generated on the interface within the Darcy region,
 $$\begin{eqnarray}\displaystyle & \displaystyle U_{f}^{(1)}=\left(u_{l}^{(2)}(S_{i})+\frac{\partial P_{e}^{(0)}}{\partial X_{1}}\right)\exp (-X_{3})-\frac{\partial P_{e}^{(0)}}{\partial X_{1}}, & \displaystyle\end{eqnarray}$$
 $$\begin{eqnarray}\displaystyle & \displaystyle V_{f}^{(1)}=\left(v_{l}^{(2)}(S_{i})+\frac{\partial P_{e}^{(0)}}{\partial X_{2}}\right)\exp (-X_{3})-\frac{\partial P_{e}^{(0)}}{\partial X_{2}}, & \displaystyle\end{eqnarray}$$
which can be seen to match to the flow in the EGL. We also note that continuity of tangential traction at
 $O({\it\lambda}^{-1})$
,
$O({\it\lambda}^{-1})$
,
 $$\begin{eqnarray}\displaystyle & \displaystyle ({\it\sigma}_{l}^{(1)}(S_{i}))_{13}=\frac{\partial U_{f}^{(1)}}{\partial X_{3}}(X_{3}=0)=-\!\left(u_{l}^{(2)}(S_{i})+\frac{\partial P_{e}^{(0)}}{\partial X_{1}}\right), & \displaystyle\end{eqnarray}$$
 $$\begin{eqnarray}\displaystyle & \displaystyle ({\it\sigma}_{l}^{(1)}(S_{i}))_{23}=\frac{\partial V_{f}^{(1)}}{\partial X_{3}}(X_{3}=0)=-\!\left(v_{l}^{(2)}(S_{i})+\frac{\partial P_{e}^{(0)}}{\partial X_{2}}\right), & \displaystyle\end{eqnarray}$$
together with (3.23), provides boundary conditions with which to solve the
 $O({\it\lambda}^{-2})$
flow in the lumen (although we do not need to do so here). As such, we have shown how the leading-order EGL flow consistently matches with the leading-order flow in the lumen, through flows within a thin viscous layer on the interface.
$O({\it\lambda}^{-2})$
flow in the lumen (although we do not need to do so here). As such, we have shown how the leading-order EGL flow consistently matches with the leading-order flow in the lumen, through flows within a thin viscous layer on the interface.
3.3 EGL: solid phase
Since the solid phase of the EGL is driven by flow in its fluid phase, there is an analogous three-layer asymptotic structure to the elastic displacements (see § 3.2).
3.3.1 EGL core
In the core EGL, we expand the solid displacements according to
 $$\begin{eqnarray}\boldsymbol{u}_{s}=\boldsymbol{u}_{s}^{(0)}+{\it\lambda}^{-1}\boldsymbol{u}_{s}^{(1)}+O({\it\lambda}^{-2}),\quad P_{e}=P_{e}^{(0)}+{\it\lambda}^{-1}P_{e}^{(1)}+O({\it\lambda}^{-2}).\end{eqnarray}$$
Combined with the rescaling of fluid quantities within the EGL (3.5), the leading-order elasticity equations then take the form
 $$\begin{eqnarray}\frac{1}{1-2{\it\nu}}\boldsymbol{{\rm\nabla}}(\boldsymbol{{\rm\nabla}}\boldsymbol{\cdot }\boldsymbol{u}_{s}^{(0)})+{\rm\nabla}^{2}\boldsymbol{u}_{s}^{(0)}=\frac{{\it\phi}_{s}}{{\it\phi}_{f}}\boldsymbol{{\rm\nabla}}P_{e}^{(0)}-\boldsymbol{u}_{f}^{(0)}.\end{eqnarray}$$
Upon substitution of the leading-order flow in the EGL core (3.6), we obtain
 $$\begin{eqnarray}\frac{1}{1-2{\it\nu}}\boldsymbol{{\rm\nabla}}(\boldsymbol{{\rm\nabla}}\boldsymbol{\cdot }\boldsymbol{u}_{s}^{(0)})+{\rm\nabla}^{2}\boldsymbol{u}_{s}^{(0)}=\frac{1}{{\it\phi}_{f}}\boldsymbol{{\rm\nabla}}P_{e}^{(0)}.\end{eqnarray}$$
The boundary conditions on the elastic displacements are determined by the viscous flows in the asymptotic layers of the EGL’s fluid phase. As we shall see in the next sections, the displacement boundary condition remains the same on the endothelium, giving
 $$\begin{eqnarray}\boldsymbol{u}_{s}^{(0)}(S_{i})=\mathbf{0}.\end{eqnarray}$$
However, on the interface, the traction condition changes due to the presence of the forcing terms in the equation. At leading order, this traction boundary condition is
 $$\begin{eqnarray}\left({\bf\sigma}_{s}^{(0)}-\frac{1}{{\it\phi}_{f}}P_{e}^{(0)}\unicode[STIX]{x1D644}\right)\boldsymbol{\cdot }\boldsymbol{n}={\bf\sigma}_{l}^{(0)}\boldsymbol{\cdot }\boldsymbol{n}\quad \text{on }S_{i}.\end{eqnarray}$$
3.3.2 EGL layer I: endothelial surface
We use the same local Cartesian coordinate system as before (3.10). Within this layer, no
 $O(1)$
displacements are driven by fluid forcing. Therefore, the
$O(1)$
displacements are driven by fluid forcing. Therefore, the
 $O(1)$
elastic displacements in the EGL core satisfy a zero displacement condition on the endothelium, as given in (3.32).
$O(1)$
elastic displacements in the EGL core satisfy a zero displacement condition on the endothelium, as given in (3.32).
However, in order to match the leading-order traction coming from the core and understand how this traction is transmitted to the endothelium, we must still consider the
 $O({\it\lambda}^{-1})$
displacements. As such, in this layer we rescale the solid displacements according to
$O({\it\lambda}^{-1})$
displacements. As such, in this layer we rescale the solid displacements according to
 $$\begin{eqnarray}\boldsymbol{u}_{s}=({\it\lambda}^{-1}U_{s},{\it\lambda}^{-1}V_{s},{\it\lambda}^{-1}W_{s}).\end{eqnarray}$$
The governing equations (2.5) at
 $O({\it\lambda})$
take the form
$O({\it\lambda})$
take the form
 $$\begin{eqnarray}\displaystyle \frac{\partial ^{2}U_{s}^{(0)}}{\partial X_{3}^{2}}=0,\quad \frac{\partial ^{2}V_{s}^{(0)}}{\partial X_{3}^{2}}=0,\quad \frac{\partial ^{2}W_{s}^{(0)}}{\partial X_{3}^{2}}=0, & & \displaystyle\end{eqnarray}$$
subject to the following boundary and matching conditions:
 $$\begin{eqnarray}\displaystyle U_{s}(X_{3}=0)=0,\quad V_{s}(X_{3}=0)=0,\quad W_{s}(X_{3}=0)=0, & & \displaystyle\end{eqnarray}$$
 $$\begin{eqnarray}\displaystyle \left(\frac{\partial U_{s}}{\partial X_{3}}(X_{3}\rightarrow \infty ),\frac{\partial V_{s}}{\partial X_{3}}(X_{3}\rightarrow \infty ),\frac{\partial W_{s}}{\partial X_{3}}(X_{3}\rightarrow \infty )\right)=(\boldsymbol{n}\boldsymbol{\cdot }{\bf\sigma}_{s})(S_{w}). & & \displaystyle\end{eqnarray}$$
This is solved by
 $$\begin{eqnarray}\displaystyle U_{s}^{(0)}=({\bf\sigma}_{s})_{13}(S_{w})X_{3},\quad V_{s}^{(0)}=({\bf\sigma}_{s})_{23}(S_{w})X_{3},\quad W_{s}^{(0)}=\frac{(3-4{\it\nu})}{(1-2{\it\nu})}({\bf\sigma}_{s})_{33}(S_{w})X_{3}. & & \displaystyle \nonumber\\ \displaystyle & & \displaystyle\end{eqnarray}$$
This shows that the leading-order traction is simply transmitted through this layer unchanged.
3.3.3 EGL layer II: EGL interface
Again, we use the same coordinate and pressure rescalings as used for the fluid phase in this layer (3.16). We approximate the solid displacement as in the core using the expansion
 $$\begin{eqnarray}\boldsymbol{u}_{s}=(U_{s}^{(0)},V_{s}^{(0)},W_{s}^{(0)})+({\it\lambda}^{-1}U_{s}^{(1)},{\it\lambda}^{-1}V_{s}^{(1)},{\it\lambda}^{-1}W_{s}^{(1)})+O({\it\lambda}^{-2}).\end{eqnarray}$$
The governing equations (2.5) at
 $O({\it\lambda}^{2})$
take the form
$O({\it\lambda}^{2})$
take the form
 $$\begin{eqnarray}\displaystyle \frac{\partial ^{2}U_{s}^{(0)}}{\partial X_{3}^{2}}=0,\quad \frac{\partial ^{2}V_{s}^{(0)}}{\partial X_{3}^{2}}=0,\quad \frac{\partial ^{2}W_{s}^{(0)}}{\partial X_{3}^{2}}=0. & & \displaystyle\end{eqnarray}$$
These equations are solved by displacements that are linear in
 $X_{3}$
. However, the linear term in these equations would give rise to
$X_{3}$
. However, the linear term in these equations would give rise to
 $O({\it\lambda})$
tractions, which cannot be matched at the interface by the
$O({\it\lambda})$
tractions, which cannot be matched at the interface by the
 $O(1)$
lumen tractions. This means that these linear terms must be zero. Hence, the
$O(1)$
lumen tractions. This means that these linear terms must be zero. Hence, the
 $O(1)$
elastic displacements in this layer are constant and do not contribute to the traction.
$O(1)$
elastic displacements in this layer are constant and do not contribute to the traction.
As such, in order to understand how the traction is transmitted through this layer, we must consider the first-order corrections. The governing equations (2.5) at
 $O({\it\lambda})$
take the form
$O({\it\lambda})$
take the form
 $$\begin{eqnarray}\displaystyle \frac{\partial ^{2}U_{s}^{(1)}}{\partial X_{3}^{2}}=-U_{f}^{(0)},\quad \frac{\partial ^{2}V_{s}^{(1)}}{\partial X_{3}^{2}}=-V_{f}^{(0)},\quad \frac{\partial ^{2}W_{s}^{(1)}}{\partial X_{3}^{2}}=0, & & \displaystyle\end{eqnarray}$$
where the fluid velocities
 $U_{f}^{(0)}$
and
$U_{f}^{(0)}$
and
 $V_{f}^{(0)}$
are given by (3.21). These are solved by
$V_{f}^{(0)}$
are given by (3.21). These are solved by
 $$\begin{eqnarray}\displaystyle & \displaystyle U_{s}^{(1)}=({\bf\sigma}_{l})_{13}(S_{i})X_{3}+B_{1}-\frac{1}{{\it\phi}_{f}}u_{l}^{(1)}(S_{i})\exp (-X_{3}), & \displaystyle\end{eqnarray}$$
 $$\begin{eqnarray}\displaystyle & \displaystyle V_{s}^{(1)}=({\bf\sigma}_{l})_{23}(S_{i})X_{3}+B_{2}-\frac{1}{{\it\phi}_{f}}v_{l}^{(1)}(S_{i})\exp (-X_{3}), & \displaystyle\end{eqnarray}$$
 $$\begin{eqnarray}\displaystyle & \displaystyle W_{s}^{(1)}=B_{3}, & \displaystyle\end{eqnarray}$$
where the
 $B_{i}$
 $(i=1,2,3)$
are given by matching the first-order correction to the core elastic displacements. These equations give the traction boundary condition for the core elastic region as
$(i=1,2,3)$
are given by matching the first-order correction to the core elastic displacements. These equations give the traction boundary condition for the core elastic region as
 $$\begin{eqnarray}\left({\bf\sigma}_{s}-\frac{1}{{\it\phi}_{f}}P_{e}\unicode[STIX]{x1D644}\right)\boldsymbol{\cdot }\boldsymbol{n}={\bf\sigma}_{l}\boldsymbol{\cdot }\boldsymbol{n}\quad \text{on }S_{i}.\end{eqnarray}$$
3.4 Lumen (two-layer model)
Whereas in capillaries, red blood cells pass through intermittently and must be treated individually (which is beyond the scope of what we do here), in larger postcapillary venules, the persistent presence of multiple red blood cells may have an influence on the bulk properties of the fluid which can be captured using a two-layer viscosity model (Pries et al. Reference Pries, Secomb, Gessner, Sperandio, Gross and Gaehtgens1994; Sharan & Popel Reference Sharan and Popel2001). Therefore, in addition to the model given in § 2.1, which considers the flow of plasma alone through the lumen, we also consider an extended model that seeks to capture these effects.
In this two-layer model, the blood flow is still modelled as a Stokes flow. However, within a microvessel, the red blood cells tend to move away from the vessel wall, leading to a red-blood-cell-rich core layer at the centre of the vessel and a cell-free layer surrounding this core. Due to the presence of red blood cells, this core layer has a higher viscosity than blood plasma, which we will call
 ${\it\mu}_{c}$
. The cell-free layer viscosity,
${\it\mu}_{c}$
. The cell-free layer viscosity,
 ${\it\mu}_{o}$
, is lower than this core layer viscosity, although it is still modelled to be higher than the plasma viscosity to account for the periodic invasion of red blood cells from the core into this outer layer (Sharan & Popel Reference Sharan and Popel2001). These viscosities, along with the cell-free layer thickness, can be chosen to fit experimental data (Sharan & Popel Reference Sharan and Popel2001).
${\it\mu}_{o}$
, is lower than this core layer viscosity, although it is still modelled to be higher than the plasma viscosity to account for the periodic invasion of red blood cells from the core into this outer layer (Sharan & Popel Reference Sharan and Popel2001). These viscosities, along with the cell-free layer thickness, can be chosen to fit experimental data (Sharan & Popel Reference Sharan and Popel2001).
One of the advantages of the asymptotic formulation is that this can be carried out in a computationally tractable manner, since the flow in the lumen decouples from the flow within the EGL at leading order.
Non-dimensionalising as in § 2.1, with the fluid velocity of each layer non-dimensionalised on its respective viscosity, we find that the governing equations in non-dimensional form are
 $$\begin{eqnarray}\displaystyle {\rm\nabla}^{2}\boldsymbol{u}_{c}=\boldsymbol{{\rm\nabla}}P_{c},\quad \boldsymbol{{\rm\nabla}}\boldsymbol{\cdot }u_{c}=0\quad \text{in }V_{c}, & & \displaystyle\end{eqnarray}$$
 $$\begin{eqnarray}\displaystyle {\rm\nabla}^{2}\boldsymbol{u}_{o}=\boldsymbol{{\rm\nabla}}P_{o},\quad \boldsymbol{{\rm\nabla}}\boldsymbol{\cdot }u_{o}=0\quad \text{in }V_{o}, & & \displaystyle\end{eqnarray}$$
where the
 $c$
and
$c$
and
 $o$
subscripts denote quantities in the core and cell-free layers respectively. The non-dimensional boundary conditions at the interface,
$o$
subscripts denote quantities in the core and cell-free layers respectively. The non-dimensional boundary conditions at the interface,
 $S_{c}$
, between these two layers are
$S_{c}$
, between these two layers are
 $$\begin{eqnarray}\displaystyle & \displaystyle \boldsymbol{u}_{c}=\frac{{\it\mu}_{o}}{{\it\mu}_{c}}\boldsymbol{u}_{o}\quad \text{on }S_{c}, & \displaystyle\end{eqnarray}$$
 $$\begin{eqnarray}\displaystyle & \displaystyle {\bf\sigma}_{c}\boldsymbol{\cdot }\boldsymbol{n}={\bf\sigma}_{o}\boldsymbol{\cdot }\boldsymbol{n}\quad \text{on }S_{c}, & \displaystyle\end{eqnarray}$$
which give continuity of velocity and traction respectively. It should be noted that the viscosity ratio in (3.47) is due to the difference in non-dimensionalisations between the two velocities. The outer boundary conditions between the lumen and the EGL remain the same as given in § 3.1. Analytic solutions of this model for a circular tube are given in (4.5).
4 Numerical simulation
4.1 Microvessel geometry
Our vessel geometry is informed by confocal microscopy images of a postcapillary venule, taken from mouse cremaster muscle. An image of the data can be seen in figure 2(a). Images were supplied by Dr Bodkin and Professor Nourshargh, Centre for Microvascular Research, William Harvey Research Institute, Barts and The London Medical School, Queen Mary University of London. The experimental method used to image the vessel is described in detail in Woodfin et al. (Reference Woodfin, Voisin, Beyrau, Colom, Caille, Diapouli, Nash, Chavakis, Albelda and Rainger2011) and Colom et al. (Reference Colom, Bodkin, Beyrau, Woodfin, Ody, Rourke, Chavakis, Brohi, Imhof and Nourshargh2015). The experimental method used to collect the data is summarised as follows. A relatively straight postcapillary venule from mouse cremaster muscle was exteriorised, and a Z-stack of images was collected by confocal microscopy using a single-beam Leica TCS-SP5 confocal laser-scanning microscope. The cell–cell junctions had been previously stained by intrascrotal injection of Alexa Fluor 555-labelled monoclonal antibody (mAb) to Platelet and Endothelial Cell Adhesion Molecule 1 (PECAM-1), which allows the cell–cell junctions of the endothelial cells to be visualised.

Figure 2. (a) AMIRA visualisation of cell–cell junctions in a postcapillary venule taken from mouse cremaster muscle, obtained by Bodkin and Nourshargh using confocal microscopy. (b) The cell–cell junction data (red crosses), as viewed down the longitudinal axis. The microvessel shape can be seen to be well approximated by a fitted elliptical cylinder (black line, with its corresponding major axis shown as a blue line). (c,d) Plots showing the triangularisation used for the microvessel. The colour rendering denotes cell height and the green dashed line denotes the area of the cell that is raised due to cell nuclei. These show an EGL mesh of 250 000 (c) and 1 000 000 (d) elements shown on the same section of vessel. (e) An example synthesised endothelium, with colour renderings indicating heights (dominated by the cell nuclei – see also figure 9 in appendix B).
From these data, we first extracted the cell–cell junctions as line segments in three-dimensional space, using the data visualisation package AMIRA. It was found that the endothelial surface was largely elliptical in shape (excluding a small section at one end of the microvessel), with a major axis of
 $36.2~{\rm\mu}\text{m}$
and a minor axis of
$36.2~{\rm\mu}\text{m}$
and a minor axis of
 $22.8~{\rm\mu}\text{m}$
(see figure 2
b, where the fit was carried out using the fitellipse.m routine in Matlab (Brown Reference Brown2007)). Hence, we hereafter assume this elliptical representation of the microvessel basal surface in our numerical computations. In order to minimise entry and exit length effects (which are expected to scale with the vessel radius at these low Reynolds numbers), we also added vessel extensions to smoothly transition the geometry between the perfectly circular inlet and outlet, and the non-uniform endothelial surface. This also allowed us to prescribe the following analytic expressions for the inlet and outlet flow boundary conditions:
$22.8~{\rm\mu}\text{m}$
(see figure 2
b, where the fit was carried out using the fitellipse.m routine in Matlab (Brown Reference Brown2007)). Hence, we hereafter assume this elliptical representation of the microvessel basal surface in our numerical computations. In order to minimise entry and exit length effects (which are expected to scale with the vessel radius at these low Reynolds numbers), we also added vessel extensions to smoothly transition the geometry between the perfectly circular inlet and outlet, and the non-uniform endothelial surface. This also allowed us to prescribe the following analytic expressions for the inlet and outlet flow boundary conditions:
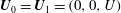 $\boldsymbol{U}_{0}=\boldsymbol{U}_{1}=(0,0,U)$
, where (Damiano et al.
Reference Damiano, Duling, Ley and Skalak1996)
$\boldsymbol{U}_{0}=\boldsymbol{U}_{1}=(0,0,U)$
, where (Damiano et al.
Reference Damiano, Duling, Ley and Skalak1996)
 $$\begin{eqnarray}\displaystyle U(r)=\left\{\begin{array}{@{}ll@{}}\displaystyle \!{\it\lambda}^{2}({\it\phi}_{f})^{2}\!\left[\!\left(\!\frac{{\it\alpha}}{2{\it\lambda}}+\frac{K_{1}({\it\alpha}/{\it\lambda})}{K_{0}(1/{\it\lambda})}\!\right)\frac{J_{0}({\it\alpha})}{J_{1}({\it\alpha})}+\frac{K_{0}({\it\alpha}/{\it\lambda})}{K_{0}(1/{\it\lambda})}-1\!\right]+\frac{1}{4}(r^{2}-{\it\alpha}^{2}),\quad & 0\leqslant r\leqslant {\it\alpha},\\ \displaystyle \!{\it\lambda}^{2}({\it\phi}_{f})\!\left[\!\left(\!\frac{{\it\alpha}}{2{\it\lambda}}+\frac{K_{1}({\it\alpha}/{\it\lambda})}{K_{0}(1/{\it\lambda})}\!\right)\frac{J_{0}(r)}{J_{1}({\it\alpha})}+\frac{K_{0}({\it\alpha}/{\it\lambda})}{K_{0}(1/{\it\lambda})}-1\!\right],\quad & {\it\alpha}\leqslant r\leqslant 1,\end{array}\right. & & \displaystyle \nonumber\\ \displaystyle & & \displaystyle\end{eqnarray}$$
with
 $J_{0}(x)=I_{0}(x/{\it\lambda})-{\it\epsilon}K_{0}(x/{\it\lambda})$
and
$J_{0}(x)=I_{0}(x/{\it\lambda})-{\it\epsilon}K_{0}(x/{\it\lambda})$
and
 $J_{1}(x)=I_{1}(x/{\it\lambda})+{\it\epsilon}K_{1}(x/{\it\lambda})$
. Here,
$J_{1}(x)=I_{1}(x/{\it\lambda})+{\it\epsilon}K_{1}(x/{\it\lambda})$
. Here,
 $K_{0}$
and
$K_{0}$
and
 $K_{1}$
are modified Bessel functions,
$K_{1}$
are modified Bessel functions,
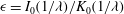 ${\it\epsilon}=I_{0}(1/{\it\lambda})/K_{0}(1/{\it\lambda})$
and
${\it\epsilon}=I_{0}(1/{\it\lambda})/K_{0}(1/{\it\lambda})$
and
 ${\it\alpha}=1-{\it\delta}_{0}$
, where
${\it\alpha}=1-{\it\delta}_{0}$
, where
 ${\it\delta}_{0}$
is the EGL thickness at the inlet and outlet.
${\it\delta}_{0}$
is the EGL thickness at the inlet and outlet.
In addition, we also specify the inlet and outlet displacement conditions
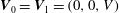 $\boldsymbol{V}_{0}=\boldsymbol{V}_{1}=(0,0,V)$
, where
$\boldsymbol{V}_{0}=\boldsymbol{V}_{1}=(0,0,V)$
, where
 $$\begin{eqnarray}\displaystyle V(r)=\frac{1}{4}(r^{2}-1)+\frac{1}{{\it\phi}_{f}}U(r),\quad {\it\alpha}\leqslant r\leqslant 1. & & \displaystyle\end{eqnarray}$$
For the asymptotic model, we prescribe analytic solutions for the inlet and outlet as before. In the lumen, we specify Poiseuille conditions,
 $$\begin{eqnarray}\displaystyle U(r)=\frac{1}{4}(r^{2}-{\it\alpha}^{2}),\quad 0\leqslant r\leqslant {\it\alpha}, & & \displaystyle\end{eqnarray}$$
while the boundary condition for flow in the EGL is a constant pressure condition. The inlet and outlet displacement conditions are given by
 $$\begin{eqnarray}\displaystyle V(r)=\frac{1}{4}(r^{2}-1)+{\it\alpha}^{2}\ln (r),\quad {\it\alpha}\leqslant r\leqslant 1. & & \displaystyle\end{eqnarray}$$
For the two-layer Stokes model, the inlet and outlet boundary conditions are given by
 $$\begin{eqnarray}\displaystyle U(r)=\left\{\begin{array}{@{}ll@{}}\displaystyle \frac{1}{4}(r^{2}-{\it\beta}^{2})+\frac{{\it\mu}_{c}}{4{\it\mu}_{o}}({\it\beta}^{2}-{\it\alpha}^{2}),\quad & 0\leqslant r\leqslant {\it\beta},\\ \displaystyle \frac{1}{4}(r^{2}-{\it\alpha}),\quad & {\it\beta}\leqslant r\leqslant {\it\alpha},\end{array}\right. & & \displaystyle\end{eqnarray}$$
where
 ${\it\beta}=1-r_{o}$
,
${\it\beta}=1-r_{o}$
,
 $r_{o}$
is the cell-free layer thickness.
$r_{o}$
is the cell-free layer thickness.
Experimental constraints meant that confocal microscopy data were only available for the lower half of the vessel, and cell membrane surfaces were not readily obtainable. As such, we synthesised cells in a manner that observed the spatial statistics seen in the biological data, as well as the cell profiles reported in the earlier literature. (It should be noted that we performed a statistical analysis of the resulting cell patterns, in order to confirm that they reproduced the distributions seen in the biological data.) More details can be found in appendix B. In figure 2(e) we include an example synthesised endothelium geometry.
We consider two possible scenarios for the EGL distribution in vivo. Model A considers an EGL that has redistributed to the relatively flat regions between cell nuclei, producing a poroelastic layer that varies in thickness. Here, the EGL is thinnest at the cell peaks, where it has depth
 $t_{min}$
, and thickest between the cells, where its depth is
$t_{min}$
, and thickest between the cells, where its depth is
 ${\it\alpha}_{0}t_{min}$
, where
${\it\alpha}_{0}t_{min}$
, where
 ${\it\alpha}_{0}$
is some amplitude factor that alters the shape of the redistributed EGL (see figure 1
a for an illustration). It should be noted that a typical value of
${\it\alpha}_{0}$
is some amplitude factor that alters the shape of the redistributed EGL (see figure 1
a for an illustration). It should be noted that a typical value of
 ${\it\alpha}_{0}$
is not currently well known, due to the experimental challenges associated with visualising the EGL in vivo, and so in what follows we have performed simulations using different values of
${\it\alpha}_{0}$
is not currently well known, due to the experimental challenges associated with visualising the EGL in vivo, and so in what follows we have performed simulations using different values of
 ${\it\alpha}_{0}$
. For the same reasons, we have chosen a cubic interpolation for the EGL profile between cell peaks and cell–cell junctions. However, we have checked that the trends reported are not overly sensitive to this choice by performing additional simulations using linear interpolants. By contrast, in model B, the EGL follows the topology of the endothelial surface, and has constant thickness
${\it\alpha}_{0}$
. For the same reasons, we have chosen a cubic interpolation for the EGL profile between cell peaks and cell–cell junctions. However, we have checked that the trends reported are not overly sensitive to this choice by performing additional simulations using linear interpolants. By contrast, in model B, the EGL follows the topology of the endothelial surface, and has constant thickness
 $t_{min}$
throughout the vessel (see figure 1
b). For comparison, we have also considered a bare vessel, which does not contain an EGL at all.
$t_{min}$
throughout the vessel (see figure 1
b). For comparison, we have also considered a bare vessel, which does not contain an EGL at all.
Finally, we consider some scenarios where the flow in the lumen consists of a higher-viscosity inner region and a lower-viscosity outer region, as discussed in § 3.4. Such two-layer models have been shown to well approximate the influence of red blood cells outside of a cell-depleted region in the lumen. We choose to implement the profiles proposed by Sharan & Popel (Reference Sharan and Popel2001), where the lower viscosity in the cell-depleted layer remains higher than that of plasma alone, to take account of occasional red blood cell intrusion into this layer. We choose a cell-depleted layer that follows the topology of the EGL interface, with its thickness being that predicted by earlier studies (Pries et al.
Reference Pries, Secomb, Gessner, Sperandio, Gross and Gaehtgens1994; Sharan & Popel Reference Sharan and Popel2001). Using a discharge haematocrit of 45 % and a vessel radius of
 $29.47~{\rm\mu}\text{m}$
, we find a cell-free layer thickness of
$29.47~{\rm\mu}\text{m}$
, we find a cell-free layer thickness of
 $r_{o}=4.3~{\rm\mu}\text{m}$
, a core viscosity of
$r_{o}=4.3~{\rm\mu}\text{m}$
, a core viscosity of
 ${\it\mu}_{c}=3.71{\it\mu}_{pl}$
and a cell-free layer viscosity of
${\it\mu}_{c}=3.71{\it\mu}_{pl}$
and a cell-free layer viscosity of
 ${\it\mu}_{o}=1.45{\it\mu}_{pl}$
(where
${\it\mu}_{o}=1.45{\it\mu}_{pl}$
(where
 ${\it\mu}_{pl}$
indicates the plasma viscosity).
${\it\mu}_{pl}$
indicates the plasma viscosity).
4.2 Boundary element scheme
The governing boundary integral equations were solved numerically by first discretising the vessel surfaces into triangular elements (as can be seen in figure 2) and then assuming a constant basis function across these triangular elements. The required integrals were then computed using numerical quadratures, and the resulting linear system was solved iteratively and in parallel over multiple cores using GMRES with a Jacobi preconditioner. This process is described in more detail in appendix A along with a description of how these solvers were verified, and indicative values of mesh sizes and solution times.
5 Results
In what follows, we present the predicted wall shear stresses exerted upon the vessel endothelium. In doing so, we are able to make some predictions around the degree to which stresses are carried through the solid phase, as compared with the fluid phase. We can also comment upon the extent to which EGL redistribution affects the shear stresses exerted upon the endothelium, as a function of EGL permeability,
 ${\it\lambda}$
, and minimum EGL thickness,
${\it\lambda}$
, and minimum EGL thickness,
 $t_{min}$
.
$t_{min}$
.
The physiological range of Darcy permeability in a normal EGL is believed to be of the order
 $K_{P}\approx 10^{-13}$
–
$K_{P}\approx 10^{-13}$
–
 $10^{-12}~\text{cm}^{2}$
(Weinbaum, Tarbell & Damiano Reference Weinbaum, Tarbell and Damiano2007). In order to gauge whether this flow regime lies within the asymptotic regime described in § 3.2, we compare predictions from this analysis with those obtained using the full Stokes–Brinkman system (2.1), (2.3), (2.7)–(2.11).
$10^{-12}~\text{cm}^{2}$
(Weinbaum, Tarbell & Damiano Reference Weinbaum, Tarbell and Damiano2007). In order to gauge whether this flow regime lies within the asymptotic regime described in § 3.2, we compare predictions from this analysis with those obtained using the full Stokes–Brinkman system (2.1), (2.3), (2.7)–(2.11).

Figure 3. Median of the integrated per cell longitudinal shear stresses divided by
 ${\it\lambda}$
, as a function of
${\it\lambda}$
, as a function of
 ${\it\lambda}$
, for (a, model A) a redistributed EGL and (b, model B) a non-redistributed EGL, when
${\it\lambda}$
, for (a, model A) a redistributed EGL and (b, model B) a non-redistributed EGL, when
 ${\it\alpha}_{0}=1.8$
. These are plotted as lines with markers. Also included is the asymptotic shear stress in the limit of large
${\it\alpha}_{0}=1.8$
. These are plotted as lines with markers. Also included is the asymptotic shear stress in the limit of large
 $K_{P}$
, (3.15), plotted as dashed lines without markers.
$K_{P}$
, (3.15), plotted as dashed lines without markers.
In figure 3, we plot the median of the integrated fluid shear stress on each cell, as a function of Darcy permeability,
 $K_{P}$
, for several different minimum EGL thicknesses (
$K_{P}$
, for several different minimum EGL thicknesses (
 $t_{min}=0.25,0.5,1,1.5~{\rm\mu}\text{m}$
). It should be noted that these stresses have been normalised on permeability,
$t_{min}=0.25,0.5,1,1.5~{\rm\mu}\text{m}$
). It should be noted that these stresses have been normalised on permeability,
 ${\it\lambda}$
, to best show convergence to the asymptotic limits; the non-normalised stresses themselves strictly decrease with resistivity, and the peaks observed in these curves carry no particular physical significance. Furthermore, these have been calculated for both the redistributed EGL (model A, a) and the non-redistributed EGL (model B, b). Alongside are included the predictions from the asymptotic analysis (3.15). Numerical solution of the full Stokes–Brinkman equations becomes increasingly more difficult as the permeability decreases, which in practice limits the Darcy permeabilities that we can compute to
${\it\lambda}$
, to best show convergence to the asymptotic limits; the non-normalised stresses themselves strictly decrease with resistivity, and the peaks observed in these curves carry no particular physical significance. Furthermore, these have been calculated for both the redistributed EGL (model A, a) and the non-redistributed EGL (model B, b). Alongside are included the predictions from the asymptotic analysis (3.15). Numerical solution of the full Stokes–Brinkman equations becomes increasingly more difficult as the permeability decreases, which in practice limits the Darcy permeabilities that we can compute to
 $K_{P}\leqslant 10^{-9.5}~\text{cm}^{2}$
. Nevertheless, for
$K_{P}\leqslant 10^{-9.5}~\text{cm}^{2}$
. Nevertheless, for
 $t_{min}=0.5$
, 1 and 1.5 we can see a clear indication that the stresses are converging towards the asymptotic predictions well before the Darcy permeabilities expected of a normal EGL. For
$t_{min}=0.5$
, 1 and 1.5 we can see a clear indication that the stresses are converging towards the asymptotic predictions well before the Darcy permeabilities expected of a normal EGL. For
 $t_{min}=0.25$
, the transition to the asymptotic limit is beyond the hydraulic resistivities for which we can solve the full Stokes–Brinkman equations (however, it is reasonable to expect that it will do so, albeit more slowly, given that the asymptotic analysis holds for general
$t_{min}=0.25$
, the transition to the asymptotic limit is beyond the hydraulic resistivities for which we can solve the full Stokes–Brinkman equations (however, it is reasonable to expect that it will do so, albeit more slowly, given that the asymptotic analysis holds for general
 $t_{min}$
, and is shown to capture the limiting behaviour at the larger values of
$t_{min}$
, and is shown to capture the limiting behaviour at the larger values of
 $t_{min}$
). Moreover, given that the peak stress has been reached by
$t_{min}$
). Moreover, given that the peak stress has been reached by
 $K_{P}=10^{-12}~\text{cm}^{2}$
, it seems reasonable to suppose that the asymptotic regime would be reached by
$K_{P}=10^{-12}~\text{cm}^{2}$
, it seems reasonable to suppose that the asymptotic regime would be reached by
 $K_{P}=10^{-13}$
–
$K_{P}=10^{-13}$
–
 $10^{-12}~\text{cm}^{2}$
. (It should be noted that this convergence is not overly sensitive to the precise measure used, e.g. here the median of per cell integrated longitudinal shear stress.) Since the coupling between the fluid and solid phases is one-way (i.e. the fluid phase drives the solid phase, but in turn is not driven by the solid phase), in this regime it therefore also seems reasonable to utilise the form for the elastic phase driven by the asymptotic flow approximations (3.31)–(3.33).
$10^{-12}~\text{cm}^{2}$
. (It should be noted that this convergence is not overly sensitive to the precise measure used, e.g. here the median of per cell integrated longitudinal shear stress.) Since the coupling between the fluid and solid phases is one-way (i.e. the fluid phase drives the solid phase, but in turn is not driven by the solid phase), in this regime it therefore also seems reasonable to utilise the form for the elastic phase driven by the asymptotic flow approximations (3.31)–(3.33).
These plots also show that not only does the fluid shear stress decrease with EGL thickness, as might be expected given the EGL’s anticipated role in protecting the vessel wall from damaging levels of shear stress, but that the Brinkman–Stokes solutions converge more rapidly for thicker EGLs, and we note that this is also the case for EGLs that have redistributed.
We will not present here the spatial distributions of both fluid and elastic stresses for all scenarios considered, although it is perhaps illustrative to show a couple of the limiting cases. (The complete set of stress profiles can be found in the electronic supplementary material available at http://dx.doi.org/10.1017/jfm.2016.337). Specifically, we consider the fluid and elastic wall shear stresses in the cases where
 $K_{P}=10^{-7}~\text{cm}^{2}$
(
$K_{P}=10^{-7}~\text{cm}^{2}$
(
 ${\it\lambda}^{-1}=10^{-3.5}$
), with minimum EGL thickness
${\it\lambda}^{-1}=10^{-3.5}$
), with minimum EGL thickness
 $t_{min}=1.5~{\rm\mu}\text{m}$
(figure 4), and
$t_{min}=1.5~{\rm\mu}\text{m}$
(figure 4), and
 $t_{min}=0.25$
(figure 5). In what follows, we will concentrate on the longitudinal component (which aligns with the longitudinal axis of the vessel). In most cases, the azimuthal components are much smaller in magnitude than the longitudinal components, and so are omitted for brevity (but can be found in the electronic supplementary material). In each case, we consider an EGL that has redistributed (a,c), as well as one that has not redistributed (b,d). In this limit of asymptotically low permeability, the fluid and elastic shear stresses are found by solving (3.15) and (3.31)–(3.33) respectively. In these stress plots, we have chosen an amplitude factor of
$t_{min}=0.25$
(figure 5). In what follows, we will concentrate on the longitudinal component (which aligns with the longitudinal axis of the vessel). In most cases, the azimuthal components are much smaller in magnitude than the longitudinal components, and so are omitted for brevity (but can be found in the electronic supplementary material). In each case, we consider an EGL that has redistributed (a,c), as well as one that has not redistributed (b,d). In this limit of asymptotically low permeability, the fluid and elastic shear stresses are found by solving (3.15) and (3.31)–(3.33) respectively. In these stress plots, we have chosen an amplitude factor of
 ${\it\alpha}_{0}=1.8$
, although additional simulations have shown that the results are not overly sensitive to the value of this parameter except in the cases where a large
${\it\alpha}_{0}=1.8$
, although additional simulations have shown that the results are not overly sensitive to the value of this parameter except in the cases where a large
 ${\it\alpha}_{0}$
value causes the EGL to protrude further into the vessel between the cell nuclei than at the cell peaks, i.e. the EGL bulges out between the nuclei (see table 1 for a more comprehensive survey). In these cases, the distribution of shear stress is altered; however, this can only occur for a very thick EGL, and as such we do not believe this to be a physiologically realistic scenario, and so have not included plots of these distributions. Furthermore, we do not see any substantial sensitivity to the choice of interpolants (in this case, linear or cubic) for the EGL profile between cells.
${\it\alpha}_{0}$
value causes the EGL to protrude further into the vessel between the cell nuclei than at the cell peaks, i.e. the EGL bulges out between the nuclei (see table 1 for a more comprehensive survey). In these cases, the distribution of shear stress is altered; however, this can only occur for a very thick EGL, and as such we do not believe this to be a physiologically realistic scenario, and so have not included plots of these distributions. Furthermore, we do not see any substantial sensitivity to the choice of interpolants (in this case, linear or cubic) for the EGL profile between cells.

Figure 4. Longitudinal component of (a,b) fluid shear stress,
 $g_{z}$
, and (c,d) elastic shear stress,
$g_{z}$
, and (c,d) elastic shear stress,
 $h_{z}$
, exerted upon the endothelium in the low-permeability limit (
$h_{z}$
, exerted upon the endothelium in the low-permeability limit (
 $K_{P}=10^{-12}~\text{cm}^{2}$
,
$K_{P}=10^{-12}~\text{cm}^{2}$
,
 ${\it\lambda}=10^{3.5}$
) when the minimum EGL thickness is
${\it\lambda}=10^{3.5}$
) when the minimum EGL thickness is
 $t_{min}=1.5$
,
$t_{min}=1.5$
,
 ${\it\alpha}_{0}=1.8$
. These stresses are computed using the asymptotic expression (3.15) and (3.31)–(3.33) respectively. We consider both a redistributed EGL of varying thickness (model A, a,c), and a non-redistributed EGL (model B, b,d).
${\it\alpha}_{0}=1.8$
. These stresses are computed using the asymptotic expression (3.15) and (3.31)–(3.33) respectively. We consider both a redistributed EGL of varying thickness (model A, a,c), and a non-redistributed EGL (model B, b,d).
Table 1. The maximum magnitude of the longitudinal shear stress for solid and fluid stress, normalised on the solid stress value for a non-redistributed EGL with
 $t_{min}=1.5$
, which has a non-dimensional stress value of 1.708. The values given for the fluid stress are
$t_{min}=1.5$
, which has a non-dimensional stress value of 1.708. The values given for the fluid stress are
 $10^{-3}$
smaller than those for the solid stress. Stress values are given for a non-redistributed EGL and three cases of a redistributed EGL with amplitude factor
$10^{-3}$
smaller than those for the solid stress. Stress values are given for a non-redistributed EGL and three cases of a redistributed EGL with amplitude factor
 ${\it\alpha}_{0}=1.8$
, 2.2 and 3.4 respectively. The highlighted cells denote cases where the EGL protrudes further into the vessel between the cell nuclei as compared with at the cell nuclei. For the case of a bare vessel (no EGL), the fluid shear stress is
${\it\alpha}_{0}=1.8$
, 2.2 and 3.4 respectively. The highlighted cells denote cases where the EGL protrudes further into the vessel between the cell nuclei as compared with at the cell nuclei. For the case of a bare vessel (no EGL), the fluid shear stress is
 $0.80$
of the reference stress.
$0.80$
of the reference stress.

For the thickest EGL considered,
 $t_{min}=1.5~{\rm\mu}\text{m}$
(which is towards the top end of the experimentally inferred range, Yen et al. (Reference Yen, Cai, Zeng, Tarbell and Fu2012)), in figure 4 we note that there are significant differences in the shear stresses exerted upon the endothelial surface when the EGL redistributes. Notably, we have a maximum wall fluid shear stress for a redistributed EGL the magnitude of which is approximately 54 % of that experienced when the EGL is non-redistributed. The situation is similar for the elastic shear stress exerted upon the wall, where the shear stress experienced at the peak of the cell in the redistributed case is approximately 76 % of that experienced without EGL redistribution. There are also noticeable differences between the spatial structures of the stresses exerted by the fluid and solid phases. Elastic shear stresses are clearly elevated in regions closer to the minor axis of the vessel. Fluid shear stresses are also affected by the elliptical shape of the vessel, although to a lesser extent, being most noticeable in the maximum shear stresses at the peaks of the cell nuclei. Furthermore, in the fluid phase, a region of reduced shear stress is observable immediately upstream and downstream of the cell nuclei, leading to crescent-like patterns of reduced shear. For the case of the non-redistributed EGL, the fluid shear stress can actually become negative in these regions. This is indicative of a point of inflection forming in the flow, which is often associated with eddies in the flow (Wei et al.
Reference Wei, Waters, Liu and Grotberg2003; Sumets et al.
Reference Sumets, Cater, Long and Clarke2015). Regions of negative shear stress do not occur upstream and downstream of every cell nucleus, but only those near to the minor axis of the vessel. This may be expected, as these cells experience the steepest gradients in shear stress. However, we see that redistribution of the EGL tends to suppress these regions of negative shear, and presumably the occurrence of any associated eddies. We also find that this trend does not appear to be specific to the particular shape of the redistributed EGL that we have considered here. In the solid phase, there are also regions of reduced shear; however, these are seen to be more symmetrical around the perimeter of the cell nuclei. Moreover, the elastic stresses remain positive, even when the EGL is non-redistributed.
$t_{min}=1.5~{\rm\mu}\text{m}$
(which is towards the top end of the experimentally inferred range, Yen et al. (Reference Yen, Cai, Zeng, Tarbell and Fu2012)), in figure 4 we note that there are significant differences in the shear stresses exerted upon the endothelial surface when the EGL redistributes. Notably, we have a maximum wall fluid shear stress for a redistributed EGL the magnitude of which is approximately 54 % of that experienced when the EGL is non-redistributed. The situation is similar for the elastic shear stress exerted upon the wall, where the shear stress experienced at the peak of the cell in the redistributed case is approximately 76 % of that experienced without EGL redistribution. There are also noticeable differences between the spatial structures of the stresses exerted by the fluid and solid phases. Elastic shear stresses are clearly elevated in regions closer to the minor axis of the vessel. Fluid shear stresses are also affected by the elliptical shape of the vessel, although to a lesser extent, being most noticeable in the maximum shear stresses at the peaks of the cell nuclei. Furthermore, in the fluid phase, a region of reduced shear stress is observable immediately upstream and downstream of the cell nuclei, leading to crescent-like patterns of reduced shear. For the case of the non-redistributed EGL, the fluid shear stress can actually become negative in these regions. This is indicative of a point of inflection forming in the flow, which is often associated with eddies in the flow (Wei et al.
Reference Wei, Waters, Liu and Grotberg2003; Sumets et al.
Reference Sumets, Cater, Long and Clarke2015). Regions of negative shear stress do not occur upstream and downstream of every cell nucleus, but only those near to the minor axis of the vessel. This may be expected, as these cells experience the steepest gradients in shear stress. However, we see that redistribution of the EGL tends to suppress these regions of negative shear, and presumably the occurrence of any associated eddies. We also find that this trend does not appear to be specific to the particular shape of the redistributed EGL that we have considered here. In the solid phase, there are also regions of reduced shear; however, these are seen to be more symmetrical around the perimeter of the cell nuclei. Moreover, the elastic stresses remain positive, even when the EGL is non-redistributed.
As mentioned above, an EGL with
 $t_{min}=1.5~{\rm\mu}\text{m}$
is towards the higher end of the expected range of EGL thicknesses, and so it is instructive to see the extent to which these effects persist for thinner EGLs. In figure 5, we consider an EGL with
$t_{min}=1.5~{\rm\mu}\text{m}$
is towards the higher end of the expected range of EGL thicknesses, and so it is instructive to see the extent to which these effects persist for thinner EGLs. In figure 5, we consider an EGL with
 $t_{min}=0.25$
. Here, redistribution of the EGL is seen to produce only a small change in the shear stresses exerted upon the wall by either the fluid phase or the solid phase, although the difference between the magnitudes of the fluid shear and the elastic shear does remain comparable to that exerted in the presence of the thicker EGL. We also note that the magnitudes of the fluid stresses are approximately 42 % greater than was the case when
$t_{min}=0.25$
. Here, redistribution of the EGL is seen to produce only a small change in the shear stresses exerted upon the wall by either the fluid phase or the solid phase, although the difference between the magnitudes of the fluid shear and the elastic shear does remain comparable to that exerted in the presence of the thicker EGL. We also note that the magnitudes of the fluid stresses are approximately 42 % greater than was the case when
 $t_{min}=1.5$
. By contrast, the elastic stresses are smaller for the thinner EGL.
$t_{min}=1.5$
. By contrast, the elastic stresses are smaller for the thinner EGL.

Figure 5. Longitudinal component of (a,b) fluid shear stress,
 $g_{z}$
, and (c,d) elastic shear stress,
$g_{z}$
, and (c,d) elastic shear stress,
 $h_{z}$
, exerted upon the endothelium in the low-permeability limit (
$h_{z}$
, exerted upon the endothelium in the low-permeability limit (
 $K_{P}=10^{-12}~\text{cm}^{2}$
,
$K_{P}=10^{-12}~\text{cm}^{2}$
,
 ${\it\lambda}=10^{3.5}$
) when the minimum EGL thickness is
${\it\lambda}=10^{3.5}$
) when the minimum EGL thickness is
 $t_{min}=0.25$
,
$t_{min}=0.25$
,
 ${\it\alpha}_{0}=1.8$
. These stresses are computed using the asymptotic expression (3.15) and (3.31)–(3.33) respectively. We consider both a redistributed EGL of varying thickness (model A, a,c), and a non-redistributed EGL (model B, b,d).
${\it\alpha}_{0}=1.8$
. These stresses are computed using the asymptotic expression (3.15) and (3.31)–(3.33) respectively. We consider both a redistributed EGL of varying thickness (model A, a,c), and a non-redistributed EGL (model B, b,d).
We note that for this thinner EGL, the shear stress in the azimuthal direction becomes appreciable when compared with the longitudinal shear stress. In table 2, we see that for
 $t_{min}=0.25$
, the azimuthal shear stress is now approximately half of the magnitude of the longitudinal shear stress. This is compared with azimuthal fluid shear stresses that are four times smaller than the longitudinal stresses when
$t_{min}=0.25$
, the azimuthal shear stress is now approximately half of the magnitude of the longitudinal shear stress. This is compared with azimuthal fluid shear stresses that are four times smaller than the longitudinal stresses when
 $t_{min}=1.5$
. However, for the solid phase we find that the azimuthal elastic shear stresses remain 10 times smaller than the longitudinal components.
$t_{min}=1.5$
. However, for the solid phase we find that the azimuthal elastic shear stresses remain 10 times smaller than the longitudinal components.
Table 2. The maximum magnitude of the azimuthal shear stress for solid and fluid stress, normalised on the same value as table 1. See the caption of table 1 for further information.

These results, along with results for other EGL thicknesses, are summarised in tables 1 and 2. Plots for these omitted EGL thicknesses are available in the electronic supplementary material. We also consider some alternative values for
 ${\it\alpha}_{0}$
. The trends reported above with regard to the dependence of the fluid and elastic stresses upon EGL thickness and redistribution hold (except in the cases where the EGL bulges out between the cell nuclei), although the overall magnitude of the stresses is reduced as
${\it\alpha}_{0}$
. The trends reported above with regard to the dependence of the fluid and elastic stresses upon EGL thickness and redistribution hold (except in the cases where the EGL bulges out between the cell nuclei), although the overall magnitude of the stresses is reduced as
 ${\it\alpha}_{0}$
is increased, as would be expected. These differences in overall magnitude are summarised in table 1, with the cases where the EGL bulges out between the cell nuclei highlighted.
${\it\alpha}_{0}$
is increased, as would be expected. These differences in overall magnitude are summarised in table 1, with the cases where the EGL bulges out between the cell nuclei highlighted.
For reference, we also performed some computations for a bare vessel, i.e. no EGL. Interestingly, the maximum fluid shear stress in the absence of an EGL is 0.80 of the reference stress, i.e. the elastic stress where there is an EGL with
 $t_{min}=1.5$
and
$t_{min}=1.5$
and
 ${\it\alpha}_{0}=1.8$
. This is less than the total shear stress borne by the wall (which is equivalent to the solid stress, as the fluid shear stresses are so small) for even the thinnest non-redistributed EGL considered. Redistribution of the EGL does appear to lower the total shear stresses to levels below those observed in the absence of an EGL for the larger values of
${\it\alpha}_{0}=1.8$
. This is less than the total shear stress borne by the wall (which is equivalent to the solid stress, as the fluid shear stresses are so small) for even the thinnest non-redistributed EGL considered. Redistribution of the EGL does appear to lower the total shear stresses to levels below those observed in the absence of an EGL for the larger values of
 ${\it\alpha}_{0}$
, although the maximum total stress for a redistributed EGL with
${\it\alpha}_{0}$
, although the maximum total stress for a redistributed EGL with
 ${\it\alpha}_{0}=1.8$
remains roughly equal to the maximum fluid shear stress in the absence of an EGL, except for
${\it\alpha}_{0}=1.8$
remains roughly equal to the maximum fluid shear stress in the absence of an EGL, except for
 $t_{min}=1.5$
.
$t_{min}=1.5$
.
This suggests that the EGL does not reduce stress, so much as change the way it is experienced by the wall. In the case of a bare vessel, all of the stress is in the form of fluid shear stress experienced directly on the wall. However, when an EGL is present, practically all of the stress borne by the wall is in the form of solid stress (the fluid shear stress is
 $10^{-3}$
smaller than the solid stress). This means that when an EGL is present, rather than experiencing fluid shear stress directly, the shear stress is experienced on the macromolecular network that makes up the EGL. This is then transmitted into the wall and endothelial cells by the membrane-bound proteins that are anchored to endothelial cells and the underlying cortical cytoskeleton. This, in turn, assists remodelling of the endothelial cells, which become aligned with the flow direction.
$10^{-3}$
smaller than the solid stress). This means that when an EGL is present, rather than experiencing fluid shear stress directly, the shear stress is experienced on the macromolecular network that makes up the EGL. This is then transmitted into the wall and endothelial cells by the membrane-bound proteins that are anchored to endothelial cells and the underlying cortical cytoskeleton. This, in turn, assists remodelling of the endothelial cells, which become aligned with the flow direction.
Using the fluid velocities obtained from the asymptotic treatment, we also make comparisons with the fluid velocities found in Weinbaum et al. (Reference Weinbaum, Zhang, Yuefeng Han and Cowin2003). By considering the radius and spacing of core proteins in the EGL’s ultrastructure, Weinbaum et al. (Reference Weinbaum, Zhang, Yuefeng Han and Cowin2003) obtain a Darcy permeability of
 $K_{P}=3\times 10^{-14}~\text{cm}^{2}$
, which corresponds to
$K_{P}=3\times 10^{-14}~\text{cm}^{2}$
, which corresponds to
 ${\it\lambda}=10^{4.2}$
. Using this
${\it\lambda}=10^{4.2}$
. Using this
 ${\it\lambda}$
and redimensionalising our flow results using the pressure drop per unit length
${\it\lambda}$
and redimensionalising our flow results using the pressure drop per unit length
 ${\rm\Delta}P/L=40~\text{kPa}~\text{m}^{-1}$
(Long et al.
Reference Long, Smith, Pries, Ley and Damiano2004), a fluid dynamic viscosity of
${\rm\Delta}P/L=40~\text{kPa}~\text{m}^{-1}$
(Long et al.
Reference Long, Smith, Pries, Ley and Damiano2004), a fluid dynamic viscosity of
 ${\it\mu}_{f}=10^{-3}~\text{Pa}~\text{s}$
and a vessel radius of
${\it\mu}_{f}=10^{-3}~\text{Pa}~\text{s}$
and a vessel radius of
 $R=30~{\rm\mu}\text{m}$
gives a centreline velocity of approximately
$R=30~{\rm\mu}\text{m}$
gives a centreline velocity of approximately
 $9~\text{mm}~\text{s}^{-1}$
, compared with the
$9~\text{mm}~\text{s}^{-1}$
, compared with the
 $1.4~\text{mm}~\text{s}^{-1}$
value obtained in Weinbaum et al. (Reference Weinbaum, Zhang, Yuefeng Han and Cowin2003). The slip velocity at the outer edge of the EGL from the Darcy region is between
$1.4~\text{mm}~\text{s}^{-1}$
value obtained in Weinbaum et al. (Reference Weinbaum, Zhang, Yuefeng Han and Cowin2003). The slip velocity at the outer edge of the EGL from the Darcy region is between
 $2.7~{\rm\mu}\text{m}~\text{s}^{-1}$
(at cell peaks along the minor axis) and
$2.7~{\rm\mu}\text{m}~\text{s}^{-1}$
(at cell peaks along the minor axis) and
 $0.9~{\rm\mu}\text{m}~\text{s}^{-1}$
(in between the cells along the major axis), compared with
$0.9~{\rm\mu}\text{m}~\text{s}^{-1}$
(in between the cells along the major axis), compared with
 $3~{\rm\mu}\text{m}~\text{s}^{-1}$
in Weinbaum et al. (Reference Weinbaum, Zhang, Yuefeng Han and Cowin2003). Finally, the velocity within the EGL is no longer uniform in our model due to the undulating geometry; we find an average velocity within the EGL of roughly
$3~{\rm\mu}\text{m}~\text{s}^{-1}$
in Weinbaum et al. (Reference Weinbaum, Zhang, Yuefeng Han and Cowin2003). Finally, the velocity within the EGL is no longer uniform in our model due to the undulating geometry; we find an average velocity within the EGL of roughly
 $0.3~\text{nm}~\text{s}^{-1}$
, compared with the nearly uniform velocity of
$0.3~\text{nm}~\text{s}^{-1}$
, compared with the nearly uniform velocity of
 $6~\text{nm}~\text{s}^{-1}$
in Weinbaum et al. (Reference Weinbaum, Zhang, Yuefeng Han and Cowin2003). These velocities are of a similar order of magnitude to ours, but quantitatively different. This is probably due to the smaller vessel used in Weinbaum et al. (Reference Weinbaum, Zhang, Yuefeng Han and Cowin2003), and a different vessel shape in our study.
$6~\text{nm}~\text{s}^{-1}$
in Weinbaum et al. (Reference Weinbaum, Zhang, Yuefeng Han and Cowin2003). These velocities are of a similar order of magnitude to ours, but quantitatively different. This is probably due to the smaller vessel used in Weinbaum et al. (Reference Weinbaum, Zhang, Yuefeng Han and Cowin2003), and a different vessel shape in our study.
We have also performed some computations using the two-layer model of Sharan & Popel (Reference Sharan and Popel2001), which approximates the presence of red blood cells in the vessel lumen. The maximum magnitudes for this model are shown in table 3. In these simulations, we have only considered the solid stress as it has previously been shown to be dominant. Under the two-layer model, we see the same trend in how the wall shear responds to changes in the EGL thickness and redistribution as observed for the flow of plasma alone. For example, from the first two rows in tables 1 and 3, it can be seen that the relative increases in solid stress with EGL thickness are comparable, as too are the relative decreases in stress under redistribution. (Of course, the absolute values are different between the two models, which is unsurprising given that in the Sharan & Popel (Reference Sharan and Popel2001) model, even the cell-depleted layer has a viscosity greater than that of pure plasma, to account for the occasional intrusions of red blood cells.)
Table 3. The maximum magnitude of the longitudinal elastic shear stress for the two-layer Stokes model, normalised on the solid stress value for a non-redistributed EGL with
 $t_{min}=1.5$
, which has a non-dimensional stress value of 1.563 (note that this differs from tables 1 and 2). Stress values are given for a non-redistributed EGL and a redistributed EGL with amplitude factor
$t_{min}=1.5$
, which has a non-dimensional stress value of 1.563 (note that this differs from tables 1 and 2). Stress values are given for a non-redistributed EGL and a redistributed EGL with amplitude factor
 ${\it\alpha}_{0}=1.8$
, 2.2 and 3.4 respectively. The highlighted cells denote cases where the EGL protrudes further into the vessel between the cell nuclei as compared with at the cell nuclei.
${\it\alpha}_{0}=1.8$
, 2.2 and 3.4 respectively. The highlighted cells denote cases where the EGL protrudes further into the vessel between the cell nuclei as compared with at the cell nuclei.

Finally, we are also able to consider the net flux of fluid into the EGL, as previously investigated by Wei et al. (Reference Wei, Waters, Liu and Grotberg2003). In figure 6, we plot this flux for both a redistributed EGL (a) and a non-redistributed EGL (b). At higher permeabilities, there is evidently marginally more net flux into a redistributed EGL than into a non-redistributed EGL. We see that the flux into the EGL decreases as its permeability decreases, as would reasonably be expected, although this is observed to occur less rapidly for a redistributed EGL.

Figure 6. Volume flux through the interface divided by the total inlet volume flux against
 ${\it\lambda}$
for EGL thicknesses of
${\it\lambda}$
for EGL thicknesses of
 $t_{min}=0.25$
, 0.5,1 and 1.5 for (a) a redistributed EGL and (b) a non-redistributed EGL.
$t_{min}=0.25$
, 0.5,1 and 1.5 for (a) a redistributed EGL and (b) a non-redistributed EGL.
6 Conclusions
In this study, we have used a biphasic mixture theory model to investigate the impact that redistribution of the EGL to the regions between the cell nuclei has upon the shear stresses experienced by a microvessel’s endothelium. Furthermore, we have conducted these simulations in geometries that we feel better reflect vessel physiology than those used in earlier related modelling studies. Such a redistribution is believed to play an important role in protecting the endothelial cells that line the vessel from damaging levels of fluid shear stress (Yao et al. Reference Yao, Rabodzey and Dewey2007). At the same time, however, the EGL is believed to play a role in transferring mechanical stresses from the flow in the vessel lumen. Consequently, it is believed that much of the solid stress is carried through the solid phase of the EGL, rather than its fluid phase (Weinbaum et al. Reference Weinbaum, Tarbell and Damiano2007). In addition, we also considered a two-layer viscosity model to investigate the effect of red blood cells in the lumen on this solid stress. Under this model, we found similar trends in stress response to EGL redistribution and thickness to those predicted by the single-layer model.
Our computations have provided some quantitative insights into the influence of the EGL on fluid shear stresses in a physiologically realistic setting, where experimental measurements are highly challenging. At one end of the physiological range, for minimum EGL thickness (at the peaks of the cell nuclei),
 $1.5~{\rm\mu}\text{m}$
, we observe that redistribution of the EGL can lead to a 46 % reduction in fluid shear stress. However, as the EGL becomes thinner, its redistribution makes less impact upon the surface shear stresses. For example, when
$1.5~{\rm\mu}\text{m}$
, we observe that redistribution of the EGL can lead to a 46 % reduction in fluid shear stress. However, as the EGL becomes thinner, its redistribution makes less impact upon the surface shear stresses. For example, when
 $t_{min}=0.5~{\rm\mu}\text{m}$
, redistribution produces only a 26 % reduction in fluid shear stress, and almost no reduction at all when
$t_{min}=0.5~{\rm\mu}\text{m}$
, redistribution produces only a 26 % reduction in fluid shear stress, and almost no reduction at all when
 $t_{min}=0.25~{\rm\mu}\text{m}$
. We see that the magnitude of the fluid shear stress on the endothelium increases as the EGL becomes thinner. We also note the degree to which this stress reduction is a function of the shape of the redistributed EGL.
$t_{min}=0.25~{\rm\mu}\text{m}$
. We see that the magnitude of the fluid shear stress on the endothelium increases as the EGL becomes thinner. We also note the degree to which this stress reduction is a function of the shape of the redistributed EGL.
Similarly, EGL redistribution leads to a reduction in the elastic shear stresses exerted upon the endothelium, although to a lesser extent than in the fluid phase. Moreover, these elastic stresses reduce in magnitude as the EGL becomes thinner, perhaps due to a decreased volume of solid phase that is exposed to the flow forcing. Furthermore, the elastic stresses are much larger (by three orders of magnitude) than the fluid shear stresses in this very-low-permeability environment, which seems to add some weight to the idea that the bulk of mechanical stress is carried through the solid phase of the EGL, rather than its fluid phase.
Perhaps unexpectedly, a non-redistributed EGL is seen to lead to higher total shear stresses (i.e. fluid stresses plus elastic stresses) than in a vessel where no EGL is present (and where there is only fluid shear stress). The EGL itself consists of a network of membrane-bound proteins, and so in practice the form of the stress transduction through the solid phase of the EGL is likely to be a function of the EGL’s complex structural geometry. For instance, cytoskeletal reorganisation has been shown to depend on an intact EGL, and this is believed to be caused by an integrated torque being transmitted through the EGL to a cell’s dense peripheral actin band (DPAB) (Thi et al.
Reference Thi, Tarbell, Weinbaum and Spray2004). Therefore, it would seem from these findings that the redistributed EGL fulfils its protective role by converting fluid shear stresses into stresses in the solid matrix rather than by eliminating stress per se, and these solid stresses can in turn remodel the cells so that they are aligned with the flow direction. Redistribution of the EGL can lead to total shear stresses lower than those experienced by these bare vessels. Here, the elastic shear stresses dominate over the contribution from the fluid shear stresses. However, as the minimum EGL thickness
 $t_{min}$
becomes smaller, the thickness of the layer between cell nuclei (as measured by
$t_{min}$
becomes smaller, the thickness of the layer between cell nuclei (as measured by
 ${\it\alpha}_{0}$
) must become greater for this to be the case. A summary of the impact of EGL redistribution for the different cases considered is given in tables 1–3.
${\it\alpha}_{0}$
) must become greater for this to be the case. A summary of the impact of EGL redistribution for the different cases considered is given in tables 1–3.
We also observe the appearance of regions of negative fluid shear stress immediately upstream and downstream of the cell nuclei. This phenomenon has been noted in previous two-dimensional models of EGL-lined microvessels, and has been shown to be associated with flow eddies (Wei et al.
Reference Wei, Waters, Liu and Grotberg2003; Sumets et al.
Reference Sumets, Cater, Long and Clarke2015). Such regions of recirculating flow have the ability to increase the residence time of blood components, and therefore have consequences for microvascular health. We observed that redistribution of the EGL was able to suppress these negative fluid shear stress regions for thicker layers (
 $t_{min}=1.5~{\rm\mu}\text{m}$
), although not for the thinner EGLs.
$t_{min}=1.5~{\rm\mu}\text{m}$
), although not for the thinner EGLs.
The heterogeneous nature of the EGL (and difficulty in measuring its thickness) has been highlighted in experiments conducted by Ebong et al. (Reference Ebong, Macaluso, Spray and Tarbell2011), using rapid freezing/freeze substitution transmission electron microscopy (RF/FS TEM), where the vitrified water surrounding the cells is replaced by acetone through freeze substitution to better preserve the EGL. This level of structural complexity (ultrastructure) is of course lost under a volume-averaged biphasic mixture theory representation. On the other hand, it is not really computationally feasible to conduct explicit simulations of the entire EGL lining in a given microvessel. However, it may be possible to derive a more representative non-isotropic continuum-level description of the EGL by applying homogenisation theory to a computationally manageable portion of the EGL, and this is an avenue that we intend to pursue in future work. Doing so may allow us to make more refined predictions of the integrated forces and torques transmitted through the EGL and into the actin cortical skeleton, as per Weinbaum et al. (Reference Weinbaum, Zhang, Yuefeng Han and Cowin2003). Moreover, it could be valuable to examine effects such as leukocyte microvillus penetration into the EGL, which is implicated in leukocyte capture (Zhao et al. Reference Zhao, Chien and Weinbaum2001). Developments in experimental methods continue to elucidate the EGL’s ultrastructure and biochemical organisation (see Tarbell et al. (Reference Tarbell, Simon and Curry2014) for a more complete review of recent advances in this area), and these will be crucial to the development of any future physiologically faithful EGL models. In a similar vein, in vivo confocal microscope data of an entire vessel endothelium, where both the cell membrane and cell nuclei can be extracted in postprocessing, would remove the need for the type of endothelial reconstruction undertaken here.
It should be noted that in this study we have not considered transmural plasma flux through the interendothelium clefts. The small size of these clefts, which are
 $O(0.01)~{\rm\mu}\text{m}$
in width (Clough & Michel Reference Clough and Michel1998), makes it unlikely that their fluxes could be modelled explicitly within a macroscopic length of vessel. Here, a multiscale approach might instead prove fruitful. One possibility might be to conduct the type of homogenisation discussed above, but using two small length scales, the smallest scale being comparable with the EGL’s brush microstructure, and the second small scale being based upon the size of an endothelial cell. Where appropriate, interendothelial flux conditions could be applied. As discussed in the introduction, this could prove useful for examining the EGL’s role in aggregating LDLs onto the endothelium. This has previously been modelled in idealised vessel geometries (Vincent et al.
Reference Vincent, Sherwin and Weinberg2009, Reference Vincent, Sherwin and Weinberg2010), and is considered of importance due to the associations with conditions such as atherogenesis.
$O(0.01)~{\rm\mu}\text{m}$
in width (Clough & Michel Reference Clough and Michel1998), makes it unlikely that their fluxes could be modelled explicitly within a macroscopic length of vessel. Here, a multiscale approach might instead prove fruitful. One possibility might be to conduct the type of homogenisation discussed above, but using two small length scales, the smallest scale being comparable with the EGL’s brush microstructure, and the second small scale being based upon the size of an endothelial cell. Where appropriate, interendothelial flux conditions could be applied. As discussed in the introduction, this could prove useful for examining the EGL’s role in aggregating LDLs onto the endothelium. This has previously been modelled in idealised vessel geometries (Vincent et al.
Reference Vincent, Sherwin and Weinberg2009, Reference Vincent, Sherwin and Weinberg2010), and is considered of importance due to the associations with conditions such as atherogenesis.
In situations where the EGL becomes significantly deformed (say due to the passage of white blood cells), it may be necessary to consider finite-strain elastic deformations of the glycocalyx. Here, the immersed boundary method may prove useful (Peskin Reference Peskin1972) (and also possibly for solving the unit cell problem for flow around individual EGL brushes, required as part of homogenisation). The deformability of red blood cells themselves has also been shown to be important to events such as the pop out phenomenon (Secomb et al. Reference Secomb, Hsu and Pries2001), whereby red blood cells that initially penetrate into the EGL when the flow is slow can deform and leave the EGL when flow speeds increase. Although we have used a two-layer viscosity model in this study to consider the aggregated effect of red blood cells confined to a core region of the lumen, incorporation of the possibility for pop out would require explicit treatment of individual nonlinearly elastic cells. It would also of course be valuable to be able to explicitly simulate the transport of a population of red blood cells through the EGL-lined vessel. This would provide a test (in the context of an EGL-coated vessel) of the two-layer viscosity model of Sharan & Popel (Reference Sharan and Popel2001), where the outer viscosity accounts for occasional intrusion of red blood cells into the cell-depleted layer. One way to achieve this is through the moving particle semi-implicit (MPS) method, which can be used to explicitly model red blood cells in the lumen (Gambaruto Reference Gambaruto2015). As is demonstrated by the two-layer viscosity model, the decoupling of the EGL from the lumen allows more sophisticated models to be used for the lumen without drastically increasing the overall computational cost of the simulations.
It is worth noting that there are several physical mechanisms other than EGL elasticity that are believed to play a role in the EGL restoring to its original configuration after being deformed. For example, differences in the concentrations of the plasma proteins in the EGL and lumen fluids can generate oncotic pressures, which are capable of restoring the EGL back to an equilibrium configuration following a disturbance to its shape (say from a passing cell) (Secomb et al. Reference Secomb, Hsu and Pries1998). Moreover, the charged nature of the fluid that hydrates the EGL is believed to be capable of generating an electrostatic restoring force (Damiano & Stace Reference Damiano and Stace2005). As such, these effects should be included when modelling an EGL undergoing a dynamic response to some macroscopic event.
Acknowledgements
We are grateful to Dr J. Bodkin and Professor S. Nourshargh, Centre for Microvascular Research, William Harvey Research Institute, Barts and The London Medical School, Queen Mary University of London, for providing us with a confocal microscopy image of a postcapillary venule. We would also like to thank Associate Professor C. Walker and Professor R. Turner for their valuable suggestions around appropriate point process models for generating cell distributions, as well as the referees for their useful comments. We thank the Department of Engineering Science, University of Auckland for its assistance with the publication costs of this article. The authors wish to acknowledge the contribution of NeSI high-performance computing facilities to the results of this research. New Zealand’s national facilities are provided by the NZ eScience Infrastructure and funded jointly by NeSI’s collaborator institutions and through the Ministry of Business, Innovation & Employment’s Research Infrastructure programme, URL https://www.nesi.org.nz. T.C.L. is funded by a University of Auckland Doctoral Scholarship.
Supplementary material
Supplementary material is available at http://dx.doi.org/10.1017/jfm.2016.337.
Appendix A. Boundary element scheme
For the purposes of numerically solving the governing boundary integral equations, a planform representation of the basal surface of the microvessel was decomposed into a mesh of irregular triangular elements in Matlab, using the mesh2d routine (Engwirda Reference Engwirda2009). This triangular mesh was then projected onto the elevated endothelium surface, as well as the EGL–lumen interface.
We assume that the flow quantities are constant on each of the
 $N$
triangular elements within the surface meshes (i.e. a constant basis function), meaning that the boundary integral equations for coupled Stokes–Brinkman flows (2.1), (2.3), (2.7)–(2.11) can be expressed in the following discretised form:
$N$
triangular elements within the surface meshes (i.e. a constant basis function), meaning that the boundary integral equations for coupled Stokes–Brinkman flows (2.1), (2.3), (2.7)–(2.11) can be expressed in the following discretised form:
 $$\begin{eqnarray}\displaystyle u_{j}^{(m)}=-\frac{1}{4{\rm\pi}}\mathop{\sum }_{l=1}^{N}f_{i}^{(l)}S_{ij}^{(ml)}+\frac{1}{4{\rm\pi}}\mathop{\sum }_{l=1}^{N}u_{i}^{(l)}T_{ijk}^{(ml)}n_{k}, & & \displaystyle\end{eqnarray}$$
 $$\begin{eqnarray}\displaystyle S_{ij}^{(ml)}=\int _{E^{(l)}}\mathscr{S}_{ij}(\boldsymbol{x}-\boldsymbol{x}_{0}^{(m)})\,\text{d}S(\boldsymbol{x}),\quad T_{ijk}^{(ml)}=\int _{E^{(l)}}\mathscr{T}_{ijk}(\boldsymbol{x}-\boldsymbol{x}_{0}^{(m)})\,\text{d}S(\boldsymbol{x}) & & \displaystyle\end{eqnarray}$$
(
 $m=1,\ldots ,N$
), where
$m=1,\ldots ,N$
), where
 $E^{(l)}$
represents the surface of the
$E^{(l)}$
represents the surface of the
 $l$
th triangular element, defined by vertices
$l$
th triangular element, defined by vertices
 $\boldsymbol{x}_{1}^{(l)}$
,
$\boldsymbol{x}_{1}^{(l)}$
,
 $\boldsymbol{x}_{2}^{(l)}$
and
$\boldsymbol{x}_{2}^{(l)}$
and
 $\boldsymbol{x}_{3}^{(l)}$
, and
$\boldsymbol{x}_{3}^{(l)}$
, and
 $\mathscr{S}_{ij}$
denotes either the Stokes flow Stokeslet,
$\mathscr{S}_{ij}$
denotes either the Stokes flow Stokeslet,
 $S_{ij}^{(1)}$
, or the Brinkman flow Stokeslet,
$S_{ij}^{(1)}$
, or the Brinkman flow Stokeslet,
 $S_{ij}^{(2)}$
, as appropriate (similarly for
$S_{ij}^{(2)}$
, as appropriate (similarly for
 $\mathscr{T}_{ijk}$
). Here,
$\mathscr{T}_{ijk}$
). Here,
 $\boldsymbol{x}_{0}^{(m)}$
is the collocation point on the
$\boldsymbol{x}_{0}^{(m)}$
is the collocation point on the
 $m$
th element, and
$m$
th element, and
 $\boldsymbol{u}^{(m)}$
and
$\boldsymbol{u}^{(m)}$
and
 $\boldsymbol{f}^{(l)}$
are the flow velocities and tractions on the
$\boldsymbol{f}^{(l)}$
are the flow velocities and tractions on the
 $m$
th and
$m$
th and
 $l$
th elements respectively.
$l$
th elements respectively.
Similarly, the boundary integral representation of pressure (3.9) can be discretised as
 $$\begin{eqnarray}\displaystyle p^{(m)}=\mathop{\sum }_{l=1}^{N}q^{(l)}G^{(ml)}-\mathop{\sum }_{l=1}^{N}p^{(l)}Q^{(ml)}, & & \displaystyle\end{eqnarray}$$
 $$\begin{eqnarray}\displaystyle G^{(ml)}=\int _{E^{(l)}}G(\boldsymbol{x}-\boldsymbol{x}_{0}^{(m)})\,\text{d}S(\boldsymbol{x}),\quad Q^{(ml)}=\int _{E^{(l)}}\boldsymbol{{\rm\nabla}}G(\boldsymbol{x}-\boldsymbol{x}_{0}^{(m)})\boldsymbol{\cdot }\boldsymbol{n}\,\text{d}S(\boldsymbol{x}), & & \displaystyle\end{eqnarray}$$
where
 $q=\boldsymbol{{\rm\nabla}}p\boldsymbol{\cdot }\boldsymbol{n}$
.
$q=\boldsymbol{{\rm\nabla}}p\boldsymbol{\cdot }\boldsymbol{n}$
.
Finally, the boundary integral representation for the asymptotic form of the solid phase can be expressed in a similar form as
 $$\begin{eqnarray}\displaystyle & \displaystyle (u_{s})_{j}^{(m)}=\frac{1}{8{\rm\pi}(1-{\it\nu})}\left(-\mathop{\sum }_{l=1}^{N}h_{i}^{(l)}H_{ij}^{(ml)}+\mathop{\sum }_{l=1}^{N}(u_{s})_{i}^{(l)}K_{ijk}^{(ml)}n_{k}\right) & \displaystyle \nonumber\\ \displaystyle & \displaystyle \hspace{48.00009pt}-\,\frac{1-2{\it\nu}}{8{\rm\pi}(1-{\it\nu}){\it\phi}_{f}}\mathop{\sum }_{l=1}^{N}q^{(l)}L_{j}^{(ml)}+\frac{1}{4{\rm\pi}{\it\phi}_{f}}\mathop{\sum }_{l=1}^{N}p^{(l)}M_{jk}^{(ml)}n_{k}, & \displaystyle\end{eqnarray}$$
 $$\begin{eqnarray}\displaystyle H_{ij}^{(ml)}=\int _{E^{(l)}}\mathscr{H}_{ij}(\boldsymbol{x}-\boldsymbol{x}_{0}^{(m)})\,\text{d}S(\boldsymbol{x}),\quad K_{ijk}^{(ml)}=\int _{E^{(l)}}\mathscr{K}_{ijk}(\boldsymbol{x}-\boldsymbol{x}_{0}^{(m)})\,\text{d}S(\boldsymbol{x}), & & \displaystyle\end{eqnarray}$$
 $$\begin{eqnarray}\displaystyle L_{ij}^{(ml)}=\int _{E^{(l)}}\frac{(\boldsymbol{x}-\boldsymbol{x}_{0}^{(m)})_{j}}{r}\,\text{d}S(\boldsymbol{x}),\quad M_{ijk}^{(ml)}=\int _{E^{(l)}}\frac{{\it\delta}_{jk}}{r}+\frac{(\boldsymbol{x}-\boldsymbol{x}_{0}^{(m)})_{j}(\boldsymbol{x}-\boldsymbol{x}_{0}^{(m)})_{k}}{r^{3}}\,\text{d}S(\boldsymbol{x}), & & \displaystyle \nonumber\\ \displaystyle & & \displaystyle\end{eqnarray}$$
where
 $\mathscr{H}_{ij}$
and
$\mathscr{H}_{ij}$
and
 $\mathscr{K}_{ijk}$
denote the Green’s functions for Navier’s equation (see Sumets et al.
Reference Sumets, Cater, Long and Clarke2015).
$\mathscr{K}_{ijk}$
denote the Green’s functions for Navier’s equation (see Sumets et al.
Reference Sumets, Cater, Long and Clarke2015).
It proves convenient to perform the necessary integrations in a barycentric coordinate system (
 ${\it\xi},{\it\eta}$
), defined on each element by (Pozrikidis Reference Pozrikidis2002)
${\it\xi},{\it\eta}$
), defined on each element by (Pozrikidis Reference Pozrikidis2002)
 $$\begin{eqnarray}\displaystyle \boldsymbol{y}^{(m)}=\boldsymbol{y}_{1}^{(m)}(1-{\it\xi}-{\it\eta})+\boldsymbol{y}_{2}^{(m)}{\it\xi}+\boldsymbol{y}_{3}^{(m)}{\it\eta} & & \displaystyle\end{eqnarray}$$
(
 $m=1,\ldots ,N$
), where
$m=1,\ldots ,N$
), where
 $\boldsymbol{y}_{j}^{(m)}=\boldsymbol{x}_{j}^{(m)}-\boldsymbol{x}_{0}$
(
$\boldsymbol{y}_{j}^{(m)}=\boldsymbol{x}_{j}^{(m)}-\boldsymbol{x}_{0}$
(
 $j=1,\ldots ,3$
). Hence, for example,
$j=1,\ldots ,3$
). Hence, for example,
 $$\begin{eqnarray}\int _{E^{(l)}}\mathscr{S}_{ij}(\boldsymbol{x}-\boldsymbol{x}_{0}^{(m)})\text{d}\mathscr{S}(\boldsymbol{x})=\text{J}\int _{0}^{1}\int _{0}^{1-{\it\xi}}\mathscr{S}_{ij}({\it\xi},{\it\eta})\,\text{d}{\it\xi}\,\text{d}{\it\eta},\end{eqnarray}$$
where J is the Jacobian for the barycentric transformation. For numerical integration when the collocation point lies on the element of integration, we transform from the barycentric coordinate system to a polar coordinate system (Pozrikidis Reference Pozrikidis2002),
 $$\begin{eqnarray}\displaystyle {\it\xi}={\it\rho}\cos {\it\theta},\quad {\it\eta}={\it\rho}\sin {\it\theta}. & & \displaystyle\end{eqnarray}$$
Consequently,
 $$\begin{eqnarray}\text{J}\int _{0}^{1}\int _{0}^{1-{\it\xi}}\mathscr{S}_{ij}({\it\xi},{\it\eta})\text{d}{\it\xi}\,\text{d}{\it\eta}=\text{J}\int _{0}^{{\rm\pi}/2}\int _{0}^{(\sin {\it\theta}+\cos {\it\theta})^{-1}}\mathscr{S}_{ij}({\it\rho},{\it\theta}){\it\rho}\text{d}{\it\rho}\,\text{d}{\it\theta},\end{eqnarray}$$
which is advantageous, since the Jacobian
 ${\it\rho}$
now cancels the
${\it\rho}$
now cancels the
 $1/{\it\rho}$
singular behaviour in
$1/{\it\rho}$
singular behaviour in
 $\mathscr{S}_{ij}$
, hence regularising the integral, and allowing standard quadrature methods to be applied. The double-layer potentials (i.e. those involving
$\mathscr{S}_{ij}$
, hence regularising the integral, and allowing standard quadrature methods to be applied. The double-layer potentials (i.e. those involving
 $\mathscr{T}_{ijk}$
) are only defined in a Cauchy principal value, and hence formally have a non-regularisable singularity. However, under the assumption of a constant basis and flat elements, where normals are perpendicular to
$\mathscr{T}_{ijk}$
) are only defined in a Cauchy principal value, and hence formally have a non-regularisable singularity. However, under the assumption of a constant basis and flat elements, where normals are perpendicular to
 $\boldsymbol{x}$
–
$\boldsymbol{x}$
–
 $\boldsymbol{x}_{0}$
when both
$\boldsymbol{x}_{0}$
when both
 $\boldsymbol{x}$
and
$\boldsymbol{x}$
and
 $\boldsymbol{x}_{0}$
lie on the same element, their contribution is exactly zero.
$\boldsymbol{x}_{0}$
lie on the same element, their contribution is exactly zero.
From (A 1), we hence obtain the linear system
 $$\begin{eqnarray}\displaystyle \boldsymbol{A}\boldsymbol{x}=\boldsymbol{b}. & & \displaystyle\end{eqnarray}$$
Here,
 $\boldsymbol{x}$
is a vector that contains the unknown velocities and tractions on the discretised endothelium and lumen–EGL interface, and
$\boldsymbol{x}$
is a vector that contains the unknown velocities and tractions on the discretised endothelium and lumen–EGL interface, and
 $\boldsymbol{b}$
is a vector of prescribed tractions and velocities on these surfaces (multiplied by appropriate coefficients
$\boldsymbol{b}$
is a vector of prescribed tractions and velocities on these surfaces (multiplied by appropriate coefficients
 $\mathscr{S}_{ij}$
,
$\mathscr{S}_{ij}$
,
 $\mathscr{T}_{ijk}$
). Similarly, (A 2) yields the linear system
$\mathscr{T}_{ijk}$
). Similarly, (A 2) yields the linear system
 $$\begin{eqnarray}\displaystyle \boldsymbol{B}\boldsymbol{y}=\boldsymbol{c}, & & \displaystyle\end{eqnarray}$$
where
 $\boldsymbol{y}$
and
$\boldsymbol{y}$
and
 $\boldsymbol{c}$
are respectively vectors of unknown and known pressures, and pressure fluxes,
$\boldsymbol{c}$
are respectively vectors of unknown and known pressures, and pressure fluxes,
 $q$
, on the discretised surfaces and interfaces.
$q$
, on the discretised surfaces and interfaces.
Once the pressures have been calculated, the slip velocities are calculated using the boundary integral representation
 $$\begin{eqnarray}\displaystyle & & \displaystyle \boldsymbol{{\rm\nabla}}p(\boldsymbol{x}_{0})\boldsymbol{\cdot }\boldsymbol{t}(\boldsymbol{x}_{0})=\frac{1}{2{\rm\pi}}\unicode[STIX]{x2A0D}_{\mathscr{S}}\boldsymbol{{\rm\nabla}}p(\boldsymbol{x})\boldsymbol{\cdot }\boldsymbol{n}(\boldsymbol{x})~\frac{(\boldsymbol{x}-\boldsymbol{x}_{0})\boldsymbol{\cdot }\boldsymbol{t}(\boldsymbol{x}_{0})}{r^{3}}\,\text{d}S(\boldsymbol{x})\nonumber\\ \displaystyle & & \displaystyle \qquad -\,\frac{1}{2{\rm\pi}}\unicode[STIX]{x2A0E}_{\mathscr{S}}p(\boldsymbol{x})\left(\frac{\boldsymbol{t}(\boldsymbol{x}_{0})\boldsymbol{\cdot }\boldsymbol{n}(\boldsymbol{x})}{r^{3}}-3\frac{[(\boldsymbol{x}-\boldsymbol{x}_{0})\boldsymbol{\cdot }\boldsymbol{t}(\boldsymbol{x}_{0})][(\boldsymbol{x}-\boldsymbol{x}_{0})\boldsymbol{\cdot }\boldsymbol{n}(\boldsymbol{x})]}{r^{5}}\right)\,\text{d}S(\boldsymbol{x}),\nonumber\\ \displaystyle & & \displaystyle\end{eqnarray}$$
where
 $\unicode[STIX]{x2A0E}$
denotes a Hadamard finite part integral. For the flat triangular elements used here, the Hadamard finite part integral evaluates to zero due to the
$\unicode[STIX]{x2A0E}$
denotes a Hadamard finite part integral. For the flat triangular elements used here, the Hadamard finite part integral evaluates to zero due to the
 $\boldsymbol{x}$
–
$\boldsymbol{x}$
–
 $\boldsymbol{x}_{0}$
being tangential to the normal vector for singular integrals. The Cauchy principal value integral is evaluated using the quadrature given by Guiggiani & Gigante (Reference Guiggiani and Gigante1990).
$\boldsymbol{x}_{0}$
being tangential to the normal vector for singular integrals. The Cauchy principal value integral is evaluated using the quadrature given by Guiggiani & Gigante (Reference Guiggiani and Gigante1990).
The equations for the solid phase elasticity (A 3) also form a similar linear system,
 $$\begin{eqnarray}\displaystyle \boldsymbol{C}\boldsymbol{z}=\boldsymbol{d}, & & \displaystyle\end{eqnarray}$$
where
 $\boldsymbol{z}$
is the vector of unknown solid displacements and tractions, and
$\boldsymbol{z}$
is the vector of unknown solid displacements and tractions, and
 $\boldsymbol{d}$
is the vector of known solid displacements and tractions along with the known pressures and pressure fluxes. The Cauchy principal value integrals present in (A 3) are evaluated in the same fashion as was done for the slip velocities.
$\boldsymbol{d}$
is the vector of known solid displacements and tractions along with the known pressures and pressure fluxes. The Cauchy principal value integrals present in (A 3) are evaluated in the same fashion as was done for the slip velocities.
The integrals (A 5) and (A 7) are computed using an
 $h$
-adaptive quadrature from the Cubature package (Johnson Reference Johnson2013). This computes all elements of the Green’s tensor at once, which leads to fast quadrature speeds. These linear systems (A 8), (A 9) and (A 11) are constructed and solved using the Portable Extensible Toolkit for Scientific Computation (PETSc) (Balay et al.
Reference Balay, Gropp, McInnes, Smith, Arge, Bruaset and Langtangen1997, Reference Balay, Abhyankar, Adams, Brown, Brune, Buschelman, Eijkhout, Gropp, Kaushik and Knepley2014a
,Reference Balay, Abhyankar, Adams, Brown, Brune, Buschelman, Eijkhout, Gropp, Kaushik and Knepley
b
). PETSc allows construction of matrices in parallel across multiple CPU cores (this step is embarrassingly parallel, and so scales linearly). The matrix for the Brinkman–Stokes coupled solver is stored in compressed sparse row format to exploit the sparsity resulting from the coupled system, while the matrices for the Laplacian and linear elasticity solvers are stored in a dense format. The linear systems are solved iteratively, and in parallel over multiple cores, using GMRES with a Jacobi preconditioner.
$h$
-adaptive quadrature from the Cubature package (Johnson Reference Johnson2013). This computes all elements of the Green’s tensor at once, which leads to fast quadrature speeds. These linear systems (A 8), (A 9) and (A 11) are constructed and solved using the Portable Extensible Toolkit for Scientific Computation (PETSc) (Balay et al.
Reference Balay, Gropp, McInnes, Smith, Arge, Bruaset and Langtangen1997, Reference Balay, Abhyankar, Adams, Brown, Brune, Buschelman, Eijkhout, Gropp, Kaushik and Knepley2014a
,Reference Balay, Abhyankar, Adams, Brown, Brune, Buschelman, Eijkhout, Gropp, Kaushik and Knepley
b
). PETSc allows construction of matrices in parallel across multiple CPU cores (this step is embarrassingly parallel, and so scales linearly). The matrix for the Brinkman–Stokes coupled solver is stored in compressed sparse row format to exploit the sparsity resulting from the coupled system, while the matrices for the Laplacian and linear elasticity solvers are stored in a dense format. The linear systems are solved iteratively, and in parallel over multiple cores, using GMRES with a Jacobi preconditioner.
The Brinkman–Stokes coupled solver was verified by simulating a uniform circular tube and comparing with the analytic solution given by (4.1). The Laplacian solver for pressure was verified using a uniform tube with two different constant pressures prescribed at the entry and exit, and impermeability on the sides of the vessel, which reproduced the expected linear pressure drop. The linear elasticity solver was similarly verified using a uniform tube.
In terms of the mesh sizes used for these simulations, the Brinkman–Stokes coupled simulations were run using a mesh size of 67 000 triangular elements, and their convergence was checked using simulations with a mesh size of 140 000 triangular elements. These simulations took approximately 2000 CPU hours and 30 000 CPU hours each respectively. Low-permeability flow simulations were conducted on meshes containing 130 000 triangular elements for the lumen and 250 000 for the EGL, taking approximately 400 CPU hours each. The convergence of these simulations was checked using a simulation with a mesh size of 510 000 triangular elements for the lumen and 1 000 000 triangular elements for the EGL, taking approximately 5000 CPU hours each. The solid phase asymptotics simulations were conducted using a mesh size of 140 000 triangular elements and checked with a mesh size of 250 000 triangular elements. Excluding the time taken to solve the fluid phase, the low-resolution simulations for the elastic phase took approximately 250 CPU hours each, while the high-resolution checks took approximately 1000 CPU hours each. The two-layer Stokes model was solved using a similar mesh size to the Brinkman–Stokes coupled simulations and then these results were interpolated to be used in mesh sizes required for the EGL simulations.
Appendix B. Construction of the microvessel endothelium
In order to generate a complete endothelium, we first determined the centroids of the cells in the confocal microscopy data. For regions of the microvessel where we did not have biological data, we used a Strauss hard-core Gibbs point particle model (Baddeley Reference Baddeley2010; Baddeley et al. Reference Baddeley, Turner, Mateu and Bevan2013) to generate cell distributions with the same spatial statistics. This choice of point process model generates spatial distributions that are characterised by two parameters: a minimum separation distance between points (the hard-core distance), and an interaction radius, which moderates the degree of repulsion between points (which consequently have average separations greater than the hard-core distance).

Figure 7. (a) Cell centroids simulated throughout the entire vessel surface, as computed using the R spatstat package (Baddeley & Turner Reference Baddeley and Turner2005) (black circles), also including the original cell centroids obtained from the biological data (red dots). (b,c) Monte Carlo envelopes for 99 simulations of the fitted model were generated to test the goodness of fit of the point particle model. The shaded regions show (b) the nearest-neighbour distance distribution function and (c) the L-function. In both cases, the simulated centroids (black lines) lie within the envelopes, hence offering statistical support for the appropriateness of the spatial distribution of the simulated centroids. The red lines show the mean value for each envelope.

Figure 8. (a) A bubble-growing algorithm is used to construct cell basal surfaces (red lines) from centroids taken from the biological data. Also overlaid are the cell–cell junctions obtained from the data. (b) The normalised cell height profile (solid line) as a function of an arclength parameter
 $s$
obtained by fitting a 10th-order polynomial to scaled digitised biological data provided by Barbee et al. (Reference Barbee, Davies and Lal1994) (black dots). When used to create the topology of endothelial cells, ranges of heights and widths are informed by biological data.
$s$
obtained by fitting a 10th-order polynomial to scaled digitised biological data provided by Barbee et al. (Reference Barbee, Davies and Lal1994) (black dots). When used to create the topology of endothelial cells, ranges of heights and widths are informed by biological data.

Figure 9. (a) Cell height data and (b,c) characteristic shape profiles taken through two orthogonal sections of an unsheared bovine aortic endothelial cell. The heights were measured using atomic force microscopy. Figure reproduced from Barbee et al. (Reference Barbee, Davies and Lal1994) (with permission). The figure illustrates the relatively localised elevated topology about the cell nucleus and also the profile used to create the cell nucleus topology.
This point particle model was implemented using the spatstat library (Baddeley & Turner Reference Baddeley and Turner2005) within the statistical package R. As spatstat assumes an isotropic point pattern, whereas endothelial cells are elongated in nature (hence have centroids that are spatially non-isotropic), we performed this operation on a domain scaled by the mean aspect ratio of the cells, defined to be the major axis over the minor axes, in the confocal microscope data, which we measured to be 1.80. Using a combination of goodness-of-fit experimentation and profile pseudolikelihood (Baddeley Reference Baddeley2010) on the confocal microscope data, we found the appropriate hard-core distance and interaction radius to be
 $13.45~{\rm\mu}\text{m}$
and
$13.45~{\rm\mu}\text{m}$
and
 $16.5~{\rm\mu}\text{m}$
respectively. The remaining required parameters, such as the density of the points and strength of repulsion in the Strauss process, were determined automatically in spatstat using the Huang–Ogata one-step approximation to maximum likelihood. The point particle model was generated using periodic boundaries, so that points were taken to repeat periodically outside of the simulation window. The height (
$16.5~{\rm\mu}\text{m}$
respectively. The remaining required parameters, such as the density of the points and strength of repulsion in the Strauss process, were determined automatically in spatstat using the Huang–Ogata one-step approximation to maximum likelihood. The point particle model was generated using periodic boundaries, so that points were taken to repeat periodically outside of the simulation window. The height (
 $y$
-axis) of this window of simulation was chosen to be the circumference of the ellipse fitted to the biological data (
$y$
-axis) of this window of simulation was chosen to be the circumference of the ellipse fitted to the biological data (
 $187.6~{\rm\mu}\text{m}$
). In order to remove any effects from the periodicity in the longitudinal axis, the simulation was performed over a distance greater than required, and then truncated. An example of a point pattern obtained using this method is shown in figure 7(a). It should be noted that the original centroids (red dots) are retained in the synthesised points.
$187.6~{\rm\mu}\text{m}$
). In order to remove any effects from the periodicity in the longitudinal axis, the simulation was performed over a distance greater than required, and then truncated. An example of a point pattern obtained using this method is shown in figure 7(a). It should be noted that the original centroids (red dots) are retained in the synthesised points.
This model’s goodness of fit was tested by creating Monte Carlo envelopes of the nearest-neighbour distance distribution function and L-function (a measure of interaction based on pairwise distance) for 99 simulations of the fitted model (Illian et al. Reference Illian, Penttinen, Stoyan and Stoyan2008; Baddeley Reference Baddeley2010). As shown in figure 7(b,c), the values of these functions from the original centroid data (black lines) are found to lie within these envelopes (shaded regions), which we take as a basis for accepting the point particle model as a reasonable extension to the biological cell centroid data.
Having synthesised cell centroids across the extent of the entire basal surface of the vessel, we next need to reconstruct the topology of the endothelial cells. The basal surfaces of these cell nuclei were generated using a bubble-growing algorithm (Holcombe Reference Holcombe2011), whereby ellipses with mean aspect ratios matching the biological data for sheared endothelial cells were expanded from their centroids until contact was made with a neighbouring nucleus. This produces the type of localised elevated topology about the cell nucleus observed in experiments (see figure 9). In figure 8(a), we show cell nuclei generated using this method for the biologically obtained (i.e. non-synthesised) centroids (red lines), and observe that these appear to be a reasonable fit within the biological cell–cell junctions (black lines). The topologies of the endothelial cell nuclei above these basal surfaces are modelled upon digitised height profiles taken from Barbee et al. (Reference Barbee, Davies and Lal1994) (figure 9), which we fitted to a 10th degree polynomial using a least squares routine in Matlab. The first and second derivatives of the polynomial were taken to be zero at the endpoints, in order to ensure smooth connectivity. An example resulting profile can be seen in figure 8(b). Here,
 $s$
measures the Euclidean distance in the basal surface from the centroid of the cell, i.e.
$s$
measures the Euclidean distance in the basal surface from the centroid of the cell, i.e.
 $s=0$
at the centroid of the cell, and
$s=0$
at the centroid of the cell, and
 $s=1$
at the cell edge. The maximum height for each cell was sampled from a normal distribution with a mean of
$s=1$
at the cell edge. The maximum height for each cell was sampled from a normal distribution with a mean of
 $1.77~{\rm\mu}\text{m}$
and a standard deviation of
$1.77~{\rm\mu}\text{m}$
and a standard deviation of
 $0.52~{\rm\mu}\text{m}$
, informed by values reported for sheared endothelial cells by Barbee et al. (Reference Barbee, Davies and Lal1994) (the normal distribution was truncated to within one standard deviation). An example endothelium topology generated using this process is shown in figure 2(e).
$0.52~{\rm\mu}\text{m}$
, informed by values reported for sheared endothelial cells by Barbee et al. (Reference Barbee, Davies and Lal1994) (the normal distribution was truncated to within one standard deviation). An example endothelium topology generated using this process is shown in figure 2(e).


