


1. Introduction
The loss of symmetry as a flow parameter varies is a key phenomenon in fluid dynamics. A classic and well-known example is the loss of symmetry in the flow around a cylinder forced to move in uni-directional simple harmonic motion in an initially quiescent fluid, or equivalently in a sinusoidally oscillating flow around a stationary cylinder (Honji Reference Honji1981; Williamson Reference Williamson1985; Tatsuno & Bearman Reference Tatsuno and Bearman1990; Nehari, Armenio & Ballio Reference Nehari, Armenio and Ballio2004; An, Cheng & Zhao Reference An, Cheng and Zhao2011). These flows are of fundamental interest, with potential application to the study of loads on structures immersed in waves or other oscillatory fluid motions. Here, we refer to this class of flows as ‘pure’ oscillations, as the location of the cylinder is fixed in the direction orthogonal to the oscillation direction.
Another distinct class of oscillatory flows known to exhibit symmetry breaking is flapping oscillation, a common strategy for flying or swimming animals (Childress Reference Childress1981). Vandenberghe, Zhang & Childress (Reference Vandenberghe, Zhang and Childress2004) proposed an idealized model considering a plate with an imposed vertical oscillation in a viscous fluid and free to move horizontally. They demonstrated that the plate begins to move horizontally as a critical frequency is exceeded, indicating that a symmetry-breaking bifurcation occurs. Subsequently, there has been much research activity numerically investigating the effect of variations in the aspect ratio and flexibility on the flapping locomotion of a two-dimensional body in a viscous fluid (see, for example Alben & Shelley Reference Alben and Shelley2005; Lu & Liao Reference Lu and Liao2006; Zhang et al. Reference Zhang, Ni, Wang and He2009; Spagnolie et al. Reference Spagnolie, Moret, Shelley and Zhang2010; Zhang, Liu & Lu Reference Zhang, Liu and Lu2010).
The system of a ‘flying’ oscillation is an inherently coupled one in which the Navier–Stokes equations govern the surrounding fluid and the horizontal motion is determined by the fluid force acting on its boundary. This system is not easily represented by a single set of unified differential equations, and so it is challenging to conduct a conventional linear stability analysis for the flying oscillation class of flows, unlike the more straightforward pure oscillation class of flows where such analyses have proved very instructive (Elston, Sheridan & Blackburn Reference Elston, Sheridan and Blackburn2004; Elston, Blackburn & Sheridan Reference Elston, Blackburn and Sheridan2006). However, Alben & Shelley (Reference Alben and Shelley2005) found clear evidence of exponential growth in the horizontal velocity of a foil during the initial transition to flying, suggesting that an inherent linear instability is associated with the flying transition. Therefore, in this paper, we investigate whether insights from pure oscillation flows, in particular the mechanisms by which symmetry is lost, are relevant to flying oscillation flows. An important aspect which we will consider is the extent to which symmetry breaking is either promoted or suppressed by allowing horizontal motion of the oscillating body.
There has been much research considering pure oscillations of a circular cylinder, with less attention being paid to oscillating bodies of different aspect ratios, which are more relevant for comparison with flying oscillations. For a cylinder of density
 ${\it\rho}_{s}$
with diameter
${\it\rho}_{s}$
with diameter
 $D$
in a viscous fluid of density
$D$
in a viscous fluid of density
 ${\it\rho}$
and kinematic viscosity
${\it\rho}$
and kinematic viscosity
 ${\it\nu}$
, subjected to a vertical imposed pure oscillation of
${\it\nu}$
, subjected to a vertical imposed pure oscillation of
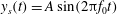
 $y_{s}=A\sin 2{\rm\pi}f_{0}t$
(i.e. with period
$y_{s}=A\sin 2{\rm\pi}f_{0}t$
(i.e. with period
 $T_{0}=1/f_{0}$
), two natural parameters are the non-dimensional frequency or Stokes number
$T_{0}=1/f_{0}$
), two natural parameters are the non-dimensional frequency or Stokes number
 ${\it\beta}$
, and the non-dimensional amplitude or Keulegan–Carpenter number
${\it\beta}$
, and the non-dimensional amplitude or Keulegan–Carpenter number
 $KC=2{\rm\pi}A/D$
, defined as
$KC=2{\rm\pi}A/D$
, defined as
 $$\begin{eqnarray}\displaystyle {\it\beta}=\frac{f_{0}D^{2}}{{\it\nu}},\quad KC=\frac{2{\rm\pi}A}{D}. & & \displaystyle\end{eqnarray}$$
Several flow regimes have been found in
 $KC$
–
$KC$
–
 ${\it\beta}$
space, relating to different types of symmetry-breaking instabilities (see for example Tatsuno & Bearman Reference Tatsuno and Bearman1990). Based on dye-release and free-surface streakline visualization, these authors produced a
${\it\beta}$
space, relating to different types of symmetry-breaking instabilities (see for example Tatsuno & Bearman Reference Tatsuno and Bearman1990). Based on dye-release and free-surface streakline visualization, these authors produced a
 $KC$
–
$KC$
–
 ${\it\beta}$
space map of eight different regimes found for
${\it\beta}$
space map of eight different regimes found for
 ${\it\beta}\in [5,150]$
,
${\it\beta}\in [5,150]$
,
 $KC\in [1.6,15]$
. We are particularly interested in the first onset of asymmetry in two-dimensional flow, and so we restrict attention to a relatively small region of
$KC\in [1.6,15]$
. We are particularly interested in the first onset of asymmetry in two-dimensional flow, and so we restrict attention to a relatively small region of
 $KC$
–
$KC$
–
 ${\it\beta}$
space, where the pure oscillation flows around cylinders are only two-dimensionally unstable. Effectively, this requires that we restrict attention to sufficiently small values of
${\it\beta}$
space, where the pure oscillation flows around cylinders are only two-dimensionally unstable. Effectively, this requires that we restrict attention to sufficiently small values of
 ${\it\beta}$
, avoiding regimes susceptible to primary three-dimensional instabilities.
${\it\beta}$
, avoiding regimes susceptible to primary three-dimensional instabilities.

Figure 1. Boundaries between two-dimensional symmetrical flows and those with broken symmetry, established in experiments (Tatsuno & Bearman Reference Tatsuno and Bearman1990) (solid line) and two-dimensional numerical simulation (Elston, Sheridan & Blackburn Reference Elston, Sheridan and Blackburn2001) around a circular cylinder (
 $AR=1.0$
). Parameter values associated with symmetric flow as obtained by our two-dimensional simulations are marked by ▵, while parameter values associated with asymmetric flow are marked by ▫.
$AR=1.0$
). Parameter values associated with symmetric flow as obtained by our two-dimensional simulations are marked by ▵, while parameter values associated with asymmetric flow are marked by ▫.
In figure 1, we plot the transition boundaries in
 $KC$
–
$KC$
–
 ${\it\beta}$
space determined both by previous experiments (Tatsuno & Bearman Reference Tatsuno and Bearman1990) as well as direct numerical simulations restricted to two-dimensional flows (Elston et al.
Reference Elston, Sheridan and Blackburn2001). We also plot our numerical calculations using the numerical methods described in the following section, showing good agreement and validating our approach. Although this is a single marginal curve separating symmetric flow below and to the left of the curve from asymmetric flow above and to the right of the curve, there is a qualitative difference in the character of the form of the asymmetry either side of the marked ‘freezing point’, as analysed in detail for the
${\it\beta}$
space determined both by previous experiments (Tatsuno & Bearman Reference Tatsuno and Bearman1990) as well as direct numerical simulations restricted to two-dimensional flows (Elston et al.
Reference Elston, Sheridan and Blackburn2001). We also plot our numerical calculations using the numerical methods described in the following section, showing good agreement and validating our approach. Although this is a single marginal curve separating symmetric flow below and to the left of the curve from asymmetric flow above and to the right of the curve, there is a qualitative difference in the character of the form of the asymmetry either side of the marked ‘freezing point’, as analysed in detail for the
 $AR=1.0$
case by Elston et al. (Reference Elston, Sheridan and Blackburn2004, Reference Elston, Blackburn and Sheridan2006). To the left, at higher Stokes numbers
$AR=1.0$
case by Elston et al. (Reference Elston, Sheridan and Blackburn2004, Reference Elston, Blackburn and Sheridan2006). To the left, at higher Stokes numbers
 ${\it\beta}$
, or equivalently smaller values of
${\it\beta}$
, or equivalently smaller values of
 $KC$
, the instability develops into a quasi-periodic or ‘QP-type’ asymmetry, with the horizontal force on the cylinder exhibiting two well-defined and incommensurate frequencies either side of twice the primary oscillation frequency of the foil. As presented in these two papers, the results of a linear Floquet stability analysis show clearly that the QP bifurcation is supercritical, and of Neimark–Sacker type, with the emergence of a complex-conjugate-pair of Floquet multipliers crossing the unit circle (thus signifying instability).
$KC$
, the instability develops into a quasi-periodic or ‘QP-type’ asymmetry, with the horizontal force on the cylinder exhibiting two well-defined and incommensurate frequencies either side of twice the primary oscillation frequency of the foil. As presented in these two papers, the results of a linear Floquet stability analysis show clearly that the QP bifurcation is supercritical, and of Neimark–Sacker type, with the emergence of a complex-conjugate-pair of Floquet multipliers crossing the unit circle (thus signifying instability).
Physically, these two frequencies lead to a much lower frequency due to ‘beating’, associated with a much longer secondary period in the flow dynamics. As
 ${\it\beta}$
is reduced moving rightwards along the transition boundary to larger values of
${\it\beta}$
is reduced moving rightwards along the transition boundary to larger values of
 $KC$
, the two split frequencies converge on (twice) the primary frequency as the associated beating secondary period diverges to infinity, (see for example figure 5c of Elston et al. (Reference Elston, Blackburn and Sheridan2006)) the critical complex-conjugate-pair Floquet multipliers coalesce at
$KC$
, the two split frequencies converge on (twice) the primary frequency as the associated beating secondary period diverges to infinity, (see for example figure 5c of Elston et al. (Reference Elston, Blackburn and Sheridan2006)) the critical complex-conjugate-pair Floquet multipliers coalesce at
 ${\it\mu}=+1$
(a single real Floquet multiplier) and the asymmetry ‘freezes’ into a synchronous or ‘S-type’ asymmetry at the ‘freezing point’, a terminology first proposed by Elston et al. (Reference Elston, Blackburn and Sheridan2006). Although once again Elston et al. (Reference Elston, Blackburn and Sheridan2006) established that the bifurcation to S-type asymmetry was supercritical, the precise location of the freezing point is difficult to determine numerically as the quasi-periodicity moves to longer and longer periods, with differing estimates of the freezing point occurring anywhere in the range
${\it\mu}=+1$
(a single real Floquet multiplier) and the asymmetry ‘freezes’ into a synchronous or ‘S-type’ asymmetry at the ‘freezing point’, a terminology first proposed by Elston et al. (Reference Elston, Blackburn and Sheridan2006). Although once again Elston et al. (Reference Elston, Blackburn and Sheridan2006) established that the bifurcation to S-type asymmetry was supercritical, the precise location of the freezing point is difficult to determine numerically as the quasi-periodicity moves to longer and longer periods, with differing estimates of the freezing point occurring anywhere in the range
 ${\it\beta}_{c}\simeq 12{-}18$
(Elston et al.
Reference Elston, Sheridan and Blackburn2004, Reference Elston, Blackburn and Sheridan2006).
${\it\beta}_{c}\simeq 12{-}18$
(Elston et al.
Reference Elston, Sheridan and Blackburn2004, Reference Elston, Blackburn and Sheridan2006).
However, as already noted, the onset of asymmetry for purely oscillating bodies with different aspect ratios is not so well-understood. Smaller aspect ratios are also more relevant to the flying oscillation class of flows, and we are interested in comparing and contrasting the onset of asymmetry in these two classes of flows, i.e. pure oscillations and flying oscillations. Therefore, we simulate the two-dimensional flow around oscillating elliptical foils for three different aspect ratios, namely
 $AR=1.0$
(the previously considered circular cylinder)
$AR=1.0$
(the previously considered circular cylinder)
 $AR=0.5$
and
$AR=0.5$
and
 $AR=0.1$
. After briefly describing our numerical method in § 2, we identify the transition boundaries for purely oscillating elliptical foils, and characterise the observed symmetry breaking in § 3, in particular investigating how varying the aspect ratio modifies the QP-type and S-type of asymmetry. We show that the QP-type asymmetry for the smallest aspect ratio is qualitatively different in both physical and mathematical structure from the previously considered circular cylinder flow. Both the dynamical flow evolution and the mathematical description in terms of the calculated coefficients from a Floquet stability analysis, the phase portraits or Poincaré maps generated from the time evolution of the horizontal force on the foil are qualitatively different for the flow around a small aspect ratio foil. Physically, there is no discernible interaction between the flow induced at the two ends of the ellipse as it oscillates vertically, and the primary frequency
$AR=0.1$
. After briefly describing our numerical method in § 2, we identify the transition boundaries for purely oscillating elliptical foils, and characterise the observed symmetry breaking in § 3, in particular investigating how varying the aspect ratio modifies the QP-type and S-type of asymmetry. We show that the QP-type asymmetry for the smallest aspect ratio is qualitatively different in both physical and mathematical structure from the previously considered circular cylinder flow. Both the dynamical flow evolution and the mathematical description in terms of the calculated coefficients from a Floquet stability analysis, the phase portraits or Poincaré maps generated from the time evolution of the horizontal force on the foil are qualitatively different for the flow around a small aspect ratio foil. Physically, there is no discernible interaction between the flow induced at the two ends of the ellipse as it oscillates vertically, and the primary frequency
 $f_{0}$
splits into two, qualitatively different from the splitting of its first harmonic
$f_{0}$
splits into two, qualitatively different from the splitting of its first harmonic
 $2f_{0}$
as in the flows associated with foils of higher aspect ratio. Therefore, we refer to this low aspect ratio asymmetry as a ‘primary’
$2f_{0}$
as in the flows associated with foils of higher aspect ratio. Therefore, we refer to this low aspect ratio asymmetry as a ‘primary’
 $\text{QP}_{\text{L}}$
-type asymmetry, to distinguish it from the secondary
$\text{QP}_{\text{L}}$
-type asymmetry, to distinguish it from the secondary
 $\text{QP}_{\text{H}}$
-type asymmetry, which is the natural generalization of the previously identified QP-type asymmetry of oscillating circles with ‘high’ aspect ratio
$\text{QP}_{\text{H}}$
-type asymmetry, which is the natural generalization of the previously identified QP-type asymmetry of oscillating circles with ‘high’ aspect ratio
 $AR=1$
.
$AR=1$
.
We demonstrate that reducing the aspect ratio tends to lead to earlier transition to asymmetry, in the sense of transition occurring for smaller values of
 ${\it\beta}$
for a given value of
${\it\beta}$
for a given value of
 $KC$
, and also that the freezing point tends to move to smaller values of
$KC$
, and also that the freezing point tends to move to smaller values of
 $KC$
as the aspect ratio decreases. Indeed, we find that the smallest aspect ratio case is once again qualitatively different, in that for all values of
$KC$
as the aspect ratio decreases. Indeed, we find that the smallest aspect ratio case is once again qualitatively different, in that for all values of
 $KC$
which we consider, the transition to asymmetry occurs close to a fixed value of
$KC$
which we consider, the transition to asymmetry occurs close to a fixed value of
 ${\it\beta}(KC)^{2}=4{\rm\pi}^{2}A^{2}f/{\it\nu}$
, showing that in this limit, the actual dimensions of the oscillating foil are not important to leading order, an observation which is consistent with the lack of interaction observed between the flow at the two ends of the ellipse for the primary
${\it\beta}(KC)^{2}=4{\rm\pi}^{2}A^{2}f/{\it\nu}$
, showing that in this limit, the actual dimensions of the oscillating foil are not important to leading order, an observation which is consistent with the lack of interaction observed between the flow at the two ends of the ellipse for the primary
 $\text{QP}_{\text{L}}$
-type asymmetric flow for the
$\text{QP}_{\text{L}}$
-type asymmetric flow for the
 $AR=0.1$
ellipse.
$AR=0.1$
ellipse.
Armed with this insight, in § 4 we then turn our attention to the class of flying oscillation flows for foils with these three aspect ratios, identifying the time of onset of the asymmetry. Significantly, freedom for the foil to move horizontally appears to modify the transition boundary differently on either side of the freezing point. To the right of the freezing point, when the asymmetry is synchronous, freedom to move horizontally suppresses the onset of asymmetry, in the sense that asymmetry onsets for larger values of
 ${\it\beta}$
at a fixed value of
${\it\beta}$
at a fixed value of
 $KC$
. Indeed, we demonstrate that there is a range of parameter values for which a purely oscillating foil induces a strongly asymmetric S-type flow that nevertheless completely disappears soon after the foil is released to move horizontally. A very small amplitude horizontal motion of the foil negatively feeds back on the instability mechanism for the S-type asymmetry, thus ensuring the flow remains symmetric to larger values of the Stokes number.
$KC$
. Indeed, we demonstrate that there is a range of parameter values for which a purely oscillating foil induces a strongly asymmetric S-type flow that nevertheless completely disappears soon after the foil is released to move horizontally. A very small amplitude horizontal motion of the foil negatively feeds back on the instability mechanism for the S-type asymmetry, thus ensuring the flow remains symmetric to larger values of the Stokes number.
Conversely, for intermediate aspect ratios, freedom to move horizontally encourages the development of
 $\text{QP}_{\text{H}}$
-type asymmetry, in the sense that such asymmetry arises at smaller values of
$\text{QP}_{\text{H}}$
-type asymmetry, in the sense that such asymmetry arises at smaller values of
 ${\it\beta}$
for a given value of
${\it\beta}$
for a given value of
 $KC$
to the right of the freezing point on the transition boundary. There is a positive feedback mechanism between shed vortices from the ends of the oscillating foil associated with successive primary oscillation periods, due to the relatively high frequency of vortex shedding in this region of parameter space.
$KC$
to the right of the freezing point on the transition boundary. There is a positive feedback mechanism between shed vortices from the ends of the oscillating foil associated with successive primary oscillation periods, due to the relatively high frequency of vortex shedding in this region of parameter space.
The behaviour is qualitatively different for the foil with the smallest aspect ratio, in that once the foil is free to move horizontally, primary
 $\text{QP}_{\text{L}}$
-type asymmetry no longer occurs. Asymmetry still arises at smaller values of
$\text{QP}_{\text{L}}$
-type asymmetry no longer occurs. Asymmetry still arises at smaller values of
 ${\it\beta}$
for given
${\it\beta}$
for given
 $KC$
, but the asymmetry is now of S-type for all values of
$KC$
, but the asymmetry is now of S-type for all values of
 $KC$
, with a synchronous signal in the horizontal force on the foil at twice the frequency of the primary oscillation. We discuss the implications of these results for the transition to flying locomotion, and briefly draw our conclusions in § 5.
$KC$
, with a synchronous signal in the horizontal force on the foil at twice the frequency of the primary oscillation. We discuss the implications of these results for the transition to flying locomotion, and briefly draw our conclusions in § 5.
2. Problem description and numerical method
2.1. Problem description
We consider elliptical foils with major axis
 $c$
and minor axis
$c$
and minor axis
 $b$
, such that
$b$
, such that
 $AR=b/c\leqslant 1$
, with uniform mass density
$AR=b/c\leqslant 1$
, with uniform mass density
 ${\it\rho}_{s}$
, as shown in figure 2(a). The elliptical foil translates in the infinite
${\it\rho}_{s}$
, as shown in figure 2(a). The elliptical foil translates in the infinite
 $x$
–
$x$
–
 $y$
plane through a two-dimensional viscous fluid of density
$y$
plane through a two-dimensional viscous fluid of density
 ${\it\rho}$
and kinematic viscosity
${\it\rho}$
and kinematic viscosity
 ${\it\nu}$
. Although variations in the density ratio
${\it\nu}$
. Although variations in the density ratio
 ${\it\rho}_{s}/{\it\rho}$
undoubtedly affect the flow dynamics after symmetry breaking (see e.g. Alben & Shelley Reference Alben and Shelley2005), here we are exclusively interested in the initial behaviour very close to the transition boundary, and so for simplicity, we keep the density ratio fixed at the single value
${\it\rho}_{s}/{\it\rho}$
undoubtedly affect the flow dynamics after symmetry breaking (see e.g. Alben & Shelley Reference Alben and Shelley2005), here we are exclusively interested in the initial behaviour very close to the transition boundary, and so for simplicity, we keep the density ratio fixed at the single value
 ${\it\rho}_{s}/{\it\rho}=10$
.
${\it\rho}_{s}/{\it\rho}=10$
.
As noted above, we impose a vertical oscillation of the centre of the foil so that
 $y_{s}(t)=A\sin (2{\rm\pi}f_{0}t)$
. We generalize the control parameters defined in (1.1) to elliptical foils by using
$y_{s}(t)=A\sin (2{\rm\pi}f_{0}t)$
. We generalize the control parameters defined in (1.1) to elliptical foils by using
 $c$
as the characteristic length, i.e.
$c$
as the characteristic length, i.e.
 $$\begin{eqnarray}\displaystyle {\it\beta}=\frac{f_{0}c^{2}}{{\it\nu}},\quad KC=\frac{2{\rm\pi}A}{c}. & & \displaystyle\end{eqnarray}$$
Henceforth, all lengths are non-dimensionalized with
 $c$
, all densities are non-dimensionalized with
$c$
, all densities are non-dimensionalized with
 ${\it\rho}$
, and all times are non-dimensionalized with the viscous time scale
${\it\rho}$
, and all times are non-dimensionalized with the viscous time scale
 $c^{2}/{\it\nu}$
, such that the non-dimensional period
$c^{2}/{\it\nu}$
, such that the non-dimensional period
 $T_{0}$
of the primary oscillation is
$T_{0}$
of the primary oscillation is
 $1/{\it\beta}$
, and the non-dimensional primary frequency
$1/{\it\beta}$
, and the non-dimensional primary frequency
 $f_{0}={\it\beta}$
.
$f_{0}={\it\beta}$
.

Figure 2. (a) Geometric definition of an elliptical foil with
 $AR=b/c=0.5$
;(b) representative grid distribution around the foil.
$AR=b/c=0.5$
;(b) representative grid distribution around the foil.
The Stokes number
 ${\it\beta}$
may thus be thought of as a Reynolds number, involving as it does the balance between inertia and viscosity, or equivalently the relative size of the viscous time scale to the dominant flow time scale, the primary oscillation period of the foil. However, there are alternative definitions using different combinations of characteristic velocities and length scales which may be more relevant. For sufficiently large
${\it\beta}$
may thus be thought of as a Reynolds number, involving as it does the balance between inertia and viscosity, or equivalently the relative size of the viscous time scale to the dominant flow time scale, the primary oscillation period of the foil. However, there are alternative definitions using different combinations of characteristic velocities and length scales which may be more relevant. For sufficiently large
 $KC$
, the flow must depend on the horizontal extent of the ellipse, and so it is natural to define a Reynolds number using the maximum vertical velocity
$KC$
, the flow must depend on the horizontal extent of the ellipse, and so it is natural to define a Reynolds number using the maximum vertical velocity
 $2{\rm\pi}Af_{0}$
as the velocity scale and the major axis as the length scale,
$2{\rm\pi}Af_{0}$
as the velocity scale and the major axis as the length scale,
 $$\begin{eqnarray}Re_{A}=\frac{2Acf_{0}}{{\rm\pi}{\it\nu}}=\frac{{\it\beta}KC}{{\rm\pi}},\end{eqnarray}$$
where the factor of
 ${\rm\pi}$
makes this definition equivalent to the ‘flapping’ Reynolds number of Vandenberghe et al. (Reference Vandenberghe, Zhang and Childress2004). Typically, for the flows considered here,
${\rm\pi}$
makes this definition equivalent to the ‘flapping’ Reynolds number of Vandenberghe et al. (Reference Vandenberghe, Zhang and Childress2004). Typically, for the flows considered here,
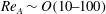 $Re_{A}\sim O(10{-}100)$
. Conversely, for smaller values of
$Re_{A}\sim O(10{-}100)$
. Conversely, for smaller values of
 $KC$
, it is at least conceivable that the horizontal extent of the foil does not play a significant dynamical role, and so
$KC$
, it is at least conceivable that the horizontal extent of the foil does not play a significant dynamical role, and so
 $A$
should also be used as the natural length scale of the flow, leading to an ‘amplitude’ Stokes number
$A$
should also be used as the natural length scale of the flow, leading to an ‘amplitude’ Stokes number
 ${\it\beta}_{A}$
defined as
${\it\beta}_{A}$
defined as
 $$\begin{eqnarray}{\it\beta}_{A}={\it\beta}(KC)^{2}=\frac{4{\rm\pi}^{2}f_{0}A^{2}}{{\it\nu}}.\end{eqnarray}$$
2.2. Numerical method
To simulate the flow around an oscillating foil in a quiescent fluid, we use the open source code OpenFOAM (Jasak Reference Jasak1996). The time-dependent Navier–Stokes equations are solved using the finite volume method, assuming incompressibility. The mass and momentum equations are solved on a moving grid domain using the Arbitrary Lagrangian Eulerian (ALE) formulation (see Ferziger & Peric Reference Ferziger and Peric2002). The integral form of the governing (conservation) equation defined in an arbitrary moving volume
 $V$
bounded by a closed surface
$V$
bounded by a closed surface
 $S$
is:
$S$
is:
 $$\begin{eqnarray}\frac{\text{d}}{\text{d}t}\int _{V}{\it\rho}\boldsymbol{U}\,\text{d}V+\oint _{S}\,\mathbf{d}\boldsymbol{s}\boldsymbol{\cdot }{\it\rho}(\boldsymbol{U}-\boldsymbol{U}_{b})\boldsymbol{U}=\oint _{S}\,\mathbf{d}\boldsymbol{s}\boldsymbol{\cdot }(-p\boldsymbol{I}+{\it\rho}{\it\nu}\boldsymbol{{\rm\nabla}}\boldsymbol{U}),\end{eqnarray}$$
where
 $\boldsymbol{U}$
is the fluid velocity,
$\boldsymbol{U}$
is the fluid velocity,
 $\boldsymbol{U}_{b}$
is the boundary velocity of a finite volume and
$\boldsymbol{U}_{b}$
is the boundary velocity of a finite volume and
 $p$
is the pressure. As the volume
$p$
is the pressure. As the volume
 $V$
is no longer fixed in space, its motion is captured by the motion of its bounding surface
$V$
is no longer fixed in space, its motion is captured by the motion of its bounding surface
 $S$
at the boundary velocity
$S$
at the boundary velocity
 $\boldsymbol{U}_{b}$
. For the details of the discretisation and implementation of boundary conditions, as well as the transformation of the underlying partial differential equations into corresponding systems of algebraic equations, see Ferziger & Peric (Reference Ferziger and Peric2002).
$\boldsymbol{U}_{b}$
. For the details of the discretisation and implementation of boundary conditions, as well as the transformation of the underlying partial differential equations into corresponding systems of algebraic equations, see Ferziger & Peric (Reference Ferziger and Peric2002).
The space discretizations are second-order upwind for the convection terms and central differences for the Laplacian terms, respectively. The time discretization is first-order implicit Euler. Pressure–velocity coupling is enforced using the PISO scheme (Ferziger & Peric Reference Ferziger and Peric2002). The preconditioned conjugate gradient (PCG) method is used to treat the pressure equation and preconditioned bi-conjugate gradient (PBiCG) method is used for the velocity equations. Numerical accuracy is set to double precision and the initial conditions are chosen to be uniform. We set the boundary condition on the foil to be moving wall, with no flux normal to the wall. For the class of ‘flying’ oscillation flows, for which the foil is free to move horizontally, the motion of the foil is determined by the horizontal component of the force due to the fluid on the foil, through application of Newton’s second law:
 $$\begin{eqnarray}m_{s}\frac{\text{d}^{2}x_{b}}{\text{d}t^{2}}=F_{x}(t),\end{eqnarray}$$
where
 $x_{b}$
is the horizontal location of the foil,
$x_{b}$
is the horizontal location of the foil,
 $m_{s}$
is the foil mass given by
$m_{s}$
is the foil mass given by
 $m_{s}={\it\rho}_{s}S$
with
$m_{s}={\it\rho}_{s}S$
with
 ${\it\rho}_{s}$
the foil density and
${\it\rho}_{s}$
the foil density and
 $S$
the foil area. The (in general time-varying) horizontal component of the force
$S$
the foil area. The (in general time-varying) horizontal component of the force
 $F_{x}(t)$
is calculated by integrating the pressure and viscous stresses over the surface of the foil, and then identifying the component in the horizontal
$F_{x}(t)$
is calculated by integrating the pressure and viscous stresses over the surface of the foil, and then identifying the component in the horizontal
 $x$
-direction. As already noted, we set the density ratio
$x$
-direction. As already noted, we set the density ratio
 ${\it\rho}_{s}/{\it\rho}=10$
for all simulations. This ordinary differential equation is solved using a fourth-order Runge–Kutta algorithm.
${\it\rho}_{s}/{\it\rho}=10$
for all simulations. This ordinary differential equation is solved using a fourth-order Runge–Kutta algorithm.
To assure time-discretization independence, we require two conditions. The first condition is that the Courant number of all cells,
 $Co$
, must be less than one, i.e.
$Co$
, must be less than one, i.e.
 $$\begin{eqnarray}Co=\frac{{\it\delta}t|\boldsymbol{U}|}{{\it\delta}x}<1,\end{eqnarray}$$
where
 ${\it\delta}t$
is the time step,
${\it\delta}t$
is the time step,
 $|\boldsymbol{U}|$
is the magnitude of the velocity through that cell and
$|\boldsymbol{U}|$
is the magnitude of the velocity through that cell and
 ${\it\delta}x$
is the cell width in the direction of the velocity. Note that the maximum
${\it\delta}x$
is the cell width in the direction of the velocity. Note that the maximum
 $Co$
is usually determined by the smallest cell size, and we continuously ensure that
$Co$
is usually determined by the smallest cell size, and we continuously ensure that
 $Co<1$
for all cells. The second condition is that we ensure that there at least 2000 time steps for each primary oscillation period
$Co<1$
for all cells. The second condition is that we ensure that there at least 2000 time steps for each primary oscillation period
 $T_{0}=1/f_{0}$
of oscillation, to ensure that any unsteadiness caused by this oscillation is well resolved. We have found that requiring these two conditions yields time accurate and robust results.
$T_{0}=1/f_{0}$
of oscillation, to ensure that any unsteadiness caused by this oscillation is well resolved. We have found that requiring these two conditions yields time accurate and robust results.
To validate the spatial resolution we use, we have carried out a grid-independence study on a purely oscillating elliptical foil with aspect ratio
 $AR=1.0$
, i.e. a circular cylinder in two-dimensional space, analogously to the study discussed in detail in Deng, Caulfield & Shao (Reference Deng, Caulfield and Shao2014). We find that meshes with approximately 50 000 cells provide satisfactory and consistent accuracy in space. As an example, we plot the grid near an elliptical foil with
$AR=1.0$
, i.e. a circular cylinder in two-dimensional space, analogously to the study discussed in detail in Deng, Caulfield & Shao (Reference Deng, Caulfield and Shao2014). We find that meshes with approximately 50 000 cells provide satisfactory and consistent accuracy in space. As an example, we plot the grid near an elliptical foil with
 $AR=0.5$
in figure 2, which shows the gradual increase of the mesh size from the foil boundary. The domain is defined as a circle with a radius
$AR=0.5$
in figure 2, which shows the gradual increase of the mesh size from the foil boundary. The domain is defined as a circle with a radius
 $20c$
. Pressure and all components of the velocity gradient tensor are set to zero on the boundary of the domain. Further confidence in the fidelity of our simulations is gained by the good agreement with previous numerical simulations by Elston et al. (Reference Elston, Sheridan and Blackburn2001) of the calculated transition boundary for flow around an
$20c$
. Pressure and all components of the velocity gradient tensor are set to zero on the boundary of the domain. Further confidence in the fidelity of our simulations is gained by the good agreement with previous numerical simulations by Elston et al. (Reference Elston, Sheridan and Blackburn2001) of the calculated transition boundary for flow around an
 $AR=1.0$
foil shown in figure 1, particularly for low
$AR=1.0$
foil shown in figure 1, particularly for low
 ${\it\beta}$
numbers. We identify the transition boundary between symmetric and asymmetric flow for each aspect ratio analogously to the transition boundary shown in figure 1 by conducting a bisection-like search with different parameter pairs in the numerical simulations to identify close parameter pairs, one of which induces asymmetric flow (marked with a square in the figure) while the other (marked with a triangle) maintains symmetric flow over many oscillation periods of the foil.
${\it\beta}$
numbers. We identify the transition boundary between symmetric and asymmetric flow for each aspect ratio analogously to the transition boundary shown in figure 1 by conducting a bisection-like search with different parameter pairs in the numerical simulations to identify close parameter pairs, one of which induces asymmetric flow (marked with a square in the figure) while the other (marked with a triangle) maintains symmetric flow over many oscillation periods of the foil.
3. Symmetry breaking of ‘pure’ oscillations
3.1. Symmetry breaking for
 $AR=1.0$

For ‘elliptical’ foils with
 $AR=1.0$
, i.e. circular cylinders, previous researchers have studied in detail the onset of symmetry breaking for the class of pure vertical oscillation, where the cylinder is held at a fixed horizontal location. As already noted, through the use of a Floquet stability analysis restricted to a two-dimensional subspace, Elston et al. (Reference Elston, Blackburn and Sheridan2006) identified a single marginal stability or transition boundary in
$AR=1.0$
, i.e. circular cylinders, previous researchers have studied in detail the onset of symmetry breaking for the class of pure vertical oscillation, where the cylinder is held at a fixed horizontal location. As already noted, through the use of a Floquet stability analysis restricted to a two-dimensional subspace, Elston et al. (Reference Elston, Blackburn and Sheridan2006) identified a single marginal stability or transition boundary in
 $KC$
–
$KC$
–
 ${\it\beta}$
space, but with two distinct asymmetric flow patterns above this curve, both arising from supercritical bifurcations depending on whether the critical Floquet multipliers are real or complex-conjugate pairs. At relatively low values of
${\it\beta}$
space, but with two distinct asymmetric flow patterns above this curve, both arising from supercritical bifurcations depending on whether the critical Floquet multipliers are real or complex-conjugate pairs. At relatively low values of
 ${\it\beta}$
, the flows break
${\it\beta}$
, the flows break
 $x$
-reflection symmetry, while retaining a spatio-temporal symmetry, which manifests itself in the
$x$
-reflection symmetry, while retaining a spatio-temporal symmetry, which manifests itself in the
 $z$
-vorticity component of the flow field as
$z$
-vorticity component of the flow field as
 ${\it\Omega}(x,y,t)=-{\it\Omega}(x,-y,t+T_{0}/2)$
, where
${\it\Omega}(x,y,t)=-{\it\Omega}(x,-y,t+T_{0}/2)$
, where
 $T_{0}$
is the period of oscillation. These flows are synchronous with the oscillatory motion of the cylinder and hence are labelled S-type. A useful diagnostic is the horizontal force time history of the cylinder, i.e. the time variation of the horizontal component of the integral of the pressure and the viscous stresses over the surface of the cylinder. Due to the fact that vortices are shed in both the upward and downward stroke of the foil, synchronous asymmetry is expected to have a periodic structure in the horizontal force dominated by a frequency
$T_{0}$
is the period of oscillation. These flows are synchronous with the oscillatory motion of the cylinder and hence are labelled S-type. A useful diagnostic is the horizontal force time history of the cylinder, i.e. the time variation of the horizontal component of the integral of the pressure and the viscous stresses over the surface of the cylinder. Due to the fact that vortices are shed in both the upward and downward stroke of the foil, synchronous asymmetry is expected to have a periodic structure in the horizontal force dominated by a frequency
 $f=2f_{0}=2{\it\beta}$
, i.e. twice the frequency of the primary oscillation of the foil.
$f=2f_{0}=2{\it\beta}$
, i.e. twice the frequency of the primary oscillation of the foil.
At higher values of
 ${\it\beta}>{\it\beta}_{c}$
, (
${\it\beta}>{\it\beta}_{c}$
, (
 $(KC_{c},{\it\beta}_{c})$
is the location of the freezing point in parameter space) the flow loses this fundamental synchronization with the cylinder’s motion and a new, secondary, generically incommensurate period arises. Typically, close to the critical value
$(KC_{c},{\it\beta}_{c})$
is the location of the freezing point in parameter space) the flow loses this fundamental synchronization with the cylinder’s motion and a new, secondary, generically incommensurate period arises. Typically, close to the critical value
 ${\it\beta}_{c}$
, this secondary period is very long, and so may be thought of as coming in from infinity as
${\it\beta}_{c}$
, this secondary period is very long, and so may be thought of as coming in from infinity as
 ${\it\beta}>{\it\beta}_{c}$
. These inherently quasi-periodic flows are labelled QP-type, and Tatsuno & Bearman (Reference Tatsuno and Bearman1990) observed that large vortices of opposite sign are formed in succession for equal numbers of oscillation cycles, direct evidence of the secondary period for such flows.
${\it\beta}>{\it\beta}_{c}$
. These inherently quasi-periodic flows are labelled QP-type, and Tatsuno & Bearman (Reference Tatsuno and Bearman1990) observed that large vortices of opposite sign are formed in succession for equal numbers of oscillation cycles, direct evidence of the secondary period for such flows.
These two qualitatively different regimes are well-reproduced quantitatively by our numerical simulations, as shown in figure 1. For the QP-type asymmetries, a new longer secondary period
 $T_{s}$
arises in the horizontal force time history, resulting from the beating between two close frequencies around (twice) the primary oscillation frequency. The synchronous frequency bifurcates into two slightly different frequencies, due to the interaction between successive vortices shedding at relatively high frequency from the oscillating body. When travelling along the transition boundary to lower Stokes numbers, towards the freezing point location
$T_{s}$
arises in the horizontal force time history, resulting from the beating between two close frequencies around (twice) the primary oscillation frequency. The synchronous frequency bifurcates into two slightly different frequencies, due to the interaction between successive vortices shedding at relatively high frequency from the oscillating body. When travelling along the transition boundary to lower Stokes numbers, towards the freezing point location
 $(KC_{c},{\it\beta}_{c})$
, the two bifurcated frequencies gradually approach each other, converging on twice the primary oscillation frequency.
$(KC_{c},{\it\beta}_{c})$
, the two bifurcated frequencies gradually approach each other, converging on twice the primary oscillation frequency.
An alternative, and formally equivalent method to determine the location of the freezing point is to consider the ratio of
 $T_{s}/T_{0}$
, where
$T_{s}/T_{0}$
, where
 $T_{0}$
is the period of oscillation of the flapping foil. Elston et al. (Reference Elston, Blackburn and Sheridan2006) derived this ratio from the critical Floquet multipliers, and showed that, as
$T_{0}$
is the period of oscillation of the flapping foil. Elston et al. (Reference Elston, Blackburn and Sheridan2006) derived this ratio from the critical Floquet multipliers, and showed that, as
 ${\it\beta}\rightarrow {\it\beta}_{c}^{+}$
,
${\it\beta}\rightarrow {\it\beta}_{c}^{+}$
,
 $T_{s}/T_{0}\rightarrow \infty$
. However, due to the fact that close to the critical value
$T_{s}/T_{0}\rightarrow \infty$
. However, due to the fact that close to the critical value
 ${\it\beta}_{c}$
, the secondary period is predicted to be arbitrarily long, it is challenging to determine the freezing point precisely using numerical simulation. Here, we are not concerned with determining the precise location (
${\it\beta}_{c}$
, the secondary period is predicted to be arbitrarily long, it is challenging to determine the freezing point precisely using numerical simulation. Here, we are not concerned with determining the precise location (
 $KC_{c},{\it\beta}_{c}$
) in parameter space defining the freezing point, but rather we wish to investigate the physical properties of the QP-type flows and the S-type flows, and their dependence on aspect ratio for both classes of pure and flying oscillations. For an
$KC_{c},{\it\beta}_{c}$
) in parameter space defining the freezing point, but rather we wish to investigate the physical properties of the QP-type flows and the S-type flows, and their dependence on aspect ratio for both classes of pure and flying oscillations. For an
 $AR=1.0$
, purely oscillating cylinder, we estimate that the freezing point lies between
$AR=1.0$
, purely oscillating cylinder, we estimate that the freezing point lies between
 $16<{\it\beta}_{c}<28$
.
$16<{\it\beta}_{c}<28$
.

Figure 3. Twenty-two evenly spaced contours of vorticity between
 $-60$
(blue) and
$-60$
(blue) and
 $+60$
(red) on the asymmetrical side of the transition boundary for a circular purely oscillating foil with
$+60$
(red) on the asymmetrical side of the transition boundary for a circular purely oscillating foil with
 $AR=1.0$
when the centre of the foil is at
$AR=1.0$
when the centre of the foil is at
 $y=-A$
, its largest magnitude negative displacement for flows with a: (a) QP-type asymmetry with
$y=-A$
, its largest magnitude negative displacement for flows with a: (a) QP-type asymmetry with
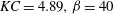 $KC=4.89,{\it\beta}=40$
; (b) QP-type asymmetry with
$KC=4.89,{\it\beta}=40$
; (b) QP-type asymmetry with
 $KC=5.65,{\it\beta}=28$
; (c) S-type asymmetry with
$KC=5.65,{\it\beta}=28$
; (c) S-type asymmetry with
 $KC=6.91$
,
$KC=6.91$
,
 ${\it\beta}=16$
; (d) S-type asymmetry with
${\it\beta}=16$
; (d) S-type asymmetry with
 $KC=8.16,{\it\beta}=12$
.
$KC=8.16,{\it\beta}=12$
.
We consider the flow structures associated with these different types of asymmetric flows around an
 $AR=1.0$
cylinder in figure 3, where we show instantaneous vorticity contours just on the asymmetrical side of the transition boundary when the cylinder is at its maximum amplitude negative displacement (i.e. at
$AR=1.0$
cylinder in figure 3, where we show instantaneous vorticity contours just on the asymmetrical side of the transition boundary when the cylinder is at its maximum amplitude negative displacement (i.e. at
 $y_{s}=-A$
). Panels (a,b) show QP-type asymmetry, while panels (c,d) show S-type asymmetry. Considering the S-type asymmetrical flows first, their structure is entirely consistent with the flow considered by, for example, Tatsuno & Bearman (Reference Tatsuno and Bearman1990). The opposite signed vortices which roll up on either side of the cylinder develop with slightly different strengths, and so as the cylinder reverses in direction, the stronger vortex convects across the cylinder and is shed at an angle relative to the vertical, leading to an induced flow with a broken left–right symmetry, thus reinforcing the fact that one of the vortices is stronger than the other, and so leading to a synchronous asymmetric flow which still retains an up–down symmetry about the equilibrium position of the oscillating cylinder. As is clear from comparison of the two panels (c,d), there is no preference for the direction in which the stronger vortex propagates. Although not shown, the horizontal force
$y_{s}=-A$
). Panels (a,b) show QP-type asymmetry, while panels (c,d) show S-type asymmetry. Considering the S-type asymmetrical flows first, their structure is entirely consistent with the flow considered by, for example, Tatsuno & Bearman (Reference Tatsuno and Bearman1990). The opposite signed vortices which roll up on either side of the cylinder develop with slightly different strengths, and so as the cylinder reverses in direction, the stronger vortex convects across the cylinder and is shed at an angle relative to the vertical, leading to an induced flow with a broken left–right symmetry, thus reinforcing the fact that one of the vortices is stronger than the other, and so leading to a synchronous asymmetric flow which still retains an up–down symmetry about the equilibrium position of the oscillating cylinder. As is clear from comparison of the two panels (c,d), there is no preference for the direction in which the stronger vortex propagates. Although not shown, the horizontal force
 $F_{x}(t)$
time history of the cylinder is dominated by an oscillation with twice the frequency of the primary oscillation frequency of the foil.
$F_{x}(t)$
time history of the cylinder is dominated by an oscillation with twice the frequency of the primary oscillation frequency of the foil.

Figure 4. Computed positions of massless particles advected from close to a circular cylinder, i.e.
 $AR=1.0$
in flows with parameters (a)
$AR=1.0$
in flows with parameters (a)
 $KC=4.89,{\it\beta}=40$
(QP-type asymmetry) after a release during the interval
$KC=4.89,{\it\beta}=40$
(QP-type asymmetry) after a release during the interval
 $[94T_{0},126T_{0}]$
; and (b)
$[94T_{0},126T_{0}]$
; and (b)
 $KC=8.16$
,
$KC=8.16$
,
 ${\it\beta}=12$
(S-type asymmetry) after a release during the interval
${\it\beta}=12$
(S-type asymmetry) after a release during the interval
 $[96T_{0},112T_{0}]$
following the start of pure oscillation with period
$[96T_{0},112T_{0}]$
following the start of pure oscillation with period
 $T_{0}$
. Blue particles are released continuously from the right of the equator of the circle, and red particles are released continuously from the left of the equator of the circle.
$T_{0}$
. Blue particles are released continuously from the right of the equator of the circle, and red particles are released continuously from the left of the equator of the circle.
Conversely, for flows with QP-type asymmetry, a secondary period also develops in the flow, distinct from the primary oscillation period, leading to a distinct, at least for flows with parameters far from the freezing point, as shown in panel (a), dipolar structure of large vortices in the far field. Due to transient effects, and the fact that as the freezing point is approached the secondary period can be very long, this structure can be difficult to detect in a single snapshot, such as that shown in panel (b), but there is a qualitative difference between the two types of flow. A particularly instructive way to observe this qualitative difference is to consider the Lagrangian evolution of virtual (massless) particles released close to the oscillating body. We release a continuous stream of particles with velocity
 $2{\rm\pi}Af_{0}/10$
at a distance
$2{\rm\pi}Af_{0}/10$
at a distance
 $0.1c$
from the ‘equator’ of the oscillating cylinder in a direction
$0.1c$
from the ‘equator’ of the oscillating cylinder in a direction
 $\pm 30^{\circ }$
from the horizontal. We colour the particles blue if they are released on the right of the cylinder, and red if they are released on the left.
$\pm 30^{\circ }$
from the horizontal. We colour the particles blue if they are released on the right of the cylinder, and red if they are released on the left.
To avoid any effect due to initial transients, we show the particle distribution released during the interval
 $[94T_{0},126T_{0}]$
in figure 4(a) for the QP-type flow shown in figure 3(a) and the particle distribution during the interval
$[94T_{0},126T_{0}]$
in figure 4(a) for the QP-type flow shown in figure 3(a) and the particle distribution during the interval
 $[96T_{0},112T_{0}]$
in figure 4(b) for the S-type flow shown in figure 3(d). For the QP-type flow, the dipolar vortical structures are clearly apparent. The particles shed from either side of the cylinder are initially aligned with the direction of oscillation, but after several cycles they roll up to form large dipolar vortical structures. Large vortices of opposite sign are formed successively during each oscillation cycle, and the arrangement of these vortices is somewhat similar to that in a von Kármán vortex street behind a cylinder in uniform flow, although the sense of rotation of the vortices is opposite to that found in a unidirectional flow wake and the vortices convect themselves orthogonally away from the generating cylinder.
$[96T_{0},112T_{0}]$
in figure 4(b) for the S-type flow shown in figure 3(d). For the QP-type flow, the dipolar vortical structures are clearly apparent. The particles shed from either side of the cylinder are initially aligned with the direction of oscillation, but after several cycles they roll up to form large dipolar vortical structures. Large vortices of opposite sign are formed successively during each oscillation cycle, and the arrangement of these vortices is somewhat similar to that in a von Kármán vortex street behind a cylinder in uniform flow, although the sense of rotation of the vortices is opposite to that found in a unidirectional flow wake and the vortices convect themselves orthogonally away from the generating cylinder.
For the S-type flow shown in figure 4(b), the particle distribution is very different, with symmetry about a horizontal line through the equilibrium position of the oscillating cylinder, and the multiple small horseshoe structures clearly being synchronous with the primary oscillation of the cylinder, with no particular larger-scale structure apart from the over-arching curve of the flow asymmetry extending to the right of the cylinder. For both cases it is also clear (and unsurprising) that there is strong communication between the fluid flow either side of the cylinder, due to the inevitable interaction of the large-scale vortices which develop, with the blue and red particles being thoroughly inter-mixed. All these observations accord well with the results presented by Elston et al. (Reference Elston, Blackburn and Sheridan2006).
3.2. Symmetry breaking for
$AR=0.5$

The general picture of the transition boundary to asymmetry being characterised by two distinct types of quasi-periodic and synchronous asymmetry for different values of
 ${\it\beta}$
either side of the freezing point at
${\it\beta}$
either side of the freezing point at
 $(KC_{c},{\it\beta}_{c})$
carries over to flows around elliptical foils with aspect ratios
$(KC_{c},{\it\beta}_{c})$
carries over to flows around elliptical foils with aspect ratios
 $AR<1$
, although reducing the aspect ratio has an effect on the location of the transition boundary, as shown in figure 5. As for figure 1, the data for which are reproduced here, we conduct a bisection-like search using numerical simulations with different parameter pairs. Parameter pairs marked with triangles maintain symmetric flow over many oscillation periods, while parameter pairs marked with squares induce asymmetric flow. Generically, for a given value of
$AR<1$
, although reducing the aspect ratio has an effect on the location of the transition boundary, as shown in figure 5. As for figure 1, the data for which are reproduced here, we conduct a bisection-like search using numerical simulations with different parameter pairs. Parameter pairs marked with triangles maintain symmetric flow over many oscillation periods, while parameter pairs marked with squares induce asymmetric flow. Generically, for a given value of
 ${\it\beta}$
, the boundary shifts to smaller values of
${\it\beta}$
, the boundary shifts to smaller values of
 $KC$
as the aspect ratio decreases. Similar values of
$KC$
as the aspect ratio decreases. Similar values of
 ${\it\beta}\sim 20$
are associated with the freezing zone value of
${\it\beta}\sim 20$
are associated with the freezing zone value of
 ${\it\beta}_{c}$
where the symmetry breaking structure switches from QP-type to S-type asymmetry.
${\it\beta}_{c}$
where the symmetry breaking structure switches from QP-type to S-type asymmetry.

Figure 5. Location of transition boundaries as a function of Keulegan–Carpenter parameter
 $KC$
and Stokes number
$KC$
and Stokes number
 ${\it\beta}$
as defined in (1.1) for different aspect ratios:
${\it\beta}$
as defined in (1.1) for different aspect ratios:
 $AR=1.0$
(solid line);
$AR=1.0$
(solid line);
 $AR=0.5$
(dashed line);
$AR=0.5$
(dashed line);
 $AR=0.1$
(dash-dotted line). The marked freezing zone approximates the location of transition between QP-type and S-type asymmetries. Parameter values associated with symmetric flow as obtained by our two-dimensional simulations are marked by ▵, while parameter values associated with asymmetric flow are marked by ▫.
$AR=0.1$
(dash-dotted line). The marked freezing zone approximates the location of transition between QP-type and S-type asymmetries. Parameter values associated with symmetric flow as obtained by our two-dimensional simulations are marked by ▵, while parameter values associated with asymmetric flow are marked by ▫.
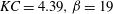
Turning our attention to the flow structures, as shown in figure 6, once again, when the foil is at its largest magnitude negative displacement, although there are clearly differences in detail, the structure for the flows associated with the intermediate aspect ratio elliptical foil with
 $AR=0.5$
share strong points of similarity with the flows for the circular cylinder shown in figure 3. There is clear evidence of the characteristic dipolar vortical street for the QP-type flow shown in figure 6(a), and the sweeping, synchronous dominant vortex on one side propagating at an angle to the vertical characteristic of S-type flow is apparent in figure 6(d). As noted in the introduction, we refer to this asymmetry as
$AR=0.5$
share strong points of similarity with the flows for the circular cylinder shown in figure 3. There is clear evidence of the characteristic dipolar vortical street for the QP-type flow shown in figure 6(a), and the sweeping, synchronous dominant vortex on one side propagating at an angle to the vertical characteristic of S-type flow is apparent in figure 6(d). As noted in the introduction, we refer to this asymmetry as
 $\text{QP}_{\text{H}}$
-type asymmetry, associated as it is with a sufficiently high-aspect ratio foil so that the QP-type asymmetry is a simple generalization of the previously discussed asymmetry for flow around an
$\text{QP}_{\text{H}}$
-type asymmetry, associated as it is with a sufficiently high-aspect ratio foil so that the QP-type asymmetry is a simple generalization of the previously discussed asymmetry for flow around an
 $AR=1.0$
foil.
$AR=1.0$
foil.

Figure 6. Twenty-two evenly spaced contours of vorticity between
 $-60$
(blue) and
$-60$
(blue) and
 $+60$
(red) on the asymmetrical side of the transition boundary for an elliptical purely oscillating foil with
$+60$
(red) on the asymmetrical side of the transition boundary for an elliptical purely oscillating foil with
 $AR=0.5$
when the centre of the foil is at
$AR=0.5$
when the centre of the foil is at
 $y=-A$
, its largest magnitude negative displacement for flows with a: (a)
$y=-A$
, its largest magnitude negative displacement for flows with a: (a)
 $\text{QP}_{\text{H}}$
-type asymmetry with
$\text{QP}_{\text{H}}$
-type asymmetry with
 $KC=3.01,{\it\beta}=60$
; (b)
$KC=3.01,{\it\beta}=60$
; (b)
 $\text{QP}_{\text{H}}$
-type asymmetry with
$\text{QP}_{\text{H}}$
-type asymmetry with
 $KC=4.39,{\it\beta}=19$
; (c) S-type asymmetry with
$KC=4.39,{\it\beta}=19$
; (c) S-type asymmetry with
 $KC=5.65,{\it\beta}=11$
; (d) S-type asymmetry with
$KC=5.65,{\it\beta}=11$
; (d) S-type asymmetry with
 $KC=8.16,{\it\beta}=5$
.
$KC=8.16,{\it\beta}=5$
.
This resemblance is further confirmed by the Lagrangian massless particle distributions, (for the
 $\text{QP}_{\text{H}}$
-type flow shown in figure 6
a and the S-type flow shown in figure 6
d) which we present in figure 7. As before, the particles are introduced after any initial transient effects have passed. The dipolar vortex street for the
$\text{QP}_{\text{H}}$
-type flow shown in figure 6
a and the S-type flow shown in figure 6
d) which we present in figure 7. As before, the particles are introduced after any initial transient effects have passed. The dipolar vortex street for the
 $\text{QP}_{\text{H}}$
-type flow for the foil with
$\text{QP}_{\text{H}}$
-type flow for the foil with
 $AR=0.5$
is really rather similar to the equivalent flow around the circular cylinder shown in figure 4 and the synchronous S-type flow also exhibits a symmetry about a horizontal line through the equilibrium position of the foil, with identifiable structures associated with each of the oscillation periods, although the characteristic curved structure actually now bends round at the end, indicative of a return flow towards the foil. The dipolar vortex street arises from interactions between vortices shed from either side of the foil during both the up-stroke and the down-stroke of the foil, and so we expect to be able to detect a frequency close to
$AR=0.5$
is really rather similar to the equivalent flow around the circular cylinder shown in figure 4 and the synchronous S-type flow also exhibits a symmetry about a horizontal line through the equilibrium position of the foil, with identifiable structures associated with each of the oscillation periods, although the characteristic curved structure actually now bends round at the end, indicative of a return flow towards the foil. The dipolar vortex street arises from interactions between vortices shed from either side of the foil during both the up-stroke and the down-stroke of the foil, and so we expect to be able to detect a frequency close to
 $2f_{0}=2{\it\beta}$
in the horizontal force history of the foil.
$2f_{0}=2{\it\beta}$
in the horizontal force history of the foil.

Figure 7. Computed positions of massless particles advected from close to the elliptical foil with
 $AR=0.5$
in flows with parameters (a)
$AR=0.5$
in flows with parameters (a)
 $KC=4.89,{\it\beta}=19$
(
$KC=4.89,{\it\beta}=19$
(
 $\text{QP}_{\text{H}}$
-type asymmetry) after a release during the interval
$\text{QP}_{\text{H}}$
-type asymmetry) after a release during the interval
 $[130T_{0},150T_{0}]$
; and (b)
$[130T_{0},150T_{0}]$
; and (b)
 $KC=8.16$
,
$KC=8.16$
,
 ${\it\beta}=5$
(S-type asymmetry) after a release during the interval
${\it\beta}=5$
(S-type asymmetry) after a release during the interval
 $[130T_{0},170T_{0}]$
following the start of pure oscillation with period
$[130T_{0},170T_{0}]$
following the start of pure oscillation with period
 $T_{0}$
. Blue particles are released continuously from the right of the equator of the circle, and red particles are released continuously from the left of the equator of the circle.
$T_{0}$
. Blue particles are released continuously from the right of the equator of the circle, and red particles are released continuously from the left of the equator of the circle.

Figure 8. Time dependence of the horizontal force
 $F_{x}(t)$
on a purely oscillating elliptical foil with aspect ratio
$F_{x}(t)$
on a purely oscillating elliptical foil with aspect ratio
 $AR=0.5$
at (a)
$AR=0.5$
at (a)
 $KC=3.01,{\it\beta}=60$
, representing a typical
$KC=3.01,{\it\beta}=60$
, representing a typical
 $\text{QP}_{\text{H}}$
-type asymmetry, and (b)
$\text{QP}_{\text{H}}$
-type asymmetry, and (b)
 $KC=8.16,{\it\beta}=5$
, representing a typical S-type asymmetry. Time is scaled with the period of the primary oscillation
$KC=8.16,{\it\beta}=5$
, representing a typical S-type asymmetry. Time is scaled with the period of the primary oscillation
 $T_{0}=1/{\it\beta}$
.
$T_{0}=1/{\it\beta}$
.
The identification of these flows as being of the generic
 $\text{QP}_{\text{H}}$
-type and S-type asymmetries can be further confirmed by considering the time-dependent properties of the non-dimensional horizontal force histories
$\text{QP}_{\text{H}}$
-type and S-type asymmetries can be further confirmed by considering the time-dependent properties of the non-dimensional horizontal force histories
 $F_{x}(t)$
for these two flows, which we plot in figure 8(a) for the
$F_{x}(t)$
for these two flows, which we plot in figure 8(a) for the
 $\text{QP}_{\text{H}}$
-type flow with
$\text{QP}_{\text{H}}$
-type flow with
 $KC=3.01,{\it\beta}=60$
and in figure 8(b) for the S-type flow with
$KC=3.01,{\it\beta}=60$
and in figure 8(b) for the S-type flow with
 $KC=8.16,{\it\beta}=5$
. The different spectral properties of the two flows are immediately apparent, with the S-type flow being dominated by (twice) the primary frequency of oscillation of the foil, while there is a clear beating of the force signal for the
$KC=8.16,{\it\beta}=5$
. The different spectral properties of the two flows are immediately apparent, with the S-type flow being dominated by (twice) the primary frequency of oscillation of the foil, while there is a clear beating of the force signal for the
 $\text{QP}_{\text{H}}$
-type flow over a much longer period, although there is also a dependence quite close to twice the primary frequency of oscillation. Unsurprisingly, the magnitude (non-dimensionalized with
$\text{QP}_{\text{H}}$
-type flow over a much longer period, although there is also a dependence quite close to twice the primary frequency of oscillation. Unsurprisingly, the magnitude (non-dimensionalized with
 ${\it\nu}$
and
${\it\nu}$
and
 $c$
) of the force is substantially larger for the
$c$
) of the force is substantially larger for the
 $\text{QP}_{\text{H}}$
-type flow than for the S-type flow.
$\text{QP}_{\text{H}}$
-type flow than for the S-type flow.
These observations can be made quantitative by consideration of the frequency power spectra obtained by using a fast Fourier transform, which we plot in figure 9. It is important to remember that, because of the up–down symmetry of the primary oscillating frequency of the foil, the frequency inherent in horizontal force time history for a symmetric flow should be precisely double that of the primary oscillation frequency
 $f_{0}={\it\beta}$
of the foil. We observe that two similar, but different, frequencies exist for the
$f_{0}={\it\beta}$
of the foil. We observe that two similar, but different, frequencies exist for the
 $\text{QP}_{\text{H}}$
-type flow asymmetry corresponding to
$\text{QP}_{\text{H}}$
-type flow asymmetry corresponding to
 $1.88f_{0}$
and
$1.88f_{0}$
and
 $f_{2}=2.12f_{0}$
. Naturally, there is also substantial power in another lower frequency
$f_{2}=2.12f_{0}$
. Naturally, there is also substantial power in another lower frequency
 $f_{3}=0.12f_{0}$
that is exactly the consequence of beating between the other two frequencies. As expected, the horizontal force time history for the S-type flow is completely dominated by twice the primary frequency of oscillation, with a weak contribution of the second harmonic.
$f_{3}=0.12f_{0}$
that is exactly the consequence of beating between the other two frequencies. As expected, the horizontal force time history for the S-type flow is completely dominated by twice the primary frequency of oscillation, with a weak contribution of the second harmonic.

Figure 9. Horizontal force power spectra for the flow with a purely oscillating elliptical foil with
 $AR=0.5$
and (a)
$AR=0.5$
and (a)
 $KC=3.01,{\it\beta}=60$
; (b)
$KC=3.01,{\it\beta}=60$
; (b)
 $KC=8.16,{\it\beta}=5$
. Frequencies are scaled with the non-dimensional frequency of the primary oscillation
$KC=8.16,{\it\beta}=5$
. Frequencies are scaled with the non-dimensional frequency of the primary oscillation
 $f_{0}={\it\beta}$
.
$f_{0}={\it\beta}$
.
3.3. Symmetry breaking for
$AR=0.1$

The properties of the transition boundary, and indeed the properties of the associated asymmetric flows, are qualitatively different for pure oscillation of the elliptical foil with the smallest aspect ratio
 $AR=0.1$
, where the foil is, in some sense, long and thin. Consideration of figure 5 suggests that there is a significant change in the structure of the transition boundary curve for the smallest value of
$AR=0.1$
, where the foil is, in some sense, long and thin. Consideration of figure 5 suggests that there is a significant change in the structure of the transition boundary curve for the smallest value of
 $AR=0.1$
. As noted above during the discussion of the different possible definitions for Reynolds number, it is at least plausible for such a flow to be dynamically unaffected by the horizontal extent
$AR=0.1$
. As noted above during the discussion of the different possible definitions for Reynolds number, it is at least plausible for such a flow to be dynamically unaffected by the horizontal extent
 $c$
of the foil, and so in figure 10, we replot the transition boundaries shown in figure 5 using
$c$
of the foil, and so in figure 10, we replot the transition boundaries shown in figure 5 using
 ${\it\beta}_{A}={\it\beta}(KC)^{2}$
as defined in (2.3) as the
${\it\beta}_{A}={\it\beta}(KC)^{2}$
as defined in (2.3) as the
 $y$
-coordinate to test the hypothesis that
$y$
-coordinate to test the hypothesis that
 $c$
is not significant for the foil with aspect ratio
$c$
is not significant for the foil with aspect ratio
 $AR=0.1$
. This hypothesis proves to be correct, as the transition boundary for the
$AR=0.1$
. This hypothesis proves to be correct, as the transition boundary for the
 $AR=0.1$
case occurs, to a very good approximation, at a fixed value of
$AR=0.1$
case occurs, to a very good approximation, at a fixed value of
 ${\it\beta}_{A}\simeq 3$
for all calculated values of
${\it\beta}_{A}\simeq 3$
for all calculated values of
 $KC$
, suggesting that the dependence on
$KC$
, suggesting that the dependence on
 $c$
is not significant for this case.
$c$
is not significant for this case.

Figure 10. Location of transition boundaries as a function of Keulegan–Carpenter parameter
 $KC$
and amplitude Stokes number
$KC$
and amplitude Stokes number
 ${\it\beta}_{A}={\it\beta}(KC)^{2}$
as defined in (2.3) for different aspect ratios,
${\it\beta}_{A}={\it\beta}(KC)^{2}$
as defined in (2.3) for different aspect ratios,
 $AR=1.0$
(solid line);
$AR=1.0$
(solid line);
 $AR=0.5$
(dashed line);
$AR=0.5$
(dashed line);
 $AR=0.1$
(dash-dotted line). The marked freezing zone approximates the location of transition between QP-type and S-type asymmetries. Parameter values associated with symmetric flow as obtained by our two-dimensional simulations are marked by ▵, while parameter values associated with asymmetric flow are marked by ▫.
$AR=0.1$
(dash-dotted line). The marked freezing zone approximates the location of transition between QP-type and S-type asymmetries. Parameter values associated with symmetric flow as obtained by our two-dimensional simulations are marked by ▵, while parameter values associated with asymmetric flow are marked by ▫.

Figure 11. Twenty-two evenly spaced contours of vorticity between
 $-100$
(blue) and
$-100$
(blue) and
 $+100$
(red) on the asymmetrical side of the transition boundary for an elliptical purely oscillating foil with
$+100$
(red) on the asymmetrical side of the transition boundary for an elliptical purely oscillating foil with
 $AR=0.1$
when the centre of the foil is at
$AR=0.1$
when the centre of the foil is at
 $y=-A$
, its largest magnitude negative displacement for flows with a: (a)
$y=-A$
, its largest magnitude negative displacement for flows with a: (a)
 $\text{QP}_{\text{L}}$
-type asymmetry with
$\text{QP}_{\text{L}}$
-type asymmetry with
 $KC=1.51,{\it\beta}=60$
; (b)
$KC=1.51,{\it\beta}=60$
; (b)
 $\text{QP}_{\text{L}}$
-type asymmetry with
$\text{QP}_{\text{L}}$
-type asymmetry with
 $KC=1.88,{\it\beta}=34$
; (c) S-type asymmetry with
$KC=1.88,{\it\beta}=34$
; (c) S-type asymmetry with
 $KC=3.14,{\it\beta}=14$
; (d) S-type asymmetry with
$KC=3.14,{\it\beta}=14$
; (d) S-type asymmetry with
 $KC=4.39,{\it\beta}=8$
.
$KC=4.39,{\it\beta}=8$
.
Consistent evidence that the small aspect ratio flow is different can also be gained from consideration of the vorticity contours shown in figure 11 for the flow around the elliptical foil with
 $AR=0.1$
on the asymmetrical side of the transition boundary for
$AR=0.1$
on the asymmetrical side of the transition boundary for
 $\text{QP}_{\text{L}}$
-type flows, i.e. quasi-periodic asymmetrical flows around sufficiently low aspect-ratio foils (panels a,b) and S-type flows (panels c,d). Considering the S-type flows first, by comparison with equivalent figures 3 and 6 for the other two foils, the induced vortices appear not to be as elongated, and are more strongly localized in the vicinity of the oscillating foil. However, the dynamics is still synchronous and the time history of the horizontal force is still dominated completely by the expected frequency, twice the primary frequency of the oscillating foil i.e.
$\text{QP}_{\text{L}}$
-type flows, i.e. quasi-periodic asymmetrical flows around sufficiently low aspect-ratio foils (panels a,b) and S-type flows (panels c,d). Considering the S-type flows first, by comparison with equivalent figures 3 and 6 for the other two foils, the induced vortices appear not to be as elongated, and are more strongly localized in the vicinity of the oscillating foil. However, the dynamics is still synchronous and the time history of the horizontal force is still dominated completely by the expected frequency, twice the primary frequency of the oscillating foil i.e.
 $2f_{0}=2{\it\beta}$
.
$2f_{0}=2{\it\beta}$
.

Figure 12. Computed positions of massless particles advected from close to the elliptical foil with
 $AR=0.1$
in flows with parameters (a)
$AR=0.1$
in flows with parameters (a)
 $KC=1.51,{\it\beta}=60$
(
$KC=1.51,{\it\beta}=60$
(
 $\text{QP}_{\text{L}}$
-type asymmetry) after a release during the interval
$\text{QP}_{\text{L}}$
-type asymmetry) after a release during the interval
 $[540T_{0},640T_{0}]$
; and (b)
$[540T_{0},640T_{0}]$
; and (b)
 $KC=4.39,{\it\beta}=8$
(S-type asymmetry) after a release during the interval
$KC=4.39,{\it\beta}=8$
(S-type asymmetry) after a release during the interval
 $[130T_{0},170T_{0}]$
following the start of pure oscillation with period
$[130T_{0},170T_{0}]$
following the start of pure oscillation with period
 $T_{0}$
. Blue particles are released continuously from the right of the equator of the circle, and red particles are released continuously from the left of the equator of the circle.
$T_{0}$
. Blue particles are released continuously from the right of the equator of the circle, and red particles are released continuously from the left of the equator of the circle.
There is a much more marked and qualitative difference in the structure of the
 $\text{QP}_{\text{L}}$
-type asymmetry shown in panels (a,b). Rather than a dipolar structure in the far field, the vorticity structure appears appreciably more complex, with a very marked asymmetry between the flow either side of the foil, suggesting that the structure of this
$\text{QP}_{\text{L}}$
-type asymmetry shown in panels (a,b). Rather than a dipolar structure in the far field, the vorticity structure appears appreciably more complex, with a very marked asymmetry between the flow either side of the foil, suggesting that the structure of this
 $\text{QP}_{\text{L}}$
-type flow is markedly different for foils with low aspect ratios. The lack of observed interaction between the two sides suggests that the up and down strokes of the foil may well play distinct and different roles in the development of asymmetry within this flow, which would imply that the characteristic close frequencies which lead to the observed quasi-periodicity should be centred around the primary frequency of oscillation
$\text{QP}_{\text{L}}$
-type flow is markedly different for foils with low aspect ratios. The lack of observed interaction between the two sides suggests that the up and down strokes of the foil may well play distinct and different roles in the development of asymmetry within this flow, which would imply that the characteristic close frequencies which lead to the observed quasi-periodicity should be centred around the primary frequency of oscillation
 $f_{0}={\it\beta}$
rather than its first harmonic
$f_{0}={\it\beta}$
rather than its first harmonic
 $2f_{0}$
, as observed for the foils with larger aspect ratio.
$2f_{0}$
, as observed for the foils with larger aspect ratio.
This suggestion is confirmed by consideration of the Lagrangian evolution of massless particles for the flows shown in figure 11(a,d). We plot in figure 12(a,b) the particle distributions after release once the flow is in quasi-steady state during the time intervals
 $[540T_{0},640T_{0}]$
and
$[540T_{0},640T_{0}]$
and
 $[60T_{0},88T_{0}]$
, respectively. Both these patterns are markedly different from the equivalent patterns for the larger aspect-ratio foils shown in figures 4 and 7. The S-type pattern is still synchronous but is, as expected, much more localized in the vicinity of the foil, and strongly asymmetric between the two ends of the elliptical foil. The distribution of particles is also much wider, indicative of the different aspect ratios of the dominant vortices which develop around the flapping foil.
$[60T_{0},88T_{0}]$
, respectively. Both these patterns are markedly different from the equivalent patterns for the larger aspect-ratio foils shown in figures 4 and 7. The S-type pattern is still synchronous but is, as expected, much more localized in the vicinity of the foil, and strongly asymmetric between the two ends of the elliptical foil. The distribution of particles is also much wider, indicative of the different aspect ratios of the dominant vortices which develop around the flapping foil.
The difference for the
 $\text{QP}_{\text{L}}$
-type asymmetry is once again more marked, and the flow is so different that we believe that this is a distinct new type of quasi-periodic asymmetry. There is much less evidence of a dipolar vortex street developing away from the oscillating foil, but even more noticeable is the marked left–right asymmetry. Unlike all the other cases considered, there is virtually no communication between the fluid in the vicinity of either side of the equator of the flapping foil. Virtually all the blue massless particles released to the right of the foil remain there, and only the red particles released on the left of the foil are propagated any significant distance away from the oscillating foil, though at a substantially shallower angle than the (essentially vertical) propagation observed for the flows induced by the other two aspect ratio foils.
$\text{QP}_{\text{L}}$
-type asymmetry is once again more marked, and the flow is so different that we believe that this is a distinct new type of quasi-periodic asymmetry. There is much less evidence of a dipolar vortex street developing away from the oscillating foil, but even more noticeable is the marked left–right asymmetry. Unlike all the other cases considered, there is virtually no communication between the fluid in the vicinity of either side of the equator of the flapping foil. Virtually all the blue massless particles released to the right of the foil remain there, and only the red particles released on the left of the foil are propagated any significant distance away from the oscillating foil, though at a substantially shallower angle than the (essentially vertical) propagation observed for the flows induced by the other two aspect ratio foils.

Figure 13. Pressure profiles over the foil surface at the time-instant corresponding respectively to the
 $\text{QP}_{\text{L}}$
-type flow shown in figure 11(a) (solid line, normalized by its maximum value 2.272), and the S-type flow shown in figure 11(d) (dashed line, normalized by its maximum value 0.138).
$\text{QP}_{\text{L}}$
-type flow shown in figure 11(a) (solid line, normalized by its maximum value 2.272), and the S-type flow shown in figure 11(d) (dashed line, normalized by its maximum value 0.138).
The different physical response is also evident in the normalized integrated pressure distribution over the surface of the foils plotted in figure 13 for the
 $\text{QP}_{\text{L}}$
-type flow with
$\text{QP}_{\text{L}}$
-type flow with
 $KC=1.51,{\it\beta}=60$
(solid line) and the S-type flow with
$KC=1.51,{\it\beta}=60$
(solid line) and the S-type flow with
 $KC=4.39,{\it\beta}=8$
(dashed line) at the same time instants, as shown in figure 11. The pressure distribution is both more closely (though not completely) symmetric and substantially higher in amplitude for the
$KC=4.39,{\it\beta}=8$
(dashed line) at the same time instants, as shown in figure 11. The pressure distribution is both more closely (though not completely) symmetric and substantially higher in amplitude for the
 $\text{QP}_{\text{L}}$
-type asymmetry flow. Interestingly, and perhaps counter-intuitively, this relatively symmetric and strong pressure distribution suppresses the communication between the induced vortices at either tip of the foil, thus leading to the marked separation between the evolving dynamics at either tip, as is particularly evident in the massless particle distributions shown in figure 12(a). Since there is virtually no coupling between the vortices at either tip, the symmetry breaking leads to one set of massless particles (those on the left) being advected away from the foil due to the broken symmetry. Conversely, the small in magnitude, yet highly asymmetric pressure distribution evident for the flow with S-type asymmetry leads to the curling over the foil of the slightly stronger (negative) vortex shed from the left tip of the foil apparent in figure 11(d), which interacts strongly with the positive vortex at the right tip of the foil, thus leading to the distinctive intermingled particle distribution curving over the foil shown in figure 12(b).
$\text{QP}_{\text{L}}$
-type asymmetry flow. Interestingly, and perhaps counter-intuitively, this relatively symmetric and strong pressure distribution suppresses the communication between the induced vortices at either tip of the foil, thus leading to the marked separation between the evolving dynamics at either tip, as is particularly evident in the massless particle distributions shown in figure 12(a). Since there is virtually no coupling between the vortices at either tip, the symmetry breaking leads to one set of massless particles (those on the left) being advected away from the foil due to the broken symmetry. Conversely, the small in magnitude, yet highly asymmetric pressure distribution evident for the flow with S-type asymmetry leads to the curling over the foil of the slightly stronger (negative) vortex shed from the left tip of the foil apparent in figure 11(d), which interacts strongly with the positive vortex at the right tip of the foil, thus leading to the distinctive intermingled particle distribution curving over the foil shown in figure 12(b).

Figure 14. Time dependence of the horizontal force on the purely oscillating elliptical foil with aspect ratio
 $AR=0.1$
at
$AR=0.1$
at
 $KC=1.51,{\it\beta}=60$
, representing QP-type asymmetry. Time is scaled with the period of the primary oscillation
$KC=1.51,{\it\beta}=60$
, representing QP-type asymmetry. Time is scaled with the period of the primary oscillation
 $T_{0}=1/{\it\beta}$
.
$T_{0}=1/{\it\beta}$
.
The qualitatively different, and yet still inherently quasi-periodic, character of the
 $\text{QP}_{\text{L}}$
-type asymmetric flow is confirmed by consideration of the spectral properties of the time history of the horizontal force on the foil. For the flow shown in figure 11(a), we plot the time history of the horizontal force on the foil in figure 14. The time history shows an extremely long transient behaviour, although quasi-periodic beating is apparent from very early on in the flow evolution. Eventually, a clear, yet long secondary period
$\text{QP}_{\text{L}}$
-type asymmetric flow is confirmed by consideration of the spectral properties of the time history of the horizontal force on the foil. For the flow shown in figure 11(a), we plot the time history of the horizontal force on the foil in figure 14. The time history shows an extremely long transient behaviour, although quasi-periodic beating is apparent from very early on in the flow evolution. Eventually, a clear, yet long secondary period
 $T_{s}\simeq 23T$
emerges. We analyse the spectral properties of the horizontal force once this periodic oscillation saturates, and the flow reaches a quasi-steady state, calculating the power spectrum for the horizontal force time history over the interval
$T_{s}\simeq 23T$
emerges. We analyse the spectral properties of the horizontal force once this periodic oscillation saturates, and the flow reaches a quasi-steady state, calculating the power spectrum for the horizontal force time history over the interval
 $[600T_{0},900T_{0}]$
as plotted in figure 15.
$[600T_{0},900T_{0}]$
as plotted in figure 15.

Figure 15. Horizontal force power spectrum for the flow with a purely oscillating elliptical foil with
 $AR=0.1$
and
$AR=0.1$
and
 $KC=1.51,{\it\beta}=60$
with
$KC=1.51,{\it\beta}=60$
with
 $\text{QP}_{\text{L}}$
-type asymmetry for the time interval
$\text{QP}_{\text{L}}$
-type asymmetry for the time interval
 $[600T_{0},900T_{0}]$
. Frequencies are scaled with the non-dimensional frequency of the primary oscillation
$[600T_{0},900T_{0}]$
. Frequencies are scaled with the non-dimensional frequency of the primary oscillation
 $f_{0}={\it\beta}=1/T_{0}$
.
$f_{0}={\it\beta}=1/T_{0}$
.
The power spectrum is qualitatively different from the power spectrum for the
 $\text{QP}_{\text{H}}$
-type asymmetric flow for an elliptical foil with
$\text{QP}_{\text{H}}$
-type asymmetric flow for an elliptical foil with
 $AR=0.5$
, as plotted in figure 9(a). There still remains an (unsplit) component at twice the primary oscillation frequency
$AR=0.5$
, as plotted in figure 9(a). There still remains an (unsplit) component at twice the primary oscillation frequency
 $2f_{0}$
, but quasi-periodicity is here due to two closely separated frequencies either side of the primary oscillation frequency itself, i.e. either side of
$2f_{0}$
, but quasi-periodicity is here due to two closely separated frequencies either side of the primary oscillation frequency itself, i.e. either side of
 $f_{0}={\it\beta}$
. This is consistent with the lack of communication between the two ends of the foil seen in the vortical contours and the Lagrangian massless particle distributions. The fact that vortex interaction leading to quasi-periodicity appears to occur only on one side implies that the dominant quasi-periodic frequencies will be close to the primary oscillation frequency
$f_{0}={\it\beta}$
. This is consistent with the lack of communication between the two ends of the foil seen in the vortical contours and the Lagrangian massless particle distributions. The fact that vortex interaction leading to quasi-periodicity appears to occur only on one side implies that the dominant quasi-periodic frequencies will be close to the primary oscillation frequency
 $f_{0}$
, not its harmonic
$f_{0}$
, not its harmonic
 $2f_{0}$
(which would be characteristic of tip–tip interaction), exactly as observed. Therefore, as already mentioned in the introduction, we refer to this type of asymmetry as a ‘primary’
$2f_{0}$
(which would be characteristic of tip–tip interaction), exactly as observed. Therefore, as already mentioned in the introduction, we refer to this type of asymmetry as a ‘primary’
 $\text{QP}_{\text{L}}$
-type asymmetry.
$\text{QP}_{\text{L}}$
-type asymmetry.
3.4. Mathematical analysis of
$\text{QP}_{\text{H}}$
-type and
$\text{QP}_{\text{L}}$
-type asymmetric flows


Further evidence that there are two distinct types of quasi-periodic asymmetries depending on the aspect ratio of the foil can be gained by considering quantitatively the Floquet stability of the oscillating base (symmetric) flows. Floquet stability analysis examines the behaviour of a perturbation,
 $u^{\prime }$
, compared to a
$u^{\prime }$
, compared to a
 $T$
-periodic (limit cycle) base flow,
$T$
-periodic (limit cycle) base flow,
 $U$
, to determine whether the perturbation grows or decays from cycle to cycle. The evolution equations for the perturbation flow are the Navier–Stokes equations linearized about the base, (in this case symmetric) flow around the foil. Perturbation solutions can be written as a sum of components
$U$
, to determine whether the perturbation grows or decays from cycle to cycle. The evolution equations for the perturbation flow are the Navier–Stokes equations linearized about the base, (in this case symmetric) flow around the foil. Perturbation solutions can be written as a sum of components
 $\tilde{u} (t_{0})\text{e}^{{\it\sigma}(t-t_{0})}$
where
$\tilde{u} (t_{0})\text{e}^{{\it\sigma}(t-t_{0})}$
where
 $\tilde{u} (t_{0})$
is a
$\tilde{u} (t_{0})$
is a
 $T$
-periodic Floquet eigenfunction, evaluated at arbitrary phase
$T$
-periodic Floquet eigenfunction, evaluated at arbitrary phase
 $t_{0}$
and
$t_{0}$
and
 ${\it\sigma}$
is a Floquet exponent. In general, a Floquet multiplier is defined by
${\it\sigma}$
is a Floquet exponent. In general, a Floquet multiplier is defined by
 ${\it\mu}=\text{e}^{{\it\sigma}T}$
where
${\it\mu}=\text{e}^{{\it\sigma}T}$
where
 $T$
is the period of the base periodic flow. The exponents
$T$
is the period of the base periodic flow. The exponents
 ${\it\sigma}$
and the multipliers
${\it\sigma}$
and the multipliers
 ${\it\mu}$
can either be real, or occur in complex-conjugate pairs. Instability occurs when a multiplier leaves the unit circle,
${\it\mu}$
can either be real, or occur in complex-conjugate pairs. Instability occurs when a multiplier leaves the unit circle,
 $|{\it\mu}|>1$
, or equivalently when the real part of a Floquet exponent becomes positive.
$|{\it\mu}|>1$
, or equivalently when the real part of a Floquet exponent becomes positive.
The technique we use for Floquet stability analysis is a Krylov subspace method that examines the stability of the linearized Poincaré map for the perturbation flow, and is detailed in Elston et al. (Reference Elston, Sheridan and Blackburn2004, Reference Elston, Blackburn and Sheridan2006) who, as already mentioned, considered the Floquet stability of the flow around a circle with
 $AR=1$
. The reflection symmetry of the base flow is enforced by solving in a half domain (see figure 2), with symmetry boundary conditions along the
$AR=1$
. The reflection symmetry of the base flow is enforced by solving in a half domain (see figure 2), with symmetry boundary conditions along the
 $x=0$
boundary. The base flow is integrated in time for 30 cycles, when it reaches a periodic state. It is then projected onto the full domain, and stored for Fourier time interpolation. We store 64 time slices, equi-spaced in time over the base flow period
$x=0$
boundary. The base flow is integrated in time for 30 cycles, when it reaches a periodic state. It is then projected onto the full domain, and stored for Fourier time interpolation. We store 64 time slices, equi-spaced in time over the base flow period
 $T$
, for reconstruction of the base flow. It should be noted that for two-dimensional Floquet analysis in the current problem, there is difficulty resolving stable modes,
$T$
, for reconstruction of the base flow. It should be noted that for two-dimensional Floquet analysis in the current problem, there is difficulty resolving stable modes,
 $|{\it\mu}|<1$
, while unstable modes are resolved without difficulty, and the location of marginal stability can be estimated by extrapolation to
$|{\it\mu}|<1$
, while unstable modes are resolved without difficulty, and the location of marginal stability can be estimated by extrapolation to
 $|{\it\mu}|=1$
(Elston et al.
Reference Elston, Sheridan and Blackburn2004).
$|{\it\mu}|=1$
(Elston et al.
Reference Elston, Sheridan and Blackburn2004).

Figure 16. Floquet results at
 ${\it\beta}=60$
for
${\it\beta}=60$
for
 $AR=1.0$
. (a) The variation of
$AR=1.0$
. (a) The variation of
 $|{\it\mu}|$
with
$|{\it\mu}|$
with
 $KC$
: solid circles represent multipliers for the mode of marginal stability, while open circles show magnitude for a complex-conjugate pair of multipliers that cross the unit circle at
$KC$
: solid circles represent multipliers for the mode of marginal stability, while open circles show magnitude for a complex-conjugate pair of multipliers that cross the unit circle at
 $KC=4.114$
. (b) The phase angle for the complex-conjugate pair of multipliers. (c) The secondary periods computed from
$KC=4.114$
. (b) The phase angle for the complex-conjugate pair of multipliers. (c) The secondary periods computed from
 $T_{s}=2{\rm\pi}T/{\it\theta}$
, with a dashed line showing inverse square-root behaviour (
$T_{s}=2{\rm\pi}T/{\it\theta}$
, with a dashed line showing inverse square-root behaviour (
 $T_{s}/T=1.633+3.362/\sqrt{4.319-KC}$
).
$T_{s}/T=1.633+3.362/\sqrt{4.319-KC}$
).

Figure 17. Floquet results at
 ${\it\beta}=60$
for
${\it\beta}=60$
for
 $AR=0.5$
. (a) The variation of
$AR=0.5$
. (a) The variation of
 $|{\it\mu}|$
with
$|{\it\mu}|$
with
 $KC$
: solid circles represent multipliers for the mode of marginal stability, while open circles show magnitude for a complex-conjugate pair of multipliers that cross the unit circle at
$KC$
: solid circles represent multipliers for the mode of marginal stability, while open circles show magnitude for a complex-conjugate pair of multipliers that cross the unit circle at
 $KC=2.751$
. (b) The phase angle for the complex-conjugate pair of multipliers. (c) The secondary periods computed from
$KC=2.751$
. (b) The phase angle for the complex-conjugate pair of multipliers. (c) The secondary periods computed from
 $T_{s}\simeq 2{\rm\pi}T/{\it\theta}$
, with a dashed line showing inverse square-root behaviour (
$T_{s}\simeq 2{\rm\pi}T/{\it\theta}$
, with a dashed line showing inverse square-root behaviour (
 $T_{s}/T=4.546+4.245/\sqrt{3.121-KC}$
).
$T_{s}/T=4.546+4.245/\sqrt{3.121-KC}$
).

Figure 18. Floquet results at
 ${\it\beta}=60$
for
${\it\beta}=60$
for
 $AR=0.1$
. Note that all calculated Floquet multipliers are real.
$AR=0.1$
. Note that all calculated Floquet multipliers are real.
As pointed out by Elston et al. (Reference Elston, Sheridan and Blackburn2004) for an oscillating circular cylinder at sufficiently high
 ${\it\beta}$
, where the symmetry breaking is observed to be of QP-type, the first multipliers to cross the unit circle occur in complex-conjugate pairs, i.e.
${\it\beta}$
, where the symmetry breaking is observed to be of QP-type, the first multipliers to cross the unit circle occur in complex-conjugate pairs, i.e.
 ${\it\mu}=\text{e}^{\pm \text{i}{\it\theta}}$
, so the (supercritical) bifurcation is of Neimark–Sacker type. We plot the Floquet results at
${\it\mu}=\text{e}^{\pm \text{i}{\it\theta}}$
, so the (supercritical) bifurcation is of Neimark–Sacker type. We plot the Floquet results at
 ${\it\beta}=60$
for
${\it\beta}=60$
for
 $AR=1.0$
,
$AR=1.0$
,
 $AR=0.5$
and
$AR=0.5$
and
 $AR=0.1$
in figures 16–18 respectively. In Elston et al. (Reference Elston, Sheridan and Blackburn2004) they showed by comparison to two-dimensional direct numerical simulation results that the simple relationship
$AR=0.1$
in figures 16–18 respectively. In Elston et al. (Reference Elston, Sheridan and Blackburn2004) they showed by comparison to two-dimensional direct numerical simulation results that the simple relationship
 $T_{s}/T\simeq 2{\rm\pi}/{\it\theta}$
held very close to transition for the specific value of
$T_{s}/T\simeq 2{\rm\pi}/{\it\theta}$
held very close to transition for the specific value of
 ${\it\beta}=44.2$
. As is apparent from careful consideration of figures 3 and 9 of Elston et al. (Reference Elston, Sheridan and Blackburn2004), that particular choice of
${\it\beta}=44.2$
. As is apparent from careful consideration of figures 3 and 9 of Elston et al. (Reference Elston, Sheridan and Blackburn2004), that particular choice of
 ${\it\beta}$
shows excellent agreement between the results of the numerical simulations and Floquet analysis, whereas there is some relatively small quantitative difference between the Floquet analysis and the numerical simulations at
${\it\beta}$
shows excellent agreement between the results of the numerical simulations and Floquet analysis, whereas there is some relatively small quantitative difference between the Floquet analysis and the numerical simulations at
 ${\it\beta}=60$
. We observe a similar slight numerical mismatch, with the critical value of
${\it\beta}=60$
. We observe a similar slight numerical mismatch, with the critical value of
 $KC$
predicted by Floquet analysis for
$KC$
predicted by Floquet analysis for
 $AR=1$
being
$AR=1$
being
 $KC_{c}=4.114$
, compared to the numerical simulation indicating that
$KC_{c}=4.114$
, compared to the numerical simulation indicating that
 $KC_{c}\in [4.27,4.39]$
and for
$KC_{c}\in [4.27,4.39]$
and for
 $AR=0.5$
being
$AR=0.5$
being
 $KC_{c}=2.751$
, compared to the numerical simulation indicating that
$KC_{c}=2.751$
, compared to the numerical simulation indicating that
 $KC_{c}\in [2.89,3.01]$
.
$KC_{c}\in [2.89,3.01]$
.
Figures 16(c) and 17(c) show the ratios
 $T_{s}/T$
derived from the assumed correspondence (as presented by Elston et al. (Reference Elston, Sheridan and Blackburn2004, Reference Elston, Blackburn and Sheridan2006)) with the Floquet multipliers calculated for
$T_{s}/T$
derived from the assumed correspondence (as presented by Elston et al. (Reference Elston, Sheridan and Blackburn2004, Reference Elston, Blackburn and Sheridan2006)) with the Floquet multipliers calculated for
 $AR=1.0$
and
$AR=1.0$
and
 $AR=0.5$
, respectively. For both flows, as
$AR=0.5$
, respectively. For both flows, as
 $KC\rightarrow KC_{\infty }$
, (
$KC\rightarrow KC_{\infty }$
, (
 $KC_{\infty }=4.319$
for
$KC_{\infty }=4.319$
for
 $AR=1$
and
$AR=1$
and
 $KC_{\infty }=3.121$
for
$KC_{\infty }=3.121$
for
 $AR=0.5$
)
$AR=0.5$
)
 $T_{s}/T\sim \sqrt{KC_{\infty }-KC}\rightarrow \infty$
. Such a square-root scaling is indicative of a ‘saddle node on an invariant circle’ or ‘SNIC’ bifurcation (see e.g. Lopez, Rubio & Marques (Reference Lopez, Rubio and Marques2006), Rubio, Lopez & MArques (Reference Rubio, Lopez and MArques2008) for a detailed discussion) although care must be taken in drawing any conclusions from the inherently linear and two-dimensional Floquet stability analysis for values of
$T_{s}/T\sim \sqrt{KC_{\infty }-KC}\rightarrow \infty$
. Such a square-root scaling is indicative of a ‘saddle node on an invariant circle’ or ‘SNIC’ bifurcation (see e.g. Lopez, Rubio & Marques (Reference Lopez, Rubio and Marques2006), Rubio, Lopez & MArques (Reference Rubio, Lopez and MArques2008) for a detailed discussion) although care must be taken in drawing any conclusions from the inherently linear and two-dimensional Floquet stability analysis for values of
 $KC$
far, in some sense, from the transition boundary to asymmetry. However, it is at least plausible that as
$KC$
far, in some sense, from the transition boundary to asymmetry. However, it is at least plausible that as
 ${\it\beta}$
is reduced along the transition boundary, with
${\it\beta}$
is reduced along the transition boundary, with
 $KC$
increasing towards the freezing zone where the
$KC$
increasing towards the freezing zone where the
 $\text{QP}_{\text{H}}$
-type asymmetry disappears as
$\text{QP}_{\text{H}}$
-type asymmetry disappears as
 $T_{s}\rightarrow \infty$
, this divergence in the secondary period will also be consistent with a SNIC bifurcation.
$T_{s}\rightarrow \infty$
, this divergence in the secondary period will also be consistent with a SNIC bifurcation.
Irrespective of this speculation, the Floquet stability results for
 $AR=0.1$
show a totally different behaviour compared to the higher aspect ratio counterparts, i.e.
$AR=0.1$
show a totally different behaviour compared to the higher aspect ratio counterparts, i.e.
 $AR=1.0$
and
$AR=1.0$
and
 $AR=0.5$
. As shown in figure 18, the first Floquet multiplier to cross the unit circle occurs with a single real value. Though we have clearly shown in figures 12 and 14 that a secondary period emerges for
$AR=0.5$
. As shown in figure 18, the first Floquet multiplier to cross the unit circle occurs with a single real value. Though we have clearly shown in figures 12 and 14 that a secondary period emerges for
 $AR=0.1$
in the higher
$AR=0.1$
in the higher
 ${\it\beta}$
region, it appears that this quasi-periodic behaviour for low aspect ratios cannot be predicted by a conventional linear Floquet stability analysis.
${\it\beta}$
region, it appears that this quasi-periodic behaviour for low aspect ratios cannot be predicted by a conventional linear Floquet stability analysis.
Furthermore, consideration of phase portraits and appropriate Poincaré maps based around iterates of the horizontal force and its derivatives demonstrate qualitative differences between the
 $\text{QP}_{\text{H}}$
-type asymmetry and the
$\text{QP}_{\text{H}}$
-type asymmetry and the
 $\text{QP}_{\text{L}}$
-type asymmetry. In figure 19(a,c) we plot a phase portrait of the dynamics during time intervals when the flow has settled into quasi-periodic behaviour, showing the variation of
$\text{QP}_{\text{L}}$
-type asymmetry. In figure 19(a,c) we plot a phase portrait of the dynamics during time intervals when the flow has settled into quasi-periodic behaviour, showing the variation of
 $\text{d}F_{x}/\text{d}t$
against
$\text{d}F_{x}/\text{d}t$
against
 $F_{x}$
for the
$F_{x}$
for the
 $\text{QP}_{\text{H}}$
-type asymmetry in the flow with
$\text{QP}_{\text{H}}$
-type asymmetry in the flow with
 $AR=0.5$
,
$AR=0.5$
,
 $KC=3.01$
,
$KC=3.01$
,
 ${\it\beta}=60$
and the
${\it\beta}=60$
and the
 $\text{QP}_{\text{L}}$
-type asymmetry in the flow with
$\text{QP}_{\text{L}}$
-type asymmetry in the flow with
 $AR=0.1$
,
$AR=0.1$
,
 $KC=1.51$
,
$KC=1.51$
,
 ${\it\beta}=60$
. The
${\it\beta}=60$
. The
 $\text{QP}_{\text{H}}$
-type asymmetry in figure 19(a) shows a relatively simple quasi-periodicity involving two similar loops, with relatively slow rate of change of
$\text{QP}_{\text{H}}$
-type asymmetry in figure 19(a) shows a relatively simple quasi-periodicity involving two similar loops, with relatively slow rate of change of
 $F_{x}$
occurring when
$F_{x}$
occurring when
 $F_{x}\simeq \pm (1{-}1.5)$
, interspersed with much faster variation away from these points. This picture is reinforced by the Poincaré map shown in figure 19(b). Once per primary period we plot
$F_{x}\simeq \pm (1{-}1.5)$
, interspersed with much faster variation away from these points. This picture is reinforced by the Poincaré map shown in figure 19(b). Once per primary period we plot
 $F_{x}$
against its value five primary periods earlier, and there is a collection of points in the vicinity of
$F_{x}$
against its value five primary periods earlier, and there is a collection of points in the vicinity of
 $F_{x}\simeq \pm (1{-}1.5)$
, reinforcing the slow–fast character of this quasi-periodic asymmetry, and its connection to a SNIC bifurcation (cf. figure 11 of Rubio et al. (Reference Rubio, Lopez and MArques2008)).
$F_{x}\simeq \pm (1{-}1.5)$
, reinforcing the slow–fast character of this quasi-periodic asymmetry, and its connection to a SNIC bifurcation (cf. figure 11 of Rubio et al. (Reference Rubio, Lopez and MArques2008)).
On the other hand, the phase portrait and Poincaré map shown in figure 19(b,d) for the flow with
 $AR=0.1$
,
$AR=0.1$
,
 $KC=1.51$
,
$KC=1.51$
,
 ${\it\beta}=60$
exhibiting
${\it\beta}=60$
exhibiting
 $\text{QP}_{\text{L}}$
-type asymmetry is qualitatively different, and much more complex. Both figures show that the horizontal force wanders over phase space, with a more significant lower frequency component than the flow exhibiting
$\text{QP}_{\text{L}}$
-type asymmetry is qualitatively different, and much more complex. Both figures show that the horizontal force wanders over phase space, with a more significant lower frequency component than the flow exhibiting
 $\text{QP}_{\text{H}}$
-type asymmetry, and in particular there is no real evidence of any slow–fast dynamics.
$\text{QP}_{\text{H}}$
-type asymmetry, and in particular there is no real evidence of any slow–fast dynamics.

Figure 19. Phase portraits plotting the time rate of change
 $\text{d}F_{x}/\text{d}t$
of the horizontal force against
$\text{d}F_{x}/\text{d}t$
of the horizontal force against
 $F_{x}$
for a flow with: (a)
$F_{x}$
for a flow with: (a)
 $AR=0.5$
,
$AR=0.5$
,
 $KC=3.01$
,
$KC=3.01$
,
 ${\it\beta}=60$
as shown in figure 8(a) exhibiting
${\it\beta}=60$
as shown in figure 8(a) exhibiting
 $\text{QP}_{\text{H}}$
-type asymmetry over the time interval
$\text{QP}_{\text{H}}$
-type asymmetry over the time interval
 $t/T_{0}=60{-}100$
; (c)
$t/T_{0}=60{-}100$
; (c)
 $AR=0.1$
,
$AR=0.1$
,
 $KC=1.51$
,
$KC=1.51$
,
 ${\it\beta}=60$
as shown in figure 14 exhibiting
${\it\beta}=60$
as shown in figure 14 exhibiting
 $\text{QP}_{\text{L}}$
-type asymmetry over the time interval
$\text{QP}_{\text{L}}$
-type asymmetry over the time interval
 $t/T_{0}=400{-}540$
, covering approximately 6 secondary periods in each case. Panels (b) and (d) are reconstructed phase portraits using delays of five primary periods, for the flows corresponding to (a) and (c) respectively. For clarity, a single iterate per primary period is plotted on the Poincaré map.
$t/T_{0}=400{-}540$
, covering approximately 6 secondary periods in each case. Panels (b) and (d) are reconstructed phase portraits using delays of five primary periods, for the flows corresponding to (a) and (c) respectively. For clarity, a single iterate per primary period is plotted on the Poincaré map.

Figure 20. Location of transition boundaries as a function of Keulegan–Carpenter parameter
 $KC$
and Stokes number
$KC$
and Stokes number
 ${\it\beta}$
as defined in (1.1) for flows associated with purely oscillating foils (solid lines) and flying oscillating foils (dashed lines) with: (a) aspect ratio
${\it\beta}$
as defined in (1.1) for flows associated with purely oscillating foils (solid lines) and flying oscillating foils (dashed lines) with: (a) aspect ratio
 $AR=1.0$
; (b) aspect ratio
$AR=1.0$
; (b) aspect ratio
 $AR=0.5$
; (c) aspect ratio
$AR=0.5$
; (c) aspect ratio
 $AR=0.1$
. (d) Location of transition boundaries as a function of Keulegan–Carpenter parameter
$AR=0.1$
. (d) Location of transition boundaries as a function of Keulegan–Carpenter parameter
 $KC$
and Stokes number
$KC$
and Stokes number
 ${\it\beta}_{A}$
as defined in (2.3) for flows associated with purely oscillating foils (solid lines) and flying oscillating foils (dashed lines) with aspect ratio
${\it\beta}_{A}$
as defined in (2.3) for flows associated with purely oscillating foils (solid lines) and flying oscillating foils (dashed lines) with aspect ratio
 $AR=0.1$
. Parameter values associated with symmetric flow as obtained by our two-dimensional simulations are marked by small filled squares for pure oscillations and by large open squares for flying oscillations, while parameter values associated with asymmetric flow are marked by small filled circles for pure oscillations and by large open circles for flying oscillations.
$AR=0.1$
. Parameter values associated with symmetric flow as obtained by our two-dimensional simulations are marked by small filled squares for pure oscillations and by large open squares for flying oscillations, while parameter values associated with asymmetric flow are marked by small filled circles for pure oscillations and by large open circles for flying oscillations.
In conclusion, we have identified what we believe to be a new ‘primary’
 $\text{QP}_{\text{L}}$
-type of quasi-periodic asymmetric flow for small aspect ratio foils undergoing ‘pure’ oscillation, which is associated with the primary frequency of oscillation in the horizontal force time history. It is clear that an extensive parametric study would be needed to clarify all aspects of the transition to this
$\text{QP}_{\text{L}}$
-type of quasi-periodic asymmetric flow for small aspect ratio foils undergoing ‘pure’ oscillation, which is associated with the primary frequency of oscillation in the horizontal force time history. It is clear that an extensive parametric study would be needed to clarify all aspects of the transition to this
 $\text{QP}_{\text{L}}$
-type of asymmetry from the previously identified
$\text{QP}_{\text{L}}$
-type of asymmetry from the previously identified
 $\text{QP}_{\text{H}}$
-type asymmetry, a simple generalization of the QP-type asymmetry for circular cylinders to moderate aspect ratios, associated with twice the primary frequency of oscillation in the horizontal force time history. Such a study is beyond the scope of this paper, where we now turn our attention to consideration of how the transition boundary properties are modified for the class of flying oscillations where the foil is free to move horizontally. We are particularly interested in investigating whether these two different QP-type asymmetries occur for foils which are allowed to move horizontally, as it is not clear whether the quasi-periodicity growth mechanisms rely inherently on the foil being fixed horizontally.
$\text{QP}_{\text{H}}$
-type asymmetry, a simple generalization of the QP-type asymmetry for circular cylinders to moderate aspect ratios, associated with twice the primary frequency of oscillation in the horizontal force time history. Such a study is beyond the scope of this paper, where we now turn our attention to consideration of how the transition boundary properties are modified for the class of flying oscillations where the foil is free to move horizontally. We are particularly interested in investigating whether these two different QP-type asymmetries occur for foils which are allowed to move horizontally, as it is not clear whether the quasi-periodicity growth mechanisms rely inherently on the foil being fixed horizontally.
4. Symmetry breaking of ‘flying’ oscillations
In figure 20, we plot the transition boundaries in
 $KC$
–
$KC$
–
 ${\it\beta}$
space for both pure oscillations (with a solid line) and flying oscillations (with a dashed line) for flows associated with the three different aspect ratio oscillating foils which we have considered. For the elliptical foil, with aspect ratio
${\it\beta}$
space for both pure oscillations (with a solid line) and flying oscillations (with a dashed line) for flows associated with the three different aspect ratio oscillating foils which we have considered. For the elliptical foil, with aspect ratio
 $AR=0.1$
, we also plot in figure 20(d) the transition boundaries in
$AR=0.1$
, we also plot in figure 20(d) the transition boundaries in
 $KC$
–
$KC$
–
 ${\it\beta}_{A}$
space, where the amplitude Stokes number
${\it\beta}_{A}$
space, where the amplitude Stokes number
 ${\it\beta}_{A}$
is as defined in (2.3) showing how the pure oscillations exhibit a critical value of
${\it\beta}_{A}$
is as defined in (2.3) showing how the pure oscillations exhibit a critical value of
 ${\it\beta}_{A}\simeq 3$
for all values of
${\it\beta}_{A}\simeq 3$
for all values of
 $KC$
.
$KC$
.

Figure 21. Twenty-two evenly spaced contours of vorticity between
 $-60$
(blue) and
$-60$
(blue) and
 $+60$
(red) for a circular oscillating foil with parameters
$+60$
(red) for a circular oscillating foil with parameters
 $AR=1.0$
,
$AR=1.0$
,
 $KC=6.91$
and
$KC=6.91$
and
 ${\it\beta}=16$
when the centre of the foil is at
${\it\beta}=16$
when the centre of the foil is at
 $y=-A$
, its largest magnitude negative displacement for flows subject to (a) a pure oscillation and (b) a flying oscillation.
$y=-A$
, its largest magnitude negative displacement for flows subject to (a) a pure oscillation and (b) a flying oscillation.
In all cases, the transition boundaries have certain points of similarity. There are two systematic, though typically slight, differences for the foils with
 $AR=1$
and
$AR=1$
and
 $AR=0.5$
, which occur either side of the freezing point. At low values of
$AR=0.5$
, which occur either side of the freezing point. At low values of
 ${\it\beta}<{\it\beta}_{c}$
, the transition boundary for flying oscillations is typically above the transition boundary for pure oscillations, suggesting that the onset of S-type asymmetry is somewhat suppressed if the foil is free to move horizontally. Conversely, at higher values of
${\it\beta}<{\it\beta}_{c}$
, the transition boundary for flying oscillations is typically above the transition boundary for pure oscillations, suggesting that the onset of S-type asymmetry is somewhat suppressed if the foil is free to move horizontally. Conversely, at higher values of
 ${\it\beta}$
, the transition boundary for flying oscillations is below the transition boundary for pure oscillations, suggesting that the onset of
${\it\beta}$
, the transition boundary for flying oscillations is below the transition boundary for pure oscillations, suggesting that the onset of
 $\text{QP}_{\text{H}}$
-type asymmetry is actually encouraged by allowing the foil to oscillate. The behaviour is somewhat different for the foil with smallest aspect ratio
$\text{QP}_{\text{H}}$
-type asymmetry is actually encouraged by allowing the foil to oscillate. The behaviour is somewhat different for the foil with smallest aspect ratio
 $AR=0.1$
, with the transition to asymmetry being particularly encouraged at high values of
$AR=0.1$
, with the transition to asymmetry being particularly encouraged at high values of
 ${\it\beta}$
or equivalently small values of
${\it\beta}$
or equivalently small values of
 $KC$
. This is the part of the transition boundary where the new primary
$KC$
. This is the part of the transition boundary where the new primary
 $\text{QP}_{\text{L}}$
-type flow occurs for purely oscillating foils, suggesting that allowing the foil to move horizontally modifies the properties of this type of asymmetry non-trivially.
$\text{QP}_{\text{L}}$
-type flow occurs for purely oscillating foils, suggesting that allowing the foil to move horizontally modifies the properties of this type of asymmetry non-trivially.
4.1. Suppression of synchronous asymmetry for flying oscillations
As shown in figure 20(a), for flow round a circular cylinder with
 $KC=6.91,{\it\beta}=16$
, synchronous S-type asymmetry develops for pure oscillation, while symmetry actually continues to persist at the same point in parameter space for flying oscillation. The vorticity contours for the pure oscillation, also shown in figure 3(a), are replotted close to the cylinder in figure 21(a) for comparison with the vorticity contours from the flying oscillation shown in figure 21(b), at the same instant in the flow evolution when the oscillating cylinder is at its greatest (negative) displacement.
$KC=6.91,{\it\beta}=16$
, synchronous S-type asymmetry develops for pure oscillation, while symmetry actually continues to persist at the same point in parameter space for flying oscillation. The vorticity contours for the pure oscillation, also shown in figure 3(a), are replotted close to the cylinder in figure 21(a) for comparison with the vorticity contours from the flying oscillation shown in figure 21(b), at the same instant in the flow evolution when the oscillating cylinder is at its greatest (negative) displacement.
There is a marked difference between the two flow structures, which is also consistent with the difference of the horizontal force on the oscillating cylinder, as shown in figure 22 where the force is three orders of magnitude larger for the pure oscillation flow than for the flying oscillation flow. Spectral analysis of these time histories, as shown in figure 23, shows a very strong synchronous frequency (at twice the primary frequency) for the flow with pure oscillation, indicative of the strong asymmetry visible in the flow. There is an appreciably weaker synchronous frequency also apparent in the power spectrum for the flying oscillation case shown in figure 21(b), and there is some very weak asymmetry apparent in the vorticity field shown in figure 21(b). Therefore, it seems appropriate to state that flying oscillations suppress rather than eliminate synchronous asymmetry near the transition boundary on the S-type asymmetry side of the freezing point.

Figure 22. Time dependence of the horizontal force on a circular cylinder with parameters
 $AR=1.0$
,
$AR=1.0$
,
 $KC=6.91$
and
$KC=6.91$
and
 ${\it\beta}=16$
, subject to (a) a pure oscillation and (b) a flying oscillation. Time is scaled with the period of the primary oscillation
${\it\beta}=16$
, subject to (a) a pure oscillation and (b) a flying oscillation. Time is scaled with the period of the primary oscillation
 $T_{0}=1/{\it\beta}$
. Note the relative size of the vertical axes.
$T_{0}=1/{\it\beta}$
. Note the relative size of the vertical axes.

Figure 23. Horizontal force power spectra for the flow with a circular cylinder with parameters
 $AR=1.0$
,
$AR=1.0$
,
 $KC=6.91$
and
$KC=6.91$
and
 ${\it\beta}=16$
subject to (a) a pure oscillation and (b) a flying oscillation, corresponding to figure 22(a,b) respectively. Frequencies are scaled with the non-dimensional frequency of the primary oscillation
${\it\beta}=16$
subject to (a) a pure oscillation and (b) a flying oscillation, corresponding to figure 22(a,b) respectively. Frequencies are scaled with the non-dimensional frequency of the primary oscillation
 $f_{0}={\it\beta}$
.
$f_{0}={\it\beta}$
.
To gain physical insight into how this suppression occurs, we consider another pair of flows close to the S-type asymmetry transition boundary, where the purely oscillating foil is associated with a strong synchronous asymmetric flow, while the flying oscillating foil is associated with a (very close to) symmetric flow. As shown in figure 20(b), particular flow parameters with the required properties are those for an elliptical foil with
 $AR=0.5$
,
$AR=0.5$
,
 $KC=8.16$
and
$KC=8.16$
and
 ${\it\beta}=5$
, and the purely oscillating flow has been discussed in detail in § 3.2, and aspects of this flow are shown in figures 6(d), 7(b), 8(b) and 9(b). Here, we impose a pure oscillation so that the foil has a fixed horizontal location until it converges to an essentially steady state. We assess this convergence by considering the time history of the horizontal force on the foil, as shown in figure 24. The envelope of the horizontal force grows, and then saturates, after approximately 70 primary oscillation periods. At this stage, the synchronous asymmetry in the flow is well established, and there is a clear bias towards a negative horizontal force on the elliptical foil. We then release the fixed horizontal location of the foil, allowing it to ‘fly’ after 80 primary oscillation periods. The effect on the horizontal force is dramatic, and instantaneous, as it drops very rapidly, and essentially exponentially, and after a slight overshoot relaxes back to extremely small values, of the order of the initial numerical fluctuations.
${\it\beta}=5$
, and the purely oscillating flow has been discussed in detail in § 3.2, and aspects of this flow are shown in figures 6(d), 7(b), 8(b) and 9(b). Here, we impose a pure oscillation so that the foil has a fixed horizontal location until it converges to an essentially steady state. We assess this convergence by considering the time history of the horizontal force on the foil, as shown in figure 24. The envelope of the horizontal force grows, and then saturates, after approximately 70 primary oscillation periods. At this stage, the synchronous asymmetry in the flow is well established, and there is a clear bias towards a negative horizontal force on the elliptical foil. We then release the fixed horizontal location of the foil, allowing it to ‘fly’ after 80 primary oscillation periods. The effect on the horizontal force is dramatic, and instantaneous, as it drops very rapidly, and essentially exponentially, and after a slight overshoot relaxes back to extremely small values, of the order of the initial numerical fluctuations.

Figure 24. Time dependence of the horizontal force on an elliptical foil with parameters
 $AR=0.5$
,
$AR=0.5$
,
 $KC=8.16$
and
$KC=8.16$
and
 ${\it\beta}=5$
, for an initially ‘pure’ oscillation for
${\it\beta}=5$
, for an initially ‘pure’ oscillation for
 $0\leqslant t/T_{0}\leqslant 80$
which is then released to execute flying oscillations for
$0\leqslant t/T_{0}\leqslant 80$
which is then released to execute flying oscillations for
 $t>80T_{0}$
, where
$t>80T_{0}$
, where
 $T_{0}=1/{\it\beta}$
is the period of the primary oscillation.
$T_{0}=1/{\it\beta}$
is the period of the primary oscillation.

Figure 25. (a–k) Twenty-two evenly spaced contours of vorticity between
 $-60$
(blue) and
$-60$
(blue) and
 $+60$
(red) at evenly spaced time intervals during the first primary period after the foil is released to ‘fly’ for the flow around an elliptical foil with parameters
$+60$
(red) at evenly spaced time intervals during the first primary period after the foil is released to ‘fly’ for the flow around an elliptical foil with parameters
 $AR=0.5$
,
$AR=0.5$
,
 $KC=8.16$
and
$KC=8.16$
and
 ${\it\beta}=5$
; (l) 22 evenly spaced contours of vorticity between
${\it\beta}=5$
; (l) 22 evenly spaced contours of vorticity between
 $-60$
(blue) and
$-60$
(blue) and
 $+60$
(red) for the flow five periods after the release of the foil to move horizontally.
$+60$
(red) for the flow five periods after the release of the foil to move horizontally.
The mechanism by which this rapid return to (close to) symmetric flow occurs can be understood by considering the vorticity contours shown in figure 25(a–k), which show the vorticity at 11 evenly spaced time intervals directly after the foil is released in panels. The left–right asymmetry associated with this flow is clearly apparent. On both the upward and downward strokes the induced vortex to the left of the foil dominates the vortex to the right, in that it is more elongated, slightly stronger and angled towards the right, leading to the strong (and tilted to the right) asymmetry observed in the Lagrangian particle distributions shown in figure 7(b). Significantly, as the slightly stronger vortex is shed from the left side of the foil, it imposes a slightly weaker force on the foil than the vortex to the right, since it induces a slightly lower pressure on the left. Since the foil is now free to move, the foil moves to the left. This is in response to the negative (on average) horizontal forces, shown in figure 24. This leftward motion has two key components. First, it tends to weaken the subsequent vortex generation to the left, and strengthen the vortex generation to the right, thus exerting a stabilizing influence on the asymmetry growth mechanism. Second, and very importantly, this stabilizing influence is in turn synchronous with the primary oscillation of the foil and with the asymmetry, and so is precisely tuned to symmetrise the flow, as is apparent in figure 25(l), where the vorticity contours are plotted 5 periods after the foil is released. This leftward motion of the foil actually ‘overshoots’ before the symmetry of the flow has been completely restored, leading to the weak net positive horizontal force on the foil, which causes the foil ultimately to move (very slowly) rightwards with a velocity approximately 0.1 % of the maximum vertical velocity associated with the primary oscillation. This slight drift appears to control the flow very close to symmetry for long periods.
4.2. Encouragement of quasi-periodic asymmetry for flying oscillations
For the two larger aspect ratios which we have considered, the situation is qualitatively different for flows with parameters to the left of the freezing point, where the asymmetry, when it onsets, is of
 $\text{QP}_{\text{H}}$
-type. In this region of parameter space, by consideration of figure 20, allowing the oscillating foil to move horizontally, actually encourages the onset of quasi-periodic asymmetry. To investigate the physical mechanisms underlying this phenomenon, we consider the flow around an elliptical foil with
$\text{QP}_{\text{H}}$
-type. In this region of parameter space, by consideration of figure 20, allowing the oscillating foil to move horizontally, actually encourages the onset of quasi-periodic asymmetry. To investigate the physical mechanisms underlying this phenomenon, we consider the flow around an elliptical foil with
 $AR=0.5$
, with
$AR=0.5$
, with
 ${\it\beta}=40$
. As is shown in figure 20(b), when
${\it\beta}=40$
. As is shown in figure 20(b), when
 $KC=3.2$
, if the elliptical foil is free to move horizontally, we observe high-aspect ratio quasi-periodic
$KC=3.2$
, if the elliptical foil is free to move horizontally, we observe high-aspect ratio quasi-periodic
 $\text{QP}_{\text{H}}$
-type asymmetry. However, if we fix the horizontal location of the foil, the flow rapidly returns to symmetry, and
$\text{QP}_{\text{H}}$
-type asymmetry. However, if we fix the horizontal location of the foil, the flow rapidly returns to symmetry, and
 $\text{QP}_{\text{H}}$
-type asymmetry only arises when
$\text{QP}_{\text{H}}$
-type asymmetry only arises when
 $KC$
is increased to 3.32.
$KC$
is increased to 3.32.

Figure 26. Twenty-two evenly spaced contours of vorticity between
 $-60$
(blue) and
$-60$
(blue) and
 $+60$
(red) for flow around an elliptical foil with aspect ratio
$+60$
(red) for flow around an elliptical foil with aspect ratio
 $AR=0.5$
when the foil is at its minimum vertical location for flows with parameters
$AR=0.5$
when the foil is at its minimum vertical location for flows with parameters
 $KC=3.2,{\it\beta}=40$
subject to (a) a pure oscillation and (b) a flying oscillation.
$KC=3.2,{\it\beta}=40$
subject to (a) a pure oscillation and (b) a flying oscillation.
In figure 26(a), we plot vorticity contours around the purely oscillating foil with aspect ratio
 $AR=0.5$
, when it is at its minimum vertical location, for a flow with
$AR=0.5$
, when it is at its minimum vertical location, for a flow with
 ${\it\beta}=40$
and
${\it\beta}=40$
and
 $KC=3.2$
. The contours are close to symmetric, unlike the equivalent contours for the flying oscillation shown in figure 26(b), which exhibit a marked
$KC=3.2$
. The contours are close to symmetric, unlike the equivalent contours for the flying oscillation shown in figure 26(b), which exhibit a marked
 $\text{QP}_{\text{H}}$
-type asymmetry. The time histories of the corresponding horizontal forces for these pure and flying oscillations are shown in figure 27(a,b), respectively. Unsurprisingly, the forces associated with the pure oscillation remain at very low values throughout the whole time history, although there is some complicated spectral structure manifest as beating of the very small-amplitude signal, while for the flying oscillation, the horizontal force increases rapidly after an initial transient to large quasi-periodic values, implying a significant symmetry breaking process eventually arising with no specific forcing (apart from numerical round-off error).
$\text{QP}_{\text{H}}$
-type asymmetry. The time histories of the corresponding horizontal forces for these pure and flying oscillations are shown in figure 27(a,b), respectively. Unsurprisingly, the forces associated with the pure oscillation remain at very low values throughout the whole time history, although there is some complicated spectral structure manifest as beating of the very small-amplitude signal, while for the flying oscillation, the horizontal force increases rapidly after an initial transient to large quasi-periodic values, implying a significant symmetry breaking process eventually arising with no specific forcing (apart from numerical round-off error).

Figure 27. Time dependence of the horizontal force on an elliptical foil with aspect ratio
 $AR=0.5$
in a flow with parameters
$AR=0.5$
in a flow with parameters
 $KC=3.2,{\it\beta}=40$
subject to (a) a pure oscillation and (b) a flying oscillation. Time is scaled with the primary oscillation period
$KC=3.2,{\it\beta}=40$
subject to (a) a pure oscillation and (b) a flying oscillation. Time is scaled with the primary oscillation period
 $T_{0}=1/f_{0}=1/{\it\beta}$
. Note the relative size of the vertical axes.
$T_{0}=1/f_{0}=1/{\it\beta}$
. Note the relative size of the vertical axes.

Figure 28. Horizontal force power spectra for the flow around an elliptical foil with aspect ratio
 $AR=0.5$
with parameters
$AR=0.5$
with parameters
 $KC=3.2$
and
$KC=3.2$
and
 ${\it\beta}=40$
subject to: (a) a pure oscillation; and (b) a flying oscillation, corresponding to figure 27(a,b) respectively. Frequencies are scaled with the non-dimensional frequency of the primary oscillation
${\it\beta}=40$
subject to: (a) a pure oscillation; and (b) a flying oscillation, corresponding to figure 27(a,b) respectively. Frequencies are scaled with the non-dimensional frequency of the primary oscillation
 $f_{0}={\it\beta}$
.
$f_{0}={\it\beta}$
.
Considering the spectral properties of these horizontal force time histories, as plotted in figure 28, it is clear the ‘symmetric’ flow does indeed contain frequencies either side of the primary oscillation frequency, leading to a further, much smaller, beating frequency. Nevertheless, the primary frequency is still strongly dominant, and it is appropriate to consider the flow to be (at least close to) symmetric. On the other hand, there is clear evidence of dominant frequency splitting either side of (twice) the primary oscillation frequency for the flying oscillation shown in figure 28(b), with a strong long secondary period, as is also evident in the time history of the horizontal force plotted in figure 27(b). This is entirely consistent with the
 $\text{QP}_{\text{H}}$
-type asymmetry for purely oscillating foils with sufficiently high aspect ratio as discussed above.
$\text{QP}_{\text{H}}$
-type asymmetry for purely oscillating foils with sufficiently high aspect ratio as discussed above.
The physical interpretation of this encouragement of the onset of
 $\text{QP}_{\text{H}}$
-type asymmetry for flying foils has several aspects. At high
$\text{QP}_{\text{H}}$
-type asymmetry for flying foils has several aspects. At high
 ${\it\beta}$
, the period of the primary oscillation is short, and so it is possible for complex interactions between the vortices associated with different primary oscillations to occur. If the foil is free to move, these interactions can lead to the foil being displaced from its equilibrium position(J. Zhang, 2012, private communication). Furthermore, such a displacement can encourage the development of slight perturbations to the frequencies with which the vortices are shed, leading to the possibility of the development of a long secondary period through beating between two close, but different, frequencies of the induced flow, exactly as is observed for the flying oscillation.
${\it\beta}$
, the period of the primary oscillation is short, and so it is possible for complex interactions between the vortices associated with different primary oscillations to occur. If the foil is free to move, these interactions can lead to the foil being displaced from its equilibrium position(J. Zhang, 2012, private communication). Furthermore, such a displacement can encourage the development of slight perturbations to the frequencies with which the vortices are shed, leading to the possibility of the development of a long secondary period through beating between two close, but different, frequencies of the induced flow, exactly as is observed for the flying oscillation.
Therefore, distinct from the low
 ${\it\beta}$
case discussed above, the horizontal force perturbations on the oscillating foil are not synchronous with the primary oscillation, and so actually feed back positively on perturbations in the foil’s horizontal location, leading to substantial quasi-periodic movement of the flying oscillating foil. In figure 29 we plot the trajectory of the flying foil, showing just such a non-trivial quasi-periodic horizontal motion. Fundamentally, due to the high frequency of oscillation when
${\it\beta}$
case discussed above, the horizontal force perturbations on the oscillating foil are not synchronous with the primary oscillation, and so actually feed back positively on perturbations in the foil’s horizontal location, leading to substantial quasi-periodic movement of the flying oscillating foil. In figure 29 we plot the trajectory of the flying foil, showing just such a non-trivial quasi-periodic horizontal motion. Fundamentally, due to the high frequency of oscillation when
 ${\it\beta}$
is large, and thus the potential for multiple, close frequencies due to vortex–vortex interaction to exist, freedom to move horizontally actually encourages loss of symmetry, making the symmetric flow around intermediate aspect ratio foils less stable in a very real sense. Conversely, at lower frequencies of oscillation, (i.e. smaller
${\it\beta}$
is large, and thus the potential for multiple, close frequencies due to vortex–vortex interaction to exist, freedom to move horizontally actually encourages loss of symmetry, making the symmetric flow around intermediate aspect ratio foils less stable in a very real sense. Conversely, at lower frequencies of oscillation, (i.e. smaller
 ${\it\beta}$
to the right of the freezing point) the synchronization of oscillation, shed vortices and horizontal forces cause freedom of the foil to move horizontally actually to stabilize strongly synchronous asymmetry, through a locked mechanism of negative feedback.
${\it\beta}$
to the right of the freezing point) the synchronization of oscillation, shed vortices and horizontal forces cause freedom of the foil to move horizontally actually to stabilize strongly synchronous asymmetry, through a locked mechanism of negative feedback.

Figure 29. (a) Time dependence of the
 $x$
-coordinate of the centre of mass of the elliptical foil with aspect ratio
$x$
-coordinate of the centre of mass of the elliptical foil with aspect ratio
 $AR=0.5$
undergoing a flying oscillation with parameters
$AR=0.5$
undergoing a flying oscillation with parameters
 $KC=3.2$
and
$KC=3.2$
and
 ${\it\beta}=40$
as shown in figure 27(b). (b) Horizontal trajectory of the mass centre at
${\it\beta}=40$
as shown in figure 27(b). (b) Horizontal trajectory of the mass centre at
 $t/T_{0}=80{-}100$
. Some specific time instants are marked with various symbols on the two panels.
$t/T_{0}=80{-}100$
. Some specific time instants are marked with various symbols on the two panels.
4.3. Suppression of primary
$\text{QP}_{\text{L}}$
-type asymmetry for flying oscillations

As is apparent in figure 20(c,d), allowing a foil of aspect ratio
 $AR=0.1$
to move horizontally markedly changes the transition boundary in the region of parameter space where the new primary
$AR=0.1$
to move horizontally markedly changes the transition boundary in the region of parameter space where the new primary
 $\text{QP}_{\text{L}}$
-type asymmetry, as discussed in § 3.3, occurs. To investigate how this type of asymmetry is modified by allowing the foil to fly, we consider the flow with parameters
$\text{QP}_{\text{L}}$
-type asymmetry, as discussed in § 3.3, occurs. To investigate how this type of asymmetry is modified by allowing the foil to fly, we consider the flow with parameters
 $AR=0.1$
,
$AR=0.1$
,
 $KC=1.26$
and
$KC=1.26$
and
 ${\it\beta}=60$
. As is shown in figure 20(c), the flow with these parameters is symmetric when the foil is purely oscillating, but is asymmetric when the foil is allowed to fly. In figure 30, we plot vorticity contours for these two flows when the foil is at its minimum vertical location. The flying oscillation flow shown in figure 30(b) is undoubtedly asymmetric, but by comparison with figure 11, it bears much more qualitative resemblance to the S-type asymmetry flows shown in figure 11(c,d) than to the primary
${\it\beta}=60$
. As is shown in figure 20(c), the flow with these parameters is symmetric when the foil is purely oscillating, but is asymmetric when the foil is allowed to fly. In figure 30, we plot vorticity contours for these two flows when the foil is at its minimum vertical location. The flying oscillation flow shown in figure 30(b) is undoubtedly asymmetric, but by comparison with figure 11, it bears much more qualitative resemblance to the S-type asymmetry flows shown in figure 11(c,d) than to the primary
 $\text{QP}_{\text{L}}$
-type asymmetry flows shown in figure 11(a,b).
$\text{QP}_{\text{L}}$
-type asymmetry flows shown in figure 11(a,b).

Figure 30. Twenty-two evenly spaced contours of vorticity between
 $-500$
(blue) and
$-500$
(blue) and
 $+500$
(red) for flow around an elliptical foil with aspect ratio
$+500$
(red) for flow around an elliptical foil with aspect ratio
 $AR=0.1$
when the foil is at its minimum vertical location for flows with parameters
$AR=0.1$
when the foil is at its minimum vertical location for flows with parameters
 $KC=1.26,{\it\beta}=60$
subject to (a) a pure oscillation and (b) a flying oscillation.
$KC=1.26,{\it\beta}=60$
subject to (a) a pure oscillation and (b) a flying oscillation.

Figure 31. Time dependence of the horizontal force on an oscillating elliptical foil with parameters
 $AR=0.1$
,
$AR=0.1$
,
 $KC=1.26$
and
$KC=1.26$
and
 ${\it\beta}=60$
for: (a) a pure oscillation; and (b) a flying oscillation. Time is scaled with the period of the primary oscillation
${\it\beta}=60$
for: (a) a pure oscillation; and (b) a flying oscillation. Time is scaled with the period of the primary oscillation
 $T_{0}=1/{\it\beta}$
. Note the relative size of the vertical axes.
$T_{0}=1/{\it\beta}$
. Note the relative size of the vertical axes.
This qualitative resemblance can be made more quantitative by considering the time dependence of the horizontal force on the foil, as shown in figure 31. The horizontal force on the foil with asymmetric flow exhibits an initial transient, which overshoots somewhat before settling back to its final, still significant quasi-steady state, as shown in figure 31. Although the force undoubtedly oscillates, there is no evidence of ‘beating’ in its amplitude. The power spectrum of the horizontal force time history, as shown in figure 32(b), is completely dominated by twice the frequency of the primary oscillation frequency
 $2f_{0}=2{\it\beta}$
.
$2f_{0}=2{\it\beta}$
.

Figure 32. Horizontal force power spectra for the flow with a purely oscillating elliptical foil with parameters
 $AR=0.1$
,
$AR=0.1$
,
 $KC=1.26$
and
$KC=1.26$
and
 ${\it\beta}=60$
for: (a) a pure oscillation; and (b) a flying oscillation corresponding to figure 31(a,b) respectively. Frequencies are scaled with the non-dimensional frequency of the primary oscillation
${\it\beta}=60$
for: (a) a pure oscillation; and (b) a flying oscillation corresponding to figure 31(a,b) respectively. Frequencies are scaled with the non-dimensional frequency of the primary oscillation
 $f_{0}={\it\beta}$
.
$f_{0}={\it\beta}$
.
Therefore, all the evidence points towards the primary
 $\text{QP}_{\text{L}}$
-type asymmetry of the purely oscillating low aspect ratio foil being suppressed when the foil is allowed to move. Indeed, the transient in the horizontal force in this flow is associated with the foil accelerating to a constant speed of horizontal locomotion. It appears for this aspect ratio that the onset of asymmetry for flying oscillations inevitably leads to locomotion. Forcing the foil to remain at a fixed location leads to the primary
$\text{QP}_{\text{L}}$
-type asymmetry of the purely oscillating low aspect ratio foil being suppressed when the foil is allowed to move. Indeed, the transient in the horizontal force in this flow is associated with the foil accelerating to a constant speed of horizontal locomotion. It appears for this aspect ratio that the onset of asymmetry for flying oscillations inevitably leads to locomotion. Forcing the foil to remain at a fixed location leads to the primary
 $\text{QP}_{\text{L}}$
-type of asymmetry for high values of
$\text{QP}_{\text{L}}$
-type of asymmetry for high values of
 ${\it\beta}$
, but once the foil is free to move, the growth mechanism for this type of asymmetry is completely removed.
${\it\beta}$
, but once the foil is free to move, the growth mechanism for this type of asymmetry is completely removed.
On the other hand, unsurprisingly for the essentially symmetric purely oscillating foil, as shown in figure 31(a), the horizontal force is very small in magnitude, and is clearly highly periodic. That periodicity corresponds closely to the primary frequency of the oscillating foil, as shown by the power spectrum plotted in figure 32(a). We have considered flows associated with other parameter combinations along the transition boundary for flying oscillations of foils with
 $AR=0.1$
, and, once asymmetry onsets, the asymmetry is always of S-type. We find that the foil always flies at an eventually close to constant speed and we have been unable to identify a parameter combination which leads to primary
$AR=0.1$
, and, once asymmetry onsets, the asymmetry is always of S-type. We find that the foil always flies at an eventually close to constant speed and we have been unable to identify a parameter combination which leads to primary
 $\text{QP}_{\text{L}}$
-type asymmetry for flying oscillations.
$\text{QP}_{\text{L}}$
-type asymmetry for flying oscillations.
5. Conclusions
In this paper, we have numerically studied both ‘pure’ (i.e. fixed horizontally) and ‘flying’ (i.e. free to move horizontally) oscillations for elliptical foils with aspect ratios of
 $AR=1.0$
,
$AR=1.0$
,
 $AR=0.5$
and
$AR=0.5$
and
 $AR=0.1$
for a range of non-dimensional frequencies and amplitudes of oscillation, searching through
$AR=0.1$
for a range of non-dimensional frequencies and amplitudes of oscillation, searching through
 $KC$
–
$KC$
–
 ${\it\beta}$
space, as defined in (2.1). We have focussed on determining the symmetry-to-asymmetry transition boundaries in
${\it\beta}$
space, as defined in (2.1). We have focussed on determining the symmetry-to-asymmetry transition boundaries in
 $KC$
–
$KC$
–
 ${\it\beta}$
space for both pure and flying oscillations, as well as the (two-dimensional) flow behaviours immediately after symmetry breaking.
${\it\beta}$
space for both pure and flying oscillations, as well as the (two-dimensional) flow behaviours immediately after symmetry breaking.
For pure oscillations, our consideration of elliptical foils with aspect ratio
 $AR<1$
has led to three main observations. First, the transition boundary shifts to smaller
$AR<1$
has led to three main observations. First, the transition boundary shifts to smaller
 $KC$
for given
$KC$
for given
 ${\it\beta}$
as
${\it\beta}$
as
 $AR$
is reduced, indicating that symmetry breaking is encouraged for elliptical foils, while the previously identified two types of asymmetry, namely quasi-periodic (‘QP-type’) asymmetry at high
$AR$
is reduced, indicating that symmetry breaking is encouraged for elliptical foils, while the previously identified two types of asymmetry, namely quasi-periodic (‘QP-type’) asymmetry at high
 ${\it\beta}$
, small
${\it\beta}$
, small
 $KC$
, and synchronous (‘S-type’) asymmetry at low
$KC$
, and synchronous (‘S-type’) asymmetry at low
 ${\it\beta}$
, high
${\it\beta}$
, high
 $KC$
continue to appear either side of a ‘freezing point’ on the transition boundary. Second, for the smallest aspect ratio we have considered, the transition boundary effectively occurs at a fixed value of the ‘amplitude’ Stokes number
$KC$
continue to appear either side of a ‘freezing point’ on the transition boundary. Second, for the smallest aspect ratio we have considered, the transition boundary effectively occurs at a fixed value of the ‘amplitude’ Stokes number
 ${\it\beta}_{A}=4{\rm\pi}^{2}fA^{2}/{\it\nu}\simeq 3$
, independently of the major axis
${\it\beta}_{A}=4{\rm\pi}^{2}fA^{2}/{\it\nu}\simeq 3$
, independently of the major axis
 $c$
of the foil for all values of
$c$
of the foil for all values of
 $KC$
. Third, we find that the low aspect ratio foil exhibits a qualitatively different form of quasi-periodic asymmetry, (which we refer to as ‘primary
$KC$
. Third, we find that the low aspect ratio foil exhibits a qualitatively different form of quasi-periodic asymmetry, (which we refer to as ‘primary
 $\text{QP}_{\text{L}}$
-type’) from the other foils, and in particular, from the previously considered cylinder with
$\text{QP}_{\text{L}}$
-type’) from the other foils, and in particular, from the previously considered cylinder with
 $AR=1.0$
. Primary
$AR=1.0$
. Primary
 $\text{QP}_{\text{L}}$
-type asymmetry is characterised by the flow in the vicinity of the two ends of the foil effectively evolving independently, and the horizontal force time history being dominated by two close frequencies either side of the primary frequency of oscillation
$\text{QP}_{\text{L}}$
-type asymmetry is characterised by the flow in the vicinity of the two ends of the foil effectively evolving independently, and the horizontal force time history being dominated by two close frequencies either side of the primary frequency of oscillation
 $f_{0}$
, as opposed to either side of twice the primary frequency, as occurs for the quasi-periodic (which we refer to as
$f_{0}$
, as opposed to either side of twice the primary frequency, as occurs for the quasi-periodic (which we refer to as
 $\text{QP}_{\text{H}}$
-type asymmetry) flow around the cylinder and the elliptical foil with higher aspect ratio. We demonstrate, following Elston et al. (Reference Elston, Sheridan and Blackburn2004, Reference Elston, Blackburn and Sheridan2006), that the
$\text{QP}_{\text{H}}$
-type asymmetry) flow around the cylinder and the elliptical foil with higher aspect ratio. We demonstrate, following Elston et al. (Reference Elston, Sheridan and Blackburn2004, Reference Elston, Blackburn and Sheridan2006), that the
 $\text{QP}_{\text{H}}$
-type asymmetry is well predicted by a Floquet stability analysis, but interestingly the
$\text{QP}_{\text{H}}$
-type asymmetry is well predicted by a Floquet stability analysis, but interestingly the
 $\text{QP}_{\text{L}}$
-type asymmetry is not.
$\text{QP}_{\text{L}}$
-type asymmetry is not.
When the foils are allowed to ‘fly’, we have found that the effect on the transition boundary is qualitatively different for the regions susceptible to synchronous asymmetry from the regions susceptible to quasi-periodic asymmetry. S-type asymmetry is actually stabilized by freedom to move horizontally, due to the fact that horizontal motions at the same frequency preferentially damp the stronger vortex shed from the oscillating foil. Conversely, when the spectral content of the horizontal forces on the foil is richer at higher values of
 ${\it\beta}$
, effectively due to interactions between the vortices shed during successive oscillation cycles, freedom to move actually encourages the onset of
${\it\beta}$
, effectively due to interactions between the vortices shed during successive oscillation cycles, freedom to move actually encourages the onset of
 $\text{QP}_{\text{H}}$
-type asymmetry around the foil. Multiple frequencies effectively buffet the foil at sufficiently high aspect ratio, leading to a quasi-periodic trajectory of the foil when it can ‘fly’ for parameters where a fixed foil maintains a very close to symmetric flow.
$\text{QP}_{\text{H}}$
-type asymmetry around the foil. Multiple frequencies effectively buffet the foil at sufficiently high aspect ratio, leading to a quasi-periodic trajectory of the foil when it can ‘fly’ for parameters where a fixed foil maintains a very close to symmetric flow.
However, for the smallest aspect ratio (
 $AR=0.1$
) foils which are allowed to move horizontally, the primary
$AR=0.1$
) foils which are allowed to move horizontally, the primary
 $\text{QP}_{\text{L}}$
-type asymmetry is suppressed. For sufficiently thin foils, the tendency actually to fly at a close to constant speed appears to be so attractive once a symmetry-breaking bifurcation occurs that it is not possible to maintain the subtle balance required to lead to quasi-periodicity and erratic motions in the flow. It is important to appreciate that we have focussed on parameter choices which are very close to the transition boundary, where our two-dimensional analysis is most likely to be relevant. It would undoubtedly be of interest to connect our results with investigations of symmetry breaking leading to propulsive vortex streets driving unidirectional swimming (see e.g. Godoy-Diana et al.
Reference Godoy-Diana, Marais, Aider and Wesfried2009).
$\text{QP}_{\text{L}}$
-type asymmetry is suppressed. For sufficiently thin foils, the tendency actually to fly at a close to constant speed appears to be so attractive once a symmetry-breaking bifurcation occurs that it is not possible to maintain the subtle balance required to lead to quasi-periodicity and erratic motions in the flow. It is important to appreciate that we have focussed on parameter choices which are very close to the transition boundary, where our two-dimensional analysis is most likely to be relevant. It would undoubtedly be of interest to connect our results with investigations of symmetry breaking leading to propulsive vortex streets driving unidirectional swimming (see e.g. Godoy-Diana et al.
Reference Godoy-Diana, Marais, Aider and Wesfried2009).
However, in this paper, for clarity we have considered only a single density ratio, and we have deliberately avoided parameter values where strong and unidirectional flying is expected, where inherently three-dimensional motions are likely to be significant or indeed where the flapping foil itself is three-dimensional. It is undoubtedly of natural interest to investigate the influence of density ratio on our results, and also whether our two-dimensional results concerning the suppression or encouragement of different types of asymmetry for freely flying foils carries over into three-dimensional motions, and we intend to report on the results of just such investigations in due course.
Acknowledgements
The authors wish to thank Dr X. Mao of Durham University for very useful discussions on Floquet analysis. The thoughtful and constructive comments of three anonymous referees have markedly improved this paper, and their input is much appreciated. J.D. has been supported by the National Natural Science Foundation of China (grant no: 11272283), Zhejiang Provincial Natural Science Foundation of China (grant no: LY12A02006) and Marine Multidiscipline Foundation of Zhejiang University (grant no: 2012HY023B) to conduct this research. J.D. gratefully acknowledges the hospitality of the Department of Applied Mathematics & Theoretical Physics, University of Cambridge, and the award of a by-fellowship by Churchill College, University of Cambridge.


