


1 Introduction
Natural thermal convection, which occurs in a fluid layer due to temperature differences, is omnipresent in nature and plays an important role in many engineering applications. A paradigm system to study this type of fluid motion is Rayleigh–Bénard convection (RBC), which takes place in a fluid layer confined between two horizontal plates, a lower heated plate and an upper cooled one (see, e.g. Bodenschatz, Pesch & Ahlers Reference Bodenschatz, Pesch and Ahlers2000; Ahlers, Grossmann & Lohse Reference Ahlers, Grossmann and Lohse2009; Lohse & Xia Reference Lohse and Xia2010; Chillà & Schumacher Reference Chillà and Schumacher2012).
Within the Oberbeck–Boussinesq (OB) approximation (Oberbeck Reference Oberbeck1879; Boussinesq Reference Boussinesq1903; Spiegel & Veronis Reference Spiegel and Veronis1960), all fluid properties are assumed to be pressure- and temperature independent, apart from the density in the buoyancy term, which is assumed to be a linear function of the temperature. Under the OB approximation, the RBC system is governed by the following dimensionless control parameters: the Rayleigh number
 $\mathit{Ra}$
, the Prandtl number
$\mathit{Ra}$
, the Prandtl number
 $\mathit{Pr}$
and (for a cylindrical container) the diameter-to-height aspect ratio
$\mathit{Pr}$
and (for a cylindrical container) the diameter-to-height aspect ratio
 $\unicode[STIX]{x1D6E4}$
:
$\unicode[STIX]{x1D6E4}$
:
 $$\begin{eqnarray}\mathit{Ra}\equiv \frac{g\unicode[STIX]{x1D6FC}\unicode[STIX]{x0394}H^{3}}{\unicode[STIX]{x1D708}\unicode[STIX]{x1D705}},\quad \mathit{Pr}\equiv \frac{\unicode[STIX]{x1D708}}{\unicode[STIX]{x1D705}},\quad \unicode[STIX]{x1D6E4}\equiv \frac{D}{H}.\end{eqnarray}$$
Here,
 $\unicode[STIX]{x0394}\equiv T_{bot}-T_{top}$
is the temperature difference between the hot bottom and cold top plates,
$\unicode[STIX]{x0394}\equiv T_{bot}-T_{top}$
is the temperature difference between the hot bottom and cold top plates,
 $H$
the height and
$H$
the height and
 $D$
the diameter of the RBC cell,
$D$
the diameter of the RBC cell,
 $g$
the gravitational acceleration,
$g$
the gravitational acceleration,
 $\unicode[STIX]{x1D708}$
the kinematic viscosity,
$\unicode[STIX]{x1D708}$
the kinematic viscosity,
 $\unicode[STIX]{x1D705}$
the thermal diffusivity and
$\unicode[STIX]{x1D705}$
the thermal diffusivity and
 $\unicode[STIX]{x1D6FC}$
the isobaric thermal expansion.
$\unicode[STIX]{x1D6FC}$
the isobaric thermal expansion.
In any real RBC experiment, however, the sample properties deviate from the OB approximation, since all material properties generally depend on the temperature and pressure. So-called non-Oberbeck–Boussinesq (NOB) effects become apparent, see Busse (Reference Busse1967), Gray & Giorgini (Reference Gray and Giorgini1976), Wu & Libchaber (Reference Wu and Libchaber1991), Zhang, Childress & Libchaber (Reference Zhang, Childress and Libchaber1997), Niemela et al. (Reference Niemela, Skrbek, Sreenivasan and Donnely2000), Xia, Lam & Zhou (Reference Xia, Lam and Zhou2002), Roche et al. (Reference Roche, Castaing, Chabaud and Hebral2004), Ahlers et al. (Reference Ahlers, Brown, Araujo, Funfschilling, Grossmann and Lohse2006, Reference Ahlers, Araujo, Funfschilling, Grossmann and Lohse2007, Reference Ahlers, Calzavarini, Araujo, Funfschilling, Grossmann, Lohse and Sugiyama2008), Sugiyama et al. (Reference Sugiyama, Calzavarini, Grossmann and Lohse2007), Sugiyama et al. (Reference Sugiyama, Calzavarini, Grossmann and Lohse2009), Burnishev, Segre & Steinberg (Reference Burnishev, Segre and Steinberg2010), Horn, Shishkina & Wagner (Reference Horn, Shishkina and Wagner2013), Horn & Shishkina (Reference Horn and Shishkina2014). The NOB effects influence the global flow structure and, therefore, can affect the global heat transport in the RBC system. This heat transport is usually expressed by the dimensionless Nusselt number,
 $\mathit{Nu}=q/\hat{q}$
, that is, by the ratio of the total time averaged vertical heat flux
$\mathit{Nu}=q/\hat{q}$
, that is, by the ratio of the total time averaged vertical heat flux
 $q$
to the purely conductive heat flux
$q$
to the purely conductive heat flux
 $\hat{q}$
.
$\hat{q}$
.
While in many natural systems (e.g. in the atmosphere) large hydrostatic pressure differences cause variations of the fluid properties, the pressure variation across the fluid layer in laboratory RBC experiments is much smaller and the NOB effects are mainly caused by temperature variations. Even in the large-scale experiments in the ‘Uboot’ of Göttingen (Ahlers et al.
Reference Ahlers, He, Funfschilling and Bodenschatz2012b
; He et al.
Reference He, Funfschilling, Bodenschatz and Ahlers2012), where pressurized sulfur hexafluoride (
 $\text{SF}_{6}$
) is used in up to 2 m high RBC cells, the variations of the fluid properties with the temperature are at least 5 times larger than the variations of the fluid properties with the pressure. This is despite the large cell height and the fact that the density of
$\text{SF}_{6}$
) is used in up to 2 m high RBC cells, the variations of the fluid properties with the temperature are at least 5 times larger than the variations of the fluid properties with the pressure. This is despite the large cell height and the fact that the density of
 $\text{SF}_{6}$
is approximately 5 times larger than the density of air. Also in large
$\text{SF}_{6}$
is approximately 5 times larger than the density of air. Also in large
 $\mathit{Ra}$
-experiments with helium close to its critical point, the fluid property variations with the pressure are negligible compared to their strong variations with the temperature, see, e.g. Castaing et al. (Reference Castaing, Gunaratne, Heslot, Kadanoff, Libchaber, Thomae, Wu, Zaleski and Zanetti1989), Ashkenazi & Steinberg (Reference Ashkenazi and Steinberg1999), Niemela & Sreenivasan (Reference Niemela and Sreenivasan2003), Roche et al. (Reference Roche, Castaing, Chabaud and Hebral2004), Urban et al. (Reference Urban, Hanzelka, Musilova, Kralik, Mantia, Srnka and Skrbek2014). Therefore, in the following we will focus on the NOB effects caused exclusively by temperature variations and assume a constant hydrostatic pressure throughout the cell.
$\mathit{Ra}$
-experiments with helium close to its critical point, the fluid property variations with the pressure are negligible compared to their strong variations with the temperature, see, e.g. Castaing et al. (Reference Castaing, Gunaratne, Heslot, Kadanoff, Libchaber, Thomae, Wu, Zaleski and Zanetti1989), Ashkenazi & Steinberg (Reference Ashkenazi and Steinberg1999), Niemela & Sreenivasan (Reference Niemela and Sreenivasan2003), Roche et al. (Reference Roche, Castaing, Chabaud and Hebral2004), Urban et al. (Reference Urban, Hanzelka, Musilova, Kralik, Mantia, Srnka and Skrbek2014). Therefore, in the following we will focus on the NOB effects caused exclusively by temperature variations and assume a constant hydrostatic pressure throughout the cell.

Figure 1. Sketch of a typical (a) NOB Rayleigh–Bénard convection cell and (b) mean vertical temperature profiles for a gas under NOB conditions (thick line) and a perfect OB fluid (thin line), as functions of the distance
 $z$
from the heated bottom plate: the temperature at the bottom plate (
$z$
from the heated bottom plate: the temperature at the bottom plate (
 $T=T_{bot}$
for
$T=T_{bot}$
for
 $z=0$
), at the cross-over from the bottom BL to the bulk (
$z=0$
), at the cross-over from the bottom BL to the bulk (
 $T=T_{+}$
for
$T=T_{+}$
for
 $z=\unicode[STIX]{x1D6FF}_{+}$
), at mid-height of the cell (
$z=\unicode[STIX]{x1D6FF}_{+}$
), at mid-height of the cell (
 $T=T_{c}$
for
$T=T_{c}$
for
 $z=H/2$
), at the cross-over from the top BL to the bulk (
$z=H/2$
), at the cross-over from the top BL to the bulk (
 $T=T_{-}$
for
$T=T_{-}$
for
 $z=H-\unicode[STIX]{x1D6FF}_{-}$
) and at the cooled top plate (
$z=H-\unicode[STIX]{x1D6FF}_{-}$
) and at the cooled top plate (
 $T=T_{top}$
for
$T=T_{top}$
for
 $z=H$
). We have
$z=H$
). We have
 $T_{top}<T_{-}<T_{c}<T_{+}<T_{bot}$
and
$T_{top}<T_{-}<T_{c}<T_{+}<T_{bot}$
and
 $T_{m}\equiv (T_{bot}+T_{top})/2$
. Pink and blue stripes correspond to the bottom and top BLs, respectively.
$T_{m}\equiv (T_{bot}+T_{top})/2$
. Pink and blue stripes correspond to the bottom and top BLs, respectively.
Among the NOB effects, one of the most notable is a broken up–down symmetry of the convective flow and of the top and bottom boundary layers (BLs), as illustrated in figure 1. The broken symmetry results in a deviation of the centre temperature,
 $T_{c}$
, from the arithmetic mean,
$T_{c}$
, from the arithmetic mean,
 $T_{m}\equiv (T_{top}+T_{bot})/2$
, of the temperatures
$T_{m}\equiv (T_{top}+T_{bot})/2$
, of the temperatures
 $T_{top}$
and
$T_{top}$
and
 $T_{bot}$
at the top and bottom plates, respectively.
$T_{bot}$
at the top and bottom plates, respectively.
Under NOB conditions, various questions arise, such as: What is the right way to calculate the Nusselt number
 $\mathit{Nu}$
? How should
$\mathit{Nu}$
? How should
 $\mathit{Ra}$
be calculated? In particular, at which reference temperature should the fluid properties be evaluated? Is it possible to deduce from the heat flux measurements under slightly NOB conditions the heat flux that would be measured in the OB case and which scaling relation of
$\mathit{Ra}$
be calculated? In particular, at which reference temperature should the fluid properties be evaluated? Is it possible to deduce from the heat flux measurements under slightly NOB conditions the heat flux that would be measured in the OB case and which scaling relation of
 $\mathit{Nu}$
versus
$\mathit{Nu}$
versus
 $\mathit{Ra}$
would be measured under perfect OB conditions? These questions became especially pertinent as different experiments, conducted at similar
$\mathit{Ra}$
would be measured under perfect OB conditions? These questions became especially pertinent as different experiments, conducted at similar
 $\mathit{Ra}$
,
$\mathit{Ra}$
,
 $\mathit{Pr}$
and system geometries, have produced different scaling relations
$\mathit{Pr}$
and system geometries, have produced different scaling relations
 $\mathit{Nu}(\mathit{Ra})$
.
$\mathit{Nu}(\mathit{Ra})$
.
In previous work Shishkina, Weiss & Bodenschatz (Reference Shishkina, Weiss and Bodenschatz2016) addressed the issue of how to calculate correctly the Nusselt number in measurements under general NOB conditions. There, an algorithm to calculate the mean conductive heat flux
 $\hat{q}$
, which is needed for normalization of the measured total heat flux
$\hat{q}$
, which is needed for normalization of the measured total heat flux
 $q$
, was presented.
$q$
, was presented.
Here we show the sensitivity of the
 $\mathit{Nu}$
versus
$\mathit{Nu}$
versus
 $\mathit{Ra}$
relation to the reference temperatures at which the fluid properties are evaluated. For the case, when the fluid properties depend significantly on the temperature and any pressure dependence is unimportant, we propose a method to predict the centre temperature and show by example of the Göttingen measurements (Ahlers et al.
Reference Ahlers, He, Funfschilling and Bodenschatz2012b
; He et al.
Reference He, Funfschilling, Bodenschatz and Ahlers2012) that it leads to more accurate predictions than the models based on an extension of the Prandtl–Blasius approach to a NOB case (Ahlers et al.
Reference Ahlers, Brown, Araujo, Funfschilling, Grossmann and Lohse2006, Reference Ahlers, Araujo, Funfschilling, Grossmann and Lohse2007, Reference Ahlers, Calzavarini, Araujo, Funfschilling, Grossmann, Lohse and Sugiyama2008) or any of the three models by Wu & Libchaber (Reference Wu and Libchaber1991) or their modification (Urban et al.
Reference Urban, Hanzelka, Musilova, Kralik, Mantia, Srnka and Skrbek2014).
$\mathit{Ra}$
relation to the reference temperatures at which the fluid properties are evaluated. For the case, when the fluid properties depend significantly on the temperature and any pressure dependence is unimportant, we propose a method to predict the centre temperature and show by example of the Göttingen measurements (Ahlers et al.
Reference Ahlers, He, Funfschilling and Bodenschatz2012b
; He et al.
Reference He, Funfschilling, Bodenschatz and Ahlers2012) that it leads to more accurate predictions than the models based on an extension of the Prandtl–Blasius approach to a NOB case (Ahlers et al.
Reference Ahlers, Brown, Araujo, Funfschilling, Grossmann and Lohse2006, Reference Ahlers, Araujo, Funfschilling, Grossmann and Lohse2007, Reference Ahlers, Calzavarini, Araujo, Funfschilling, Grossmann, Lohse and Sugiyama2008) or any of the three models by Wu & Libchaber (Reference Wu and Libchaber1991) or their modification (Urban et al.
Reference Urban, Hanzelka, Musilova, Kralik, Mantia, Srnka and Skrbek2014).
In our approach we consider two virtual symmetric RBC cells
 $I_{-}$
and
$I_{-}$
and
 $I_{+}$
filled with artificial fluids. The fluid properties are assumed to be functions of the temperature
$I_{+}$
filled with artificial fluids. The fluid properties are assumed to be functions of the temperature
 $T$
that are symmetric about
$T$
that are symmetric about
 $T_{c}$
. For
$T_{c}$
. For
 $I_{-}$
(
$I_{-}$
(
 $I_{+}$
) they are taken to be equal to those of the real cell over the temperature range
$I_{+}$
) they are taken to be equal to those of the real cell over the temperature range
 $T_{top}\leqslant T\leqslant T_{c}$
(
$T_{top}\leqslant T\leqslant T_{c}$
(
 $T_{c}\leqslant T\leqslant T_{bot}$
).
$T_{c}\leqslant T\leqslant T_{bot}$
).
We demonstrate that the
 $\mathit{Nu}$
versus
$\mathit{Nu}$
versus
 $\mathit{Ra}$
scaling relations for the real cell and for both virtual cells are very similar. This means that it is impossible to remove the NOB effects in the
$\mathit{Ra}$
scaling relations for the real cell and for both virtual cells are very similar. This means that it is impossible to remove the NOB effects in the
 $\mathit{Nu}$
versus
$\mathit{Nu}$
versus
 $\mathit{Ra}$
relationship, while considering, for example, only the lower half of the real RBC cell. In particular, the transition, obtained in the measurements by Ahlers et al. (Reference Ahlers, He, Funfschilling and Bodenschatz2012b
) and He et al. (Reference He, Funfschilling, Bodenschatz and Ahlers2012), is present in the scaling relations for the real cell as well as for the virtual symmetric cells, determined by the BLs like either the bottom BL or the top BL of the real RBC cell.
$\mathit{Ra}$
relationship, while considering, for example, only the lower half of the real RBC cell. In particular, the transition, obtained in the measurements by Ahlers et al. (Reference Ahlers, He, Funfschilling and Bodenschatz2012b
) and He et al. (Reference He, Funfschilling, Bodenschatz and Ahlers2012), is present in the scaling relations for the real cell as well as for the virtual symmetric cells, determined by the BLs like either the bottom BL or the top BL of the real RBC cell.
2 Model to predict the centre temperature in a real RBC cell
Here we develop a model to predict the temperature at mid-height,
 $T_{c}$
, of a convection cell containing a fluid with properties that depend on the temperature. Hydrostatic pressure changes within the sample are assumed to be sufficiently small so that the dependence of the fluid properties on the pressure may be neglected.
$T_{c}$
, of a convection cell containing a fluid with properties that depend on the temperature. Hydrostatic pressure changes within the sample are assumed to be sufficiently small so that the dependence of the fluid properties on the pressure may be neglected.
In our model we assume that there are two BLs, one each adjacent to the top and bottom plate. The remainder of the system is regarded as the bulk. Thus we neglect the existence of mixing layers between the BLs and the bulk (see e.g. Kraichnan Reference Kraichnan1962; Chung, Yun & Adrian Reference Chung, Yun and Adrian1992), as well as the logarithmic profiles (Ahlers et al.
Reference Ahlers, Bodenschatz, Funfschilling, Grossmann, He, Lohse, Stevens and Verzicco2012a
; Ahlers, Bodenschatz & He Reference Ahlers, Bodenschatz and He2014; Wei & Ahlers Reference Wei and Ahlers2014) in the bulk just beyond the mixing layers. It turns out that this crude approximation is adequate for our purpose. We define two temperatures
 $T_{+}$
and
$T_{+}$
and
 $T_{-}$
as the temperatures at suitably chosen locations of the cross-over from the BLs to the bulk. It also turns out that under the assumptions of the model the temperature drops across the BLs will not be needed. However, the model requires that fluid properties are evaluated at
$T_{-}$
as the temperatures at suitably chosen locations of the cross-over from the BLs to the bulk. It also turns out that under the assumptions of the model the temperature drops across the BLs will not be needed. However, the model requires that fluid properties are evaluated at
 $T_{+}$
and
$T_{+}$
and
 $T_{-}$
. We shall see below that these temperatures emerge naturally from the assumptions of the model (see (2.14)).
$T_{-}$
. We shall see below that these temperatures emerge naturally from the assumptions of the model (see (2.14)).
In figure 1 a typical mean vertical temperature profile is sketched, which has much larger temperature gradients within the BLs compared to that in the bulk region. Here
 $T_{+}$
and
$T_{+}$
and
 $T_{-}$
are the temperatures at the cross-overs from the bottom and top thermal BLs to the bulk, respectively. The thicknesses of the bottom and top BLs are, respectively,
$T_{-}$
are the temperatures at the cross-overs from the bottom and top thermal BLs to the bulk, respectively. The thicknesses of the bottom and top BLs are, respectively,
 $\unicode[STIX]{x1D6FF}_{+}$
and
$\unicode[STIX]{x1D6FF}_{+}$
and
 $\unicode[STIX]{x1D6FF}_{-}$
. The drops of the temperature within the lower and upper halves of the convection cell,
$\unicode[STIX]{x1D6FF}_{-}$
. The drops of the temperature within the lower and upper halves of the convection cell,
 $$\begin{eqnarray}\displaystyle \unicode[STIX]{x1D6E5}_{+}=T_{bot}-T_{c},\quad \unicode[STIX]{x1D6E5}_{-}=T_{c}-T_{top}, & & \displaystyle\end{eqnarray}$$
are generally different in a NOB case.
The absence of the top–bottom symmetry of the BLs in the real RBC cell causes a small deviation of the obtained Nusselt number (
 $\mathit{Nu}$
) from that in the OB case. This deviation is small (except in the case of extreme deviations from the OB approximation) because, to lowest order, the effect on
$\mathit{Nu}$
) from that in the OB case. This deviation is small (except in the case of extreme deviations from the OB approximation) because, to lowest order, the effect on
 $\mathit{Nu}$
from one of the BLs is nearly cancelled by an effect of similar magnitude but opposite sign from the other (see e.g. He, Bodenschatz & Ahlers Reference He, Bodenschatz and Ahlers2016, § 4). Here we address this small deviation, and perhaps more importantly the much larger shift of the centre temperature
$\mathit{Nu}$
from one of the BLs is nearly cancelled by an effect of similar magnitude but opposite sign from the other (see e.g. He, Bodenschatz & Ahlers Reference He, Bodenschatz and Ahlers2016, § 4). Here we address this small deviation, and perhaps more importantly the much larger shift of the centre temperature
 $T_{c}$
away from the mean temperature
$T_{c}$
away from the mean temperature
 $T_{m}$
.
$T_{m}$
.
In our model we consider virtual symmetric RBC cells, filled with artificial fluids, the properties of which are symmetric (with respect to the central temperature
 $T_{c}$
) functions of the temperature
$T_{c}$
) functions of the temperature
 $T$
. We will refer to these virtual systems as virtual symmetric RBC cells
$T$
. We will refer to these virtual systems as virtual symmetric RBC cells
 $I_{+}$
and
$I_{+}$
and
 $I_{-}$
. The cells
$I_{-}$
. The cells
 $I_{+}$
and
$I_{+}$
and
 $I_{-}$
have a priori unknown heights
$I_{-}$
have a priori unknown heights
 $H_{+}$
and
$H_{+}$
and
 $H_{-}$
, respectively. The bottom-plate temperature of the cell
$H_{-}$
, respectively. The bottom-plate temperature of the cell
 $I_{+}$
equals
$I_{+}$
equals
 $T_{bot}$
and the applied temperature difference is
$T_{bot}$
and the applied temperature difference is
 $2\unicode[STIX]{x1D6E5}_{+}$
. The top-plate temperature of the cell
$2\unicode[STIX]{x1D6E5}_{+}$
. The top-plate temperature of the cell
 $I_{-}$
equals
$I_{-}$
equals
 $T_{top}$
and the applied temperature difference is
$T_{top}$
and the applied temperature difference is
 $2\unicode[STIX]{x1D6E5}_{-}$
. In each virtual cell, the temperature of the bottom plate is larger than the temperature of the top plate. The fluid properties of the cells
$2\unicode[STIX]{x1D6E5}_{-}$
. In each virtual cell, the temperature of the bottom plate is larger than the temperature of the top plate. The fluid properties of the cells
 $I_{-}$
and
$I_{-}$
and
 $I_{+}$
are determined by the fluid properties of the real cell for the temperature ranges
$I_{+}$
are determined by the fluid properties of the real cell for the temperature ranges
 $T_{top}\leqslant T\leqslant T_{c}$
and
$T_{top}\leqslant T\leqslant T_{c}$
and
 $T_{c}\leqslant T\leqslant T_{bot}$
, respectively. More precisely, for
$T_{c}\leqslant T\leqslant T_{bot}$
, respectively. More precisely, for
 $T_{top}\leqslant T\leqslant T_{c}$
, the fluid properties of the cell
$T_{top}\leqslant T\leqslant T_{c}$
, the fluid properties of the cell
 $I_{-}$
are the same as those of the real cell, while for
$I_{-}$
are the same as those of the real cell, while for
 $T_{c}\leqslant T\leqslant T_{top}+2\unicode[STIX]{x1D6E5}_{-}$
the fluid properties of the cell
$T_{c}\leqslant T\leqslant T_{top}+2\unicode[STIX]{x1D6E5}_{-}$
the fluid properties of the cell
 $I_{-}$
are obtained by reflection with respect to
$I_{-}$
are obtained by reflection with respect to
 $T_{c}$
. Analogously, for
$T_{c}$
. Analogously, for
 $T_{c}\leqslant T\leqslant T_{bot}$
, the fluid properties of the cell
$T_{c}\leqslant T\leqslant T_{bot}$
, the fluid properties of the cell
 $I_{+}$
are the same as those of the real cell, while for
$I_{+}$
are the same as those of the real cell, while for
 $T_{bot}-2\unicode[STIX]{x1D6E5}_{+}\leqslant T\leqslant T_{c}$
the fluid properties of the cell
$T_{bot}-2\unicode[STIX]{x1D6E5}_{+}\leqslant T\leqslant T_{c}$
the fluid properties of the cell
 $I_{+}$
are obtained by reflection with respect to
$I_{+}$
are obtained by reflection with respect to
 $T_{c}$
.
$T_{c}$
.
The total vertical heat flux averaged in time and over any horizontal cross-section in both cells,
 $I_{+}$
and
$I_{+}$
and
 $I_{-}$
, is assumed to be equal to that in the real RBC cell,
$I_{-}$
, is assumed to be equal to that in the real RBC cell,
 $q$
. To calculate the Nusselt numbers for the corresponding cells,
$q$
. To calculate the Nusselt numbers for the corresponding cells,
 $$\begin{eqnarray}\displaystyle \mathit{Nu}_{+}\equiv q/\hat{q}_{+}\quad \text{and}\quad \mathit{Nu}_{-}\equiv q/\hat{q}_{-}, & & \displaystyle\end{eqnarray}$$
one needs the values of the mean vertical heat fluxes
 $\hat{q}_{+}$
and
$\hat{q}_{+}$
and
 $\hat{q}_{-}$
that would occur via heat conduction alone, in the absence of convection, in the same cells. As the cells
$\hat{q}_{-}$
that would occur via heat conduction alone, in the absence of convection, in the same cells. As the cells
 $I_{+}$
and
$I_{+}$
and
 $I_{-}$
are symmetric, the conductive heat fluxes equal, respectively,
$I_{-}$
are symmetric, the conductive heat fluxes equal, respectively,
 $$\begin{eqnarray}\displaystyle \hat{q}_{+}=\unicode[STIX]{x1D706}_{+}(2\unicode[STIX]{x1D6E5}_{+})/H_{+}\quad \text{and}\quad \hat{q}_{-}=\unicode[STIX]{x1D706}_{-}(2\unicode[STIX]{x1D6E5}_{-})/H_{-}. & & \displaystyle\end{eqnarray}$$
Here
 $\unicode[STIX]{x1D706}_{\pm }\equiv \unicode[STIX]{x1D706}(T_{\pm })$
is the thermal conductivity at the temperature
$\unicode[STIX]{x1D706}_{\pm }\equiv \unicode[STIX]{x1D706}(T_{\pm })$
is the thermal conductivity at the temperature
 $T_{\pm }$
.
$T_{\pm }$
.
At this point it becomes necessary to decide upon which temperatures should be used to evaluate the conductivities
 $\unicode[STIX]{x1D706}_{+}$
and
$\unicode[STIX]{x1D706}_{+}$
and
 $\unicode[STIX]{x1D706}_{-}$
, as well as the other fluid properties that will be needed below. Our definition of the virtual cells implies that the extrema of the properties will be at the plates (i.e. at
$\unicode[STIX]{x1D706}_{-}$
, as well as the other fluid properties that will be needed below. Our definition of the virtual cells implies that the extrema of the properties will be at the plates (i.e. at
 $T_{bot}$
or
$T_{bot}$
or
 $T_{top}$
) and at
$T_{top}$
) and at
 $T_{c}$
. Thus we should choose a temperature somewhere between
$T_{c}$
. Thus we should choose a temperature somewhere between
 $T_{c}$
and
$T_{c}$
and
 $T_{bot}$
for
$T_{bot}$
for
 $I_{+}$
and between
$I_{+}$
and between
 $T_{top}$
and
$T_{top}$
and
 $T_{c}$
for
$T_{c}$
for
 $I_{-}$
. Within our model we shall choose the cross-over temperatures
$I_{-}$
. Within our model we shall choose the cross-over temperatures
 $T_{+}$
and
$T_{+}$
and
 $T_{-}$
for that purpose. While so far
$T_{-}$
for that purpose. While so far
 $T_{+}$
and
$T_{+}$
and
 $T_{-}$
were defined only qualitatively, we shall see below that this choice will also lead to a unique definition of
$T_{-}$
were defined only qualitatively, we shall see below that this choice will also lead to a unique definition of
 $T_{+}$
and
$T_{+}$
and
 $T_{-}$
.
$T_{-}$
.
The Rayleigh numbers of the cells
 $I_{+}$
and
$I_{+}$
and
 $I_{-}$
are, respectively,
$I_{-}$
are, respectively,
 $$\begin{eqnarray}\displaystyle \mathit{Ra}_{+}=\unicode[STIX]{x1D702}_{+}(2\unicode[STIX]{x1D6E5}_{+})H_{+}^{3}\quad \text{and}\quad \mathit{Ra}_{-}=\unicode[STIX]{x1D702}_{-}(2\unicode[STIX]{x1D6E5}_{-})H_{-}^{3}, & & \displaystyle\end{eqnarray}$$
where
 $\unicode[STIX]{x1D702}_{\pm }\equiv \unicode[STIX]{x1D702}(T_{\pm })$
and
$\unicode[STIX]{x1D702}_{\pm }\equiv \unicode[STIX]{x1D702}(T_{\pm })$
and
 $\unicode[STIX]{x1D702}$
is defined as
$\unicode[STIX]{x1D702}$
is defined as
 $\unicode[STIX]{x1D702}\equiv \unicode[STIX]{x1D6FC}g/(\unicode[STIX]{x1D705}\unicode[STIX]{x1D708})$
.
$\unicode[STIX]{x1D702}\equiv \unicode[STIX]{x1D6FC}g/(\unicode[STIX]{x1D705}\unicode[STIX]{x1D708})$
.
Although the total vertical heat fluxes averaged in time and over any horizontal cross-section in both cells,
 $I_{+}$
and
$I_{+}$
and
 $I_{-}$
, are equal to the same quantity,
$I_{-}$
, are equal to the same quantity,
 $q$
, the Nusselt numbers and Rayleigh numbers of these symmetric cells can be different. However, we assume that the Nusselt numbers for both cells, although not equal to each other, follow the same scaling laws. That is,
$q$
, the Nusselt numbers and Rayleigh numbers of these symmetric cells can be different. However, we assume that the Nusselt numbers for both cells, although not equal to each other, follow the same scaling laws. That is,
 $$\begin{eqnarray}\displaystyle \mathit{Nu}_{+}=A_{+}\mathit{Pr}_{+}^{a_{+}}\mathit{Ra}_{+}^{b_{+}}\quad \text{and}\quad \mathit{Nu}_{-}=A_{-}\mathit{Pr}_{-}^{a_{-}}\mathit{Ra}_{-}^{b_{-}} & & \displaystyle\end{eqnarray}$$
with
 $$\begin{eqnarray}\displaystyle A_{+}=A_{-}=A,\quad a_{+}=a_{-}=a\quad \text{and}\quad b_{+}=b_{-}=b. & & \displaystyle\end{eqnarray}$$
Here
 $\mathit{Pr}_{\pm }\equiv \mathit{Pr}(T_{\pm })=\unicode[STIX]{x1D708}_{\pm }/\unicode[STIX]{x1D705}_{\pm }$
is the Prandtl number evaluated at the temperature
$\mathit{Pr}_{\pm }\equiv \mathit{Pr}(T_{\pm })=\unicode[STIX]{x1D708}_{\pm }/\unicode[STIX]{x1D705}_{\pm }$
is the Prandtl number evaluated at the temperature
 $T_{\pm }$
. Note that this assumption is valid to a good approximation as long as (
$T_{\pm }$
. Note that this assumption is valid to a good approximation as long as (
 $\mathit{Pr}_{-}$
,
$\mathit{Pr}_{-}$
,
 $\mathit{Ra}_{-}$
) and (
$\mathit{Ra}_{-}$
) and (
 $\mathit{Pr}_{+}$
,
$\mathit{Pr}_{+}$
,
 $\mathit{Ra}_{+}$
) are sufficiently close, such that they belong to the same scaling regime, see Grossmann & Lohse (Reference Grossmann and Lohse2000, Reference Grossmann and Lohse2001, Reference Grossmann and Lohse2004, Reference Grossmann and Lohse2011). Combining (2.2)–(2.6), we obtain:
$\mathit{Ra}_{+}$
) are sufficiently close, such that they belong to the same scaling regime, see Grossmann & Lohse (Reference Grossmann and Lohse2000, Reference Grossmann and Lohse2001, Reference Grossmann and Lohse2004, Reference Grossmann and Lohse2011). Combining (2.2)–(2.6), we obtain:
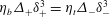
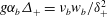
 $$\begin{eqnarray}\displaystyle \left(\frac{\mathit{Nu}_{+}}{\mathit{Nu}_{-}}\right)^{3b-1}\left(\frac{\mathit{Pr}_{+}}{\mathit{Pr}_{-}}\right)^{a}\left(\frac{\unicode[STIX]{x1D706}_{+}}{\unicode[STIX]{x1D706}_{-}}\right)^{3b}\left(\frac{\unicode[STIX]{x1D702}_{+}}{\unicode[STIX]{x1D702}_{-}}\right)^{b}\left(\frac{\unicode[STIX]{x1D6E5}_{+}}{\unicode[STIX]{x1D6E5}_{-}}\right)^{4b}. & & \displaystyle\end{eqnarray}$$
In the considered RBC experiments with
 $\text{SF}_{6}$
, the Prandtl number is larger than 0.5 and, therefore, the scaling regimes there correspond to the ‘upper’ regimes in the Grossmann & Lohse (Reference Grossmann and Lohse2000) theory. In the ‘upper’ regimes,
$\text{SF}_{6}$
, the Prandtl number is larger than 0.5 and, therefore, the scaling regimes there correspond to the ‘upper’ regimes in the Grossmann & Lohse (Reference Grossmann and Lohse2000) theory. In the ‘upper’ regimes,
 $I_{\infty }^{{<}}$
,
$I_{\infty }^{{<}}$
,
 $\text{III}_{\infty }$
and
$\text{III}_{\infty }$
and
 $\text{IV}_{u}$
in the terminology of Grossmann & Lohse (Reference Grossmann and Lohse2000), the effective value of the scaling exponent in the
$\text{IV}_{u}$
in the terminology of Grossmann & Lohse (Reference Grossmann and Lohse2000), the effective value of the scaling exponent in the
 $\mathit{Nu}$
versus
$\mathit{Nu}$
versus
 $\mathit{Pr}$
scaling relation is very close to zero,
$\mathit{Pr}$
scaling relation is very close to zero,
 $a\approx 0$
. Therefore, the Prandtl number dependence in the left-hand side of the relation (2.7) can be omitted:
$a\approx 0$
. Therefore, the Prandtl number dependence in the left-hand side of the relation (2.7) can be omitted:
 $$\begin{eqnarray}\displaystyle \left(\frac{\mathit{Nu}_{+}}{\mathit{Nu}_{-}}\right)^{3-1/b}\left(\frac{\unicode[STIX]{x1D706}_{+}}{\unicode[STIX]{x1D706}_{-}}\right)^{3}\left(\frac{\unicode[STIX]{x1D702}_{+}}{\unicode[STIX]{x1D702}_{-}}\right)\left(\frac{\unicode[STIX]{x1D6E5}_{+}}{\unicode[STIX]{x1D6E5}_{-}}\right)^{4}=1. & & \displaystyle\end{eqnarray}$$
Furthermore, the effective value of the exponent
 $b$
in the regimes
$b$
in the regimes
 $I_{\infty }^{{<}}$
,
$I_{\infty }^{{<}}$
,
 $\text{III}_{\infty }$
and
$\text{III}_{\infty }$
and
 $\text{IV}_{u}$
is very close to
$\text{IV}_{u}$
is very close to
 $1/3$
(see derivations for these regimes, respectively, in Grossmann & Lohse Reference Grossmann and Lohse2000, Grossmann & Lohse Reference Grossmann and Lohse2001 and Shishkina et al.
Reference Shishkina, Emran, Grossmann and Lohse2017a
). This means that the Nusselt number term in the left-hand side of the relation (2.8) can be also neglected as long as the Rayleigh number is not too high so that the so-called ultimate scaling of
$1/3$
(see derivations for these regimes, respectively, in Grossmann & Lohse Reference Grossmann and Lohse2000, Grossmann & Lohse Reference Grossmann and Lohse2001 and Shishkina et al.
Reference Shishkina, Emran, Grossmann and Lohse2017a
). This means that the Nusselt number term in the left-hand side of the relation (2.8) can be also neglected as long as the Rayleigh number is not too high so that the so-called ultimate scaling of
 $\mathit{Nu}$
versus
$\mathit{Nu}$
versus
 $\mathit{Ra}$
takes place. In the Göttingen experiments (Ahlers et al.
Reference Ahlers, He, Funfschilling and Bodenschatz2012b
; He et al.
Reference He, Funfschilling, Bodenschatz and Ahlers2012) for high
$\mathit{Ra}$
takes place. In the Göttingen experiments (Ahlers et al.
Reference Ahlers, He, Funfschilling and Bodenschatz2012b
; He et al.
Reference He, Funfschilling, Bodenschatz and Ahlers2012) for high
 $\mathit{Ra}$
, where already a transition to the ultimate regime takes place, the effective value of
$\mathit{Ra}$
, where already a transition to the ultimate regime takes place, the effective value of
 $b$
is approximately 0.38, but even in this case the variation of the Nusselt number, taken to the power
$b$
is approximately 0.38, but even in this case the variation of the Nusselt number, taken to the power
 $(3-1/b)$
, is much smaller than the variation of the fluid properties. Indeed, even if the Nusselt number variation would be as large as 40 % (
$(3-1/b)$
, is much smaller than the variation of the fluid properties. Indeed, even if the Nusselt number variation would be as large as 40 % (
 $\mathit{Nu}_{-}/\mathit{Nu}_{+}=1.4$
), the variation of the Nusselt number term in the relation (2.8) is only approximately 12 % (
$\mathit{Nu}_{-}/\mathit{Nu}_{+}=1.4$
), the variation of the Nusselt number term in the relation (2.8) is only approximately 12 % (
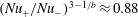 $(\mathit{Nu}_{+}/\mathit{Nu}_{-})^{3-1/b}\approx 0.88$
), while
$(\mathit{Nu}_{+}/\mathit{Nu}_{-})^{3-1/b}\approx 0.88$
), while
 $\unicode[STIX]{x1D702}$
has a much stronger variation. For example, in the experiments by Ahlers et al. (Reference Ahlers, He, Funfschilling and Bodenschatz2012b
) and He et al. (Reference He, Funfschilling, Bodenschatz and Ahlers2012) with
$\unicode[STIX]{x1D702}$
has a much stronger variation. For example, in the experiments by Ahlers et al. (Reference Ahlers, He, Funfschilling and Bodenschatz2012b
) and He et al. (Reference He, Funfschilling, Bodenschatz and Ahlers2012) with
 $\text{SF}_{6}$
, it can be up to 300 % larger close to the cold plate than near the warm plate. The
$\text{SF}_{6}$
, it can be up to 300 % larger close to the cold plate than near the warm plate. The
 $\unicode[STIX]{x1D706}$
-term in the relation (2.8) also cannot be neglected, however, the
$\unicode[STIX]{x1D706}$
-term in the relation (2.8) also cannot be neglected, however, the
 $\unicode[STIX]{x1D706}$
-variation of
$\unicode[STIX]{x1D706}$
-variation of
 $\text{SF}_{6}$
is not as large as the
$\text{SF}_{6}$
is not as large as the
 $\unicode[STIX]{x1D702}$
-variation. Note that the above considered 40 % variation of the Nusselt number occurs not from the measurements by Ahlers et al. (Reference Ahlers, He, Funfschilling and Bodenschatz2012b
) and He et al. (Reference He, Funfschilling, Bodenschatz and Ahlers2012), but is just taken as a very upper bound.
$\unicode[STIX]{x1D702}$
-variation. Note that the above considered 40 % variation of the Nusselt number occurs not from the measurements by Ahlers et al. (Reference Ahlers, He, Funfschilling and Bodenschatz2012b
) and He et al. (Reference He, Funfschilling, Bodenschatz and Ahlers2012), but is just taken as a very upper bound.
Thus, with the above explanations, we obtain from the relation (2.8) the following temperature balance relation:
 $$\begin{eqnarray}\displaystyle \unicode[STIX]{x1D706}_{+}^{3}\unicode[STIX]{x1D702}_{+}\unicode[STIX]{x1D6E5}_{+}^{4}\approx \unicode[STIX]{x1D706}_{-}^{3}\unicode[STIX]{x1D702}_{-}\unicode[STIX]{x1D6E5}_{-}^{4}, & & \displaystyle\end{eqnarray}$$
where the fluid properties
 $\unicode[STIX]{x1D706}_{\pm }$
and
$\unicode[STIX]{x1D706}_{\pm }$
and
 $\unicode[STIX]{x1D702}_{\pm }$
are evaluated at the temperature
$\unicode[STIX]{x1D702}_{\pm }$
are evaluated at the temperature
 $T_{\pm }$
. Equation (2.9) is equivalent to
$T_{\pm }$
. Equation (2.9) is equivalent to
 $$\begin{eqnarray}\displaystyle T_{c}=\frac{\unicode[STIX]{x1D706}_{+}^{3/4}\unicode[STIX]{x1D702}_{+}^{1/4}T_{bot}+\unicode[STIX]{x1D706}_{-}^{3/4}\unicode[STIX]{x1D702}_{-}^{1/4}T_{top}}{\unicode[STIX]{x1D706}_{+}^{3/4}\unicode[STIX]{x1D702}_{+}^{1/4}+\unicode[STIX]{x1D706}_{-}^{3/4}\unicode[STIX]{x1D702}_{-}^{1/4}}. & & \displaystyle\end{eqnarray}$$
As
 $T_{+}$
and
$T_{+}$
and
 $T_{-}$
correspond to the temperatures at the cross-overs from the corresponding BLs to the bulk of the real cell, we shall represent them as a linear combination of the centre temperature and the temperature of the corresponding plate, as follows:
$T_{-}$
correspond to the temperatures at the cross-overs from the corresponding BLs to the bulk of the real cell, we shall represent them as a linear combination of the centre temperature and the temperature of the corresponding plate, as follows:
 $$\begin{eqnarray}\displaystyle & T_{+}=\unicode[STIX]{x1D6FD}_{+}T_{bot}+(1-\unicode[STIX]{x1D6FD}_{+})T_{c}, & \displaystyle\end{eqnarray}$$
 $$\begin{eqnarray}\displaystyle & T_{-}=\unicode[STIX]{x1D6FD}_{-}T_{top}+(1-\unicode[STIX]{x1D6FD}_{-})T_{c}. & \displaystyle\end{eqnarray}$$
Although the temperature gradients in the BLs of a real RBC cell are very steep, the BLs are not purely conductive but are highly fluctuating for sufficiently large
 $\mathit{Ra}$
, see, e.g. du Puits et al. (Reference du Puits, Resagk, Tilgner, Busse and Thess2007), du Puits, Resagk & Thess (Reference du Puits, Resagk and Thess2013). For a fixed aspect ratio of the container, the mean temperature profiles within the BLs depend slightly on
$\mathit{Ra}$
, see, e.g. du Puits et al. (Reference du Puits, Resagk, Tilgner, Busse and Thess2007), du Puits, Resagk & Thess (Reference du Puits, Resagk and Thess2013). For a fixed aspect ratio of the container, the mean temperature profiles within the BLs depend slightly on
 $\mathit{Pr}$
and very weakly on
$\mathit{Pr}$
and very weakly on
 $\mathit{Ra}$
, see Shishkina et al. (Reference Shishkina, Horn, Wagner and Ching2015, Reference Shishkina, Horn, Emran and Ching2017b
) and Ching, Dung & Shishkina (Reference Ching, Dung and Shishkina2017). Therefore, in a fully developed turbulent RBC flow, the temperature at the BL–bulk cross-over depends on
$\mathit{Ra}$
, see Shishkina et al. (Reference Shishkina, Horn, Wagner and Ching2015, Reference Shishkina, Horn, Emran and Ching2017b
) and Ching, Dung & Shishkina (Reference Ching, Dung and Shishkina2017). Therefore, in a fully developed turbulent RBC flow, the temperature at the BL–bulk cross-over depends on
 $\mathit{Pr}$
, although quite weakly. Based on this and the fact that
$\mathit{Pr}$
, although quite weakly. Based on this and the fact that
 $\mathit{Pr}_{+}\approx \mathit{Pr}_{-}$
, we assume further that
$\mathit{Pr}_{+}\approx \mathit{Pr}_{-}$
, we assume further that
 $$\begin{eqnarray}\displaystyle \unicode[STIX]{x1D6FD}_{+}=\unicode[STIX]{x1D6FD}_{-}=\unicode[STIX]{x1D6FD} & & \displaystyle\end{eqnarray}$$
for a certain value of
 $\unicode[STIX]{x1D6FD}$
,
$\unicode[STIX]{x1D6FD}$
,
 $0\leqslant \unicode[STIX]{x1D6FD}\leqslant 1$
. Thus, we write
$0\leqslant \unicode[STIX]{x1D6FD}\leqslant 1$
. Thus, we write
 $$\begin{eqnarray}\displaystyle \left.\begin{array}{@{}c@{}}T_{+}=\unicode[STIX]{x1D6FD}T_{bot}+(1-\unicode[STIX]{x1D6FD})T_{c},\\ T_{-}=\unicode[STIX]{x1D6FD}T_{top}+(1-\unicode[STIX]{x1D6FD})T_{c}.\end{array}\right\} & & \displaystyle\end{eqnarray}$$
Relations (2.10), (2.14) build a model to predict the bulk, or central, temperature
 $T_{c}$
in the real RBC cells. Note that although (2.10) is nonlinear, its numerical solution can be obtained quite easily, using an iterative procedure, as soon as the value of
$T_{c}$
in the real RBC cells. Note that although (2.10) is nonlinear, its numerical solution can be obtained quite easily, using an iterative procedure, as soon as the value of
 $\unicode[STIX]{x1D6FD}$
in (2.14) is known.
$\unicode[STIX]{x1D6FD}$
in (2.14) is known.

Figure 2. Sensitivity of the model (2.10) to the accuracy of the approximation of
 $\unicode[STIX]{x1D6FD}\approx \unicode[STIX]{x1D6FD}_{appr}$
in the relations (2.14). Shown are predictions for different values of
$\unicode[STIX]{x1D6FD}\approx \unicode[STIX]{x1D6FD}_{appr}$
in the relations (2.14). Shown are predictions for different values of
 $\unicode[STIX]{x1D6FD}_{appr}$
against the measurements in pressurized
$\unicode[STIX]{x1D6FD}_{appr}$
against the measurements in pressurized
 $\text{SF}_{6}$
, for the cell aspect ratios (a)
$\text{SF}_{6}$
, for the cell aspect ratios (a)
 $\unicode[STIX]{x1D6E4}=1$
(He et al.
Reference He, Funfschilling, Bodenschatz and Ahlers2012) and (b)
$\unicode[STIX]{x1D6E4}=1$
(He et al.
Reference He, Funfschilling, Bodenschatz and Ahlers2012) and (b)
 $\unicode[STIX]{x1D6E4}=1/2$
(Ahlers et al.
Reference Ahlers, He, Funfschilling and Bodenschatz2012b
). The predicted or measured values of the relative deviation of
$\unicode[STIX]{x1D6E4}=1/2$
(Ahlers et al.
Reference Ahlers, He, Funfschilling and Bodenschatz2012b
). The predicted or measured values of the relative deviation of
 $T_{c}$
from
$T_{c}$
from
 $T_{m}$
are plotted against the Rayleigh number evaluated at the measured
$T_{m}$
are plotted against the Rayleigh number evaluated at the measured
 $T_{c}$
.
$T_{c}$
.
As one can see in figure 2, the model (2.10) is very sensitive to the accuracy of the approximation of
 $\unicode[STIX]{x1D6FD}$
in the relations (2.14). In figure 2 the estimates of the relative temperature deviations,
$\unicode[STIX]{x1D6FD}$
in the relations (2.14). In figure 2 the estimates of the relative temperature deviations,
 $(T_{m}-T_{c})/\unicode[STIX]{x1D6E5}$
, in pressurized gas
$(T_{m}-T_{c})/\unicode[STIX]{x1D6E5}$
, in pressurized gas
 $\text{SF}_{6}$
are presented, according to (2.10), (2.14), for different values of
$\text{SF}_{6}$
are presented, according to (2.10), (2.14), for different values of
 $\unicode[STIX]{x1D6FD}_{appr}$
in the approximation
$\unicode[STIX]{x1D6FD}_{appr}$
in the approximation
 $\unicode[STIX]{x1D6FD}\approx \unicode[STIX]{x1D6FD}_{appr}$
. The case
$\unicode[STIX]{x1D6FD}\approx \unicode[STIX]{x1D6FD}_{appr}$
. The case
 $\unicode[STIX]{x1D6FD}_{appr}=0$
would propose that the temperature at the cross-over from the BL to the bulk equals the centre temperature,
$\unicode[STIX]{x1D6FD}_{appr}=0$
would propose that the temperature at the cross-over from the BL to the bulk equals the centre temperature,
 $T_{\pm }=T_{c}$
, and the case
$T_{\pm }=T_{c}$
, and the case
 $\unicode[STIX]{x1D6FD}_{appr}=1$
would mean that at the cross-over from the BL to the bulk the temperature equals the plate temperature. Because of the strong sensitivity of the model (2.10) on the quality of the approximation of
$\unicode[STIX]{x1D6FD}_{appr}=1$
would mean that at the cross-over from the BL to the bulk the temperature equals the plate temperature. Because of the strong sensitivity of the model (2.10) on the quality of the approximation of
 $\unicode[STIX]{x1D6FD}$
, it is extremely important to estimate the value of
$\unicode[STIX]{x1D6FD}$
, it is extremely important to estimate the value of
 $\unicode[STIX]{x1D6FD}$
possibly precise.
$\unicode[STIX]{x1D6FD}$
possibly precise.
The value of
 $\unicode[STIX]{x1D6FD}$
is strongly influenced by the geometry of the container, which is determined mainly by its diameter-to-height aspect ratio
$\unicode[STIX]{x1D6FD}$
is strongly influenced by the geometry of the container, which is determined mainly by its diameter-to-height aspect ratio
 $\unicode[STIX]{x1D6E4}$
. In slender containers, when
$\unicode[STIX]{x1D6E4}$
. In slender containers, when
 $\unicode[STIX]{x1D6E4}$
is small, the temperature gradient in the bulk is not negligible and, therefore,
$\unicode[STIX]{x1D6E4}$
is small, the temperature gradient in the bulk is not negligible and, therefore,
 $\unicode[STIX]{x1D6FD}$
is relatively large. For large
$\unicode[STIX]{x1D6FD}$
is relatively large. For large
 $\unicode[STIX]{x1D6E4}$
and sufficiently large
$\unicode[STIX]{x1D6E4}$
and sufficiently large
 $\mathit{Ra}$
, the mean temperature gradient vanishes in the bulk and, therefore,
$\mathit{Ra}$
, the mean temperature gradient vanishes in the bulk and, therefore,
 $\unicode[STIX]{x1D6FD}$
is relatively small. When
$\unicode[STIX]{x1D6FD}$
is relatively small. When
 $\unicode[STIX]{x1D6E4}$
tends to infinity, the value of
$\unicode[STIX]{x1D6E4}$
tends to infinity, the value of
 $\unicode[STIX]{x1D6FD}$
saturates at a certain fixed value
$\unicode[STIX]{x1D6FD}$
saturates at a certain fixed value
 $\unicode[STIX]{x1D6FD}_{0}$
, which generally depends on
$\unicode[STIX]{x1D6FD}_{0}$
, which generally depends on
 $\mathit{Pr}$
and
$\mathit{Pr}$
and
 $\mathit{Ra}$
. Assuming an exponential dependence of
$\mathit{Ra}$
. Assuming an exponential dependence of
 $\unicode[STIX]{x1D6FD}$
on
$\unicode[STIX]{x1D6FD}$
on
 $\unicode[STIX]{x1D6E4}$
, we approximate
$\unicode[STIX]{x1D6E4}$
, we approximate
 $\unicode[STIX]{x1D6FD}$
with
$\unicode[STIX]{x1D6FD}$
with
 $\unicode[STIX]{x1D6FD}_{\text{G}\ddot{\text{o}}}$
, where
$\unicode[STIX]{x1D6FD}_{\text{G}\ddot{\text{o}}}$
, where
 $$\begin{eqnarray}\displaystyle \unicode[STIX]{x1D6FD}\approx \unicode[STIX]{x1D6FD}_{\text{G}\ddot{\text{o}}}=(1-\unicode[STIX]{x1D6FD}_{0})\exp (-B\unicode[STIX]{x1D6E4})+\unicode[STIX]{x1D6FD}_{0}. & & \displaystyle\end{eqnarray}$$
The coefficient
 $B$
,
$B$
,
 $B>0$
, which generally depends on
$B>0$
, which generally depends on
 $\mathit{Pr}$
and
$\mathit{Pr}$
and
 $\mathit{Ra}$
, shows how fast
$\mathit{Ra}$
, shows how fast
 $\unicode[STIX]{x1D6FD}$
saturates at
$\unicode[STIX]{x1D6FD}$
saturates at
 $\unicode[STIX]{x1D6FD}_{0}$
when
$\unicode[STIX]{x1D6FD}_{0}$
when
 $\unicode[STIX]{x1D6E4}\rightarrow \infty$
.
$\unicode[STIX]{x1D6E4}\rightarrow \infty$
.
From an analysis of the mean temperatures at the cross-overs from the BLs to the bulk in RBC for different
 $\mathit{Ra}$
and
$\mathit{Ra}$
and
 $\mathit{Pr}$
but fixed
$\mathit{Pr}$
but fixed
 $\unicode[STIX]{x1D6E4}$
, one can conclude that this temperature and, hence, also the value of
$\unicode[STIX]{x1D6E4}$
, one can conclude that this temperature and, hence, also the value of
 $\unicode[STIX]{x1D6FD}$
are influenced by
$\unicode[STIX]{x1D6FD}$
are influenced by
 $\mathit{Pr}$
and depend negligibly weak on
$\mathit{Pr}$
and depend negligibly weak on
 $\mathit{Ra}$
, as soon as the convective flow is turbulent (Shishkina et al.
Reference Shishkina, Horn, Emran and Ching2017b
). The value of
$\mathit{Ra}$
, as soon as the convective flow is turbulent (Shishkina et al.
Reference Shishkina, Horn, Emran and Ching2017b
). The value of
 $\unicode[STIX]{x1D6FD}_{0}$
is slightly larger for smaller
$\unicode[STIX]{x1D6FD}_{0}$
is slightly larger for smaller
 $\mathit{Pr}$
, larger
$\mathit{Pr}$
, larger
 $\mathit{Ra}$
and near the lateral walls, where stronger fluctuations are observed. For
$\mathit{Ra}$
and near the lateral walls, where stronger fluctuations are observed. For
 $\mathit{Pr}\approx 1$
it can be estimated from the solution of the thermal boundary layer equation that takes into account the turbulent fluctuations in terms of the eddy thermal diffusivity (Shishkina et al.
Reference Shishkina, Horn, Wagner and Ching2015). In this case, the vertical profile of the dimensionless temperature
$\mathit{Pr}\approx 1$
it can be estimated from the solution of the thermal boundary layer equation that takes into account the turbulent fluctuations in terms of the eddy thermal diffusivity (Shishkina et al.
Reference Shishkina, Horn, Wagner and Ching2015). In this case, the vertical profile of the dimensionless temperature
 $\unicode[STIX]{x1D703}$
, which is equal to 0 at the plate (
$\unicode[STIX]{x1D703}$
, which is equal to 0 at the plate (
 $\unicode[STIX]{x1D709}=0$
) and equals 1 in the bulk (
$\unicode[STIX]{x1D709}=0$
) and equals 1 in the bulk (
 $\unicode[STIX]{x1D709}\rightarrow \infty$
), is described by the following analytical expression:
$\unicode[STIX]{x1D709}\rightarrow \infty$
), is described by the following analytical expression:
 $$\begin{eqnarray}\displaystyle \unicode[STIX]{x1D703}(\unicode[STIX]{x1D709})=\frac{\sqrt{3}}{4\unicode[STIX]{x03C0}}\log \frac{(1+e\unicode[STIX]{x1D709})^{3}}{1+(e\unicode[STIX]{x1D709})^{3}}+\frac{3}{2\unicode[STIX]{x03C0}}\arctan \frac{2e\unicode[STIX]{x1D709}-1}{\sqrt{3}}+\frac{1}{4} & & \displaystyle\end{eqnarray}$$
with
 $e=2\unicode[STIX]{x03C0}/(3\sqrt{3})$
. Here
$e=2\unicode[STIX]{x03C0}/(3\sqrt{3})$
. Here
 $\unicode[STIX]{x1D709}$
is the dimensionless distance from the plate, where
$\unicode[STIX]{x1D709}$
is the dimensionless distance from the plate, where
 $\unicode[STIX]{x1D709}=1$
corresponds to the cross-over from the BL to the bulk. Since
$\unicode[STIX]{x1D709}=1$
corresponds to the cross-over from the BL to the bulk. Since
 $\unicode[STIX]{x1D703}(1)\approx 0.765$
, we obtain that for
$\unicode[STIX]{x1D703}(1)\approx 0.765$
, we obtain that for
 $\mathit{Pr}\approx 1$
the value of
$\mathit{Pr}\approx 1$
the value of
 $\unicode[STIX]{x1D6FD}_{0}$
equals
$\unicode[STIX]{x1D6FD}_{0}$
equals
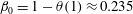 $\unicode[STIX]{x1D6FD}_{0}=1-\unicode[STIX]{x1D703}(1)\approx 0.235$
. We cannot derive the value of
$\unicode[STIX]{x1D6FD}_{0}=1-\unicode[STIX]{x1D703}(1)\approx 0.235$
. We cannot derive the value of
 $B$
in (2.15) from the BL equations and, therefore, fit it from the available experimental data. Thus, we complement the relation (2.15) with
$B$
in (2.15) from the BL equations and, therefore, fit it from the available experimental data. Thus, we complement the relation (2.15) with
 $$\begin{eqnarray}\displaystyle \unicode[STIX]{x1D6FD}_{0}=0.235\quad \text{and}\quad B=1.14. & & \displaystyle\end{eqnarray}$$
Any choice of
 $B$
within the interval
$B$
within the interval
 $[1.1;1.2]$
would not change much the predictions of the central temperature. Thus, for the largest studied
$[1.1;1.2]$
would not change much the predictions of the central temperature. Thus, for the largest studied
 $\mathit{Ra}$
we obtained that the relative deviation of the predictions for
$\mathit{Ra}$
we obtained that the relative deviation of the predictions for
 $B=1.2$
and
$B=1.2$
and
 $B=1.1$
is less than 0.07 %. Although the values of
$B=1.1$
is less than 0.07 %. Although the values of
 $B$
and
$B$
and
 $\unicode[STIX]{x1D6FD}_{0}$
defined by (2.17) are only rough approximations, they, together with (2.10)–(2.15), lead to quite accurate predictions of the centre temperature in the cases considered in the next section. In the future, the estimates (2.17) of
$\unicode[STIX]{x1D6FD}_{0}$
defined by (2.17) are only rough approximations, they, together with (2.10)–(2.15), lead to quite accurate predictions of the centre temperature in the cases considered in the next section. In the future, the estimates (2.17) of
 $\unicode[STIX]{x1D6FD}_{0}$
and
$\unicode[STIX]{x1D6FD}_{0}$
and
 $B$
will be eventually updated and formulated as
$B$
will be eventually updated and formulated as
 $\mathit{Pr}$
- and
$\mathit{Pr}$
- and
 $\mathit{Ra}$
-dependences. For more accurate estimates one needs more measurements of the centre temperature, for possibly high
$\mathit{Ra}$
-dependences. For more accurate estimates one needs more measurements of the centre temperature, for possibly high
 $\mathit{Ra}$
and different values of
$\mathit{Ra}$
and different values of
 $\unicode[STIX]{x1D6E4}$
and
$\unicode[STIX]{x1D6E4}$
and
 $\mathit{Pr}$
.
$\mathit{Pr}$
.
3 Comparison with other models
Now we compare the proposed model (2.10)–(2.17) with other existing models and measurements.
In Horn et al. (Reference Horn, Shishkina and Wagner2013), Horn & Shishkina (Reference Horn and Shishkina2014), models to predict the centre temperature
 $T_{c}$
in RBC, including those by Wu & Libchaber (Reference Wu and Libchaber1991), Zhang et al. (Reference Zhang, Childress and Libchaber1997), Manga & Weeraratne (Reference Manga and Weeraratne1999), Ahlers et al. (Reference Ahlers, Brown, Araujo, Funfschilling, Grossmann and Lohse2006), were compared, based on direct numerical simulations. For the case of very strong temperature dependence of the fluid properties, the models by Wu & Libchaber (Reference Wu and Libchaber1991) (more precisely, their second and third model) were more accurate than the other models. Therefore in the present work we restrict our consideration to the model by Ahlers et al. (Reference Ahlers, Araujo, Funfschilling, Grossmann and Lohse2007, Reference Ahlers, Calzavarini, Araujo, Funfschilling, Grossmann, Lohse and Sugiyama2008) and the three models by Wu & Libchaber (Reference Wu and Libchaber1991) and a slight modification of their first model by Urban et al. (Reference Urban, Hanzelka, Musilova, Kralik, Mantia, Srnka and Skrbek2014) and compare them with our model (2.10)–(2.17) to predict the centre temperature
$T_{c}$
in RBC, including those by Wu & Libchaber (Reference Wu and Libchaber1991), Zhang et al. (Reference Zhang, Childress and Libchaber1997), Manga & Weeraratne (Reference Manga and Weeraratne1999), Ahlers et al. (Reference Ahlers, Brown, Araujo, Funfschilling, Grossmann and Lohse2006), were compared, based on direct numerical simulations. For the case of very strong temperature dependence of the fluid properties, the models by Wu & Libchaber (Reference Wu and Libchaber1991) (more precisely, their second and third model) were more accurate than the other models. Therefore in the present work we restrict our consideration to the model by Ahlers et al. (Reference Ahlers, Araujo, Funfschilling, Grossmann and Lohse2007, Reference Ahlers, Calzavarini, Araujo, Funfschilling, Grossmann, Lohse and Sugiyama2008) and the three models by Wu & Libchaber (Reference Wu and Libchaber1991) and a slight modification of their first model by Urban et al. (Reference Urban, Hanzelka, Musilova, Kralik, Mantia, Srnka and Skrbek2014) and compare them with our model (2.10)–(2.17) to predict the centre temperature
 $T_{c}$
, which was proposed in the previous section.
$T_{c}$
, which was proposed in the previous section.
Let us first recollect the models by Wu & Libchaber (Reference Wu and Libchaber1991). There, the following rough approximations are used: the total temperature drop is assumed to take place exclusively across the bottom and top BLs and heat is assumed to be transported purely by conduction within the BLs, i.e.
 $q=\unicode[STIX]{x1D706}_{b}\unicode[STIX]{x1D6E5}_{+}/\unicode[STIX]{x1D6FF}_{+}=\unicode[STIX]{x1D706}_{t}\unicode[STIX]{x1D6E5}_{-}/\unicode[STIX]{x1D6FF}_{-}$
. The reference temperature
$q=\unicode[STIX]{x1D706}_{b}\unicode[STIX]{x1D6E5}_{+}/\unicode[STIX]{x1D6FF}_{+}=\unicode[STIX]{x1D706}_{t}\unicode[STIX]{x1D6E5}_{-}/\unicode[STIX]{x1D6FF}_{-}$
. The reference temperature
 $T_{b}$
(
$T_{b}$
(
 $T_{t}$
) of the bottom (top) BL, at which the corresponding values of the fluid properties
$T_{t}$
) of the bottom (top) BL, at which the corresponding values of the fluid properties
 $\unicode[STIX]{x1D706}_{b}$
and
$\unicode[STIX]{x1D706}_{b}$
and
 $\unicode[STIX]{x1D702}_{b}$
(
$\unicode[STIX]{x1D702}_{b}$
(
 $\unicode[STIX]{x1D706}_{t}$
and
$\unicode[STIX]{x1D706}_{t}$
and
 $\unicode[STIX]{x1D702}_{t}$
) are evaluated, is defined as follows:
$\unicode[STIX]{x1D702}_{t}$
) are evaluated, is defined as follows:
 $$\begin{eqnarray}\displaystyle T_{b}\equiv (T_{bot}+T_{c})/2,\quad \text{and}\quad T_{t}\equiv (T_{top}+T_{c})/2. & & \displaystyle\end{eqnarray}$$
To close the system of the above equations, Wu & Libchaber (Reference Wu and Libchaber1991), in their first model, follow Malkus (Reference Malkus1954) and Howard (Reference Howard and Görtler1966) and assume that the Rayleigh numbers for the BLs are equal, i.e.
 $\unicode[STIX]{x1D702}_{b}\unicode[STIX]{x1D6E5}_{+}\unicode[STIX]{x1D6FF}_{+}^{3}=\unicode[STIX]{x1D702}_{t}\unicode[STIX]{x1D6E5}_{-}\unicode[STIX]{x1D6FF}_{-}^{3}$
. This leads to their first model:
$\unicode[STIX]{x1D702}_{b}\unicode[STIX]{x1D6E5}_{+}\unicode[STIX]{x1D6FF}_{+}^{3}=\unicode[STIX]{x1D702}_{t}\unicode[STIX]{x1D6E5}_{-}\unicode[STIX]{x1D6FF}_{-}^{3}$
. This leads to their first model:
 $$\begin{eqnarray}\displaystyle \unicode[STIX]{x1D706}_{b}^{3}\unicode[STIX]{x1D702}_{b}\unicode[STIX]{x1D6E5}_{+}^{4}=\unicode[STIX]{x1D706}_{t}^{3}\unicode[STIX]{x1D702}_{t}\unicode[STIX]{x1D6E5}_{-}^{4}. & & \displaystyle\end{eqnarray}$$
One can see that this model coincides with our model (2.10) if, instead of (2.15), the value
 $\unicode[STIX]{x1D6FD}=1/2$
is taken in the relations (2.14).
$\unicode[STIX]{x1D6FD}=1/2$
is taken in the relations (2.14).
Following Castaing et al. (Reference Castaing, Gunaratne, Heslot, Kadanoff, Libchaber, Thomae, Wu, Zaleski and Zanetti1989), in the second model by Wu & Libchaber (Reference Wu and Libchaber1991), it is assumed that the reference velocities
 $w_{b}$
and
$w_{b}$
and
 $w_{t}$
of the thermal plumes emitted from the two BLs are similar,
$w_{t}$
of the thermal plumes emitted from the two BLs are similar,
 $w_{b}\approx w_{t}$
. The reference plume velocity
$w_{b}\approx w_{t}$
. The reference plume velocity
 $w_{b}$
(
$w_{b}$
(
 $w_{t}$
) of the bottom (top) BL is estimated by the balance of the buoyancy force and the viscous force, i.e.
$w_{t}$
) of the bottom (top) BL is estimated by the balance of the buoyancy force and the viscous force, i.e.
 $g\unicode[STIX]{x1D6FC}_{b}\unicode[STIX]{x1D6E5}_{+}=\unicode[STIX]{x1D708}_{b}w_{b}/\unicode[STIX]{x1D6FF}_{+}^{2}$
(
$g\unicode[STIX]{x1D6FC}_{b}\unicode[STIX]{x1D6E5}_{+}=\unicode[STIX]{x1D708}_{b}w_{b}/\unicode[STIX]{x1D6FF}_{+}^{2}$
(
 $g\unicode[STIX]{x1D6FC}_{t}\unicode[STIX]{x1D6E5}_{-}=\unicode[STIX]{x1D708}_{t}w_{t}/\unicode[STIX]{x1D6FF}_{-}^{2}$
). This leads to their second model:
$g\unicode[STIX]{x1D6FC}_{t}\unicode[STIX]{x1D6E5}_{-}=\unicode[STIX]{x1D708}_{t}w_{t}/\unicode[STIX]{x1D6FF}_{-}^{2}$
). This leads to their second model:
 $$\begin{eqnarray}\displaystyle \unicode[STIX]{x1D706}_{b}^{2}\unicode[STIX]{x1D702}_{b}\unicode[STIX]{x1D705}_{b}\unicode[STIX]{x1D6E5}_{+}^{3}=\unicode[STIX]{x1D706}_{t}^{2}\unicode[STIX]{x1D702}_{t}\unicode[STIX]{x1D705}_{t}\unicode[STIX]{x1D6E5}_{-}^{3}. & & \displaystyle\end{eqnarray}$$
In the third model by Wu & Libchaber (Reference Wu and Libchaber1991), it is assumed that the inversed temperature scales of the BLs are similar, i.e.
 $\unicode[STIX]{x1D702}_{b}\unicode[STIX]{x1D6FF}_{+}^{3}=\unicode[STIX]{x1D702}_{t}\unicode[STIX]{x1D6FF}_{-}^{3}$
, which leads to the following relation:
$\unicode[STIX]{x1D702}_{b}\unicode[STIX]{x1D6FF}_{+}^{3}=\unicode[STIX]{x1D702}_{t}\unicode[STIX]{x1D6FF}_{-}^{3}$
, which leads to the following relation:
 $$\begin{eqnarray}\displaystyle \unicode[STIX]{x1D706}_{b}^{3}\unicode[STIX]{x1D702}_{b}\unicode[STIX]{x1D6E5}_{+}^{3}=\unicode[STIX]{x1D706}_{t}^{3}\unicode[STIX]{x1D702}_{t}\unicode[STIX]{x1D6E5}_{-}^{3}. & & \displaystyle\end{eqnarray}$$
To estimate the centre temperature
 $T_{c}$
with the models by Wu & Libchaber (Reference Wu and Libchaber1991), one needs to solve the corresponding nonlinear equations (3.2)–(3.4). A modification of their first model (3.2) was also considered by Urban et al. (Reference Urban, Hanzelka, Musilova, Kralik, Mantia, Srnka and Skrbek2014), where instead of (3.1), the following approximations of the reference temperatures of the BLs were used:
$T_{c}$
with the models by Wu & Libchaber (Reference Wu and Libchaber1991), one needs to solve the corresponding nonlinear equations (3.2)–(3.4). A modification of their first model (3.2) was also considered by Urban et al. (Reference Urban, Hanzelka, Musilova, Kralik, Mantia, Srnka and Skrbek2014), where instead of (3.1), the following approximations of the reference temperatures of the BLs were used:
 $$\begin{eqnarray}\displaystyle \left.\begin{array}{@{}c@{}}T_{b}\equiv (T_{bot}+T_{m})/2=(3T_{bot}+T_{top})/4,\\ T_{t}\equiv (T_{top}+T_{m})/2=(T_{bot}+3T_{top})/4.\end{array}\right\} & & \displaystyle\end{eqnarray}$$
This modification allowed for estimation of
 $T_{c}$
using the explicit relations (3.2), (3.5).
$T_{c}$
using the explicit relations (3.2), (3.5).
The last model, which we compare our model with, is an extension of the Prandtl–Blasius BL theory to a general NOB case of compressible flows, which was developed by Ahlers et al. (Reference Ahlers, Brown, Araujo, Funfschilling, Grossmann and Lohse2006, Reference Ahlers, Araujo, Funfschilling, Grossmann and Lohse2007, Reference Ahlers, Calzavarini, Araujo, Funfschilling, Grossmann, Lohse and Sugiyama2008). There, the centre temperature is found based on an assumption of asymmetric BLs, which, however, follow the Prandtl–Blasius BL equations. Since the temperature profiles in Oberbeck–Boussinesq RBC deviate significantly from the Prandtl–Blasius predictions, the extension of the Prandtl–Blasius BL theory to a non-Oberbeck–Boussinesq case inherits similar problems (see, e.g. Ahlers et al.
Reference Ahlers, Calzavarini, Araujo, Funfschilling, Grossmann, Lohse and Sugiyama2008, figure 11). This limits the applicability of the extended Prandtl–Blasius BL theory to predict the centre temperature in NOB RBC. Note that the deviations between the predictions of the Prandtl–Blasius BL theory and real temperature profiles are larger for larger
 $\mathit{Ra}$
and smaller
$\mathit{Ra}$
and smaller
 $\mathit{Pr}$
, see theoretical explanations in Shishkina et al. (Reference Shishkina, Horn, Wagner and Ching2015, Reference Shishkina, Horn, Emran and Ching2017b
) and Ching et al. (Reference Ching, Dung and Shishkina2017), and results of direct numerical simulations in, e.g. Scheel, Kim & White (Reference Scheel, Kim and White2012), Stevens et al. (Reference Stevens, Zhou, Grossmann, Verzicco, Xia and Lohse2012), Shishkina, Horn & Wagner (Reference Shishkina, Horn and Wagner2013), Shishkina, Wagner & Horn (Reference Shishkina, Wagner and Horn2014).
$\mathit{Pr}$
, see theoretical explanations in Shishkina et al. (Reference Shishkina, Horn, Wagner and Ching2015, Reference Shishkina, Horn, Emran and Ching2017b
) and Ching et al. (Reference Ching, Dung and Shishkina2017), and results of direct numerical simulations in, e.g. Scheel, Kim & White (Reference Scheel, Kim and White2012), Stevens et al. (Reference Stevens, Zhou, Grossmann, Verzicco, Xia and Lohse2012), Shishkina, Horn & Wagner (Reference Shishkina, Horn and Wagner2013), Shishkina, Wagner & Horn (Reference Shishkina, Wagner and Horn2014).
In figure 3 we compare our model (2.10)–(2.17) with the model by Ahlers et al. (Reference Ahlers, Araujo, Funfschilling, Grossmann and Lohse2007, Reference Ahlers, Calzavarini, Araujo, Funfschilling, Grossmann, Lohse and Sugiyama2008) and with the three models (3.2)–(3.4), (3.1) by Wu & Libchaber (Reference Wu and Libchaber1991) and a modification of their first model (3.2), (3.5). The comparison is made using the measurements of the bulk temperature in the RBC experiments with pressurized
 $\text{SF}_{6}$
in cylindrical containers of the diameter-to-height aspect ratios
$\text{SF}_{6}$
in cylindrical containers of the diameter-to-height aspect ratios
 $\unicode[STIX]{x1D6E4}=1$
(He et al.
Reference He, Funfschilling, Bodenschatz and Ahlers2012) and
$\unicode[STIX]{x1D6E4}=1$
(He et al.
Reference He, Funfschilling, Bodenschatz and Ahlers2012) and
 $\unicode[STIX]{x1D6E4}=1/2$
(Ahlers et al.
Reference Ahlers, He, Funfschilling and Bodenschatz2012b
).
$\unicode[STIX]{x1D6E4}=1/2$
(Ahlers et al.
Reference Ahlers, He, Funfschilling and Bodenschatz2012b
).
For the case
 $\unicode[STIX]{x1D6E4}=1$
(figure 3
a), the predictions of our model (2.10)–(2.17) are in perfect agreement with the measurements by He et al. (Reference He, Funfschilling, Bodenschatz and Ahlers2012) and the proposed model excels all other considered models. The third model by Wu & Libchaber (Reference Wu and Libchaber1991) significantly overestimates the relative deviation of the centre temperature from the arithmetic mean of the top and bottom temperatures, while the model by Ahlers et al. (Reference Ahlers, Araujo, Funfschilling, Grossmann and Lohse2007, Reference Ahlers, Calzavarini, Araujo, Funfschilling, Grossmann, Lohse and Sugiyama2008) underestimates it.
$\unicode[STIX]{x1D6E4}=1$
(figure 3
a), the predictions of our model (2.10)–(2.17) are in perfect agreement with the measurements by He et al. (Reference He, Funfschilling, Bodenschatz and Ahlers2012) and the proposed model excels all other considered models. The third model by Wu & Libchaber (Reference Wu and Libchaber1991) significantly overestimates the relative deviation of the centre temperature from the arithmetic mean of the top and bottom temperatures, while the model by Ahlers et al. (Reference Ahlers, Araujo, Funfschilling, Grossmann and Lohse2007, Reference Ahlers, Calzavarini, Araujo, Funfschilling, Grossmann, Lohse and Sugiyama2008) underestimates it.
In the case
 $\unicode[STIX]{x1D6E4}=1/2$
(figure 3
b), for the highest
$\unicode[STIX]{x1D6E4}=1/2$
(figure 3
b), for the highest
 $\mathit{Ra}$
, where the measurements of the temperature deviation are most precise, the predictions of our model (2.10)–(2.17) are again in good agreement with the measurements. In this case, in contrast to what was obtained for
$\mathit{Ra}$
, where the measurements of the temperature deviation are most precise, the predictions of our model (2.10)–(2.17) are again in good agreement with the measurements. In this case, in contrast to what was obtained for
 $\unicode[STIX]{x1D6E4}=1$
, the predictions of the first and second models by Wu & Libchaber (Reference Wu and Libchaber1991) underestimate the temperature deviation; so does the model by Ahlers et al. (Reference Ahlers, Araujo, Funfschilling, Grossmann and Lohse2007, Reference Ahlers, Calzavarini, Araujo, Funfschilling, Grossmann, Lohse and Sugiyama2008).
$\unicode[STIX]{x1D6E4}=1$
, the predictions of the first and second models by Wu & Libchaber (Reference Wu and Libchaber1991) underestimate the temperature deviation; so does the model by Ahlers et al. (Reference Ahlers, Araujo, Funfschilling, Grossmann and Lohse2007, Reference Ahlers, Calzavarini, Araujo, Funfschilling, Grossmann, Lohse and Sugiyama2008).

Figure 3. Comparison of the measured relative deviation of the centre temperature from the arithmetic mean of the top and bottom temperatures in the RBC experiments with pressurized
 $\text{SF}_{6}$
by (a) He et al. (Reference He, Funfschilling, Bodenschatz and Ahlers2012), for the aspect ratio
$\text{SF}_{6}$
by (a) He et al. (Reference He, Funfschilling, Bodenschatz and Ahlers2012), for the aspect ratio
 $\unicode[STIX]{x1D6E4}=1$
and by (b) Ahlers et al. (Reference Ahlers, He, Funfschilling and Bodenschatz2012b
), for
$\unicode[STIX]{x1D6E4}=1$
and by (b) Ahlers et al. (Reference Ahlers, He, Funfschilling and Bodenschatz2012b
), for
 $\unicode[STIX]{x1D6E4}=1/2$
, with the predictions of the here proposed model (2.10)–(2.17) and earlier models by Ahlers et al. (Reference Ahlers, Araujo, Funfschilling, Grossmann and Lohse2007, Reference Ahlers, Calzavarini, Araujo, Funfschilling, Grossmann, Lohse and Sugiyama2008), three models by Wu & Libchaber (Reference Wu and Libchaber1991) and a modification of their first model by Urban et al. (Reference Urban, Hanzelka, Musilova, Kralik, Mantia, Srnka and Skrbek2014).
$\unicode[STIX]{x1D6E4}=1/2$
, with the predictions of the here proposed model (2.10)–(2.17) and earlier models by Ahlers et al. (Reference Ahlers, Araujo, Funfschilling, Grossmann and Lohse2007, Reference Ahlers, Calzavarini, Araujo, Funfschilling, Grossmann, Lohse and Sugiyama2008), three models by Wu & Libchaber (Reference Wu and Libchaber1991) and a modification of their first model by Urban et al. (Reference Urban, Hanzelka, Musilova, Kralik, Mantia, Srnka and Skrbek2014).
4 Comments on the scaling relations of the compensated Nusselt number with the Rayleigh number
In the previous sections, for the purpose of estimating the centre temperature in a real RBC cell, we considered two virtual symmetric RBC cells,
 $I_{\pm }$
, which can be understood as an approximation of the real RBC cell. This approximation is the next closest to the OB approximation, which takes into account the temperature variation of the fluid properties.
$I_{\pm }$
, which can be understood as an approximation of the real RBC cell. This approximation is the next closest to the OB approximation, which takes into account the temperature variation of the fluid properties.
Although the virtual symmetric cells
 $I_{\pm }$
and the real RBC cell can generally have different heights,
$I_{\pm }$
and the real RBC cell can generally have different heights,
 $H_{\pm }$
and
$H_{\pm }$
and
 $H$
, respectively, the compensated Nusselt numbers,
$H$
, respectively, the compensated Nusselt numbers,
 $$\begin{eqnarray}\displaystyle & \displaystyle \frac{\mathit{Nu}_{+}}{\mathit{Ra}_{+}^{1/3}}=\frac{q}{\unicode[STIX]{x1D706}(T_{+})[16(T_{bot}-T_{c})^{4}\unicode[STIX]{x1D702}(T_{+})]^{1/3}}, & \displaystyle\end{eqnarray}$$
 $$\begin{eqnarray}\displaystyle & \displaystyle \frac{\mathit{Nu}_{-}}{\mathit{Ra}_{-}^{1/3}}=\frac{q}{\unicode[STIX]{x1D706}(T_{-})[16(T_{c}-T_{top})^{4}\unicode[STIX]{x1D702}(T_{-})]^{1/3}} & \displaystyle\end{eqnarray}$$
are independent of the heights. The Nusselt numbers here are assumed to be calculated according to the definition, as proposed in Shishkina et al. (Reference Shishkina, Weiss and Bodenschatz2016). Obviously, in the OB case, the values of
 $\mathit{Nu}_{\pm }/\mathit{Ra}_{\pm }^{1/3}$
and
$\mathit{Nu}_{\pm }/\mathit{Ra}_{\pm }^{1/3}$
and
 $\mathit{Nu}/\mathit{Ra}_{c}^{1/3}$
coincide. How different are
$\mathit{Nu}/\mathit{Ra}_{c}^{1/3}$
coincide. How different are
 $\mathit{Nu}_{\pm }/\mathit{Ra}_{\pm }^{1/3}$
and
$\mathit{Nu}_{\pm }/\mathit{Ra}_{\pm }^{1/3}$
and
 $\mathit{Nu}/\mathit{Ra}_{c}^{1/3}$
under NOB conditions, with the temperature-dependent fluid properties?
$\mathit{Nu}/\mathit{Ra}_{c}^{1/3}$
under NOB conditions, with the temperature-dependent fluid properties?
When the exact values of the temperatures at the cross-overs from the BLs to the bulk,
 $T_{\pm }$
, and the centre temperature
$T_{\pm }$
, and the centre temperature
 $T_{c}$
are known, the fluid properties
$T_{c}$
are known, the fluid properties
 $\unicode[STIX]{x1D702}_{\pm }$
and
$\unicode[STIX]{x1D702}_{\pm }$
and
 $\unicode[STIX]{x1D706}_{\pm }$
at these temperatures and, hence, the compensated Nusselt numbers
$\unicode[STIX]{x1D706}_{\pm }$
at these temperatures and, hence, the compensated Nusselt numbers
 $\mathit{Nu}_{\pm }/\mathit{Ra}_{\pm }^{1/3}$
can be easily calculated. In the case, when
$\mathit{Nu}_{\pm }/\mathit{Ra}_{\pm }^{1/3}$
can be easily calculated. In the case, when
 $T_{c}$
is known, but
$T_{c}$
is known, but
 $T_{\pm }$
is not known, one can use the approximation (2.14)–(2.17), to estimate
$T_{\pm }$
is not known, one can use the approximation (2.14)–(2.17), to estimate
 $T_{\pm }$
. In most measurements of the mean heat transport in RBC, not only
$T_{\pm }$
. In most measurements of the mean heat transport in RBC, not only
 $T_{\pm }$
, but also
$T_{\pm }$
, but also
 $T_{c}$
is not available. In such cases the model (2.10)–(2.17) can be used to estimate
$T_{c}$
is not available. In such cases the model (2.10)–(2.17) can be used to estimate
 $T_{c}$
and
$T_{c}$
and
 $T_{\pm }$
.
$T_{\pm }$
.
As discussed above, inaccurate approximations of
 $\unicode[STIX]{x1D6FD}$
in the relations (2.14) lead to inaccurate predictions of the bulk temperature
$\unicode[STIX]{x1D6FD}$
in the relations (2.14) lead to inaccurate predictions of the bulk temperature
 $T_{c}$
(see, for example, figure 2 for
$T_{c}$
(see, for example, figure 2 for
 $\unicode[STIX]{x1D6FD}\approx \unicode[STIX]{x1D6FD}_{appr}$
with different values of
$\unicode[STIX]{x1D6FD}\approx \unicode[STIX]{x1D6FD}_{appr}$
with different values of
 $\unicode[STIX]{x1D6FD}_{appr}$
), while an accurate approximation
$\unicode[STIX]{x1D6FD}_{appr}$
), while an accurate approximation
 $\unicode[STIX]{x1D6FD}_{appr}=\unicode[STIX]{x1D6FD}_{\text{G}\ddot{\text{o}}}$
, according to (2.15) and (2.17), leads to precise predictions of
$\unicode[STIX]{x1D6FD}_{appr}=\unicode[STIX]{x1D6FD}_{\text{G}\ddot{\text{o}}}$
, according to (2.15) and (2.17), leads to precise predictions of
 $T_{c}$
(see figure 3).
$T_{c}$
(see figure 3).
In figures 4 and 5, the dependences of the compensated Nusselt numbers, i.e.
 $\mathit{Nu}_{\pm }/\mathit{Ra}_{\pm }^{1/3}$
against the measured Rayleigh numbers
$\mathit{Nu}_{\pm }/\mathit{Ra}_{\pm }^{1/3}$
against the measured Rayleigh numbers
 $\mathit{Ra}_{c}$
are presented for the virtual symmetric RBC cells
$\mathit{Ra}_{c}$
are presented for the virtual symmetric RBC cells
 $I_{\pm }$
, by example of the RBC data for pressurized
$I_{\pm }$
, by example of the RBC data for pressurized
 $\text{SF}_{6}$
. The cases
$\text{SF}_{6}$
. The cases
 $\unicode[STIX]{x1D6E4}=1$
and
$\unicode[STIX]{x1D6E4}=1$
and
 $\unicode[STIX]{x1D6E4}=1/2$
are presented, respectively, in figures 4 and 5. There
$\unicode[STIX]{x1D6E4}=1/2$
are presented, respectively, in figures 4 and 5. There
 $\mathit{Nu}_{\pm }/\mathit{Ra}_{\pm }^{1/3}$
calculated for different reference temperatures
$\mathit{Nu}_{\pm }/\mathit{Ra}_{\pm }^{1/3}$
calculated for different reference temperatures
 $T_{\pm }$
(i.e. different approximations of
$T_{\pm }$
(i.e. different approximations of
 $\unicode[STIX]{x1D6FD}$
), are plotted against
$\unicode[STIX]{x1D6FD}$
), are plotted against
 $\mathit{Ra}_{c}$
. For an inaccurate approximation
$\mathit{Ra}_{c}$
. For an inaccurate approximation
 $\unicode[STIX]{x1D6FD}\approx \unicode[STIX]{x1D6FD}_{appr}$
with
$\unicode[STIX]{x1D6FD}\approx \unicode[STIX]{x1D6FD}_{appr}$
with
 $\unicode[STIX]{x1D6FD}_{appr}=0$
(when the temperature at the cross-over from the BL to the bulk is assumed to be equal to the centre temperature), the dependence
$\unicode[STIX]{x1D6FD}_{appr}=0$
(when the temperature at the cross-over from the BL to the bulk is assumed to be equal to the centre temperature), the dependence
 $\mathit{Nu}_{+}/\mathit{Ra}_{+}^{1/3}$
on the Rayleigh number is decreasing, while
$\mathit{Nu}_{+}/\mathit{Ra}_{+}^{1/3}$
on the Rayleigh number is decreasing, while
 $\mathit{Nu}_{-}/\mathit{Ra}_{-}^{1/3}$
is increasing (see figures 4
a and 5
a). Opposite to this, for another inaccurate approximation, i.e.
$\mathit{Nu}_{-}/\mathit{Ra}_{-}^{1/3}$
is increasing (see figures 4
a and 5
a). Opposite to this, for another inaccurate approximation, i.e.
 $\unicode[STIX]{x1D6FD}_{appr}=1$
(when the temperature at the cross-over from the BL to the bulk is assumed to be equal to the temperature at the corresponding plate), the dependence
$\unicode[STIX]{x1D6FD}_{appr}=1$
(when the temperature at the cross-over from the BL to the bulk is assumed to be equal to the temperature at the corresponding plate), the dependence
 $\mathit{Nu}_{+}/\mathit{Ra}_{+}^{1/3}$
on the Rayleigh number is increasing, while
$\mathit{Nu}_{+}/\mathit{Ra}_{+}^{1/3}$
on the Rayleigh number is increasing, while
 $\mathit{Nu}_{-}/\mathit{Ra}_{-}^{1/3}$
is decreasing (see figures 4
c and 5
c).
$\mathit{Nu}_{-}/\mathit{Ra}_{-}^{1/3}$
is decreasing (see figures 4
c and 5
c).
With an accurate approximation
 $\unicode[STIX]{x1D6FD}_{appr}=\unicode[STIX]{x1D6FD}_{\text{G}\ddot{\text{o}}}$
(which leads to the correct values of the centre temperature
$\unicode[STIX]{x1D6FD}_{appr}=\unicode[STIX]{x1D6FD}_{\text{G}\ddot{\text{o}}}$
(which leads to the correct values of the centre temperature
 $T_{c}$
and of the temperatures at the cross-overs from the BLs to the bulk,
$T_{c}$
and of the temperatures at the cross-overs from the BLs to the bulk,
 $T_{\pm }$
, see (2.15), (2.17)), the scalings relations of
$T_{\pm }$
, see (2.15), (2.17)), the scalings relations of
 $\mathit{Nu}_{\pm }/\mathit{Ra}_{\pm }^{1/3}$
versus
$\mathit{Nu}_{\pm }/\mathit{Ra}_{\pm }^{1/3}$
versus
 $\mathit{Ra}_{c}$
and
$\mathit{Ra}_{c}$
and
 $\mathit{Nu}/\mathit{Ra}_{c}^{1/3}$
versus
$\mathit{Nu}/\mathit{Ra}_{c}^{1/3}$
versus
 $\mathit{Ra}_{c}$
are very similar. One can see this in figure 4(b) for
$\mathit{Ra}_{c}$
are very similar. One can see this in figure 4(b) for
 $\unicode[STIX]{x1D6E4}=1$
and figure 5(b) for
$\unicode[STIX]{x1D6E4}=1$
and figure 5(b) for
 $\unicode[STIX]{x1D6E4}=1/2$
. These three scaling relations almost replicate each other and, in particular, the transition (i.e. an increase of the normalized Nusselt numbers for large
$\unicode[STIX]{x1D6E4}=1/2$
. These three scaling relations almost replicate each other and, in particular, the transition (i.e. an increase of the normalized Nusselt numbers for large
 $\mathit{Ra}$
), reported in Ahlers et al. (Reference Ahlers, He, Funfschilling and Bodenschatz2012b
), He et al. (Reference He, Funfschilling, Bodenschatz and Ahlers2012) is visible not only in the
$\mathit{Ra}$
), reported in Ahlers et al. (Reference Ahlers, He, Funfschilling and Bodenschatz2012b
), He et al. (Reference He, Funfschilling, Bodenschatz and Ahlers2012) is visible not only in the
 $\mathit{Nu}/\mathit{Ra}_{c}^{1/3}$
dependence, but also in the
$\mathit{Nu}/\mathit{Ra}_{c}^{1/3}$
dependence, but also in the
 $\mathit{Nu}_{+}/\mathit{Ra}_{+}^{1/3}$
and
$\mathit{Nu}_{+}/\mathit{Ra}_{+}^{1/3}$
and
 $\mathit{Nu}_{-}/\mathit{Ra}_{-}^{1/3}$
dependences. Note that plotting
$\mathit{Nu}_{-}/\mathit{Ra}_{-}^{1/3}$
dependences. Note that plotting
 $\mathit{Nu}_{\pm }/\mathit{Ra}_{\pm }^{1/3}$
versus
$\mathit{Nu}_{\pm }/\mathit{Ra}_{\pm }^{1/3}$
versus
 $\mathit{Ra}_{\pm }$
instead of
$\mathit{Ra}_{\pm }$
instead of
 $\mathit{Nu}_{\pm }/\mathit{Ra}_{\pm }^{1/3}$
versus
$\mathit{Nu}_{\pm }/\mathit{Ra}_{\pm }^{1/3}$
versus
 $\mathit{Ra}_{c}$
would only stretch or compress the plots in the horizontal direction, and therefore will not affect the presence of the transition.
$\mathit{Ra}_{c}$
would only stretch or compress the plots in the horizontal direction, and therefore will not affect the presence of the transition.

Figure 4. Sensitivity of the dependences
 $\mathit{Nu}_{\pm }/\mathit{Ra}_{\pm }^{1/3}$
versus
$\mathit{Nu}_{\pm }/\mathit{Ra}_{\pm }^{1/3}$
versus
 $\mathit{Ra}_{c}$
to the temperatures
$\mathit{Ra}_{c}$
to the temperatures
 $T_{\pm }$
at which the fluid properties are evaluated (obtained using an approximation
$T_{\pm }$
at which the fluid properties are evaluated (obtained using an approximation
 $\unicode[STIX]{x1D6FD}\approx \unicode[STIX]{x1D6FD}_{appr}$
in (2.14)), for virtual symmetric RBC cells with the BLs like the warm BL (squares) or like the cold BL (circles) in a real RBC cell, by example of the measurements by He et al. (Reference He, Funfschilling, Bodenschatz and Ahlers2012) for
$\unicode[STIX]{x1D6FD}\approx \unicode[STIX]{x1D6FD}_{appr}$
in (2.14)), for virtual symmetric RBC cells with the BLs like the warm BL (squares) or like the cold BL (circles) in a real RBC cell, by example of the measurements by He et al. (Reference He, Funfschilling, Bodenschatz and Ahlers2012) for
 $\unicode[STIX]{x1D6E4}=1$
. The values of
$\unicode[STIX]{x1D6E4}=1$
. The values of
 $\mathit{Nu}_{\pm }/\mathit{Ra}_{\pm }^{1/3}$
are evaluated according to (4.1), (4.2), for measured
$\mathit{Nu}_{\pm }/\mathit{Ra}_{\pm }^{1/3}$
are evaluated according to (4.1), (4.2), for measured
 $T_{c}$
and (a,c) inaccurate approximations (a)
$T_{c}$
and (a,c) inaccurate approximations (a)
 $\unicode[STIX]{x1D6FD}_{appr}=0$
and (c)
$\unicode[STIX]{x1D6FD}_{appr}=0$
and (c)
 $\unicode[STIX]{x1D6FD}_{appr}=1$
and (b) an accurate approximation
$\unicode[STIX]{x1D6FD}_{appr}=1$
and (b) an accurate approximation
 $\unicode[STIX]{x1D6FD}_{appr}=\unicode[STIX]{x1D6FD}_{\text{G}\ddot{\text{o}}}$
, according to (2.15), (2.17). The dependences
$\unicode[STIX]{x1D6FD}_{appr}=\unicode[STIX]{x1D6FD}_{\text{G}\ddot{\text{o}}}$
, according to (2.15), (2.17). The dependences
 $\mathit{Nu}/\mathit{Ra}_{m}^{1/3}$
versus
$\mathit{Nu}/\mathit{Ra}_{m}^{1/3}$
versus
 $\mathit{Ra}_{m}$
(triangles) and
$\mathit{Ra}_{m}$
(triangles) and
 $\mathit{Nu}/\mathit{Ra}_{c}^{1/3}$
versus
$\mathit{Nu}/\mathit{Ra}_{c}^{1/3}$
versus
 $\mathit{Ra}_{c}$
(diamonds) are shown for comparison.
$\mathit{Ra}_{c}$
(diamonds) are shown for comparison.

Figure 5. Sensitivity of the dependences
 $\mathit{Nu}_{\pm }/\mathit{Ra}_{\pm }^{1/3}$
versus
$\mathit{Nu}_{\pm }/\mathit{Ra}_{\pm }^{1/3}$
versus
 $\mathit{Ra}_{c}$
to the temperatures
$\mathit{Ra}_{c}$
to the temperatures
 $T_{\pm }$
at which the fluid properties are evaluated (obtained using an approximation
$T_{\pm }$
at which the fluid properties are evaluated (obtained using an approximation
 $\unicode[STIX]{x1D6FD}\approx \unicode[STIX]{x1D6FD}_{appr}$
in (2.14)), for virtual symmetric RBC cells with the BLs like the warm BL (squares) or like the cold BL (circles) in a real RBC cell, by example of the measurements by Ahlers et al. (Reference Ahlers, He, Funfschilling and Bodenschatz2012b
) for
$\unicode[STIX]{x1D6FD}\approx \unicode[STIX]{x1D6FD}_{appr}$
in (2.14)), for virtual symmetric RBC cells with the BLs like the warm BL (squares) or like the cold BL (circles) in a real RBC cell, by example of the measurements by Ahlers et al. (Reference Ahlers, He, Funfschilling and Bodenschatz2012b
) for
 $\unicode[STIX]{x1D6E4}=1/2$
. The values of
$\unicode[STIX]{x1D6E4}=1/2$
. The values of
 $\mathit{Nu}_{\pm }/\mathit{Ra}_{\pm }^{1/3}$
are evaluated according to (4.1), (4.2), for measured
$\mathit{Nu}_{\pm }/\mathit{Ra}_{\pm }^{1/3}$
are evaluated according to (4.1), (4.2), for measured
 $T_{c}$
and (a,c) inaccurate approximations (a)
$T_{c}$
and (a,c) inaccurate approximations (a)
 $\unicode[STIX]{x1D6FD}_{appr}=0$
and (c)
$\unicode[STIX]{x1D6FD}_{appr}=0$
and (c)
 $\unicode[STIX]{x1D6FD}_{appr}=1$
and (b) an accurate approximation
$\unicode[STIX]{x1D6FD}_{appr}=1$
and (b) an accurate approximation
 $\unicode[STIX]{x1D6FD}_{appr}=\unicode[STIX]{x1D6FD}_{\text{G}\ddot{\text{o}}}$
, according to (2.15), (2.17). The dependences
$\unicode[STIX]{x1D6FD}_{appr}=\unicode[STIX]{x1D6FD}_{\text{G}\ddot{\text{o}}}$
, according to (2.15), (2.17). The dependences
 $\mathit{Nu}/\mathit{Ra}_{m}^{1/3}$
versus
$\mathit{Nu}/\mathit{Ra}_{m}^{1/3}$
versus
 $\mathit{Ra}_{m}$
(triangles) and
$\mathit{Ra}_{m}$
(triangles) and
 $\mathit{Nu}/\mathit{Ra}_{c}^{1/3}$
versus
$\mathit{Nu}/\mathit{Ra}_{c}^{1/3}$
versus
 $\mathit{Ra}_{c}$
(diamonds) are shown for comparison.
$\mathit{Ra}_{c}$
(diamonds) are shown for comparison.
5 Conclusions
In the present work we use a thought experiment introducing two virtual cells, as described in § 2, to derive a model (2.10)–(2.17) for non-Oberbeck–Boussinesq thermal convection, where the fluid properties depend exclusively on the temperature and are almost independent of the pressure. We show that the model with quantifiable assumptions allows to estimate the centre temperature
 $T_{c}$
in turbulent RBC, according to (2.10). The fluid properties in (2.10) are evaluated at the temperatures
$T_{c}$
in turbulent RBC, according to (2.10). The fluid properties in (2.10) are evaluated at the temperatures
 $T_{\pm }$
, see (2.14), where the parameter
$T_{\pm }$
, see (2.14), where the parameter
 $\unicode[STIX]{x1D6FD}$
is approximated according to the relations (2.15), (2.17).
$\unicode[STIX]{x1D6FD}$
is approximated according to the relations (2.15), (2.17).
The model admits that the Rayleigh numbers of the top and bottom BLs can be different, but the scaling laws of the Nusselt number versus the Prandtl number and Rayleigh number are the same. Based on the measurements by Ahlers et al. (Reference Ahlers, He, Funfschilling and Bodenschatz2012b
) and He et al. (Reference He, Funfschilling, Bodenschatz and Ahlers2012) in containers of the aspect ratios
 $\unicode[STIX]{x1D6E4}=1$
and
$\unicode[STIX]{x1D6E4}=1$
and
 $\unicode[STIX]{x1D6E4}=1/2$
, we showed that the model leads to very precise estimates of
$\unicode[STIX]{x1D6E4}=1/2$
, we showed that the model leads to very precise estimates of
 $T_{c}$
in turbulent NOB RBC.
$T_{c}$
in turbulent NOB RBC.
Finally, based on the above measurements, we showed that the compensated values of the heat transport, i.e.
 $\mathit{Nu}/\mathit{Ra}^{1/3}$
, evaluated for the real RBC cell with the reference temperature
$\mathit{Nu}/\mathit{Ra}^{1/3}$
, evaluated for the real RBC cell with the reference temperature
 $T_{c}$
or for the virtual symmetric RBC cell, with the BLs like the bottom or top BL in the real cell, are very similar if the correct reference temperatures
$T_{c}$
or for the virtual symmetric RBC cell, with the BLs like the bottom or top BL in the real cell, are very similar if the correct reference temperatures
 $T_{+}$
and
$T_{+}$
and
 $T_{-}$
are considered for these symmetric cells.
$T_{-}$
are considered for these symmetric cells.
Acknowledgements
The authors are grateful to F. F. Araujo and D. Lohse for the opportunity to validate the code for the model by Ahlers et al. (Reference Ahlers, Araujo, Funfschilling, Grossmann and Lohse2007, Reference Ahlers, Calzavarini, Araujo, Funfschilling, Grossmann, Lohse and Sugiyama2008) against the original version. O.S. and S.W. acknowledge the support of the Priority Programme SPP 1881 ‘Turbulent Superstructures’ of the Deutsche Forschungsgemeinschaft (DFG). X.H. acknowledges the support of the National Natural Science Foundation of China under Grant No. 11772111 and O.S. acknowledges the DFG support under grant Sh405/4 – Heisenberg fellowship.


