


In the early twentieth century, China remained on a silver standard while most of the world aspired to join the gold standard (Meissner Reference Meissner2005; Mitchener, Shizume, and Weidenmier Reference Mitchener, Masato and Weidenmier2010; Fernholz, Mitchener, and Weidenmier Reference Fernholz, Mitchener and Weidenmier2017). But while the experiences of Western countries have received much attention in the literature, there has been much less research on the operation and efficiency of the silver standard in China, despite its size and comparative importance.Footnote 1 In this paper, we consider China’s degree of financial integration by studying the efficiency of domestic exchange markets during 1920-1933. We consider ten Chinese cities, all of which were on a silver standard. According to most of the literature, market fragmentation prevailed during this period due to a largely self-sufficient peasant economy, backward transportation, and low state capacity. The latter led to political instability and various warlords controlling different regions of the country.Footnote 2 Using a new dataset of domestic exchange rates, we find that financial markets in north-central China were highly integrated both during most of the Warlord Era (1916— 1928) and in the Nanjing Decade (1928-1937). There was, however, a lower degree of integration for remote cities located in the south of the country.
China in the early twentieth century was characterized by political chaos but also fundamental economic and financial transformations. The collapse of the Qing Imperial Government in 1911 ushered in what turned out to be a chaotic Warlord Era, when China was divided among several military cliques, with various warlord factions vying for power. Civil strife became the norm, with no ruler having effective control over the whole country (Ma Reference Ma2019).Footnote 3 After the military campaign known as the Northern Expedition, the Nanjing Decade under the new Nationalist government was more cohesive than the preceding Warlord Era, though it was cut short by Japan’s invasion in 1937. Nevertheless, it was in this era that China experienced the first full-swing surge of industrialization and modernization. Political fragmentation and prolonged weakness at the center offered opportunities for experimentation with new ideas and institutions, giving rise to what we now know as a golden age of the Chinese bourgeoisie (Brandt, Ma, and Rawski Reference Brandt, Ma and Rawski2014).
The degree of market development and economic performance under the silver standard in pre-communist China has long been a source of debate. China was an agrarian state in an early stage of economic development, but its eastern seaboard was considerably more developed than its interior. A long-held view maintains that markets were underdeveloped and regional economies were fragmented (Rawski Reference Rawski1972). This fragmentation has been blamed on inadequate transport systems against a background of weakening fiscal capacity of the state (Elvin Reference Elvin2004; Perkins Reference Perkins1969; Sng Reference Sng2014). The existing debate mainly concerns the development of integration in commodity markets, and there is a relative paucity of research into the monetary and financial aspects of China’s economic transformation. In fact, China’s experience with its silver standard in the early twentieth century has been largely neglected. According to the limited literature that exists, financial market fragmentation also prevailed during this period. For instance, Brandt, Ma, and Rawski (Reference Brandt, Ma and Rawski2014) argue that Chinese financial markets were segmented as interest rates differed substantially across regions—annual interest costs on personal loans during the 1930s ranged from 20-30 percent in coastal provinces to 50 percent in less commercialized provinces. Wide variations also existed in interior provinces: the average annual interest rate paid by farmers varied from 22 percent in Jiangxi to 40 percent in Henan (Chiao and Yin Reference Chiao and Yin1937). Commenting on the financial crisis in Shanghai in 1934, an official report stated that “The other ports, being financially dependent on Shanghai, have naturally also suffered, though not so seriously as Shanghai. The interior of China has been affected scarcely at all and is quite unable to understand the crisis that has arisen in Shanghai.”Footnote 4
In the present paper, we lay out the conditions of the monetary system in China and examine how well its silver standard functioned. The traditional silver currencies used in China were not produced by a central authority. Instead, the circulation of a particular kind of silver currency was confined to each local trading area (Kann Reference Kann1927, p. 60). This characteristic of China’s silver regime generated a domestic exchange market that was conceptually analogous to the foreign exchange markets between the gold standard countries, meaning we can rely on the large literature on gold point arbitrage as a framework.
We formalize the mechanism of silver arbitrage in the presence of transaction costs as it relates to the special circumstances within China and use our model to test the degree of market integration. The lack of available high-frequency data has been a considerable barrier to studying Chinese financial markets in this period. To overcome this, we collected a dataset on daily and weekly domestic exchange rates and the volume of the flow of silver currency between Shanghai and financial sub-centers.Footnote 5 To the best of our knowledge, we are the first to provide a comprehensive empirical assessment of the efficiency of Chinese domestic exchange markets under the silver regime. Using this high-quality dataset, we apply threshold autoregressive (TAR) models to estimate silver points— the transaction costs associated with silver arbitrage. To cross-check the reliability of our results, we consider the relationship between our indirect measures of silver points and direct measures of physical flows of silver currency.
For Shanghai and major commercial hubs in north and central China, we find that financial markets behaved efficiently despite the fragmentation of silver standards. Based on our estimates of silver points and assuming disutility is incurred from violations of the no-arbitrage principle, we also compare the efficiency of Chinese domestic exchange markets with that of the trans-Atlantic and intra-European exchange markets. Our results show that, with the exception of the period of the Northern Expedition, the exchange-market efficiency of the silver standard in north-central China was not much different in magnitude to that of the classical DollarSterling gold standard before WWI. We hence conclude that there was a substantial degree of integration in Chinese financial markets. We attribute this to technological advancements such as the rapidly expanding railway and telegraph lines, to monetary innovations, and to China’s low labor costs, which contributed to low transportation costs. Nevertheless, we also find that market performance in remote regions and smaller cities was lower than that among major trading centers, as would be expected given the distance and political instability context.
While in recent years, a literature on Chinese market integration has emerged, most market efficiency benchmark comparisons between Western Europe and China have focused on agricultural commodities (Shiue Reference Shiue2002; Shiue and Keller Reference Shiue and Wolfgang2007; Keller, Shiue, and Wang Reference Keller, Shiue and Wang2021). By contrast, we provide an assessment of the efficiency of financial markets. Ma and Zhao (Reference Ma and Liuyan2020) study Chinese monetary integration based on the prices of silver dollars in different cities. By the 1920s, silver dollar-convertible banknotes had largely replaced silver coins in circulation (Morota Reference Morota2013). As banknotes were easier to ship, they may be overestimating the degree of market integration. In this paper, we measure financial integration based on the domestic exchange rate and the flows of silver specie. This reveals true silver points: the costs of silver movements. We additionally consider a much wider region of China, including remote areas in the south of the country.
Our study carries implications for the historical understanding of market integration and contributes to a revaluation of economic development during China’s Republican period. Our finding that the Chinese silver standard was remarkably efficient in parts of China despite political turmoil and weak central state capacity is consistent with the existing evidence of economic growth taking place during this period in the area around Shanghai (Ma D. Reference Ma2008). Elsewhere, economic development in the period up to WWII was kept in check; our finding that remote areas of China faced high transaction costs matters for understanding this uneven regional development.Footnote 6
ARBITRAGE IN THE CHINESE SILVER EXCHANGE
China’s Domestic Exchange Market
The late nineteenth century was a time when most countries aspired to join the gold club. An important exception was China, which remained the large silver outlier. The Chinese government did not effectively define or control the weights, fineness, and shape of the silver currency, despite occasional standardization attempts. These tasks were left to local governing bodies, such as chambers of commerce and corporations. Therefore, the silver basis of Chinese traditional currency was not in standard coinage but in the form of ingots called sycee, with each piece generally weighing around 50 ounces. The production of sycee was controlled by local silversmiths’ guilds. Therefore, the pure silver contained in sycee was not nationally uniform: different local institutions manufactured sycee without standardized methods. Naturally, the circulation of any kind of sycee was usually confined to the locality for which they were originally created, and when taken to different localities, they had to be melted or re-assayed (Kann Reference Kann1927, p. 90).
Spanish-American silver coins were first introduced to China during the Ming Dynasty. Over the course of several centuries, many kinds of foreign dollars made their appearance in China. It was not until the end of the nineteenth century that dragon dollars—the Chinese silver coins produced by various provincial mints—made their appearance on the market. As with the sycee, they were not subjected to government control. This explains their lack of uniformity and the subsequent confusion that they caused. The dragon dollars were often accepted by the public by weight instead of by count (Kann Reference Kann1927, p. 151).Footnote 7
In the following decades, the silver dollar and sycee performed different functions. Sycee was often used for account clearings within financial institutions, while silver dollars were more likely to be used in actual circulation (Kann Reference Kann1927, p. 167). To satisfy the need for a common unit of account within the mixtures of currencies, the tael, a “Chinese ounce” of silver, emerged for various commercial zones prior to the end of the Qing regime. The tael provided a reliable anchor against which the value of the amalgam of currencies could be measured. Nevertheless, every commercial center had its own taels. Among the various local taels used, the best known and the most widely used were the Shanghai Tael (hereafter ST), followed by the Tianjin Tael (TT), the Hankou Tael (HT), and the Beijing Tael (BT).
This mixed system of silver currencies generated domestic exchange (neihui) markets among various silver currencies for major trading zones. Particularly important was the exchange of ST against other local taels. This was analogous to the foreign exchanges of the gold standard countries. Usually, the balance of inter-port trade within China was adjusted using bills of exchange or telegraphic transfers. However, if the balance of trade between two commercial ports within China favored one of them for a prolonged period, the balance had to be settled using shipments of silver (Kann Reference Kann1927, p. 87).
Silver Arbitrage
During our period, domestic trade in China was financed mainly by the Chinese native banks.Footnote 8 The native banks in Shanghai began to be active from the middle of the nineteenth century and were to become the center of gravity of China’s financial system. By 1875, more than 100 such institutions operated in Shanghai. The Shanghai native banks set up a network of branches or agents throughout the whole country (Wu L. Reference Wu1935).
There were two primary exchange instruments that traders could use for their operations: bill of exchange and cable order (Yang Reference Yang1936, p. 413). The traditional exchange instrument was the bill of exchange, issued by Shanghai native banks and popularly known as the “Shanghai bill.” Denominated in Shanghai taels and drawn on a party in Shanghai, it was traded in the exchange markets of almost all major cities. But it could be redeemed at its Shanghai tael face value only when, having been shipped to Shanghai, it was presented to the Shanghai drawee. Shanghai bills fell into two categories: sight bills and time bills. The distinction was concerned whether they were payable from 0 (sight/demand bills) to 30 days after sight. Shanghai native banks maintained an unblemished record in redeeming their bills for a long time, thus successfully gaining the public’s confidence. Most domestic trade throughout China was conducted with these credit instruments. This brought about an advanced exchange market for Shanghai bills in major commercial centers (Wu L. Reference Wu1935). As a contemporaneous observer wrote, the “Shanghai bill functioned, in a sense, as a national currency used popularly in domestic trade between major commercial ports” (People’s Bank of China 1989, p. 185).
The second exchange instrument, the cable order, was faster and a common instrument of transfer for banks. The spot cable rate was analogous to the exchange rate for sight Shanghai bills. In the case of cable orders, for instance, the purchasers of the TT made the ST payments and received their TT simultaneously. In contrast, with Shanghai bills, there was a delay for shipment and presentation, even for sight bills (and for time bills, an additional wait was necessary).
As an example, let us consider how silver and Shanghai bills circulated between Shanghai and Tianjin. We consider first silver-export arbitrage, from Shanghai, via sight Shanghai bills. This is the case where silver is overpriced in Tianjin relative to sight bills, that is, the sight exchange rate is higher than the mint parity (plus the costs of shipping silver).Footnote 9 Table 1 relates flows in the quantity of silver and sight bills in an arbitrage transaction. The arbitrageur begins his operation at time t = 0 by buying sight bills in Tianjin at the market rate (e 0), and ships the bills to Shanghai. The time for a one-way voyage is here standardized as 1. At t = 1 he presents the bills to the drawees, uses the ST proceeds to obtain silver from banks in Shanghai at C SH (the fixed silver content per ST), and transports the silver to Tianjin for conversion to the TT at C TJ (the fixed silver content per TT) at t = 2. In this case, the ST is effectively bought at the market exchange rate and sold at mint parity via the silver transaction. The revenue is the deviation of the market rate e0 from the mint parity e par (= C TJ/C SH, that is, the ratio of fixed silver contents in per TT and ST). As for costs, in addition to shipping, interest is lost for the duration of a round-trip voyage.
Table 1. SILVER FLOW FROM SHANGHAI TO TIANJIN, WITH e 0 > e par

Notes: C SHand C TJ are the fixed silver contents per ST and TT, respectively. e0 is the market exchange rate at time 0, and e pm’is the parity ratio (= C TT/C SH). The time for a one-way voyage is denoted as 1. Noninterest costs are not shown in the table.
Source: See the discussion of the model in the text.
We now turn to the converse operation: silver imports (into Shanghai) arbitrage via Shanghai bills (Table 2). The arbitrageur begins his operation by selling Shanghai bills at the sight exchange rate in Tianjin, thereby obtaining the TT with which to purchase silver from the Tianjin banks. The silver is transported to Shanghai and sold to banks, with the ST proceeds used to cover the Shanghai bills upon presentation. In this case, the ST is purchased at e par via the intermediary of silver and sold at the market rate that prevailed at time 0, e0. Therefore, the arbitrageur’s revenue is the absolute value of the deviation of that market rate from parity.
Table 2. SILVER FLOW FROM TIANJIN TO SHANGHAI, WITH e 0 < eP ar

Notes: Here we assume sight bills are drawn up in Shanghai at t = 1. When time bills (which had an interest component) are used instead, lost interest merely corresponded to the opportunity cost of a one-way voyage from Tianjin to Shanghai. See also the notes of Table 1.
Source: See the discussion of the model in the text.
The situation was analogous when a telegraphic transfer was employed as the exchange instrument, except that the time of shipping bills was saved. Although Shanghai bills were the traditional exchange medium for domestic trade within China, telegraphic transfer was the dominant medium for domestic exchange in our study period (Wu D. Reference Wu1935).Footnote 10 Contemporaneous official publications cite either the spot cable rates only or both the spot cable rate and the sight exchange rate for Shanghai bills.Footnote 11 We have rarely seen any publications citing only sight exchange rates.
DATA AND THE ESTIMATION OF SILVER POINTS
We use domestic exchange rate data to establish thresholds on silver arbitrage. We begin by describing the data and econometric model. We then estimate the silver points between Shanghai and other cities and corroborate these results against contemporaneous reports of the cost of silver shipment between cities. We collected domestic exchange rates based on the ST-denominated telegraphic transfers drawn on Shanghai and settled in other cities. We first examine the exchange rates between Shanghai and three major regional financial centers—Tianjin, Hankou, and Beijing—for the 1920s and 1930s. These cities had prime commercial importance in China.Footnote 12 Therefore, their daily rate (paired with Shanghai, the national financial center) was tabulated uninterruptedly in contemporaneous publications. We then move to the analysis of the more partial evidence available for six other smaller or more remote cities. Figure 1 shows all our sample cities in a map of China that emphasizes how they were connected to each other via water or railways.

Figure 1. DISTRIBUTION OF CITIES IN OUR SAMPLE
Notes: The black circles represent the major commercial centers in Central and North China, which we consider in this section, while triangles show our sample of smaller or more remote sample cities that we will consider. The capital from 1928, Nanjing, is shown with a white circle. Source: See Online Appendix 1.
Our series for the Shanghai-Tianjin and Shanghai-Hankou exchange rates span from the moment daily data starts on 1 May 1920 to 9 March 1933. The sample period ends in 1933 because domestic exchange markets in Shanghai were closed off by the abolition of the sycee and tael system (implemented on 10 March 1933).Footnote 13 For the Shanghai-Hankou series, the sub-period from 19 April 1927 to 23 March 1928 is excluded, as the Shanghai-Hankou exchange market was closed due to the Northern Expedition. The period of the Jiangsu-Zhejiang War, which started on 3 September and ended on 13 October 1924, is also excluded from the Shanghai-Hankou series.Footnote 14 The daily data for the Shanghai-Beijing exchange rates are only available for the period from 21 May 1923 to 28 January 1932. After discarding non-trading days, at our disposal we have 3,687, 3,385, and 2,514 daily observations for Shanghai-Tianjin,
Shanghai-Hankou, and Shanghai-Beijing exchange rates, respectively. Detailed data sources are provided in Online Appendices 2-3. In Online Appendix 4, we show examples of what these sources looked like.
Here we define the mint parity e par as the ratio of the fixed metallic contents of silver in local taels of port i to the ST. One problem regarding the parity is that the silver content of each tael was not defined by law but was instead determined by custom and tradition. There are, therefore, different figures in the literature regarding the exact pure silver content of various taels. The silver content of the ST recognized in most modern transactions is 518.512 troy grains (1.08023 ounces) of pure silver. This was also accepted by the Shanghai Foreign Exchange Bankers Association to be used by its members (Young Reference Young1931). According to Wu D. (Reference Wu1935), at parity, TT1 = ST1.05514.Footnote 15
Figure 2 depicts deviation from parity for the exchange rates of Tianjin (x), Hankou (x), and Beijing (x), respectively paired with Shanghai.Footnote 16

Figure 2. DEVIATION FROM PARITY FOR DOMESTIC EXCHANGE RATE, DAILY DATA
We denote x, t as the exchange rate deviation (in percent) from parity:
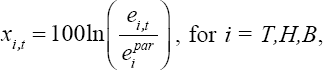 $${x_{i,t}} = 100\ln \left( {{{{e_{i,t}}} \over {e_i^{par}}}} \right),\,{\rm{for}}\,i = T,H,B,$$ where e tis the market exchange rate between Shanghai and city i at time t, and
  $${e_i^{par}}$$ is the corresponding parity. A value of zero for x. t corresponds to the strong form of the law of one price. But some deviations from parity are to be expected, given frictions in the form of information and trading costs. The maximum deviation from parity over the full period was slightly over 2 percent, but this is rarely observed apart from 1927, when a ban on silver exports from Shanghai was enforced during the period of the Northern Expedition. Apart from this period, we note that deviations from parity were generally constrained within the bounds of ±1 percent. Taken at face value, this movement implies either that the war presented enhanced arbitrage opportunities or that trading costs grew considerably in response to hostilities. This indicates a possible decline in market efficiency during the war. Still, it is clear that x. t does not exhibit explosive behavior for any i. The summary statistics of deviations from parity of exchange rate are shown in Table 3.Footnote 17 It shows that the deviations increased during the period of the Northern Expedition.
Table 3. SUMMARY STATISTICS OF EXCHANGE RATE DEVIATIONS FROM PARITY (PERCENT)

Notes: This table reports the means of x, deviation from parity (in percent) for exchange rate (standard deviations in parentheses).
Source: See Online Appendix 2.
Estimation of Silver Points
China’s silver standard generated a domestic exchange market that was similar to the foreign exchange markets between the gold standard countries. As a result, we can rely on the existing literature on gold arbitrage in Western countries. We formalize the mechanism of silver arbitrage with transaction costs with respect to the local historical circumstances in China. As demonstrated in Tables 1 and 2, silver arbitrage suffices to return x.tback to unprofitable levels of divergence, thereby ensuring it is stationary. But within the range given by the silver points, there were no profitable arbitrage opportunities. Thus x. t follows a nonlinear process with the speed of mean-reversion toward equilibrium varying with the size of its deviations. This mechanism finds its closest econometric representation in the TAR model. We estimate the parameters of this system using a three-regime threshold autoregression model, which captures all relevant dynamic features and allows us to simultaneously recover the silver points and the speed of adjustment. For each city, we estimate (suppressing the i indicator for simplicity):
 $${x_1} = \left\{ {\matrix{
{\beta _0^u + \sum\nolimits_{j = 1}^k {\beta _j^u{x_{t - j}} + {\varepsilon _t},\,{\rm{if}}\,{x_{t - 1}} \gt \theta } } \cr
{\beta _0^m + \sum\nolimits_{j = 1}^k {\beta _j^m{x_{t - j}} + {\varepsilon _t},\,{\rm{if}}\,|{x_{t - 1}}| \le \theta } } \cr
{\beta _0^l + \sum\nolimits_{j = 1}^k {\beta _i^l{x_{t - j}} + {\varepsilon _t},\,{\rm{if}}\,{x_{t - 1}} \lt - \theta } } \cr
} } \right.$$
$${x_1} = \left\{ {\matrix{
{\beta _0^u + \sum\nolimits_{j = 1}^k {\beta _j^u{x_{t - j}} + {\varepsilon _t},\,{\rm{if}}\,{x_{t - 1}} \gt \theta } } \cr
{\beta _0^m + \sum\nolimits_{j = 1}^k {\beta _j^m{x_{t - j}} + {\varepsilon _t},\,{\rm{if}}\,|{x_{t - 1}}| \le \theta } } \cr
{\beta _0^l + \sum\nolimits_{j = 1}^k {\beta _i^l{x_{t - j}} + {\varepsilon _t},\,{\rm{if}}\,{x_{t - 1}} \lt - \theta } } \cr
} } \right.$$
where  $$\beta _0^h(h = u,m,\,{\rm{or}}\,l)$$ are constants, and the innovation ε { is serially uncorrelated. We refer to the estimated thresholds, θ, as “silver points” in direct parallel to the literature on gold points (Canjels, Prakash-Canjels, and Taylor Reference Canjels, Prakash-Canjels and Taylor2004). To operationalize the silver-point arbitrage, we expect that x. twill revert toward the edge of the band in outer regimes. But within the “corridor” between the two silver points, the change in the exchange rate is free to follow a random walk. This model can be estimated using conditional least squares. This entails the use of a grid search to determine the value of the threshold, which is implemented as a two-step process. First, using distinct values for the threshold, we estimate each regime using OLS. Second, we minimize the sum of squared residuals over all the values of θ used.
We estimate the TAR model as in Equation (1) using our daily data.Footnote 18 The lagged order (k) is set to two in order to minimize the value of the Bayesian information criterion (BIC). The results are reported in Table 4.Footnote 19 For the Shanghai-Tianjin market, the threshold is estimated to be 0.693 percent, with a 90 percent asymptotic confidence interval of [0.563, 0.715] calculated using the likelihood ratio approach of Hansen (Reference Hansen1997). We cannot reject both the unit root hypothesis in the middle regime and the hypothesis for the outer-regime convergence toward the thresholds. The sum of the AR coefficients in the middle regime is 0.988, with a half-life of 60 trading days (nearly three months). This implies a root close to unity. That is, the middle regime shows barely any convergence. By contrast, the sum of the AR coefficient estimates is 0.951 and 0.898 in the upper and lower regimes, implying that the error correction coefficients are 0.049 and 0.102, respectively. In other words, the half-lives in the upper regime and the lower regime are two weeks and one week, respectively, validating our model with silver point arbitrage. Moreover, the steady-state values of x Tt are positive in the upper regime and negative in the lower regime, and close to zero in the middle regime, in line with the silver arbitrage mechanism discussed previously.
Table 4. RESULTS OF THE TAR MODEL, DAILY DATA

* = Significant at the 10 percent level.
** = Significant at the 1 percent level.
*** = Significant at the 5 percent level
Notes: Standard errors reported in parentheses. A 90 percent asymptotic confidence interval of the estimates of threshold reported in brackets. logL is the log-likelihood value and σ is the standard deviation of residuals. “Upper” and “Lower” refer to the numbers of observations, which exceeds the estimated +θ and —θ, respectively. “Middle” refers to the number of observations, which is bounded by the estimated ±θ.
Source: See Online Appendix 2.
We present the number of observations underlying each regime in the lower panel of the table. Of our 3,685 effective daily observations, the upper regime accounts for 909 observations, a quarter of the total; silver shipments from Shanghai to Tianjin were profitable on these days. The lower regime accounts for 208 observations where silver shipments in the opposite direction were profitable.Footnote 20 The remaining 70 percent of total observations represent the middle regime. Here, there were no profitable arbitrage opportunities as the deviations from parity were insufficient to cover trading costs. Clearly, exploitable arbitrage opportunities did not persist for long.
For the Shanghai-Hankou market and the Shanghai-Beijing market, the estimates of the silver points are 0.592 percent and 0.727 percent, respectively.Footnote 21 Analogously, for each exchange rate series, the middle regime implies a root closer to unity than the two outer regimes. At the same time, the steady-state values are close to zero in the middle regime. Overall, the estimated silver point was lower in the Shanghai-Hankou markets than the corresponding values of the Shanghai-Tianjin markets and the Shanghai-Beijing markets. These show that the degree of financial integration across Shanghai and Hankou was higher than that across Shanghai and Tianjin/Beijing. This is in line with expectations as the distance from Hankou to Shanghai is 900 kilometers. In contrast, the distance from Tianjin and Beijing to Shanghai is 1,300 kilometers and 1,500 kilometers, respectively. Moreover, Hankou is connected to Shanghai by the most convenient inland water route in China, the Yangtze River.Footnote 22
Contemporaneous Accounts on Silver Shipment
We have estimated silver points based on TAR models. These are methods of indirect observation since the silver points are inferred solely through the exchange rate dynamics. To cross-check the robustness of our estimated silver points, we compare our various estimates to contemporaneous accounts. It will be helpful to see that our estimates line up with the shipment costs of silver currency at that time. We first consider the case of the Shanghai-Tianjin silver shipment. In our study period, shipping silver sycee from Shanghai to Tianjin could be done by railroad via Nanjing at a cost of 0.625 percent (including a freight at 0.585 percent and an insurance premium of 0.04 percent), or by steamer, which entailed a cost of 0.54 percent (Jin Reference Jin1925, p. 21).Footnote 23 Considering further the interest with an annualized rate of 3-5 percent incurred, the total costs would amount to around 0.6 percent (the time of a one-way voyage was about nine days). The costs in the opposite direction were roughly symmetric (Jin Reference Jin1925, p. 231). Kann (Reference Kann1927, p. 89) recorded a pro forma note relating to the specific components of the costs (Table 5), where the total cost of sycee movement was 0.62 percent. Therefore, the accounts of the two authors are almost identical, and these accounts are close to our silver point estimates for the Shanghai-Tianjin market (i.e., 0.693 percent).
Table 5. COSTS OF SILVER TRADE IN THE SHANGHAI-TIANJIN AND SHANGHAI-HANKOU MARKETS

Notes: In the case of Hankou, when 6-day interest of a 5 percent annualized rate is included, total costs sum to 0.49 percent.
Source: Kann (Reference Kann1927, pp. 89-90).
We next consider the case of the Shanghai-Hankou silver shipment. Shipping from Shanghai by steamer to Hankou via the Yangtze River entailed a freight of 0.33 percent plus an insurance fee of 0.04 percent (Jin Reference Jin1925, p. 21). When interest is considered, the total transaction costs amounted to around 0.45 percent. Here an invoice made out on 9 December 1926 gave a detailed description of the components of costs (Table 5). On that date, Shanghai shipped 15 boxes of sycee, amounting to 48,307.842 Shanghai Taels, to Hankou, where the treasure became available on 15 December. When six-day interest on an annualized rate of 5 percent was included, the total cost was 0.49 percent, close to our estimate of silver point (0.59 percent).Footnote 24
Arguably, our estimates of the silver points for both markets are slightly higher than the reported costs. The reason is that in addition to covering costs, arbitrageurs required an additional margin (expected net profit or risk premium) to undertake their activity. Their revenues could be adversely affected by events such as an unduly long voyage, an unexpected loss from re-assay or abrasion of silver, or a delay in collecting an insurance claim for lost silver.Footnote 25 Overall then, we find that there were no significant informational or policy barriers to the silver currency shipment in our study period.
Finally, we consider the costs across Shanghai and Beijing. We found only rough records on the silver movement costs. Nevertheless, it is possible to make roughly quantitative inferences on these costs. Beijing, the neighboring city of Tianjin, was well connected with Tianjin by the Jingfeng rail (120 kilometers). The silver movement between Beijing and Tianjin entailed a cost of 0.15 percent (Jin Reference Jin1925, p. 227). The costs for the Shanghai-Beijing silver movement would be slightly higher than for the Shanghai-Tianjin movement. As a result, our estimates of the silver points are very close to the reported costs.
EXCHANGE RATE EFFICIENCY AND COMPARATIVE DISCUSSION
We have estimated the silver points between Shanghai and financial sub-centers using TAR models. We also established the reliability of our results by considering the relationship between our indirect measures of silver points and contemporaneous accounts on the costs of silver shipments. Using the silver point results of the previous section, we are now capable of assessing the efficiency of Chinese domestic exchange markets using two methods. First, we cross-check silver flows and silver-point violations—a term borrowed from Morgenstern’s (1959) “gold-point violations”—to describe the observations of the exchange rate outside the silver point spread. With perfect arbitrage, there can be, by definition, no silver-point violations. Under a substantial degree of market integration, silver-point violations could periodically emerge but would not persist for long as they would immediately cause silver flows via arbitrage. Therefore, we can test for the exchange market efficiency and market integration by investigating silver-point violations and silver flows across cities, as is done in the gold point literature (Officer Reference Officer1996; Canjels, Prakash-Canjels, and Taylor Reference Canjels, Prakash-Canjels and Taylor2004). Second, using the silver point results from the previous section, we calculate the efficiency losses using a variety of measures of the disutility incurred (Officer Reference Officer1989). We show that there was a high level of efficiency among the main cities. We then compare our “silver standard efficiency” with “gold standard efficiency” estimates for the trans-Atlantic and intra-European exchange market prior to WWI. We finally turn to the exchange rates for six smaller or more remote cities to present a more nuanced assessment of the degree of financial integration. Finally, we consider explanations for our findings.
Silver-Point Violations and Silver Flows
We have estimated the silver points which favorably match the measured costs of sycee shipments derived from contemporaneous accounts. It should be noted that contemporaneous accounts were scattered, being specific to certain moments in time. It would be reassuring to cross-validate our results by checking if our silver points do a good job in predicting sycee flows so as to validate our results and assess the efficiency of domestic exchange markets. For this reason, we have compiled weekly records on sycee flows between Shanghai and outports since 1920. The data are obtained from the Yinhang Zhoubao (Banker Weekly) and the North-China Daily News, which tabulated weekly aggregates of sycee shipments from Shanghai to Tianjin/Hankou, and sycee arrivals to Shanghai from Tianjin/Hankou.Footnote 26 Detailed data sources are provided in Online Appendix 3. Because they were weekly aggregates, the timing of sycee shipments or arrivals was not very precise. Moreover, one has to allow for the lag with which sycee arrived, that is, the days in transit. The lag was likely to be about a week (nine days for the Shanghai-Tianjin shipments and six days for the Shanghai-Hankou shipments).
Nonetheless, we can now present a quantity-based cross-check of our econometric results. In Figure 3, we plot the flow volume of sycee across Shanghai and Tianjin and the estimated silver points from the TAR model. To allow for the lag with which sycee buying and shipping occurred, we plot in the upper panel the maximum of the exchange rate in the three days before the reporting day of shipments and in the lower panel the minimum of the exchange rate during the week before the reporting day of arrivals. They demonstrate a broad correspondence between particularly large exchange rate deviations and sycee flows: our silver point estimates predict actual silver flows from Shanghai to Tianjin quite well for the entire period. Almost all of the large exports to Tianjin occurred when Tianjin exchange deviations were above the estimated thresholds. That is, the rapid and efficient adjustment of the exchange rate under silver point arbitrage kept the market exchange rate stable, and any large deviations from parity supposedly provoked silver flows sufficient to push the rate back to within the silver points. This holds true during the Northern Expedition (1926-1928) when there were significantly more silver-point variations in the exchange rate series. In contrast, when the exchange deviation fell below the silver points, the shipment volume of sycee was generally negligible. Arguably, however, the actual silver point during the period of the Northern Expedition might be higher than our estimates.Footnote 27

Figure 3. DOMESTIC EXCHANGE RATE, SILVER POINT, AND SILVER FLOW ACROSS SHANGHAI AND TIANJIN, MAY 1920-MARCH 1933
Notes: The dashed lines are estimated silver points from the TAR model using daily data (±0.693 percent). The solid lines plot exchange rate. With circles we indicate those days when sycee flow volume larger than ST100,000 were observed. On the bottom we show the actual volume of sycee flows.
Only on rare occasions did Shanghai import sycee from Tianjin. The total volume of sycee shipped from Tianjin to Shanghai in the entire period was ST3.97 million. This was a negligible quantity compared with the volume that went in the opposite direction—about ten times as much, ST39.5 million. The reason for such an asymmetry was that most silver was produced in the Americas, and silver imported into China first arrived in Shanghai and then spread to various cities within China. Even so, these rare imports generally occurred when domestic exchange deviations were below the estimated silver points. Overall, by volume, 97 percent of silver flows in this period occurred with silver-point violations, and only 3 percent occurred within the corridor between silver points. Except for the period of the Northern Expedition, it appears that we have estimated both the silver export point and the import point correctly, although there are a couple of peaks that show no sycee flows.
Figure 4 shows the sycee flow between Shanghai and Hankou and the corresponding estimates of silver points. By volume, 16 percent of silver flows occurred within the corridor between the estimated silver points, and 84 percent occurred with silver-point violations. We note a few observations where the exchange rates were actually within the corridor but with substantial sycee shipment. There are two possible explanations for such inconsistency. First, as mentioned before, the timing of sycee shipments or arrivals was not very precise. Second, in some cases, sycee could be shipped for reasons other than arbitrage. As Kann (Reference Kann1927, p. 87) wrote, “Shipments of sycee are made either in settlement of trade balances or, at times, sycee is shipped for the requirements of provincial Mints.” In any case, isolated observations must be viewed with caution, and only general patterns can be considered relevant.

Loss from Exchange-Rate Inefficiency
We now follow the lead provided by Officer (Reference Officer1989) to measure the efficiency of the silver standard. One of the key insights for the model is that disutility occurs from violations of the law of one price. That is, the loss from market inefficiency should be a function of the deviation of the exchange rate from parity, as under conditions of perfect market efficiency, no arbitrage opportunities can exist, and the exchange rate would always be kept at parity.
Denote θ (and −θ) the silver-export point (and silver-import point) for Shanghai. By definition, the silver-point spread is 2θ.Footnote 28 Perfect silver point arbitrage would act to keep the exchange rate within the silver-point spread, that is, |x| ≤ θ. Denote u(x) as the loss function relating the disutility from market inefficiency to x, the deviation from parity. We use three fundamental loss functions in the empirical part of the study: the identity (u = |x|), square (u = x2), and exponential (u = e x − 1).Footnote 29 These loss functions involve disutility increasing at rates 1, 2|x|, and e|x| as |x| increases. Unlike the identity function, the square and exponential functions heavily penalize exchange-rate deviations the further they are from the parity. The average experienced loss from market inefficiency is  $$\bar u = \sum {{u \over T}} $$, where T is the number of observations.
This average experienced loss will be compared with the hypothetical disutility arising from perfect arbitrage, which implies that the exchange rate is always within the spread. Assume that, in the hypothetical case, the exchange rate takes on values within the silver spread with equal probability. Therefore, x follows the uniform distribution within the silver-point spread. The hypothetical expected loss from market inefficiency is:
 $$E(u) = {1 \over \theta }\int {_0^\theta u(x)dx} $$
 For the identity, square and exponential functions of u, the computed values of E(u) are θ/2, θ2/3 and (eθ − θ − 1)/θ, respectively. Thus we define a measure of exchange-market efficiency, the efficiency ratio, as  $$\bar u/E(u)$$, that is, the experienced average loss from market efficiency during a given sample period relative to the hypothetical expected loss of perfect arbitrage. One may naturally expect this ratio to be greater than 1, due to the fact that violations of the silver points are impossible in the hypothetical situation of perfect arbitrage, in contrast to the reality of frequent silver-point violations. Nevertheless, there is every likelihood that this ratio lies below unity, due to exchange-rate speculation (Officer Reference Officer1989).
We can now calculate the efficiency ratio  $$\bar u/E(u)$$, using E(u) in Equation (2). For the Shanghai-Tianjin market and the identity loss function, the average experienced loss is the average percentage deviation (in absolute values) of the exchange rate from the parity, computed over all the daily observations. It is 0.531 for the full period. Under perfect silver-point arbitrage, the average hypothetical disutility under the identity loss function is simply half the magnitude of a silver point. With the silver point defined being 0.693 percent, the average hypothetical loss is 0.347. The results are presented in Table 6. For the full period, the efficiency ratio of 1.53 means that, on average, the exchange rate deviated from parity 53 percent more than what would occur under perfect silver arbitrage.
Table 6. LOSS FROM THE INEFFICIENCY OF DOMESTIC EXCHANGE MARKETS

Notes'. X is the deviation (in percent) of exchange rate from parity. The efficiency ratio is the ratio of average experienced loss to average hypothetical loss. This table does not present the results from the Shanghai-Hankou market for the sub-period of the Northern Expedition, because the market was closed from 19 April 1927 to 23 March 1928.
Source'. See the discussion in the text.
The efficiency ratios are 1.29, 2.43, and 1.46 for three sub-periods— the Warlord Era, the Northern Expedition, and the Nanjing Decade, respectively.Footnote 30 Not surprisingly, the domestic exchange markets of China experienced substantial efficiency loss during the Northern Expedition. However, the average experienced disutility is similar for the Warlord Era and the Nanjing Era, with efficiency in the Warlord Era even marginally above that in the Nanjing Era.Footnote 31 For the Shanghai-Tianjin market, the efficiency ratios for the square and exponential loss functions lead to the same conclusion. The same is true for the Shanghai-Hankou and the Shanghai-Beijing markets.
A natural question at this juncture is the extent to which these results can be compared to the more well-known “gold standard efficiency.” Using the same three loss functions, Officer (Reference Officer1989) estimates that the trans-Atlantic gold-point was 0.65 percent, and the efficiency ratio was below unity (around 0.86) for the period of 1890-1906. Therefore, gold arbitrageurs and exchange rate speculators jointly contributed to market efficiency. If this conclusion is tenable, the Chinese silver-standard efficiency was below that of the gold standard. However, there is evidence that Officer’s gold point may be too high. Canjels, Prakash-Canjels, and Taylor (Reference Canjels, Prakash-Canjels and Taylor2004) show a decline of gold points from 0.42 to 0.25 percent from 1879 to 1913, with a mean of about 0.33 percent. In turn, Spiller and Wood (Reference Spiller and Robert1988) estimate gold points of around 0.25 percent for the period of 1899-1908. Officer re-estimates these at around 0.35 percent for the period from 1900 to 1906 (Officer Reference Officer1996, p. 235). When 0.35 percent is taken as the baseline, the efficiency ratios of Dollar-Sterling for the period of 1890-1906 are 1.72, 3.33, and 1.95 for the identity, square, and exponential loss functions, respectively, hence similar in magnitude to our results for the Chinese silver standard. In a few cases, silver-standard efficiency was even marginally greater than gold-standard efficiency.Footnote 32
Finally, how well integrated were the domestic exchange markets of China in the early twentieth century compared with Europe in other periods? Our estimates of silver points are well below the transaction costs associated with arbitrage in late-medieval and early-modern Europe. For instance, in the sixteenth century, the transaction costs associated with currency arbitrage are estimated to have been 4.4 and 6 percent for the London-Antwerp exchange markets and the Seville-Medina del Campo markets, respectively (Li Reference Li2015). It is natural to expect that the costs would be even higher in earlier times: in 1385-1450, they are estimated to have been 34 and 99 percent for the Flanders-Lübeck markets and the Flanders-Prussia markets, respectively (Li Reference Li2015). While different in magnitude, these pairs of estimates are not exactly comparable with our results as they are for different metallic currencies and different distances. But what they emphasize is that the invention of the telegraph in the nineteenth century reduced the time needed for communication to a negligible level, greatly enhancing market integration (Hoag Reference Hoag2006; Steinwender Reference Steinwender2018).
Extension: Smaller or More Remote Cities
We have found that monetary market integration between Shanghai and China’s three major economic hubs (Tianjin, Hankou, and Beijing) was remarkably high even by the standards of Western economies in the early twentieth century. However, all these cities are located in northern and central China, an economically developed area well linked by railways or waterways. Therefore, the results may not be representative nationally and should be interpreted as an upper bound of the financial integration of the national level. In order to better understand the extent to which these cities may be over-representing the degree of national integration, we now include additional cities in our analysis. The exchange rates for these smaller or more remote cities contrast to those of the major trading centers and enable us to present a more nuanced assessment of financial integration at the national level.
For our additional cities, the extant data on exchange rates are spotty or only available for shorter sub-periods. Given the sample size required for meaningful time series analysis, we restrict our analysis to cities with exchange rate data (paired with Shanghai) which span over three years. Our expanded dataset includes two cities in North China (Shandong province): Jinan (data available for August 1921-December 1924) and Qingdao (August 1921-December 1925); three cities in Southwest China (Sichuan province): Chongqing (August 1921-December 1929), Wanxian (August 1921-December 1929), and Chengdu (August 1921-April 1926); and one city in Southeast China: Guangzhou (August 1925-December 1931).Footnote 33 Detailed data sources are provided in our Online Appendix 2. Due to the unavailability of data for a significant number of trading days, we use weekly-frequency observations in this exercise, using the exchange rate of the last trading day of each week (typically Saturday).
Figure 5 depicts the deviation of the exchange rate from parity for each city (paired with Shanghai).Footnote 34 For both cities in North China—Jinan and Qingdao—we note that the maximum deviation was about 2 percent, similar in amplitude to the exchange rates of the three major commercial hubs, as shown in Figure 2. For Qingdao, accessible through a convenient seaway, the deviations were generally even constrained within the bounds of 1 percent. However, the situation in the remote cities tells a different story, as the magnitudes of deviations were larger and persist for longer.

We now estimate the threshold model as in Equation (1) using weekly data for these cities. The results are reported in Table 7. We choose the lagged order k = 1 or 2 to minimize the BIC. In order to ensure strict comparability with major commercial hubs, we also present the results of Tianjin, Hankou, and Beijing using weekly data.Footnote 35 Here, the estimates of the thresholds for them are 0.81, 0.61, and 0.68 percent, respectively, which are close to those generated from the daily data. While the estimates using the weekly data are higher for Tianjin and lower for Beijing than those generated from daily data, the differences are merely around 0.1 percentage points. As before, the middle regime for each case is estimated to encompass around 80 percent of the total observations. This can be taken as a positive indication for the robustness of our previous silver point estimates, as well as for the credibility of the results for the additional cities for which we only have weekly data.
Table 7. RESULTS OF THE TAR MODEL, WEEKLY DATA

* = Significant at the 10 percent level.** = Significant at the 5 percent level.*** = Significant at the 1 percent level.
Notes: Standard errors reported in parentheses. A 90 percent asymptotic confidence interval of the estimates of threshold reported in brackets. Some confidence intervals (or upper bounds) are missing because they fall out of our grid search. logL is the log-likelihood value and cris the standard deviation of residuals. “Upper” and “Lower” refer to the numbers of observations, which exceeds the estimated +θ and −θ, respectively. “Middle” refers to the number of observations, which is bounded by the estimated ±θ.
Source: See Online Appendix 2.
For Jinan and Qingdao, the estimates of the thresholds are 0.60 and 0.33 percent, respectively, less than that of Tianjin. These estimates seem reasonable as Jinan and Qingdao were on the way from Shanghai to Tianjin, and the estimates favorably match trade costs derived from contemporaneous accounts. That is, while shipping silver between Shanghai and Jinan could be done by railroad at a freight of 0.46 percent (Su Reference Su1921, p. 40), and shipping silver between Shanghai and Qingdao by seaway entailed a freight of 0.30 percent (Jin Reference Jin1925, p. 278), both were substantially less than the trade cost between Shanghai and Tianjin. For both series, we cannot reject the hypothesis of outer-regime convergence toward the thresholds and no convergence in the middle regime.Footnote 36
The results from the southeast and southwest cities lead to the conclusion of financial disintegration between Shanghai and such remote areas. First, the estimates of thresholds for these cities vary from 3 to 4 percent, not only many times those generated from the major hubs in the central area but also many times the freights of the silver shipment. For instance, the freights from Shanghai to Chongqing via the Yangtze River was 0.5 percent, and from Shanghai to Guangzhou by seaway were only 0.25 percent (Su Reference Su1921, pp. 169, 176). Though we find no information on the freights of direct steamers from Wanxian (a smaller city on the upper Yangtze River) to Shanghai, the freights from Wanxian to Hankou via the Yangtze River were estimated to be merely 0.45 percent (Su Reference Su1921, pp. 163, 188), and adding a cost from Hankou to Shanghai would increase the total cost to around 1 percent.Footnote 37 Given both the large exchange rate deviations and large values of silver point estimates, there were clearly other significant frictions preventing trade. These included a higher risk of expropriation or robbery given the lower governmental control over such areas, but also informational and institutional barriers.Footnote 38
Second, for all these remote cities, the outer regimes show barely any convergence and tend to have roots closer to unity than the middle regimes. For instance, for the Chongqing series, deviations are reduced by 5.9 percent and 2.9 percent within one week in the upper and lower regimes (implying half-lives of 12 and 23 weeks), respectively. Moreover, the asymptotic confidence intervals of the thresholds are too wide hence they fall out of our grid search, indicating inaccurate estimates or insignificant threshold effects. Actually, the modified likelihood ratio test for testing linear versus threshold models (Cryer and Chan Reference Cryer and Kung-Sik2008, p. 401) accepts the null hypothesis of linearity for all exchange rate series for the remote cities. In light of this, we also run a linear autoregressive (AR) model for each of these series. The sums of the estimates of the AR coefficient are 0.935, 0.971, 0.948, and 0.939 for the Chongqing, Chengdu, Wanxian, and Guangzhou series, respectively. The average half-life for the exchange rate deviations was 14.6 weeks (more than one-quarter), implying a slow speed of parity reversion, which suggests weak silver point arbitrage and market integration.
Interpretation
Our results have revealed a complex financial system within China, a country that had both integrated and segmented markets that coexisted. On the one hand, the financial integration between China’s major economic hubs in the Lower Yangzi Valley and the coastal areas in the north of the country was remarkably high even by the standards of Western economies. On the other hand, the results from remote southwest and southeast areas suggest financial market fragmentation. This result might be explained by inadequate transportation infrastructure to the latter regions, along with the existence of multiple currencies and monetary standards, which imposed high transaction costs.Footnote 39
Despite the fragmentation of silver standards, the market behaved efficiently to ensure that arbitrage opportunities did not persist for long in the major commercial centers located in north-central China. What can explain this surprising level of financial integration? The first plausible driving force behind the development of financial integration was the industrialization, economic restructuring, and financial modernization of the Late Qing Dynasty and the succeeding Warlord periods. The opening of the economy and the modernization reforms from the end of the nineteenth century brought new businesses and technologies such as rail networks and the telegraph, which improved commodity and capital flows (Tang Reference Tang2016). The length of the railroad network grew from being almost nonexistent in 1900 to 10,000 kilometers by 1911 (Yan Reference Yan1955, p. 180). In particular, newly constructed north-south lines, the Pinghan rail and the Jinpu rail, were completed in 1906 and 1912. These slashed economic distances dominated by rivers flowing from west to east. Western influence mattered: Chinese railways were constructed, owned, and operated by managers designated by the external financial consortium who financed the loans (Goetzmann, Ukhov, and Zhu Reference Goetzmann, Ukhov and Zhu2007). From the 1870s, Western powers also took the lead in setting up telegraph lines along the east coast. Together, the completion of railway and telegraph connections linking Beijing and Hankou reduced the time needed to ship goods from 150 to only three days (Brandt, Ma, and Rawski Reference Brandt, Ma and Rawski2014). Transport development, in turn, supported economic specialization, stimulating further commercialization in a wide range of industries.
A second driving force, which contributed to financial integration was a sweeping transformation that occurred in money and banking. By the 1930s, the branch network of banks extended to more than 500 localities throughout the country (Rawski Reference Rawski1989, p. 136). Both the privileges and autonomy of treaty ports strengthened in the Warlord Era weakened central government. In particular, the International Settlements in Shanghai, Tianjin, and Hankou sheltered banks and other financial institutions from the predatory attempts of the fiscally strapped government. The freedom of association in the treaty ports fostered an explosive growth of chambers of commerce and associations of bankers, lawyers, and accountants (Brandt, Ma, and Rawski Reference Brandt, Ma and Rawski2014). Against this background, a strong autonomous banking community led by the Chinese Bankers’ Association and the Native Bankers’ Association (established in 1915 and 1917, respectively) rose in Shanghai.Footnote 40
Overall, then, Western institutions and technologies such as the railway, the telegraph, and innovations in money and finance had a positive effect on China’s market development, even though they represented a threat to Chinese sovereignty. However, for a large country, China’s railway network was limited and confined to northern and central China.Footnote 41 They linked the major cities of Shanghai and Hankou with Beijing and Tianjin but did not serve remote parts of the country. Cities in Southeast and Southwest China hence faced high transport costs and were also not under central government control. Moreover, China’s modern banking network was developed mainly among port cities. This partly explains the coexistence of both integrated and segmented financial markets.
CONCLUSION
We have examined the efficiency of the silver standard and assessed the degree of financial market integration before WWII. To do this, we estimated silver points between Shanghai and nine commercial cities throughout the country. Based on a compilation of high-frequency exchange data, we find that for major commercial hubs in north and central China, financial markets behaved efficiently despite the fragmentation of silver standards. Our inferred measures of silver points are low and favorably match the measured costs of silver shipments derived from contemporaneous accounts. The daily observations of silver-point violations were rare, silver-point violations did not persist for long, and silver currency shipments generally occurred in the profitable direction as a response to silver-point violations. Our period witnessed the surprising effectiveness of silver arbitrageurs in preventing and removing silver-point violations, although this process did not remain unaffected by civil strife. For this region of China, the exchange market efficiency of its silver standard was not much different in magnitude from that of the classical Dollar-Sterling gold standard. Overall, we find a fairly high level of financial market integration in Republican China, though with substantial regional variation. It is remarkable that this occurred in the era of political decentralization and political turmoil known as the Warlord Era. It seems that political fragmentation and low state capacity only led to segmented markets in parts of China. The fact that monetary markets were becoming integrated must have been one factor promoting economic growth in the regions around Shanghai at this time.
Market performance in remote regions was lower than in the north-central economic hubs; however, a high level of market integration applied only in the latter region. Our analysis shows that both independent and integrated markets coexisted. Finally, it should be emphasized that our findings are based on evidence from financial markets. Hence, they do not necessarily apply to the integration of other commodity markets. This is especially true since as a commodity used for currency, silver has a high value-to-weight ratio. Goods with lower value-to-weight ratios, such as grain, are less profitable to arbitrage under normal circumstances, and those markets are therefore certain to have been less integrated.
Supplementary material
For supplementary material accompanying this paper visit https://doi.org/10.1017/S002205072100036X


