Introduction
From experimental and epidemiological studies, it is well established that maternal nutrition during pregnancy plays an important role in influencing offspring development and healthReference Morrison and Regnault1,Reference Rando and Simmons2 . Offspring born to mothers undernourished during pregnancy have increased risk of developing metabolic disorders including diabetes, obesity, and coronary heart diseaseReference Morrison and Regnault1,Reference Rando and Simmons2 . Seminal data from the Dutch Hunger Winter studies highlight the importance of the timing of the nutritional insult in determining effects on offspring metabolic health outcomes in later lifeReference Schulz3,Reference Roseboom, van der Meulen, Ravelli, Osmond, Barker and Bleker4 . Individuals exposed to famine during late gestation were born smaller and remained smaller throughout their lives, with lower rates of obesity as adults than those who were not exposed to famine during gestationReference Schulz3,Reference Roseboom, van der Meulen, Ravelli, Osmond, Barker and Bleker4 . In contrast, those exposed to famine during the first trimester had, as adults, altered lipid profiles, higher body mass index, and increased prevalence of obesity and coronary heart disease compared with those not exposed to famineReference Schulz3,Reference Roseboom, van der Meulen, Ravelli, Osmond, Barker and Bleker4 . Consistent with these epidemiological studies, experimental studies also provide evidence that maternal nutritional status in early pregnancy, including the period around the time of conception, is important, with perturbations in maternal periconceptional nutritional status adversely affecting offspring development and metabolic healthReference Joshi, Garole, Daware, Girigosavi and Rao5–Reference Watkins, Wilkins and Cunningham9.
We have shown that late gestation sheep fetuses whose mothers were subject to periconceptional undernutrition (PCUN) from 61 d prior until 30 d after mating had increased insulin secretion in response to glucose but not arginine, potentially indicating accelerated maturation of the fetal pancreasReference Oliver, Hawkins, Breier, Van Zijl, Sargison and Harding10. Furthermore, during maternal fasting, late gestation fetuses of periconceptionally undernourished ewes had similar insulin concentration but maintained lower plasma glucose concentration than controlsReference Rumball, Bloomfield, Oliver and Harding11, suggesting that insulin action was enhanced. Consistent with these fetal findings, Smith et al. reported reduced plasma glucose concentrations and increased insulin response to an intravenous bolus glucose infusion, in 10-week-old offspring of ewes that were subjected to PCUN from 28 d prior until 7 d after matingReference Smith, McAuliffe, Quinn, Lonergan and Evans12. However, these fetal and neonatal changes were short-lived, and in fact reversed in later life, as 10-month-old postpubertal lambs of periconceptionally undernourished ewes had reduced insulin:glucose ratio, reduced first-phase insulin response (FIR) to glucose, and impaired glucose tolerance (IGT)Reference Todd, Oliver, Jaquiery, Bloomfield and Harding13. It remains to be determined whether these effects of maternal PCUN on offspring glucose–insulin axis persist into adulthood.
The aim of this study was to determine the effects of PCUN on glucose–insulin axis function in offspring in mid-adulthood (36 months old) and also insulin signalling protein expression in skeletal muscle of fetal and adult offspring.
Methods
Experimental paradigm
All animal experimentation was approved by the University of Auckland Animal Ethics Committee (Approvals AEC/07/2004/R277, AEC/07/2005/R389, and AEC/02/2008/R628) and conducted in accordance with those approvals. Multiparous singleton-bearing 4 to 5-year-old Romney ewes between body condition score 3.5 and 4.5Reference Kenyon, Maloney and Blache14 were acclimatized to a pelleted complete feed ration (designed in conjunction with Dunstan, Hamilton, NZ) comprising 60% lucerne, 30% barley, 5% meadow hay, and the balance limestone, molasses, and a mineral mix. The feed had a mean metabolizable energy of 9.5 MJ/kg, acid-detergent soluble fiber content of 31%, neutral-detergent fiber content of 32%, soluble starch content of 16%, and crude protein content of 17%, on a dry matter basis. Ewes were randomly allocated to one of four groups: controls (Control; maintenance feeding: pelleted feed at 3%–4% of body weight/day); undernourished (low plane feeding: fasted for 2 d then fed pelleted feed at 1–2% of body weight/day) from 61 d before until mating (PreC), from 2 d before until 30 d after mating (PostC), or from 61 d before until 30 d after mating (PrePostC) as described previously and no differences in maternal weight were seen at the start of nutritional managementReference Rumball, Bloomfield, Oliver and Harding11. Ewes underwent ultrasonography 55 d and 69 d after mating to confirm pregnancy rates, which were not affected by PCUNReference Oliver, Hawkins and Harding15. A subset of ewes and their singleton fetuses were randomly assigned for instrumented in vivo fetal–maternal study and euthanasia at 132 d gestation by intravenous pentobarbitone overdose (Provet, Auckland, NZ, 85 mg/kg)Reference Rumball, Bloomfield, Oliver and Harding11. Vastus lateralis samples were collected from fetuses (Control, 3M/5F; PreC, 2M/5F; PostC, 6M/1F; PrePostC, 3M/7F). The remaining ewes lambed and weaned at 3 months of ageReference Jaquiery, Oliver, Bloomfield and Harding16. Standard animal husbandry practices (drenching, shearing, hoof trimming, and vaccination) were carried out periodically. Ewe offspring were not mated during the life course. At 4 and 10 months of age, singleton and twin animals from Control and PrePostC were tested for intravenous glucose tolerance tests (ivGTTs)Reference Todd, Oliver, Jaquiery, Bloomfield and Harding13, following that age twins were not studied further. By 36 months of age, 16.5% of singleton animals born in the trial had died with no difference among groups. Adult, singleton offspring were again brought indoors for ivGTT and hyperglycemic clamps (HGCs; Control, 5M/10F; PreC, 10M/10F; PostC, 11M/5F; PrePostC, 9M/9F). Following testing, samples of vastus lateralis were collected after euthanasia by anesthetic overdose. Muscle samples were snap-frozen in liquid nitrogen and stored at −80°C until analysis.
ivGTT and HGC
At 36 months of age, catheters were placed in jugular veins under local anesthetic dose (Xylocaine, AstraZeneca, North Ryde, NSW, Australia)Reference Todd, Oliver, Jaquiery, Bloomfield and Harding13 and animals underwent GTTs (Control, 5M/10F; PreC, 10M/10F; PostC, 11M/5F; PrePostC, 8M/9F) and a HGC (Control, 5M/10F; PreC, 10M/10F; PostC, 10M/5F; PrePostC, 9M/9F). Briefly, for ivGTT, two 3-ml baseline blood samples were collected after an overnight fast, followed by an intravenous infusion of 0.5 g kg−1 of a 50% dextrose solution (Baxter, Auckland, New Zealand) over 30 s, and then collection of 3-ml blood samples at 2, 5, 10, 15, 20, 30, 40, 50, 60, 120, and 180 minReference Todd, Oliver, Jaquiery, Bloomfield and Harding13. Plasma was collected by spinning heparinized blood samples at 3000 rpm for 10 min at 4°C. Plasma glucose concentration was measured by enzymatic colorimetric assay with a coefficient of variation (CV) ≤10% (Roche Diagnostics, Mannheim, Germany) on a Roche/Hitachi 902 Automatic Analyser (Hitachi High-Technologies Corporation, Tokyo, Japan)Reference Todd, Oliver, Jaquiery, Bloomfield and Harding13. HGCs were performed 3 to 4 d after the ivGTT as described previouslyReference DeFronzo, Tobin and Andres17 which also included bolus of intravenous arginine at its completionReference Bansal, Bloomfield and Connor18. Briefly, sheep were fasted overnight before a baseline glucose concentration was established using an YSI 2300 (Yellow Springs Instruments, Dayton, OH, USA). A 25% dextrose (Baxter, Auckland, NZ) infusion was then started to maintain steady state hyperglycemia for 135 min. Blood samples (0.5 ml) were taken every minute and the glucose infusion rate was adjusted. Blood samples (3 ml) for insulin measurement were collected 10 and 0 min before the start of the glucose infusion, every 15 min during the infusion and then 5, 10, 20, and 30 min after the arginine injection. The small differences in animal numbers relate to catheter failures for the ivGTT (one animal) and failure to attain steady-state insulin during HGC (one animal).
Hormone analysis
Plasma ovine insulin concentrations were measured by specific radioimmunoassay established and validated for sheep plasma as described previouslyReference Oliver, Harding, Breier, Evans and Gluckman19. The minimal detectable concentration was 0.03 ng ml−1 and the inter- and intra-assay CVs were 11.1% and 11.0%, respectively.
Western blotting for insulin signalling protein expression
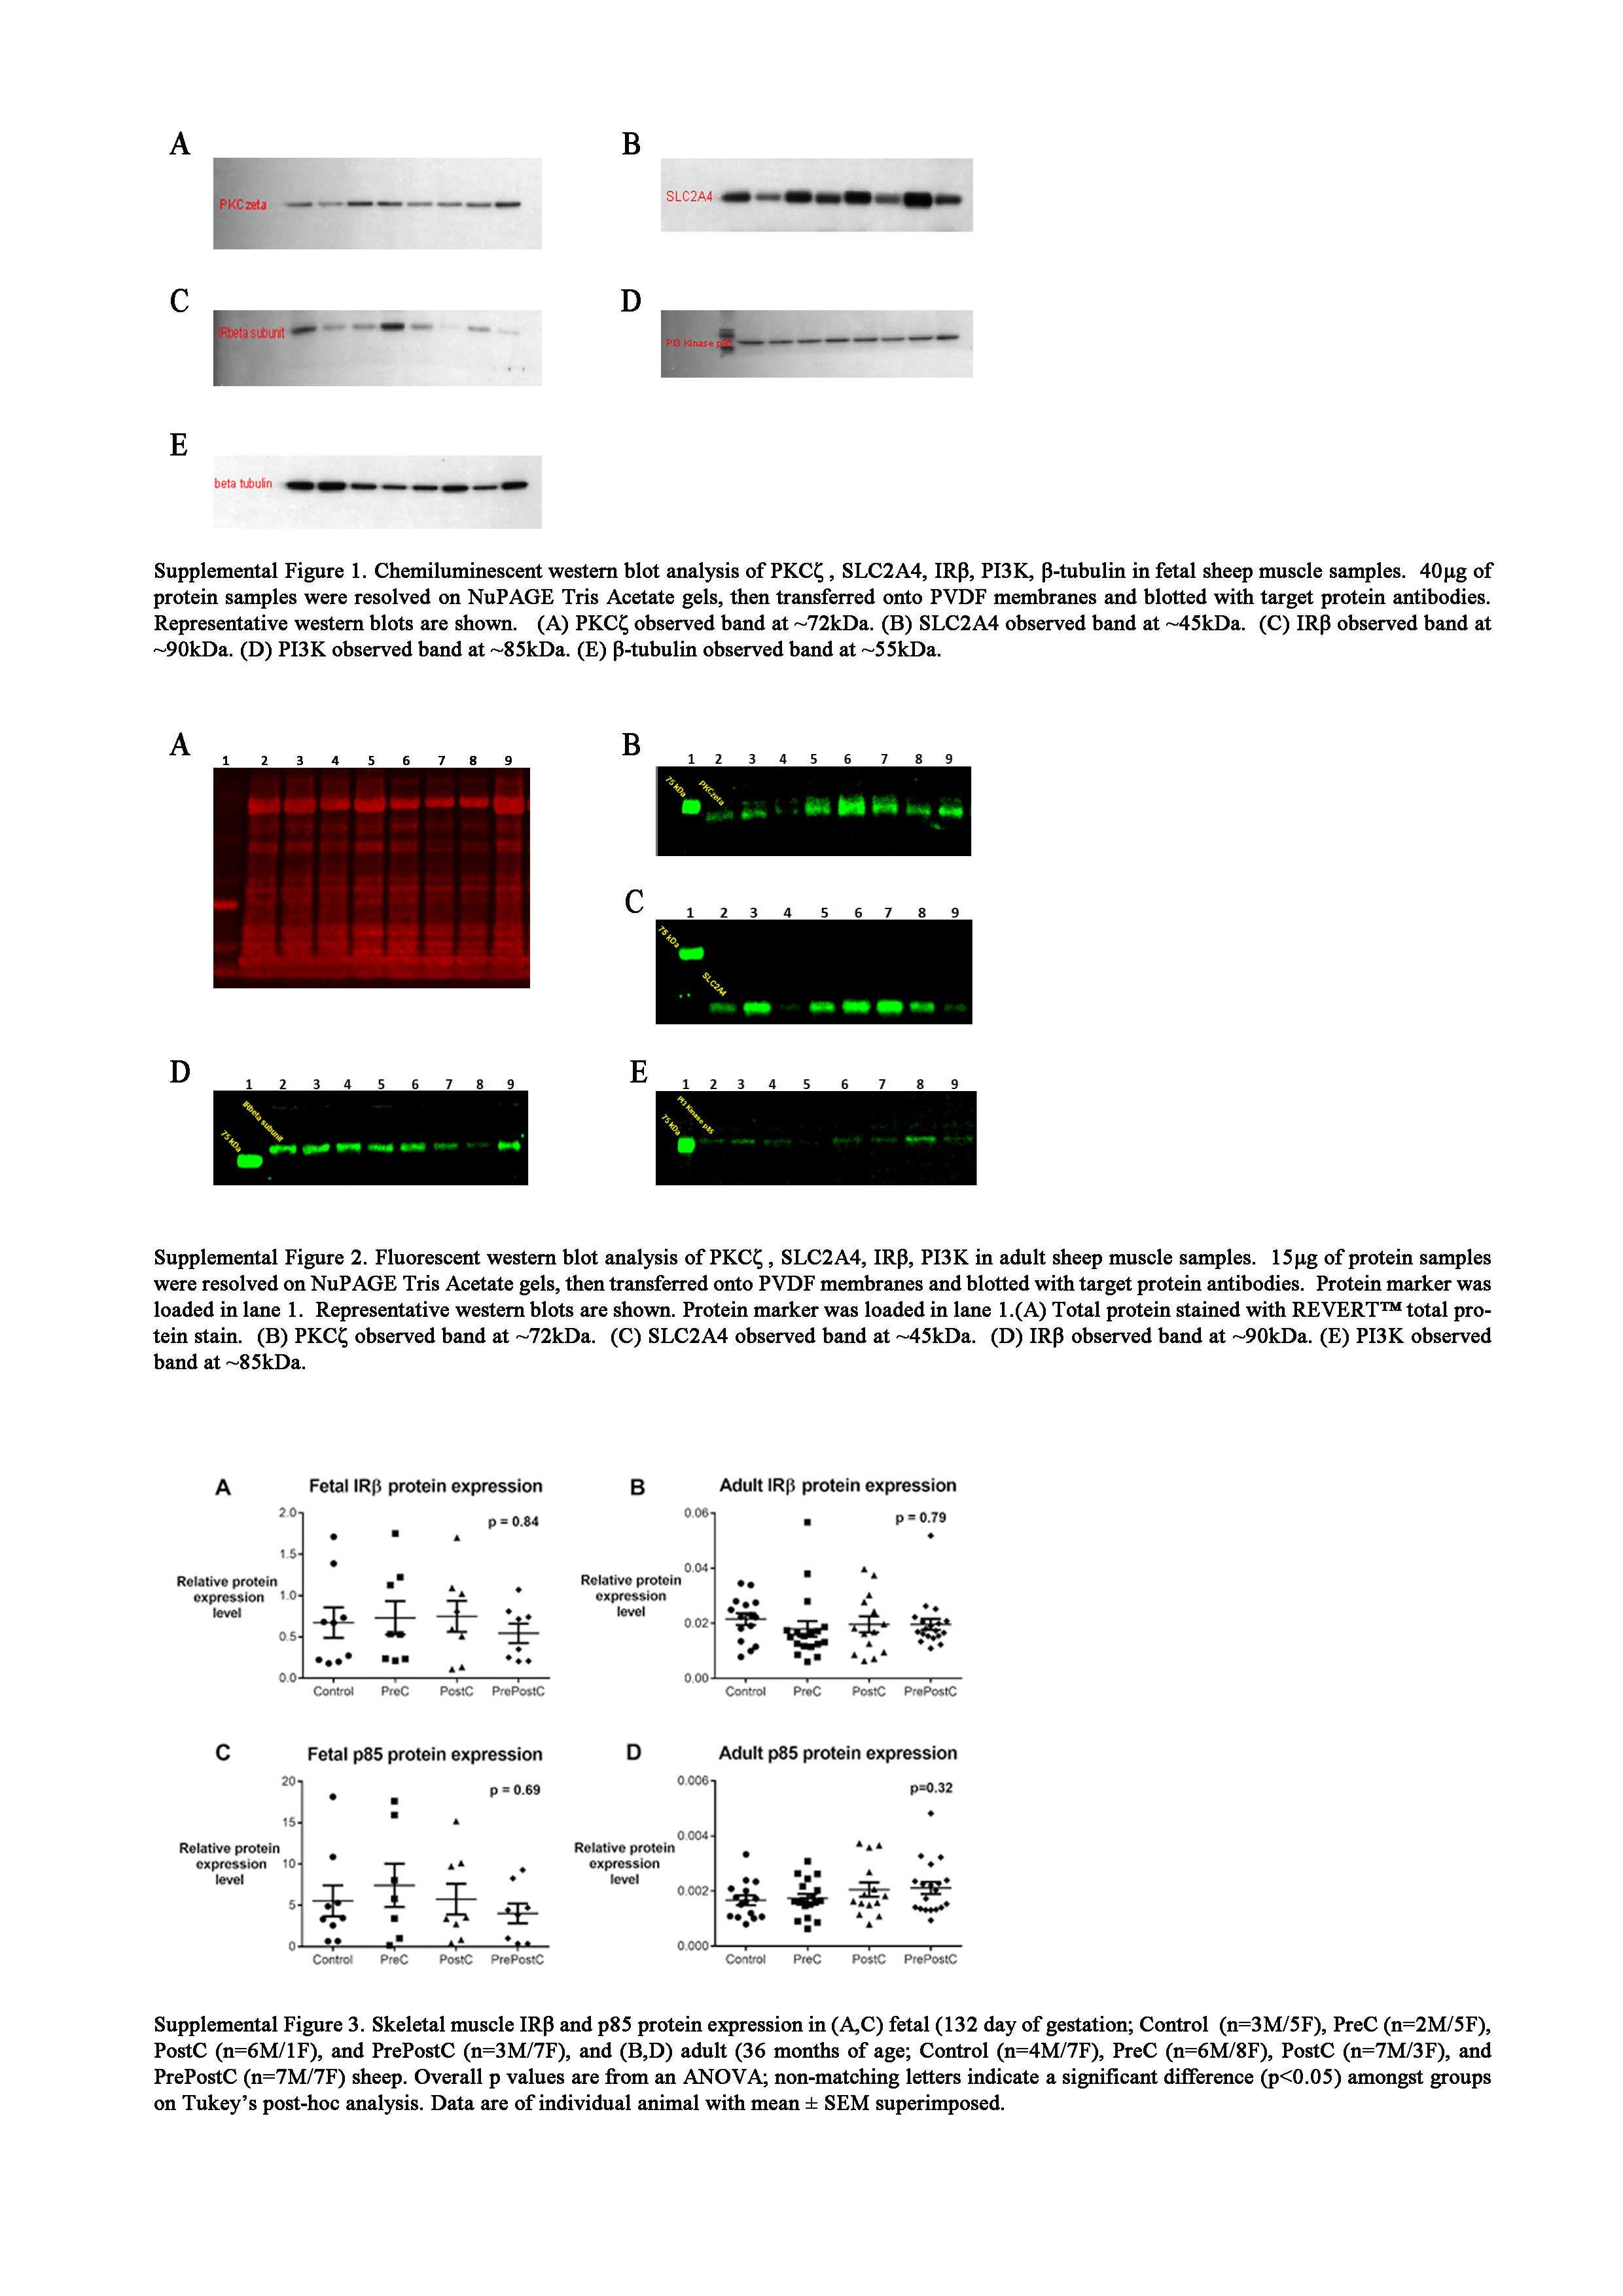
Briefly, muscle tissues were ground into powder and homogenized in lysis buffer containing 50 mM Tris, 150 mM NaCl, 1 mM EDTA, 1 mM EGTA, 1% Triton X-100, 0.5% sodium deoxycholate, 0.1% SDS, 1x Halt Protease Inhibitor Cocktail (Thermofisher Scientific). Protein samples (40 μg for fetal samples and 15 μg for adult) were resolved on NuPAGE Tris-Acetate gels (Invitrogen NuPAGE system) and transferred onto LF PVDF membranes (Millipore). An identical control sample was loaded on each gel and used to correct for intermembrane variability.
For fetal samples, membranes were incubated overnight at 4°C with the following primary antibodies: rabbit insulin receptor beta (IRβ) subunit in 1:500 dilution (Santa Cruz, Cat#sc711); phosphoinositide 3-kinase (PI3K) p85 subunit in 1:1000 dilution (Millipore, Cat#ABS234); protein kinase C zeta (PKCζ) in 1:1000 (Santa Cruz, Cat#sc216); SLC2A4 in 1:1500 (Abcam, Cat#33780), and β-tubulin in 1:2000 (Cell Signaling, Cat#2128), followed by incubation of secondary antibody chicken anti-rabbit horseradish peroxidase conjugate1:10,000 (Abcam, Cat#6829) for 1 h at room temperature. Protein signals were detected using SuperSignal West Dura Extended Duration Substrate (Pierce) according to the manufacturer’s instructions and exposed to Curix Ortho HTG X-ray film (Koru Medical Ltd). Densitometric analysis was performed on a GS800 Calibrated Densitometer (Bio-Rad, Hercules, CA, USA) using the Quantity One Software (Bio-Rad). The optical density of the bands reflects protein expression levels. The expression of the target protein was normalized to β-tubulin expression in the same lane, and intermembrane variability was corrected for using the intermembrane control.
After transfer, for total protein detection, the membranes were stained using REVERT™ total protein stain kit (LI-COR Biosciences) according to the manufacturer’s instructions, and signals were visualized using the 700-nm channel of the Odyssey® Fc imaging system (LI-COR Biosciences). Membranes were then incubated overnight at 4°C with the same primary antibodies and dilutions as used for fetal samples, followed by incubation of secondary antibody IRDye® 800CW Donkey anti-Rabbit IgG antibody 1:15,000 (LI-COR Biosciences, Cat#32210) for 1 h at room temperature. Fluorescent intensity was then visualized using 800-nm channel of the Odyssey® Fc imaging system (LI-COR Biosciences). Fluorescent intensity levels correspond to protein expression levels and were quantified using the Image Studio™ Lite (LI-COR Biosciences). Target protein expression was normalized to total protein in the same lane, and intermembrane variability was corrected for using the intermembrane control. Where numbers for Western blots differ from physiological data, this is due to either poor quality samples (defined as outliers beyond 2 SD from the mean) or loss of (adult) samples due to freezer storage issues.
Statistical analysis
From the GTTs and HGC data, we calculated blood glucose concentration 5 min post-dextrose bolus (FBGC), maximum glucose concentration (PeakG), maximum insulin concentration (PeakI), area under the curve (AUC), FIR (first 20 min of HGC), steady-state insulin secretion (SIR, last hour of HGC), arginine challenge (AC, insulin response to arginine), insulin sensitivity (SI), and disposition index (DI) as described previouslyReference Bansal, Bloomfield and Connor18. Briefly, SIR (ng·kg−1·min−1) was calculated from the plasma insulin concentration during the last hour of the HGC. SI (µmol·ml·kg−1 min−1·ng−1) was calculated during the last hour of steady state by dividing the mean glucose intake (µmol·kg−1·min−1) by the mean plasma insulin concentration (ng·ml−1). DI (µmol kg−1 min−1) was calculated as posthepatic insulin secretion rate (ng·kg−1·min−1) multiplied by SI. Data are presented as mean (SEM), or median (interquartile range; IQR) as appropriate. We analyzed GTT, HGC, and Western blotting data using two-way analysis of variance (ANOVA) with group and sex as interaction terms, and multiple comparisons Tukey’s post hoc test to determine statistical differences among groups. Nonparametric data were log-transformed to approximate a normal distribution if possible; else data were analyzed by the Wilcoxon test. A P value <0.05 was considered statistically significant.
Results
Body weight
Late gestation (132 d) fetal body weights tended to be lower in PreC, but the difference was not significant (Control, 4.3 ± 2; PreC, 3.9 ± 2; PostC, 4.5 ± 2; PrePostC, 4.3 ± 1 kg, P < 0.1); no sex differences were detected. Full fetal morphometry from these animals has been published previouslyReference Rumball, Bloomfield, Oliver and Harding11. There were no differences in body weight between the groups at time of adult testing (36 months), but males were heavier than females (Control, 92 ± 5 vs. 85 ± 3; PreC, 95 ± 3 vs. 83 ± 2; PrePostC, 94 ± 3 vs. 84 ± 2; PostC, 97 ± 3 vs. 84 ± 2 kg, males vs. female, respectively, P < 0.001). See Jaquiery et al. 2012 for detailed postmortem dataReference Jaquiery, Oliver, Honeyfield-Ross, Harding and Bloomfield20.
Glucose tolerance (ivGTT)
Glucose AUC was similar in PostC and PrePostC, which were greater than in PreC and Controls, although only statistically significant for the PrePostC versus Control post hoc comparison (Fig. 1, Table 1). Females had higher glucose AUC than males (females: 1050 ± 22, males: 995 ± 23 mmol L−1 min−1; P < 0.05). During the HGC, there was trend toward higher FBGC in all three undernourished groups compared to Control (P = 0.09) (Table 2).

Fig. 1. Glucose tolerance test curves. (A) GTT plasma glucose concentration, (B) plasma insulin concentration, and (C) insulin:glucose ratio values at 36 months of age. P values refer to the group effect on one-way ANOVA on areas under the curve. Data are mean ± SEM.
Table 1. Glucose tolerance test data in 36-month-old offspring

Mothers fed maintenance feed (Control, 5M/ 10F), undernourished from 61 d before until mating (PreC, 10M/10F), undernourished from 2 d before until 30 d after mating (PostC, 11M/5F), and undernourished from 61 d before until 30 d after mating (PrePostC, 8M/9F).
G, plasma glucose concentration; I, plasma insulin concentration; AUC, area under the curve.
Data were analyzed with two-way ANOVA, groups and sex as co-variates, followed by Tukey’s post hoc test on normally distributed data after using appropriate transformation where necessary. Values are mean with SEM of raw data, and groups not represented by the same letter are significantly different on post hoc analysis (P < 0.05).
Table 2. Hyperglycemic clamp data in 36-month-old offspring
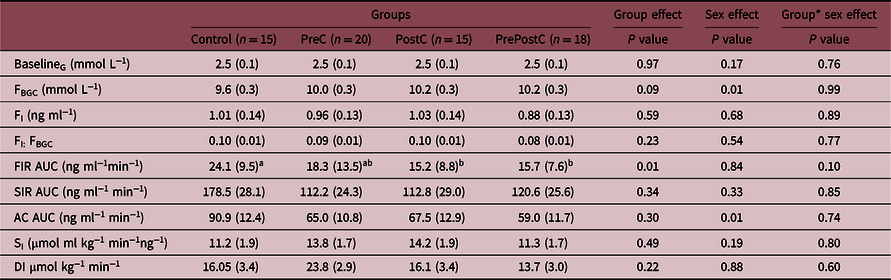
Mothers fed maintenance feed (Control, 5M/ 10F), undernourished from 61 d before until mating (PreC, 10M/10F), undernourished from 2 d before until 30 d after mating (PostC, 10M/5F), and undernourished from 61 d before until 30 d after mating (PrePostC, 9M/9F).
G, blood glucose concentration; FBGC, blood glucose concentration 5 min post-dextrose bolus; FI, plasma insulin concentration 5 min post-dextrose bolus; AUC, area under the curve; FIR, first-phase insulin response during the 0–20 min of the HGC; SIR, steady-state insulin response during 75–135 min of the HGC; SI, Insulin sensitivity; AC, arginine challenge; DI, disposition index.
Data were analyzed by two-way ANOVA, group and sex as co-variates, followed by Tukey’s post hoc test on normally distributed data after using appropriate transformation where necessary. Values are mean with SEM of raw data, and groups not represented by the same letter are significantly different on post hoc analysis (P < 0.05). Note: values for FIR AUC were not normally distributed even after transformation and therefore are presented as median (IQR) and were analyzed with the Wilcoxon test.
Insulin secretion and insulin sensitivity
During the ivGTT, insulin:glucose ratio tended to be lower in PostC and PrePostC compared to PreC and Controls (P = 0.07) (Fig. 1). This was associated with significantly lower FIR AUC in PostC and PrePostC compared to Controls during the HGC (Fig. 2, Table 2). PreC FIR AUC was intermediate between Controls and the two postconception UN groups (Fig. 2, Table 2). SI was not different among groups (Table 2). Overall, males had lower insulin:glucose AUC (males: 0.17 ± 0.01, females: 0.20 ± 0.01, P < 0.05) and AC AUC (males: 49.14 ± 7.94, females: 82.40 ± 7.84 ng ml−1 min−1; P < 0.05) than females.

Fig. 2. Hyperglycemic clamp (HGC) blood glucose and plasma insulin concentrations. Blood glucose (open symbols) and plasma insulin concentrations (closed symbols) during a HGC and arginine challenge at 36 months of age. Dotted line shows BGC of 10 mmol L−1. Arrow indicates time of arginine administration. P values are the group effect on one-way ANOVA on areas under the curve for first-phase insulin response during 0–20 min of the HGC, steady-state insulin response during 75–135 min of the HGC, and insulin response on an arginine challenge. Data are mean ± SEM.
Insulin signalling protein expression in skeletal muscle
At 36 months of age, SLC2A4 protein expression in skeletal muscle was reduced by ~40% in both PostC and PrePostC compared with Control (Fig. 3, Supplemental Figures S1, S2, and S3), with PreC values intermediate between Controls and the two postconception UN groups (Fig. 3). Adult skeletal muscle PKCζ protein expression also tended to be reduced in all three PCUN groups compared to Controls (Fig. 3, P = 0.07). The protein expression of IRβ and p85 were similar among groups in both adults and fetuses (Supplemental Figure S3). In fetuses, the pattern of SLC2A4 protein expression in skeletal muscle was reversed with an increase by 19% in PostC and by 58% in PrePostC compared with Controls, whereas PreC was not different from Controls (Fig. 3). Fetal skeletal muscle PKCζ protein expression in PrePostC tended to be increased compared with other three groups (Fig. 3, P = 0.09).

Fig. 3. Skeletal muscle SLC2A4 and PKCζ protein expression in (A, C) fetal (132 d of gestation; Control (n = 3 M/5F), PreC (n = 2M/5F), PostC (n = 6M/1F), and PrePostC (n = 3M/7F), and (B, D) adult (36 months of age; Control (n = 4M/7F), PreC (n = 6M/8F), PostC (n = 7M/3F), and PrePostC (n = 7M/7F) sheep. Overall, P values are from an ANOVA; nonmatching letters indicate a significant difference (P < 0.05) among groups on Tukey’s post hoc analysis. Data are of individual animals with mean ± SEM superimposed.
Discussion
It is well established that maternal undernutrition during pregnancy is associated with increased risk of metabolic dysregulation and noncommunicable diseases such as diabetes in offspring. Accumulating evidence also suggests that maternal nutritional status in early pregnancy, including the period around the time of conception, is particularly important. We and others have previously reported that in sheep maternal PCUN increases fetalReference Oliver, Hawkins, Breier, Van Zijl, Sargison and Harding10,Reference Rumball, Bloomfield, Oliver and Harding11 and neonatalReference Smith, McAuliffe, Quinn, Lonergan and Evans12 insulin response to glucose, but these changes are reversed at older ages, with reduced insulin response to glucose and IGT as early as 4 months (postweaning)Reference Nicholas, Morrison and Rattanatray21 and 10 months of age (postpuberty)Reference Todd, Oliver, Jaquiery, Bloomfield and Harding13. However, the long-term effects remain unknown. In the current study, we report that these effects of PCUN on glucose–insulin axis in sheep persist into mid-adulthood (36 months of age), with maternal undernutrition during the immediate postconception period having the most marked effect. The 36 months old offspring of ewes undernourished after conception alone or undernourished both before and after conception had reduced insulin secretion and IGT compared to offspring of ewes undernourished before conception alone or fed normally around conception.
Consistent with these physiological observations, we found that skeletal muscle SLC2A4 protein expression levels also reversed from increased in fetal life to decreased in adulthood. Blood glucose homeostasis is influenced by the capacity for glucose uptake into insulin-sensitive peripheral tissuesReference Taniguchi, Emanuelli and Kahn22, particularly skeletal muscle which is responsible for the majority (~80%) of postprandial glucose uptake from the circulationReference Klip and Paquet23,Reference DeFronzo and Tripathy24 via the insulin-sensitive glucose transporter SLC2A4Reference Huang and Czech25. Consistent with our previous findings of lower fetal BGCs in late gestation after maternal PCUNReference Rumball, Bloomfield, Oliver and Harding11, we observed increased SLC2A4 protein expression levels in skeletal muscle of PostC and PrePostC fetuses compared to Controls in the current study. However, Nicholas et al. reported impaired glucose uptake and reduced protein expression of SLC2A4 in the skeletal muscle of 4 months old female, but not male, lambs born to ewes undernourished (70% metabolizable energy requirements) from 1 month before until 1 week after conception compared with lambs born to well-nourished ewesReference Nicholas, Morrison and Rattanatray21. Consistent with these findings, in the current study, we found increased glucose concentrations and decreased SLC2A4 protein expression levels in skeletal muscle of PostC and PrePostC offspring compared to Controls in adulthood (36 months of age).
Insulin signalling plays a critical role in regulation of SLC2A4Reference Huang and Czech25,Reference Saltiel and Kahn26 , including via key insulin signalling proteins: IRβ, p85, and PKCζReference Huang and Czech25–Reference Farese, Sajan and Standaert27. We observed no differences in skeletal muscle IRβ and p85 protein expression levels among groups in fetal or adult life. However, protein expression of PKCζ, which is involved in the translocation of SLC2A4 to the cell membrane prior to activationReference Saltiel and Kahn26,Reference Farese, Sajan and Standaert27 , tended to be increased in skeletal muscle of fetuses and reduced in adults in both PostC and PrePostC groups compared to Controls. These findings also suggest that maternal PCUN increases skeletal muscle SLC2A4 translocation and capacity for glucose uptake in fetal offspring; effects which are reversed by adulthood.
Others have reported increased insulin response to glucose in early life but a reduced response in later life. For example, increased SI was observed in intrauterine growth-restricted fetal sheep with placental insufficiency induced by exposing pregnant ewes to high ambient temperatureReference Limesand, Rozance, Zerbe, Hutton and Hay28, in early postnatal life in offspring from protein-malnourished rat damsReference Ozanne, Wang, Coleman and Smith29, in 10 weeks old lambs of undernourished ewesReference Smith, McAuliffe, Quinn, Lonergan and Evans12, and in lambs that were growth restricted in utero by placental restriction (removal of endometrial caruncles)Reference De Blasio, Gatford, McMillen, Robinson and Owens30. In contrast, adult men with lower birth weight have reduced intracellular signalling of skeletal muscle protein kinases that regulate insulin action and lower glucose transporter concentrationsReference Ozanne, Jensen, Tingey, Storgaard, Madsbad and Vaag31. Similar findings were reported in 4 months old lambsReference Nicholas, Morrison and Rattanatray21 and adult ratsReference Ozanne, Wang, Coleman and Smith29 born to undernourished mothers. Previously, we have reported that there is precocious activation of both the fetal glucose–insulinReference Oliver, Hawkins, Breier, Van Zijl, Sargison and Harding10 and hypothalamo–adrenal axesReference Bloomfield, Oliver and Hawkins32 after maternal PCUN, presumably resulting in improved likelihood of survival, especially if birth is pretermReference Bloomfield, Oliver and Hawkins33, and we suggested that this adaptation may lead to adverse consequences in later life. This was supported by findings of altered glucose–insulin axis function and impaired cortisol secretion in response to arginine vasopressin+corticotropin releasing hormone challenge in postpubertal 10 and 18 months old sheep born to PCUN ewesReference Oliver, Bloomfield, Jaquiery, Todd, Thorstensen and Harding34.
Consistent with but extending these previous findings, here we report here increased capacity of glucose uptake in fetal skeletal muscle that is then reduced by adulthood and is associated with IGT and reduced insulin response to glucose in 36-month-old adult offspring of PCUN ewes. Taken together, these findings support the growing body of evidence that early-life adaptive responses to maternal PCUN may increase the risk of impaired glucose–insulin axis function later in life. Furthermore, the insulin response to glucose was even further reduced at 36 months compared to our findings at 10 months of ageReference Todd, Oliver, Jaquiery, Bloomfield and Harding13, suggesting that maternal PCUN results in continuing reduction in insulin response to glucose over time.
We also observed that timing of undernutrition around conception impacts upon offspring glucose–insulin axis in adulthood. The glucose response to ivGTT of adult offspring of ewes that were exposed to undernutrition from 61 d prior to mating but which were well nourished from mating (PreC) were comparable to Control, whereas ewes exposed to undernutrition across the mating period (PrePostC and PostC) were comparable to each other, although only PrePostC were statistically different from Controls. This may be partly because of higher variability observed in PostC than PrePostC. Nevertheless, these findings suggest that maternal undernutrition immediately after conception has a greater impact on long-term metabolic regulation of the offspring than maternal undernutrition before conception.
We found that adult male sheep have lower insulin response to glucose and reduced maximal insulin secretory capacity than females. However, this sex-specific effect did not interact with the effects of PCUN, and we did not observe any sex-specific differences among the groups. This may be because we did not have sufficient numbers of each sex in each group to detect small differences. Nevertheless, our observation of altered glucose homeostasis in adult males is consistent with our previous report of increased fat massReference Jaquiery, Oliver, Honeyfield-Ross, Harding and Bloomfield20 and reduced spontaneous locomotionReference Donovan, Hernandez and Matthews35 in 36 months offspring of PCUN ewes compared to Controls. Increased fat mass and impaired glucose homeostasis are common characteristics of metabolic syndrome, suggesting that male offspring of PCUN ewes may have greater risk of developing metabolic syndrome later in life than females.
Conclusions
Maternal PCUN, and particularly undernutrition immediately postconception, was associated with increased insulin response to glucose and increased protein expression of key skeletal muscle insulin signalling proteins in fetal life, potentially reflecting compensatory changes in response to early reduced nutrient supply. By adulthood, this effect was reversed, and offspring of undernourished mothers had reduced insulin secretion, reduced insulin signalling protein in skeletal muscle, and IGT. Thus, we provide novel evidence that maternal undernutrition immediately postconception has long-lasting consequences for the metabolic health of the offspring.
Supplementary material
To view supplementary material for this article, please visit https://doi.org/10.1017/S2040174420001063
Acknowledgments
The authors would like to thank Gregg Pardoe, Maggie Worthington, Basil Koberstein, and Travis Gunn for their assistance in caring for the sheep, and Chris Keven for assistance with the laboratory work.
Funding
This study was supported by grants from the Health Research Council of New Zealand, Lottery Health Research, and Gravida: National Centre for Growth and Development.
Disclosure Statement
The authors have nothing to disclose.