


The onset of lactation exposes dairy cows to various metabolic challenges (reviewed by Gross and Bruckmaier, Reference Gross and Bruckmaier2019a). Among these challenges the imbalance between energy intake and expenditure in early lactation is most critical because dairy cows undergo a state of negative energy balance (NEB), which leads to an often dramatic catabolic metabolic and endocrine status at simultaneously high milk production (Butler et al., Reference Butler, Marr, Pelton, Radcliff, Lucy and Butler2003; Gross et al., Reference Gross, van Dorland, Bruckmaier and Schwarz2011a). The prerequisite for this status is a temporary prioritization of nutrients towards the mammary gland independent of homeostatic regulatory mechanisms by insulin and other endocrine systems in early lactation (Bauman and Currie, Reference Bauman and Currie1980; Bruckmaier and Gross, Reference Bruckmaier and Gross2017; Gross and Bruckmaier, Reference Gross and Bruckmaier2019a). Particularly, the availability of glucose for other than mammary tissues is reduced along with decreased insulin and elevated growth hormone concentrations, which enhances lipolysis in adipose tissue and results consequently in greater concentrations of non-esterified fatty acids (NEFA) and β-hydroxybutyrate (BHB) in the bloodstream (Contreras et al., Reference Contreras, Strieder-Barboza and Raphael2017; van der Kolk et al., Reference van der Kolk, Gross, Gerber and Bruckmaier2017; Gross and Bruckmaier, Reference Gross and Bruckmaier2019a). Until the energy balance is restored, dairy cows are exposed to an increased risk of infectious and metabolic diseases (Ingvartsen et al., Reference Ingvartsen, Dewhurst and Friggens2003; Mulligan and Doherty, Reference Mulligan and Doherty2008).
Ketosis, a mostly transient metabolic disorder originating mainly from the incomplete oxidation of NEFA in the liver, is characterized by elevated concentrations of ketone bodies (acetoacetate, acetone, and BHB) in body fluids (Schultz, Reference Schultz1968; Duffield et al., Reference Duffield, Lissemore, McBride and Leslie2009). Besides the decline in feed intake and milk production (Laeger et al., Reference Laeger, Metges and Kuhla2010), the signs of subclinical ketosis (SCK) are subtle, but the impact of SCK can trigger the development of further health issues associated with reduced animal performance, such as clinical ketosis (CK; Suthar et al., Reference Suthar, Canelas-Raposo, Deniz and Heuwieser2013), displaced abomasum (LeBlanc et al., Reference LeBlanc, Leslie and Duffield2005; Ospina et al., Reference Ospina, Nydam, Stokol and Overton2010), metritis (Galvão et al., Reference Galvão, Flaminio, Brittin, Sper, Fraga, Caixeta, Ricci, Guard, Butler and Gilbert2010), retained placenta and lower conception rates (Chapinal et al., Reference Chapinal, LeBlanc, Carson, Leslie, Godden, Capel, Santos, Overton and Duffield2012; LeBlanc, Reference LeBlanc2012), and an elevated risk for mastitis due to the impairment of the innate immune function of the mammary gland (Zarrin et al., Reference Zarrin, Wellnitz, van Dorland and Bruckmaier2014; Hillreiner et al., Reference Hillreiner, Flinspach, Pfaffl and Kliem2016), all increasing the likelihood of culling (Seifi et al., Reference Seifi, LeBlanc, Leslie and Duffield2011). The average prevalence of CK and SCK in the first three weeks of lactation in dairy herds varies between 20 and 41% (Suthar et al., Reference Suthar, Canelas-Raposo, Deniz and Heuwieser2013; Berge and Vertenten, Reference Berge and Vertenten2014; Brunner et al., Reference Brunner, Canelas Raposo, Groeger, Bruckmaier and Gross2019), causing considerable economic losses for dairy farmers (Raboisson et al., Reference Raboisson, Mounié, Khenifar and Maigné2015).
Currently, the gold standard for SCK and CK diagnosis is the measurement of BHB in blood. However, it is an invasive method requiring extra labour and instructed persons, and not suitable for frequent sampling to allow an early detection of animals at risk. Milk that is non-invasively and frequently obtained (i.e. 2 to 3 times daily) is a favourable medium, especially with regard to established routine analysis of milk components (Gross and Bruckmaier, Reference Gross and Bruckmaier2019b). The intense lipid mobilization after parturition results in an increase in milk fat and decrease in milk protein contents. Thus, an elevated fat to protein ratio (FPR) has a positive correlation with metabolic load in dairy cows (Heuer et al., Reference Heuer, Schukken and Dobbelaar1999; Buttchereit et al., Reference Buttchereit, Stamer, Junge and Thaller2010; Gross et al., Reference Gross, van Dorland, Bruckmaier and Schwarz2011a). Based on milk recording data, the milk FPR represents a practical method to indicate cows at risk for SCK, albeit sensitivity and specificity are not very high (Duffield et al., Reference Duffield, Kelton, Leslie, Lissemore and Lumsden1997).
Fourier-transform mid-infrared spectrometry (FTIR) is an indirect and non-destructive detection method used worldwide since years to reliably determine milk gross composition (fat, protein, and lactose; De Marchi et al., Reference De Marchi, Toffanin, Cassandro and Penasa2014; Overton et al., Reference Overton, McArt and Nydam2017). Due to its low-cost and fast output of results and the increase in computing capacity, the interest in using mid-infrared (MIR) spectra wavelengths for estimating health traits by measuring milk characteristics has sparked (de Roos et al., Reference de Roos, van den Bijgaart, Hørlyk and de Jong2007; Grelet et al., Reference Grelet, Bastin, Gelé, Davière, Johan, Werner, Reding, Fernandez Pierna, Colinet, Dardenne, Gengler, Soyeurt and Dehareng2016). In the past few years, a considerable number of articles with focus on milk MIR spectra has been published, varying from their potential application in prediction of methane emissions (Dehareng et al., Reference Dehareng, Delfosse, Froidmont, Soyeurt, Martin, Gengler, Vanlierde and Dardenne2012), cheese making characteristics (De Marchi et al., Reference De Marchi, Fagan, O'Donnell, Cecchinato, Dal Zotto, Cassandro, Penasa and Bittante2009; McDermott et al., Reference McDermott, Visentin, De Marchi, Berry, Fenelon, O'Connor, Kenny and McParland2016), individual fatty acids (Soyeurt et al., Reference Soyeurt, Dardenne, Dehareng, Lognay, Veselko, Marlier, Bertozzi, Mayeres and Gengler2006; Maurice-Van Eijndhoven et al., Reference Maurice-Van Eijndhoven, Soyeurt, Dehareng and Calus2013), protein composition (Rutten et al., Reference Rutten, Bovenhuis, Heck and van Arendonk2011), feed intake (Wallén et al., Reference Wallén, Prestløkken, Meuwissen, McParland and Berry2018), to cow's energy status (McParland et al., Reference McParland, Banos, Wall, Coffey, Soyeurt, Veerkamp and Berry2011; Grelet et al., Reference Grelet, Bastin, Gelé, Davière, Johan, Werner, Reding, Fernandez Pierna, Colinet, Dardenne, Gengler, Soyeurt and Dehareng2016). Although recent publications suggest FTIR spectrometry a valuable tool for monitoring hyperketonemia (de Roos et al., Reference de Roos, van den Bijgaart, Hørlyk and de Jong2007; van Knegsel et al., Reference van Knegsel, van der Drift, Horneman, de Roos, Kemp and Graat2010; Grelet et al., Reference Grelet, Bastin, Gelé, Davière, Johan, Werner, Reding, Fernandez Pierna, Colinet, Dardenne, Gengler, Soyeurt and Dehareng2016; Chandler et al., Reference Chandler, Pralle, Dórea, Poock, Oetzel, Fourdraine and White2018), most of the studies showing results on milk BHB and acetone based on MIR spectra included a considerable number of animals with blood BHB concentrations above the thresholds for SCK and CK diagnosis.
The primary aim of this study was to evaluate the suitability of MIR spectra-predicted acetone and BHB in milk for early detection of elevated blood BHB concentrations in individual cows or at herd level. Special attention is put on the relevance for the detection of individual cow SCK in small scale dairy farms under consideration of the low sampling frequency (approx. once/month) within the regular DHI recordings.
Materials and methods
Experimental procedures followed the guidelines of the Swiss Law on Animal Protection and were approved by the Veterinary Offices of the involved cantons.
Experiment 1 – field trial
Between April 2016 to May 2017, blood and milk samples from 210 dairy cows were taken concomitantly every 2 weeks from calving until approximately 125 d post-partum and once at around 200 d in milk (nine samples per cow) from three different breeds: Holstein (n = 80), Brown Swiss (n = 72) and Swiss Fleckvieh (Simmental × Red Holstein; n = 58). From each breed two farms were enrolled. More detailed information on animals and farms are presented in online Supplementary Table S1. At each sampling we collected 9 mL of blood (obtained approximately one hour after the morning milking) from the coccygeal vein into a tube containing EDTA (Vacuette EDTA blood collection tubes, Greiner Bio-One GmbH, 4550 Kremsmuenster, Austria) and 100 mL of milk from the morning milking (50 mL with a tablet preservative containing a combination of Bronopol and Natamycin (Broad Spectrum Microtabs II), and 50 mL stored at −20°C for later analysis), both immediately placed on ice until further processing. In total, we obtained 1,766 blood and milk samples in parallel. Blood was centrifuged at 2,500 × g (4°C, 20 min) and the harvested plasma was stored at −20°C until analysis. Data on milk yield were obtained from the official DHI milk recordings during the sampling period.
Experiment 2 – clinical ketosis cases
Data of 474 cows (66 Holstein, 408 Brown Swiss) diagnosed with CK by veterinarians during the first 60 d post-partum were obtained from the central database of Qualitas AG (Zug, Switzerland). Data included the date of CK diagnosis relative to parturition, and results of the previous DHI recording with MIR spectra-predicted acetone and BHB concentrations in milk. These results were contrasted with the measurements of MIR spectra-predicted BHB and acetone in milk of 420 control samples from experiment 1 (cows without SCK, blood BHB concentration at sampling <1.0 mmol/l, similar date of sampling relative to parturition compared with the DHI recordings, similar proportion of Brown Swiss and Holstein milk samples) to investigate if deviations in milk composition would allow prediction of CK prior to the diagnosis of a veterinarian based on clinical signs.
Experiment 3 – measurements of BHB in milk by an automatic in-line analyser on-farm
Milk BHB data from an automatic on-farm milk analysis system (Herd Navigator (HN), DeLaval, Tumba, Sweden) that frequently samples and colorimetrically measures milk BHB, were collected in three farms using robotic milking systems (Voluntary Milking System VMS, DeLaval, Tumba, Sweden). Machine settings were adjusted to measure milk BHB daily from days 4 to 21, and every 4 d from days 22 to 62 post-partum. Milk BHB concentrations greater than 0.12 mmol/l appear as an alert in the herd management software. In total, milk BHB profiles of 175 cows (Holstein, Brown Swiss, and Swiss Fleckvieh) were evaluated. In addition, 136 direct comparisons of BHB measurements in milk, both from the HN device and predicted by milk MIR spectra derived from a concomitant DHI control (11 times per year) on the same day, were conducted.
Blood and milk analyses
Blood samples were analysed for BHB with an automated analyser (Cobas Mira 2, Hoffmann-La Roche, Basel, Switzerland) using an enzymatic kit from Randox Laboratories Ltd. (Schwyz, Switzerland; kit no. RB1007). Chemical measurement of acetone concentration in milk was done on an AutoAnalyzer 3 (BRAN+LUEBBE). MIR-spectrum based measurement of fat and protein content, as well as prediction of BHB and acetone concentrations in milk were done on a MilkoScan FT 6000 analyser (FOSS, Hilleroed, Denmark) using the corresponding prediction models from FOSS (Foss, Hilleroed, Denmark).
Statistical analyses
Data analysis was performed using SAS (version 9.4; SAS Institute Inc., Cary, NC, USA). We used Pearson's correlation coefficients (CORR procedure) to investigate the relationship between blood BHB concentration, FPR in milk, the chemically determined acetone concentration in milk, and the MIR spectra-predicted milk BHB and acetone concentrations. All variables were checked for normal distribution using the UNIVARIATE procedure. Concentrations of blood BHB, MIR spectra-predicted milk BHB and acetone, and FPR required normalisation. The TRANSREG procedure was used to perform a Box-Cox transformation for each variable. The repeated measures mixed model analysis using the MIXED procedure was performed to examine the effects of breed, farm, and parity number. The individual cow was considered as repeated subject. The Tukey–Kramer post hoc test was used for detection of significances at P < 0.05.
Receiver operating characteristic (ROC) curves were created using SigmaPlot (version 12.5, Systat Software Inc., Erkrath, Germany) to calculate the accuracy of milk acetone measured chemically, FPR, MIR spectra-predicted BHB and acetone to discriminate SCK (blood BHB concentration ≥ 1.0 mmol/l) and non-SCK (blood BHB concentration <1.0 mmol/l) cows. Optimal threshold values for the variables were defined according to the greatest sum of sensitivity (Se) and specificity (Sp) values. The Se, Sp, positive predictive value (PPV) and negative predictive value (NPV) were calculated based on the optimal threshold for each variable. Data on CK diagnosis and related previous DHI recordings including MIR spectra-predicted acetone and BHB concentrations in milk were summarized by breed on a weekly basis relative to the date of CK diagnosis. Contrasting of weekly summarized milk BHB concentrations predicted from DHI samples in CK cows against appropriate controls without CK was performed by paired t-tests.
Results
Experiment 1 – field trial
Only 63 (3.6%) out of the 1,766 samples from 210 animals obtained biweekly in the field study had blood BHB concentrations ≥ 1.0 mmol/l, considered in this paper the lowest cut-point for SCK (online Supplementary Table S1). Samples with blood BHB concentrations <1.0 mmol/l were considered non-SCK. Cows classified SCK had a blood BHB concentration of 1.59 ± 0.08 mmol/l, whereas non-SCK cows averaged 0.50 ± 0.00 mmol/l (mean ± sem). The MIR spectra-predicted BHB and acetone as well as milk acetone measured chemically and FPR were also increased in SCK compared with the non-SCK group (P < 0.0001: data in online Supplementary Table S2). The distribution of the SCK samples overtime is shown in Figure 1. The incidence of SCK in cows of all breeds was detected mostly during the first eight weeks post-partum.

Fig. 1. Blood BHB concentrations in Holstein, Swiss Fleckvieh, and Brown Swiss dairy cows after parturition (n = 1,766 samples). A blood BHB concentration of 1.0 mmol/l was considered as threshold for subclinical ketosis (SCK).
In the field trial we examined effects of breed and parity, and the data are shown in online Supplementary Table S3. There was no effect of breed on blood BHB concentrations (P = 0.48) and milk acetone measured chemically (P = 0.28). However, Holstein cows had lower (P < 0.05) MIR spectra-predicted BHB and acetone than either Swiss Fleckvieh or Brown Swiss. Regarding FPR, Brown Swiss had the lowest ratio compared to similar values in Holstein and Swiss Fleckvieh. Multiparous cows (parity ≥ 2) had greater blood BHB concentrations, MIR spectra-predicted BHB and milk acetone measured chemically compared to primiparous cows. Milk yield in Holstein and Swiss Fleckvieh was higher compared to Brown Swiss (P < 0.05) and, as expected, first parity cows had a lower milk production than multiparous cows (P < 0.0001).
The correlation between blood BHB and milk MIR spectra-predicted BHB was low (r = 0.37; Fig. 2a), although significant (P < 0.0001). The optimal threshold value to differentiate SCK from non-SCK cows (calculated upon the highest sum of Se and Sp) was 0.05 mmol/l for MIR spectra-predicted BHB in milk. At this cut-off value, Se was 82.5% and Sp 77.3%. The PPV (true positive values) and NPV (true negative values) were 11.9% and 99.2%, respectively. In terms of MIR spectra-predicted acetone in milk, the overall correlation with blood BHB concentration was low (r = 0.12; P < 0.0001; Fig. 2b). With the optimal threshold of 0.05 mmol/l acetone in milk obtained from the ROC analysis, Se and Sp were 77.8 and 85.5%, while PPV and NPV were 16.6 and 99.0%, respectively. Even when MIR spectra-predicted acetone was contrasted with the concomitant chemical measures of milk acetone, the correlation was low (r = 0.12; P < 0.0001; Table 1). However, milk acetone concentrations measured chemically correlated quite well with blood BHB concentration (r = 0.69; P < 0.0001; Fig. 2c). The ROC analysis revealed an optimal threshold of 0.08 mmol/l for the chemical measures of milk acetone to predict SCK with a Se and Sp of 74.6% and 94.0%, respectively. The PPV for the chemically determined acetone content in milk was the greatest of all variables analysed (30.3%, NPV = 99.1%). The milk fat to protein ratios correlated poorly with blood BHB concentrations (r = 0.16; P < 0.0001; Fig. 2d). The optimal threshold for differentiation of SCK and non-SCK was 1.25, and Se, Sp, PPV and NPV were the lowest compared with the previous analysed variables: 54.0%, 74.6%, 7.0% and 97.7%, respectively.

Fig. 2. Relationships between blood BHB concentration and mid-infrared (MIR) spectra predicted BHB (a) and acetone (b) concentrations in milk, milk acetone measured chemically (c) and the milk fat to protein ratio (d). Data on correlation coefficients (r), number of samples (n) and respective P-values are added to the graphs.
Table 1. Pearson's correlation coefficients of blood BHB concentrations with milk ketone bodies (predicted by mid-infrared spectrometry (MIR) or chemically determined) and the milk fat to protein ratio (FPR) measured during the first 200 d post-partum

Experiment 2 – clinical ketosis cases
Holstein cows that were diagnosed with CK (n = 66) had greater MIR spectra-predicted BHB and acetone concentrations in milk (0.15 ± 0.03 mmol/l and 0.22 ± 0.04 mmol/l, respectively) compared with non-ketotic Holstein cows of similar performance and lactational stage (−0.01 ± 0.00 mmol/l and −0.03 ± 0.00 mmol/l; P < 0.05). Similar results were found in Brown Swiss cows identified with CK (n = 408), which had greater values of MIR spectra-predicted milk BHB and acetone (0.18 ± 0.01 mmol/l and 0.24 ± 0.02 mmol/l, respectively; P < 0.05) compared with respective controls (0.02 ± 0.00 mmol/l and 0.00 ± 0.01 mmol/l, respectively). The MIR spectra-predicted BHB and acetone concentrations in milk varied considerably in Brown Swiss and Holstein cows (Fig. 3) at DHI controls in the days and weeks prior to diagnosis of CK. Even on the day of CK diagnosis, the high variation of estimated ketone body concentrations in milk did not reliably indicate hyperketonemia (Fig. 3).
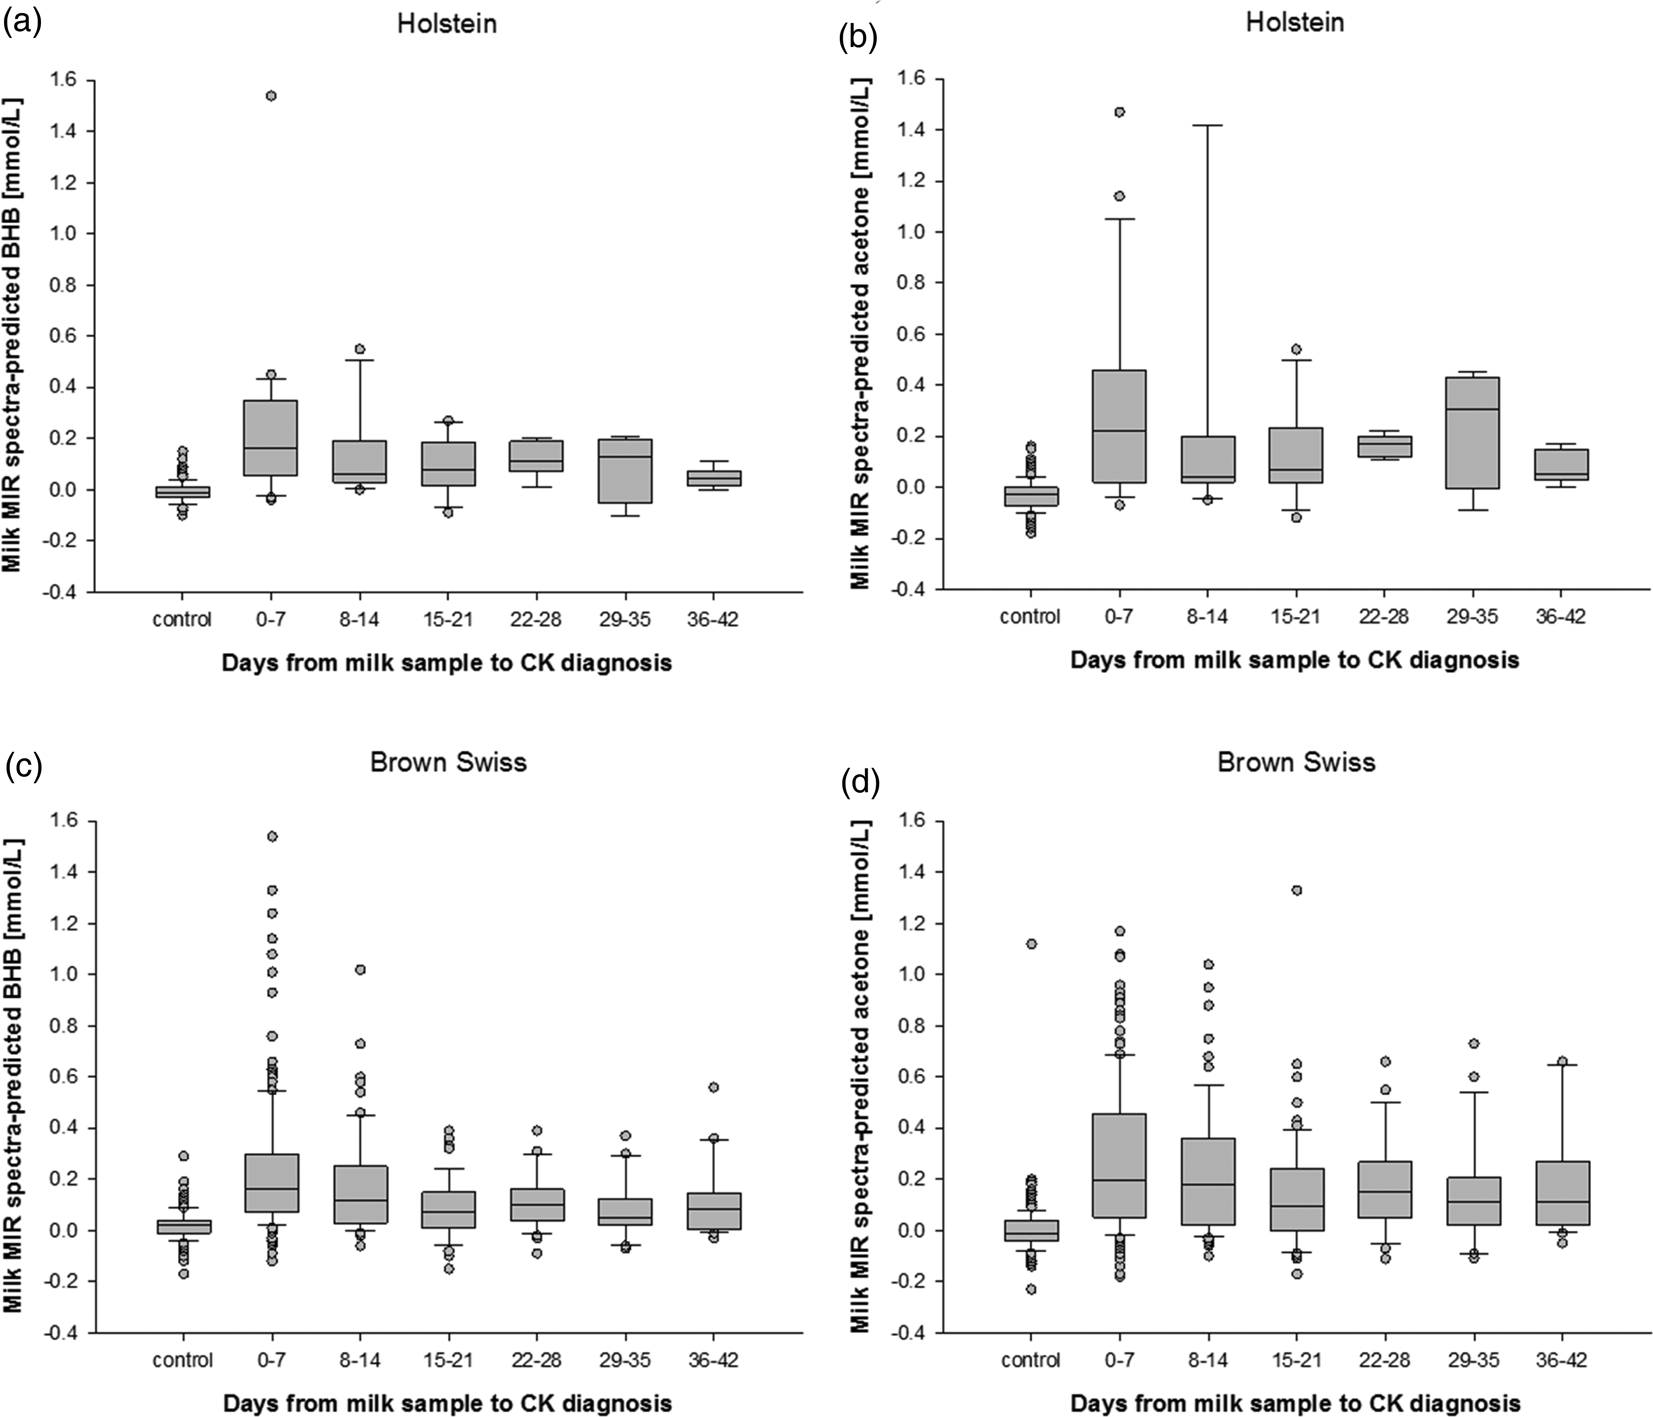
Fig. 3. Milk mid-infrared (MIR) spectra-predicted BHB and acetone concentrations in milk of Holstein (a, b, respectively) and Brown Swiss cows (c, d, respectively) and days from official DHI milk sampling to clinical ketosis (CK) diagnosis.
Experiment 3 – measurements of BHB in milk by an automatic in-line analyser on-farm
Approximately 19 d post-partum, the threshold of 0.12 mmol/l BHB in milk was exceeded for the first time when analysed across all cows in all herds. The analysis of individual milk BHB profiles based on HN measurements indicated that 15.6% of all cows had at least one milk BHB concentration greater than 0.12 mmol/l in early lactation. Milk BHB was higher than 0.12 mmol/l on three consecutive days on average.
A moderate positive correlation was found between the direct enzymatic milk BHB measurements by the on-farm analyser (Herd Navigator) and the indirect MIR spectra-predicted milk BHB content obtained from concomitantly DHI recordings on the same day (r = 0.61; P < 0.0001). However, this correlation falls to r = 0.44 (P < 0.0001) when only milk samples with BHB concentrations <0.15 mmol/l analysed by the Herd Navigator are considered. Assuming the HN alarms at milk BHB concentrations of 0.12 mmol/l as reference criterion, approximately 90% of the hyperketonemia cases would have been missed by the DHI control performed approximately only once per month.
Discussion
Fast, accurate, and non-invasive methods for early and automated detection of SCK or CK are a crucial goal in the establishment of precision dairy farming methods. Ideally, these methods would be implemented in routine procedures such as milking: in contrast to blood, milk is obtained non-invasively at each milking, and changes in milk composition closely reflect alterations in metabolic status of cows. FTIR spectrometry has doubtlessly evolved into an essential and useful tool in the routine analyses of gross milk composition (fat, protein, lactose; reviewed by Gross and Bruckmaier, Reference Gross and Bruckmaier2019b). Furthermore, diverse health and performance traits can be associated with defined regions of the milk MIR spectrum (Grelet et al., Reference Grelet, Bastin, Gelé, Davière, Johan, Werner, Reding, Fernandez Pierna, Colinet, Dardenne, Gengler, Soyeurt and Dehareng2016). Two of these traits are acetone and BHB in milk. But, ketone bodies in milk cannot be measured directly by FTIR analysis (De Marchi et al., Reference De Marchi, Toffanin, Cassandro and Penasa2014). Instead, MIR spectra are used for indirectly predicting their content, based on algorithms measuring changes in milk composition that are associated with SCK and CK (e.g., contents of milk fat, protein, composition of fatty acids in milk etc.; Gross et al., Reference Gross, van Dorland, Bruckmaier and Schwarz2011b; Gross and Bruckmaier, Reference Gross and Bruckmaier2019b). Most research on the use of milk MIR spectrometry to detect the risk of hyperketonemia has been done in larger dairy herds with Holstein cows experiencing marked metabolic stress (de Roos et al., Reference de Roos, van den Bijgaart, Hørlyk and de Jong2007; van Knegsel et al., Reference van Knegsel, van der Drift, Horneman, de Roos, Kemp and Graat2010). Rather limited data is available to assess the ability to predict SCK at the individual cow level, in cows with moderate metabolic load and of different breeds. Additionally, in small and well-managed herds, only a few cows with a considerable metabolic load can be expected to be present at the same time for a reliable detection of cows at risk for SCK.
Only a small percentage (less than 4%) of the blood samples in the present field study exceeded the threshold of BHB concentrations of 1.0 mmol/l that we used for classification of SCK. This result to some extent contradicts the averages of prevalence rates of SCK reported in Europe (22 to 41%) by Suthar et al. (Reference Suthar, Canelas-Raposo, Deniz and Heuwieser2013) and Berge and Vertenten (Reference Berge and Vertenten2014). We selected well-managed farms that are representative in terms of feeding and performance for the herd size of 40–50 dairy cows in Switzerland. However, this does not imply that SCK is not an issue for Swiss dairy cows, given the fact that variation of metabolic load between individual cows kept on the same farm can be remarkable (Kessel et al., Reference Kessel, Stroehl, Meyer, Hiss, Sauerwein, Schwarz and Bruckmaier2008; Gross and Bruckmaier, Reference Gross and Bruckmaier2015). Blood ketone bodies are established markers for poor metabolic adaptation (Zbinden et al., Reference Zbinden, Falk, Münger, Dohme-Meier, van Dorland, Bruckmaier and Gross2017; Gross and Bruckmaier, Reference Gross and Bruckmaier2019a, Reference Gross and Bruckmaier2019b) and recognised as the gold standard or reference for SCK and CK diagnosis. Our findings confirm earlier results that hyperketonemia occurs mostly during the first weeks of lactation (Duffield et al., Reference Duffield, Lissemore, McBride and Leslie2009; Gross et al., Reference Gross, van Dorland, Bruckmaier and Schwarz2011a; Gross and Bruckmaier, Reference Gross and Bruckmaier2015; Zbinden et al., Reference Zbinden, Falk, Münger, Dohme-Meier, van Dorland, Bruckmaier and Gross2017).
In contrast to findings of Urdl et al. (Reference Urdl, Gruber, Obritzhauser and Schauer2015) with Brown Swiss cows having greater blood BHB concentrations and lower milk production compared with Holstein, our results showed no breed effect on blood BHB concentrations. Primiparous cows had lower concentrations of blood BHB compared with multiparous cows. This can be attributed to the lower milk production and consequently lower metabolic load compared with multiparous animals (Lee and Kim, Reference Lee and Kim2006; McArt et al., Reference McArt, Nydam and Oetzel2012; Morales Piñeyrúa et al., Reference Morales Piñeyrúa, Fariña and Mendoza2018).
Our results revealed only a low correlation between the gold standard method of analysing blood BHB and MIR spectra-predicted BHB in milk, as well as less than 12% of true positive values indicated by the estimated milk BHB content. The correlation between blood BHB concentration and MIR spectra-predicted acetone or FPR was even lower. When BHB concentrations in blood are low, likewise less ketone bodies are expected to appear in milk. Together with the indirect assessment and estimation of milk ketones by the FTIR analysis, its suitability for SCK detection via milk is further limited in cows below the SCK threshold of ketone body concentration. Although the sensitivity in our field study was fairly good, the small number of samples correctly identified as true positive and the low correlations with the reference analysis of blood BHB discourage the use of milk MIR spectra-predicted ketone bodies to predict SCK in individual cows. Van Knegsel et al. (Reference van Knegsel, van der Drift, Horneman, de Roos, Kemp and Graat2010) reported a high sensitivity of milk BHB and acetone estimated by FTIR spectrometry in predicting SCK with similar low percentage of true positive samples (≤18%), but included cows with greater blood BHB concentrations compared with our present study. In a more recent study by Grelet et al. (Reference Grelet, Bastin, Gelé, Davière, Johan, Werner, Reding, Fernandez Pierna, Colinet, Dardenne, Gengler, Soyeurt and Dehareng2016), evaluations included samples with greater BHB and acetone contents in milk, and consequently more SCK and CK cows than ours. In our study, the closest correlation was found between the two reference methods, enzymatic measurement of BHB in blood and chemical measurement of acetone in milk.
Several authors showed a strong association of increased ketone bodies and the occurrence of CK (Nielsen et al., Reference Nielsen, Friggens, Chagunda and Ingvartsen2005; Seifi et al., Reference Seifi, LeBlanc, Leslie and Duffield2011; Suthar et al., Reference Suthar, Canelas-Raposo, Deniz and Heuwieser2013; Berge and Vertenten, Reference Berge and Vertenten2014). Although milk MIR spectra-predicted BHB and acetone were elevated in our SCK cows, interestingly, there was no increase in MIR-based estimates of ketone bodies the closer the analysed milk sample was obtained to the CK diagnosis. Even repeated and more frequent milk sampling did not improve the correlation of milk MIR spectra-predicted ketone bodies with the same day enzymatic measurement of BHB measured by the HN. However, the frequent analysis by automated in-line devices is more suited to early detection and monitoring of individual cows at risk of hyperketonemia (Nielsen et al., Reference Nielsen, Friggens, Chagunda and Ingvartsen2005) compared with monthly results provided by the DHI controls only. Depending on the time of the first DHI control post-partum, most of the metabolic adaptation responses taking place within 2–3 weeks may not be captured. As our field study showed, the elevated risk of cows to develop ketosis during early lactation requires a higher frequency of sampling though detection of cows with SCK was still scarce as indicated by MIR-based estimations of milk ketone bodies every 2 weeks.
Although our selected farms were on the upper range of current herd sizes in Switzerland, they are still small compared with farms of major milk producing countries. Assuming common herd sizes of 20–30 dairy cows in many European family operated farms, only very few animals are at a similar lactation stage on a farm. Consequently, in small herds an early detection of SCK via MIR spectra-based prediction of milk ketones using monthly DHI controls is unlikely. However, in larger dairy herds, monthly MIR spectra-predicted ketones in combination with milk components and milk fatty acids can be indicative for metabolic status at herd level, particularly in early lactation, although an indirect assessment of milk ketones by FTIR spectrometry does not seem to diagnose SCK in individual cows. Thus, management of cows at risk can be adjusted by interventions such as improved feeding, more frequent observations and earlier veterinary interventions. Large pools of datasets as created by breeding associations, combining DHI control data, veterinary treatment records, different breeds, information on cows' genotypes etc. provide a better possibility for implementing milk MIR spectra-predicted traits. Associations between predicted traits of interest and measured variables can be calculated and implemented in breeding programs (Koeck et al., Reference Koeck, Jamrozik, Schenkel, Moore, Lefebvre, Kelton and Miglior2014; Bastin et al., Reference Bastin, Théron, Lainé and Gengler2016), bearing in mind that causal relationships with physiology must be critically evaluated.
In conclusion, our study shows that the predictive value of MIR spectra-predicted concentrations of ketone bodies in milk is limited in terms of an early detection of SCK when dairy cows are experiencing a moderate metabolic load. Particularly when only a few animals at risk are present (e.g. in small herds or good management conditions) and corresponding intervals of milk sampling are rather wide, the likelihood for detecting those animals is marginal. The indirect assessment of milk ketones by FTIR spectrometry does not reliably detect hyperketonemia in individual samples, but improves if actual circulating blood BHB exceeds the thresholds of SCK and CK diagnosis. Automatic in-line analysers directly measuring BHB in milk are superior in detecting hyperketonemia due to their frequent sampling. In contrast to small dairy herds, however, MIR spectra-predicted ketones in milk can provide additional information on the metabolic status of early lactating cows in larger dairy farms.
Supplementary material
The supplementary material for this article can be found at https://doi.org/10.1017/S0022029920000230
Acknowledgements
We acknowledge the support and assistance of the participating farmers. The project was supported by Suisselab AG (Zollikofen, Switzerland), Qualitas AG (Zug, Switzerland) and the breeding associations swissherdbook (Zollikofen, Switzerland), Braunvieh Schweiz (Zug, Switzerland), and Holstein Switzerland (Posieux, Switzerland). We thank the H. Wilhelm Schaumann-Stiftung (Hamburg, Germany) for providing a scholarship to M. O. Caldeira. The expert performance of laboratory analyses by Mrs Yolande Zbinden, Veterinary Physiology, is gratefully acknowledged.


