Staphylococcus aureus is a facultative anaerobic and gram-positive foodborne pathogen, which is able to grow at 7–48·5 °C, pH 4·2–9·3 and 0–15% NaCl concentration (Bergdoll, Reference Bergdoll and Doyle1989; Schmitt et al. Reference Schmitt, Schuler-Schmid and Scmidt-Lorenz1990; Le Loir et al. Reference Le Loir, Baron and Gautier2003). Due to the wide range of these factors, Staph. aureus has been easily isolated from a variety of foods, such as milk and dairy products, meat, and chicken (Jablonski & Bohach, Reference Jablonski, Bohach, Beuchat, Doyle and Montville2001; Tamarapu et al. Reference Tamarapu, McKillip and Drake2001; Jorgensen et al. Reference Jorgensen, Mathisen, Lovseth, Omoe, Qvale and Loncarevic2005; Colombari et al. Reference Colombari, Mayer, Laicini, Mamizuka, Franco, Destro and Landgraf2007).
In the past decade, Staph. aureus has been one of the major foodborne pathogens (MFDS, 2014). In the U.K., although 95·8% of pasteurised milk cheese samples were satisfactory (<102 CFU) for microbial quality among 4437 cheese samples, 2·2% of the cheese samples were borderline (102–103 CFU), and 2·0% had unsatisfactory quality (>103 CFU), according to the recommendation of 2005/175/EC (EC, 2005; Little et al. Reference Little, Rhoades, Sagoo, Harris, Greenwood, Mithani, Grant and McLauchlin2008). In addition, 0·4% of all foodborne outbreaks in 2006 were caused by contaminated cheeses in the EU (Kousta et al. Reference Kousta, Mataragas, Skandamis and Drosinos2010). Thus, the control of Staph. aureus in various cheeses needs to be studied.
The A w of cheeses varies due to various NaCl concentrations formulated in cheeses. NaCl has been added in order to improve the flavour as well as to inhibit foodborne pathogens in cheeses. Recently, the concentration of NaCl in cheese has been lowered as a result of consumers' demand. However, the decreased NaCl concentration, resulting in increased A w, may increase the microbial risk of cheese. Therefore, the effect of A w on the microbial growth in cheese should be studied.
Predictive models have been developed by many researchers in order to predict microbial survival under various conditions, such as storage temperature, pH and A w. Moreover, predictive models have been used to predict the fates of foodborne pathogens. Primary models calculate the maximum specific growth rate (μmax), lag phase duration (λ), lower asymptote (N 0) and upper asymptote (N max) of bacteria using mathematical models (Whiting & Buchanan, Reference Whiting and Buchanan1993; Baranyi & Roberts, Reference Baranyi and Roberts1994). Secondary models describe the effect of various factors on the parameters, which were calculated by the primary models (Whiting, Reference Whiting1995).
Therefore, the objective of this study was to develop predictive models in order to evaluate the effect of storage temperatures and A w on the kinetic behaviour of Staph. aureus in cheese.
Materials and methods
Inoculum preparation
Five strains of Staph. aureus (ATCC13565, ATCC14458, ATCC23235, ATCC27664 and NCCP10826) were cultured in 10 ml tryptic soy broth (TSB; Bacto™, Becton Dickinson and Company, Sparks, MD, USA) at 35 °C for 24 h. The 0·1 ml proportions of the cultures were transferred into 10 ml fresh TSB at 35 °C for 24 h. These subcultures were then mixed and centrifuged at 1912 g and 4 °C for 15 min. The supernatant was discarded, and the cell pellet was washed twice with phosphate buffered saline (PBS, pH 7·4; 0·2 g KH2PO4, 1·5 g Na2HPO4, 8·0 g NaCl, and 0·2 g KCl in 1 l of sterile distilled water). The mixture was serially diluted with PBS in order to obtain 6 log CFU/g.
Sample preparation and inoculation
Cheddar slice cheese (no antimicrobial added) containing 0·3% NaCl was ground with a grinder (HR 1372, Philips, Amsterdam, Netherlands); subsequently, NaCl was added to the ground cheese in order to obtain A w of 0·970 (1·2%), 0·975 (1·0%), 0·983 (0·6%) and 0·991 (0·3%). These cheese samples (8 g/well) were then restructured in a 6-well microtiter plate by pressing; then, the 0·1 ml inoculum were inoculated on the surface of restructured cheeses, followed by spreading with a sterile spreader. Next, the 6-well microtiter plate was placed in polyethylene bag (Food Saver®, Rollpack, Pyeongtaek, Gyeonggi-do, Korea) and sealed by a packager (Food Guard®). The samples were then aerobically stored at 7, 15, 25 and 30 °C for 72–720 h.
Microbial analyses
The cheese samples in the 6-well microtiter plates were analysed at appropriate time intervals in order to enumerate bacterial populations. The cheese samples were aseptically transferred into a filter bag (3M™, Seoul, Korea). Then, 16 ml 0·1% buffered peptone water (BPW; Difco™, Becton Dickinson and Company) was added into the filter bag and pummelled for 120 s by a pummeler (BagMixer®, Interscience, St. Nom, France). The homogenates were then serially diluted with BPW, and 0·1 ml portions of the diluents were plated on tryptic soy agar (TSA; Difco™, Becton Dickinson and Company) and mannitol salt agar (MSA; BBL™, Becton Dickinson and Company) in order to enumerate total bacterial and Staph. aureus cell counts, respectively. The colonies were counted manually after incubation at 35 °C for 48 h.
Primary model development
The growth data of Staph. aureus on cheese, according to A w, was fitted to the Baranyi model (Baranyi & Roberts, Reference Baranyi and Roberts1994) using the DMFit (Institute of Food Research, Norwich, UK), which is an MS Excel add-in; then, the maximum specific growth rate (μmax; log CFU/g/h), lag phase duration (λ; h), lower asymptote (N 0; log CFU/g) and upper asymptote (N max; log CFU/g) were calculated. The Baranyi model is:
where N t is the Staph. aureus cell counts at time t, and N 0 and N max are the initial and maximum Staph. aureus cell counts, respectively. A t is the adjustment function, which denotes the physiological status of Staph. aureus cell in order to define the λ (Baranyi & Roberts, Reference Baranyi and Roberts1994).
Secondary model development
The secondary model was developed to evaluate the effects of A w and storage temperature on the kinetic parameters. The values of μmax were fitted to the secondary models as a function of A w and storage temperatures, as follows (Ratkowsky et al. Reference Ratkowsky, Olley, McMeekin and Ball1982; Adams et al. Reference Adams, Little and Easter1991; Wijtzes et al. Reference Wijtzes, McClure, Zwietering and Roberts1993);
where b is the coefficient value, T is storage temperature and A w is water activity. T min and A wmin are the theoretical minimum temperature and A w of Staph. aureus growth in cheese, respectively.
The values of λ were fitted to the secondary models with the polynomial equation as a function of A w and storage temperatures;
where a i (where ‘i’ represents any number from 0 to 5) are coefficients, T is storage temperature (°C), and A w is water activity. To fit the values of Ln λ to the polynomial equation, the regression analysis function in Excel 2007 (Microsoft®, USA) was used to select significant variables (P<0·05).
Validation
Commercial Brie (A w=0·987), Camembert (A w=0·983), Cheddar (A w=0·973), Mozzarella (A w=0·975) and Gouda (A w=0·958) cheeses were used to validate the performance of the developed model in this study. Staph. aureus was inoculated on the cheeses, and bacterial cell counts were enumerated in order to collect the observed values during storage at 4–30 °C. The observed values were then compared with the predicted values, which were estimated by the developed models. Subsequently, the model performance was evaluated by the root mean square error (RMSE) and relative error (RE) with the following equation:
 $${\rm RMSE =} \sqrt {\displaystyle{{\sum {({\rm predicted\,value} - {\rm observed}\,{\rm value})} ^2} \over n}} $$
where n represents the number of data points.
Statistical analysis
This study was repeated twice using two samples per repeat (n=4). The kinetic parameters (μmax, λ, N 0, and N max) were analysed using the general linear model procedure of SAS® version 9.2 (SAS Institute Inc., Cary, NC, USA), and all mean comparisons were performed with the pairwise t-test at α=0·05.
Results and discussion
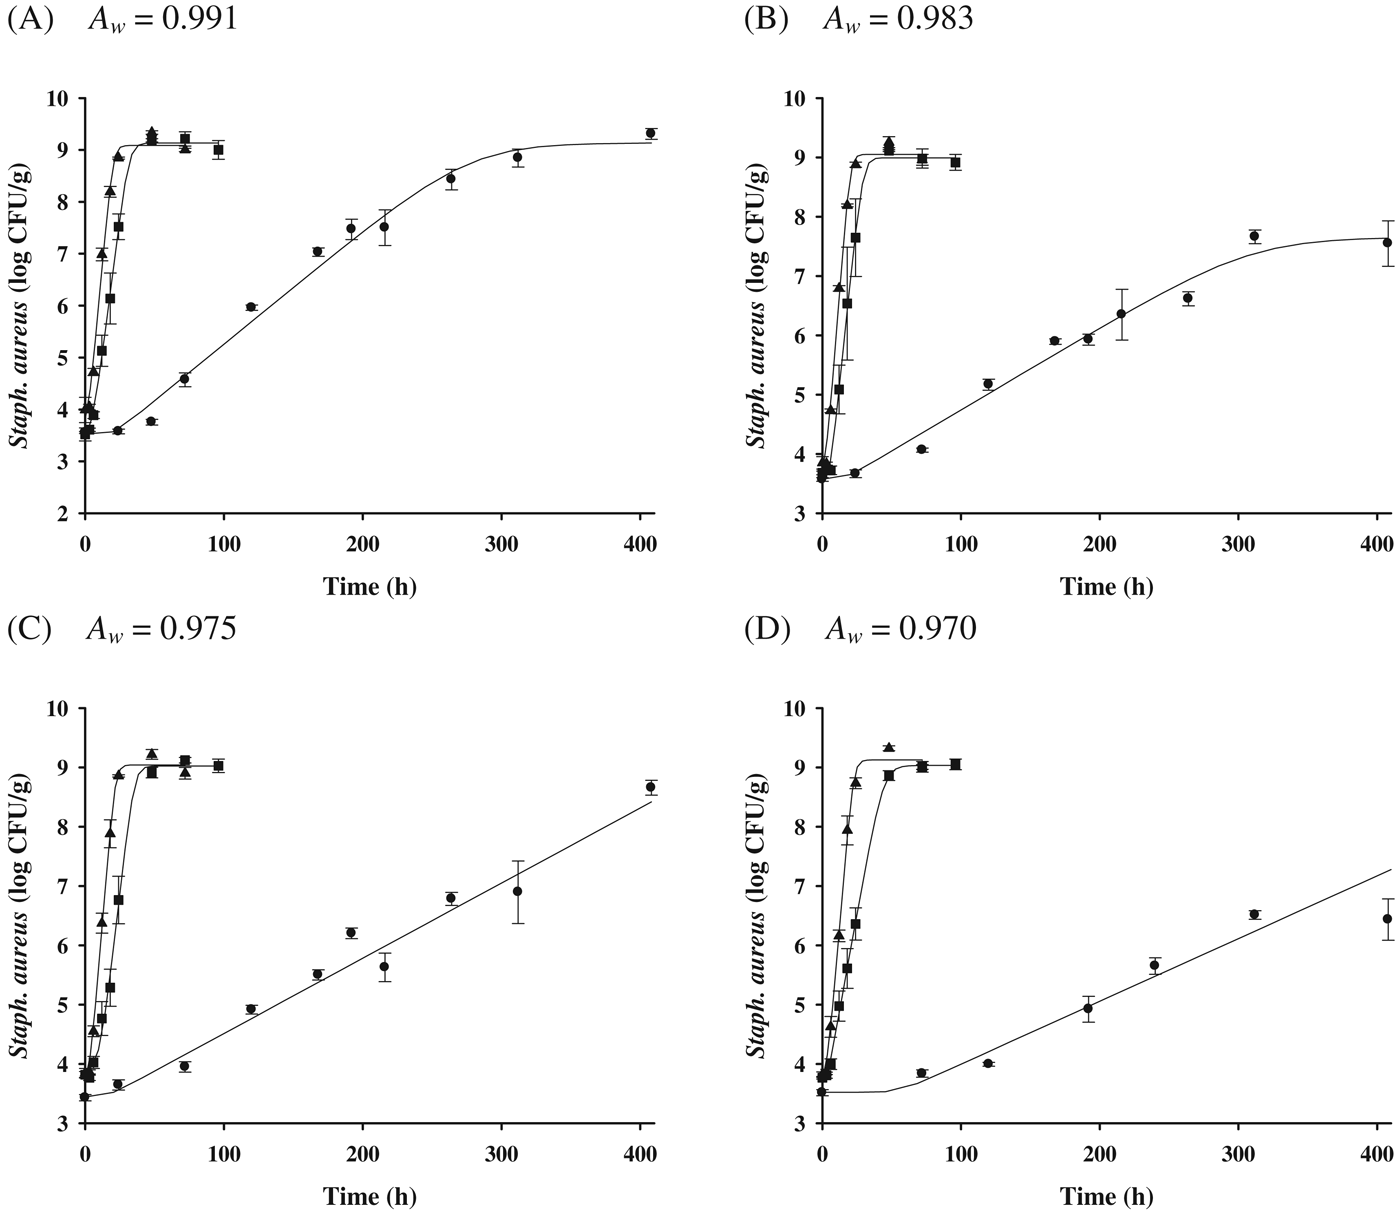
No significant Staph. aureus growth was observed on the cheeses at 7 °C for all A w (Fig. 1); however, there was a significant growth of Staph. aureus at 15–30 °C, regardless of A w (Fig. 2). Only growth data (15, 25, and 30 °C) were used to develop the primary models with the Baranyi model. The R 2 values (0·900–0·995) of the developed primary model were high (Table 1), indicating that the Baranyi model was appropriate for calculating the growth parameters of Staph. aureus in cheeses. Although the μmax values (0·011–0·303 log CFU/g/h) were increased (P<0·05) as storage temperature increased, the μmax values were decreased (P<0·05) as A w decreased. In addition, λ values (2·42–63·48 h) were decreased as storage temperature increased; yet, the effect of A w on λ values was observed only at 15 °C (Table 1). This result indicates that A w may not influence Staph. aureus growth in cheese during storage at 25 and 30 °C. The N 0 values ranged from 3·5 to 3·8 log CFU/g; the significant difference in N max values (7·5–9·2 log CFU/g) was shown at 15 °C, which may have been caused by A w.

Fig. 1. Bacterial populations of Staphylococcus aureus in cheeses adjusted at different water activities (A w=0·991, 0·983, 0·975, 0·970) during storage at 7 °C for 720 h; ●: observed value.

Fig. 2. Bacterial populations of Staphylococcus aureus in cheeses according to storage temperature and water activity; ● (15 °C), ■ (25 °C), ▲ (30 °C): observed data, —: fitted line with the Baranyi model.
Table 1. Growth parameters (mean±sd) of Staphylococcus aureus in cheese according to storage temperature and water activity, calculated by the Baranyi equation (Baranyi & Roberts, Reference Baranyi and Roberts1994)

μmax, maximum specific growth rate; λ, lag phase duration; N 0, lower asymptote; N max, upper asymptote
A–EDifferent letters in the same column mean significantly different P<0·05
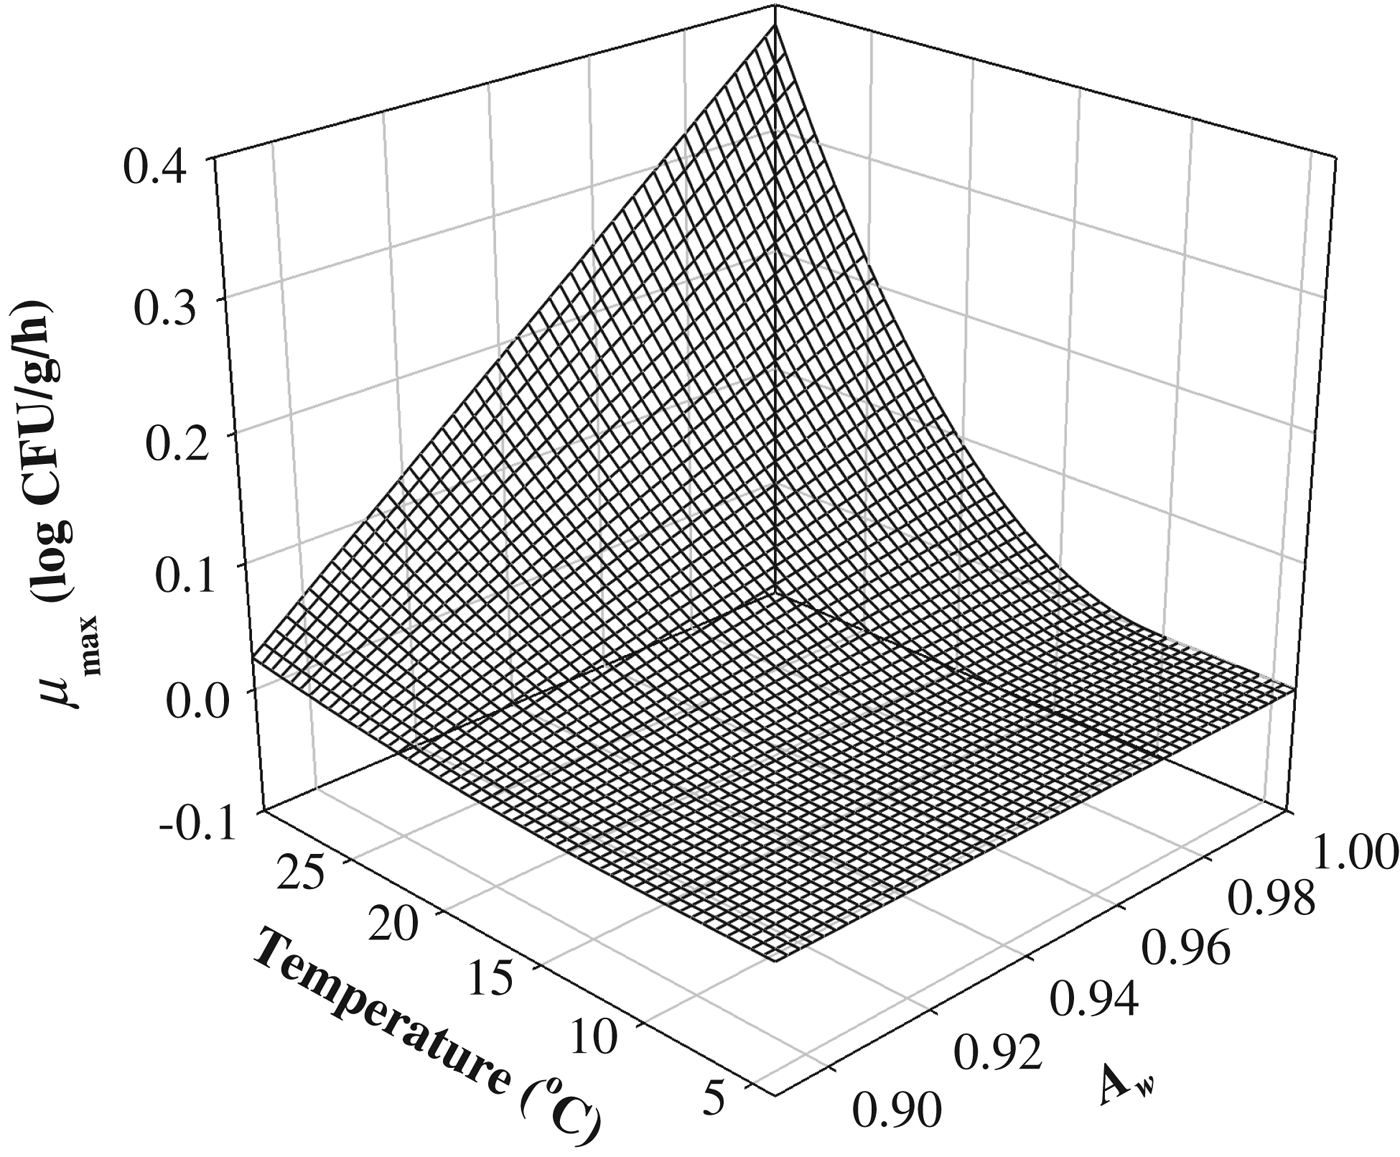
To describe the storage temperature and A w effect on μmax, the Ratkowsky-type model was fitted to the μmax values (Ratkowsky et al. Reference Ratkowsky, Olley, McMeekin and Ball1982; Adams et al. Reference Adams, Little and Easter1991; Wijtzes et al. Reference Wijtzes, McClure, Zwietering and Roberts1993). The R 2 value was 0·967, indicating that the Ratkowsky-type model was appropriate to describe the effect of storage temperature and A w on μmax (Table 2 and Fig. 3). T min and A wmin were then calculated to be 10·19 °C, and 0·882, respectively (Table 2). Although the value of T min was slightly high, a survey by Jol et al. (Reference Jol, Kassianenko, Wszol and Oggel2006) indicated that 20% of domestic and commercial refrigerators in the U.S. were kept at more than 10 °C temperature. Thus, Staph. aureus in cheese may possibly be exposed to the T min. For Mozzarella (A w=0·970) and Cheddar cheeses (A w=0·965), T min values were 6·35, and 5·72, respectively (Kim et al. Reference Kim, Lee, Moon, Kim, Heo, Park and Yoon2013). Because the T min values from the study by Kim et al. (Reference Kim, Lee, Moon, Kim, Heo, Park and Yoon2013) were estimated only at high A w, the T min values were lower than that of our study. These results were impacted by the kinetic behaviour of pathogens, which depends on the food matrix (Yoon, Reference Yoon2010). In addition, in research by Valik & Gorner (Reference Valik and Gorner1993), the minimum A w for Staph. aureus growth was estimated to be between 0·86–0·93; the results of Baird-Parker's research (Reference Baird-Parker, Lund, Baird-Parker and Gould2000) suggested that the minimum A w in BHI was 0·86 at 30 °C. To describe the effect of storage temperature and A w on λ, the λ values were transformed to a natural logarithm because λ showed an exponential relationship as a function of storage temperature and A w, and a polynomial equation was fitted to the ln(λ) values. The estimates of parameters are shown in Table 3. R 2 was 0·766, indicating that the polynomial equation was acceptable for describing the effects of storage temperature and A w on λ. Although, the P-value of the estimated coefficients for A w was not significant, A w was involved in the model because the linear relationship between λ and A w was obviously observed.

Fig. 3. Secondary model for the μmax of Staphylococcus aureus in cheeses as a function of storage temperature and water activity.
Table 2. Estimates of parameters, calculated by the Ratkowsky-type model for μmax of Staphylococcus aureus in cheese

Table 3. Estimates of parameters, calculated by a polynomial equation for λ of Staphylococcus aureus in cheese

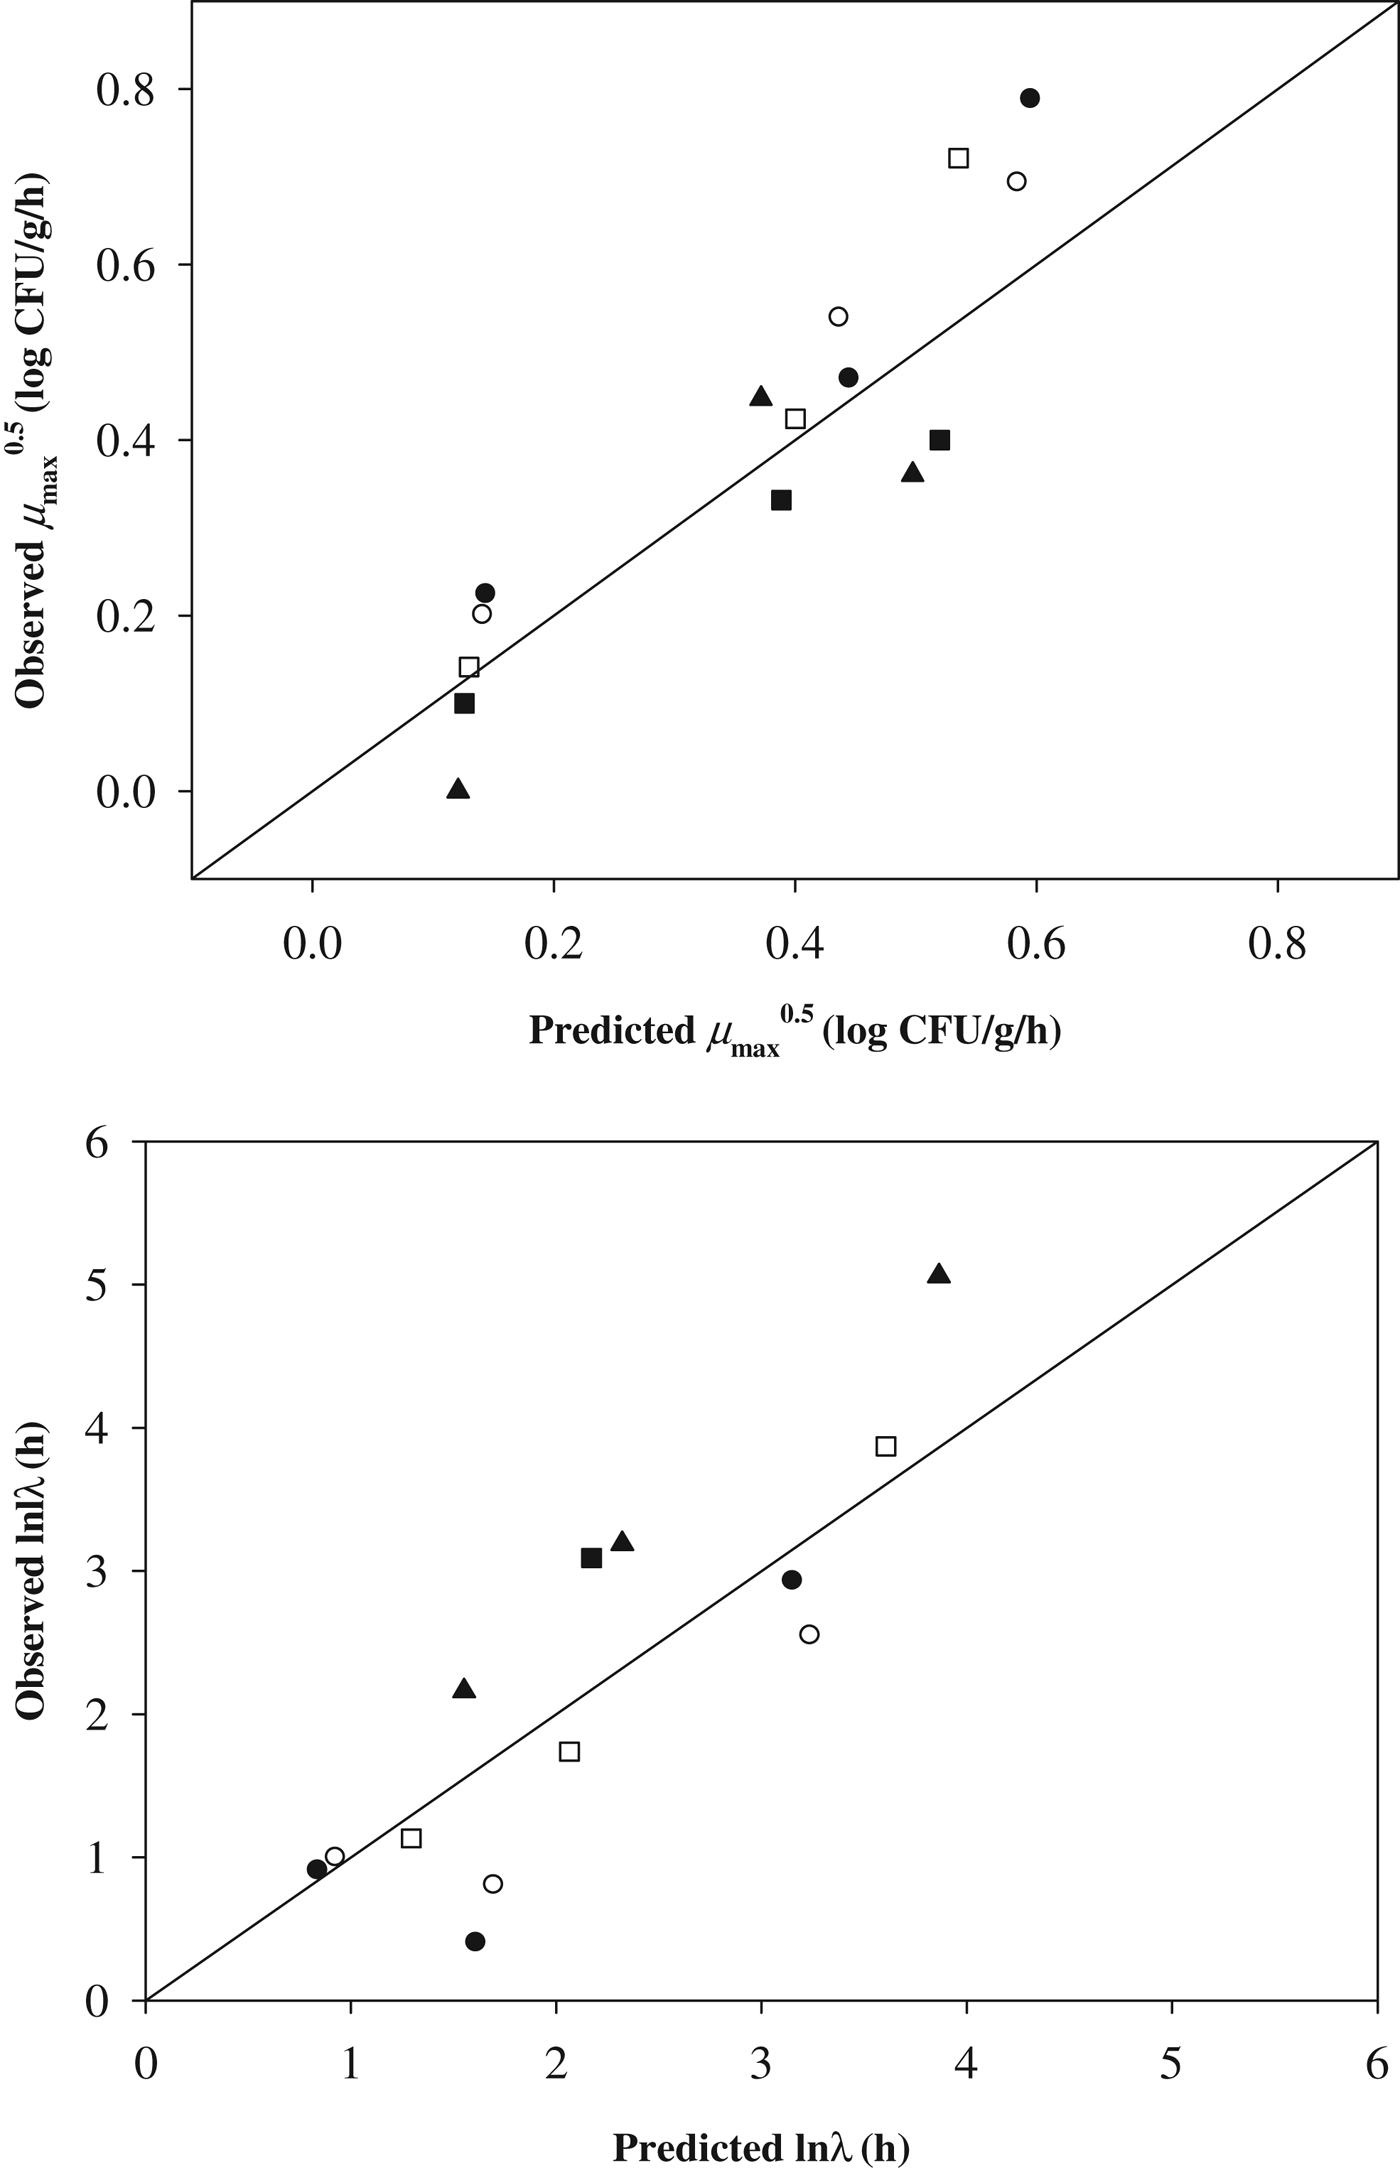
To validate the developed models, a mixture of Staph. aureus was inoculated on commercial Brie (A w=0·987), Camembert (A w=0·983), Cheddar slice (A w=0·973), Mozzarella slice (A w=0·975) and Gouda slice cheeses (A w=0·958). Then, the Staph. aureus cell counts were enumerated during storage at 15, 25 and 30 °C, as described above. Subsequently, the observed μmax and λ values were also calculated using the Baranyi model (Baranyi & Roberts, Reference Baranyi and Roberts1994), and the observed data were then compared with the predicted values calculated by the developed models (Fig. 4). In our study, bias (B) and accuracy (A) factors were not used to validate the model performance because Oscar (Reference Oscar2005b) suggested that B and A factors had limitations for evaluation of the developed model performance. Thus, RMSE and RE were calculated for the evaluation of model performance. The RMSE value of μmax and λ values were 0·010, and 1·544, respectively. If the RMSE value is close to ‘0’, indicating a lower difference of value between the observed data and the predicted data, the performance of the developed model is appropriate. In addition, the RE was calculated to be −0·131 for μmax and 0·187 for λ. When the RE value is less than zero, it indicates that the model is ‘fail-safe,’ and when the RE value is greater than zero, it represents a ‘fail-dangerous’ prediction (Oscar, Reference Oscar2005a). A study by Oscar (Reference Oscar2005a) suggested that an RE range from −0·6 to 0·3 is appropriate. Taken together, these values indicate that the performance of the developed model is appropriate for describing the kinetic behaviour of Staph. aureus in cheese as a function of A w and storage temperature.

Fig. 4. Comparison of observed and predicted μmax and λ values for validation.
In conclusion, the developed model in this study should be useful in describing the kinetic behaviour of Staph. aureus as a function of storage temperature and A w. In addition, the developed model in this study can be used for the exposure assessment, as a part of microbial risk assessment, to predict Staph. aureus in cheeses.
This research was supported by a grant (13162MFDS927) from the Ministry of Food and Drug Safety in 2013.


