


Introduction
During the last 250 years, anthropogenic activities have increased the global atmospheric concentration of carbon dioxide (CO2), methane (CH4) and nitrous oxide (N2O) by 36, 148 and 18%, respectively (Forster et al., Reference Forster, Ramaswamy, Artaxo, Berntsen, Betts, Fahey, Haywood, Lean, Lowe, Myhre, Nganga, Prinn, Raga, Schulz, Van Dorland, Solomon, Qin, Manning, Chen, Marquis, Averyt, Tignor and Miller2007). Globally, agricultural CH4 and N2O emissions increased by nearly 17% from 1990 to 2005, thus an average annual emission increase of nearly 60 MtCO2-eq/year. Agriculture accounted for estimated emissions of 5.1–6.1 GtCO2-eq/year in 2005 (10–12% of total global anthropogenic emissions of greenhouse gases (GHG)). Moreover, CH4 and N2O contributed 3.3 and 2.8 GtCO2-eq/year, respectively, of global anthropogenic emissions in 2005, of which agriculture accounts for about 60% of N2O and about 50% of CH4 (IPCC, Reference Metz, Davidson, Bosch, Dave and Meyer2007). Total GHG emissions in the USA increased by 14.7% from 1990 to 2006. All agricultural sources combined were estimated to have generated 454 Tg of CO2-eq in the USA during 2006 (Burns et al., Reference Burns, Li, Xin, Gates, Overhults, Earnest and Moody2008). The CH4 emissions from enteric fermentation and manure management represent about 25 and 8% of the total anthropogenic CH4 emissions. The US Environmental Protection Agency (USEPA) identified manure management as generating 24 and 5% of CH4 and N2O emissions, respectively, from agricultural sources (Burns et al., Reference Burns, Li, Xin, Gates, Overhults, Earnest and Moody2008; USEPA, 2008).
Greenhouse gas emissions from the agricultural sector in Taiwan totalled 2839 kilotons of CO2-eq in 2013, accounting only for 1.00% of the country's total GHG emissions. From 1990 to 2013, GHG emissions from the agricultural sector show an average annual growth of −1.43%, in other words, an accumulated reduction of 27.10% (TNIR, 2016). From 2012 to 2013, GHG emissions from the agricultural sector decreased by 2.99%. In detail, CH4 emission from livestock enteric fermentation, livestock manure management and rice culturing accounted for 20.36, 5.84 and 19.51% of total agricultural GHG emission, respectively, in 2013 (TNIR, 2016). In the same year, N2O emission from agricultural soil, livestock manure management and agricultural waste burning accounted for 50.03, 2.51 and 0.04% of total agricultural GHG emission, respectively (TNIR, 2016).
Pork is the largest economic meat source for the Taiwan population, with a per capita pork consumption of about 38 kg/year, according to the statistical data from the Council of Agriculture, Taiwan in 2015 (COA, 2015a). Pig farming is the dominant livestock industry in Taiwan in terms of production value totalling around US$2.4 billion, i.e. about 14.4% of all agricultural production value (US$16.7 billion) in 2015 (COA, 2015b). Moreover, pig farming production value is approximately 43.7% of all livestock production value (US$5.46 billion) in 2015 (COA 2015b). As such, pig farmers initiated biogas production due to the large presence of pig farms in Taiwan and availability of fresh manure for gas collection. As a result, the collected biogas from pig farms is used for power generation or direct combustion in Taiwan (Su, Reference Su and Tseng2015).
In 2016, Taiwan had 7609 pig farms with a total of 54 42 381 pigs (COA, 2017). Although Taiwan had only 1514 pig farms (19.9% of total number of farms) with more than 1000 pigs each, these farms constitute 68.6% of total number of pigs, a total of 37 35 245 pigs. There were 2 92 110 head of ruminant animals in Taiwan, comprising 2007 cattle farms with 1 46 030 head and 1984 goat farms with 1 46 080 head (COA, 2017). Additionally, Taiwan livestock farms had deer (18 733 head), horses (1024 head) and rabbits (7101 head). Nearly 40 000 metric tons of organic waste is produced annually, including livestock effluent and food waste, all of which can provide a renewable energy source.
Since 1998, Taiwan has taken initiatives to prepare the national GHG inventory. In 2013, the Taiwan National Inventory Report (TNIR) indicated that GHG emissions from the agricultural sector totalled 2839 kilotons of CO2-eq, accounting for 1.00% of total GHG emissions in Taiwan (EPA, 2016). In particular, N2O emissions from agricultural soil and livestock manure management accounted for 50 and 2.51% of total agricultural GHG emissions, respectively, while CH4 emissions from livestock enteric fermentation, rice cultivation and livestock manure management accounted for 20.4, 19.5 and 5.8% of total agricultural GHG emissions, respectively (EPA, 2016).
In the TNIR, the Tier 1 method from IPCC (Reference Eggleston, Buendia, Miwa, Ngara and Tanabe2006) is still applied for calculating CH4 and N2O emissions from enteric fermentation and manure management. The basic characterization of Tier 1 is likely to be sufficient for most animal species in most countries and it is so simplified that only readily available animal population data are needed to estimate emissions. Default emission factors are presented for each of the recommended population sub-groups. Therefore, the best way to determine emission factors is to conduct non-invasive or non-disturbing measurements of emissions in actual systems representative of those in use in the country (IPCC, Reference Eggleston, Buendia, Miwa, Ngara and Tanabe2006).
A domestic study for establishing GHG emission factors is important because different manure management systems are used for different countries. Thus, the objective of the current study was to update the emission factors of the TNIR for manure management system, which is largely different from those international manure management systems reported by the Intergovernmental Panel on Climate Change (IPCC).
Materials and methods
Waste-water treatment systems in Taiwan
The most widespread piggery waste-water treatment system in Taiwan is the three-step piggery waste-water treatment system (TPWT) (Su et al., Reference Su, Liu, Shu and Wu1997), which includes the stages of solid/liquid separation, anaerobic digestion and activated sludge treatment (Fig. 1). This system is based on a typical continuous flow design and the volume of raw waste water remains constant over each 24 h period. The anaerobic digestion system of the TPWT process can also salvage part of the chemical energy content of waste water by generating biogas, a useful renewable energy source. The anaerobic digestion basin is a plug-flow, top-opened, horizontal and underground waste-water basin covered with a plastic lid and constant pressure device: biogas can be collected from the top of the plastic cover. Greenhouse gas emission rates of pig operations with different housing and manure management schemes in the literature have been summarized (Borhan et al., Reference Borhan, Mukhtar, Capareda, Rahman and Rebellon2012). Among this literature, the TPWT system is the only typical waste-water treatment system for manure management applied in Asia (Su et al., Reference Su, Liu, Shu and Wu1997).
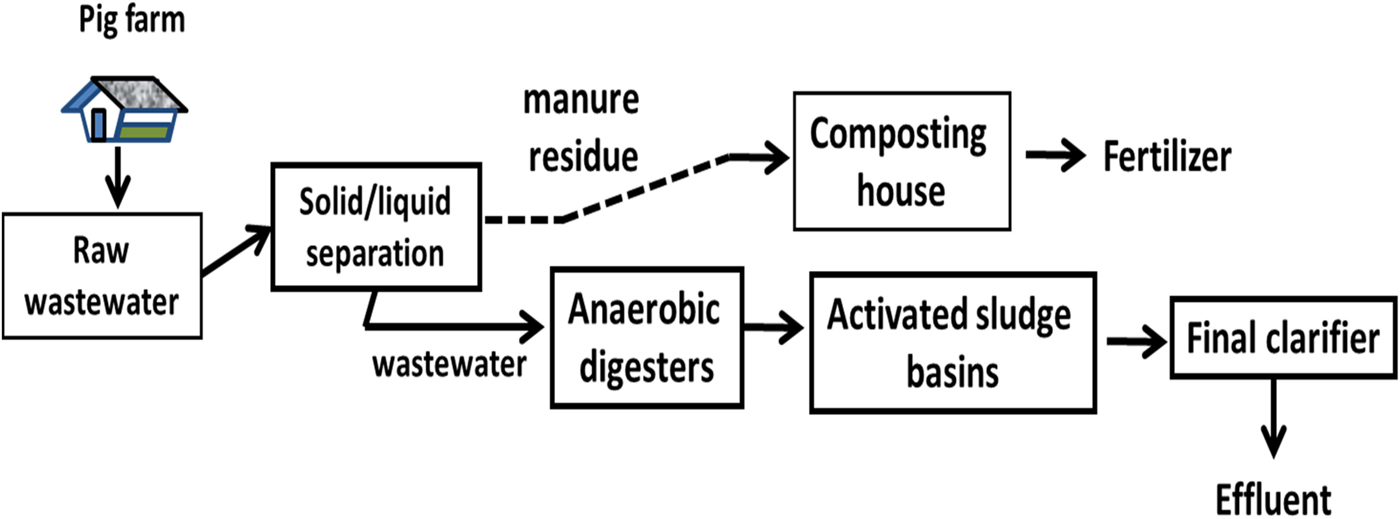
Fig. 1. Diagram of the three-step piggery waste-water treatment (TPWT) system.
Selected pig farms
Three integrated pig farms were selected from Miaoli, Changhua and Tainan Counties located in northern, central and southern Taiwan where the cleaning frequencies of pig houses were once a day, once every 2 days and once every 60 days, respectively. The background and piggery waste-water data of these pig farms are listed in Tables 1 and 2. All solid parts of piggery waste water after solid/liquid separation process were collected and treated by centralized composting houses. The types of pig pen floor for the pig farms located in northern, central and southern Taiwan were solid concrete, solid concrete/slatted and slatted, respectively. These three farms were considered mutual control groups for each other. Moreover, the Tropic of Cancer cuts across central Taiwan, dividing Taiwan between the tropical and sub-tropical zone, with unique landscapes and rich natural resources of different climates. Hence, the three pig farms were chosen in northern, central and southern Taiwan in order to represent different climatic regions.
Table 1. Background data of pig farms

Table 2. Piggery waste-water data of pig farms

HRT, hydraulic retention time.
Gas sampling and flow rate determination
Collection of biogas samples
In the current study, biogas flow volumes were detected directly and counted by mass flow meters from commercial pig farms located in the northern, central and southern regions of Taiwan, where biogas mass flow meters were connected to the outlet of anaerobic basins prior to the pressure stabilizers (Fig. 2).

Fig. 2. Sketch of greenhouse gas measurement from anaerobic digesters of pig farms for the current study. PS, pressure stabilizer; DH, dehumidifier; MFM, mass-flow biogas meter.
The biogas samples were collected in 1 litre Tedlar® bags (SKC, PA, USA) with a single polypropylene fitting. This fitting contained a Teflon® syringe port lined septum and a hose connection, which functioned as a shut-off valve for incoming and outgoing gas. A 500 ml gas collector (GL Sciences Inc., Tokyo, Japan) was used to withdraw gas samples from the biogas outlets of covered anaerobic waste-water treatment basins and the exhausting outlets of a closed composting house. All gas samples were collected at least once per month for gas chromatography (GC) analysis (Su et al., Reference Su, Liu and Chang2003).
Measurement of the flow rate of the biogas from the anaerobic treatment basins of livestock farms on sites
A mass flow meter (Sierra Instruments, Inc., 780S Series, Flat-Trak Mass Flow Meter, CA, USA) measured the rate of biogas flow directly and was calibrated using a gas mixture of 60% CH4 and 40% CO2. All measuring and test equipment used in the calibration of Sierra meters are traceable to the standards of the National Institute of Standards and Technology (NIST). Sierra Instruments, Inc. is ISO-9001 registered and conforms to the requirements of ANSI/NCSL-Z540 and ISO/IEC Guide 25 (http://www.sierrainstruments.com/products/userfiles/file/manuals/im780s_c2.pdf).
Three mass flow meters, one per farm, with independent recorders were installed and placed next to anaerobic basins in the pig farms. In the current study, each mass flow meter was connected to the outlets of anaerobic basins prior to a pressure stabilizer, namely a closed plastic cylinder roughly 1/3 full water, which was connected to the headspace of the covered anaerobic basins. The pressure stabilizer can maintain a constant gas pressure inside the covered anaerobic basins. The meter recorder registered the flow rate data (m3/h) every 15 min and downloaded the information every 2 days to avoid data loss. Biogas samples for GC analysis were collected periodically using sampling bags from biogas outlets of the anaerobic basins.
Analysis of gas and waste-water samples
Analysis of methane and carbon dioxide
Gas sample bags were connected to the manual injection device of the GC through the connection ports using Tygon® tubing (Su et al., Reference Su, Liu and Chang2003). Meanwhile, gas samples (1 ml) were injected manually. The gas samples were analysed for both CH4 and CO2 by GC with a thermal conductivity detector (Perkin Elmer, Akron, Ohio, USA). The GC stainless steel column employed for the analysis was a ‘Porapak Q’ measuring 3.2 mm × 3 m (Supelco, PA, USA) and the detector, column and injection temperature were 200, 80 and 150 °C, respectively. The carrier gas was helium and the flow rate was set at 10 ml/min. Data were reported by calculating the means and standard deviation (mean ± sd).
Analysis of nitrous oxide
Gas samples (500 µl) were analysed for N2O using a GC with electron capture detector (Perkin Elmer). The GC column was a ‘Porapak Q’ with dimensions of 3.2 mm × 4 m (Supelco) (Su et al., Reference Su, Liu and Chang2003). Meanwhile, the detector, column and injection temperature were 280, 60 and 150 °C, respectively. The programme for oven temperature was as follows: 60 °C/2 min (rate: 5 °C/min) and 120 °C/4 min (rate: 5 °C/min; time: 12 min). The carrier gas was P-10, containing 90% Argon and 10% CH4 and its flow rate was set at 18 ml/min. Data were reported by calculating the means and standard deviation (mean ± sd).
Analysis of biochemical oxygen demand, chemical oxygen demand and suspended solids
Biochemical oxygen demand (BOD), chemical oxygen demand (COD) and suspended solids (SS) in all waste-water samples were determined according to APHA (1998) and data were reported by calculating the means and standard deviation (mean ± sd).
Statistical analysis
The experimental data of different samples were then analysed using the analysis of variance procedure for data analysis and graphical software, Origin (OriginLab, Northampton, MA, USA).
Information on the average temperature in Taiwan
The data used in the current study are taken from the website of the National Central Weather Station (http://www.cwb.gov.tw/V7/climate/monthlyData/mD.htm), which supplied temperature data based on monthly average temperatures in Hsinchu, Taichung (next to Changhua) and Tainan Counties. Greenhouse gas production was divided into three temperature periods. The months with average monthly temperatures of <20, 20–25 and 26–30 °C were defined as cool, temperate and warm periods, respectively, in Taiwan.
Calculation of greenhouse gas emission
Flow rates and levels of CH4 (R CH4), CO2 (R CO2) and N2O (R N2O) in the biogas samples were used to calculate GHG emissions:
 $$\eqalign{&{\rm Daily}\;{\rm production}\;{\rm of}\;{\rm C}{\rm H}_{\rm 4}{\rm , C}{\rm O}_{\rm 2}\;{\rm and}\;{\rm N}_{\rm 2}{\rm O}\;{\rm on}\;{\rm pig}\;{\rm farms \;(}{\rm m}^{\rm 3}{\rm /day)} \cr & \quad = {\rm Daily}\;{\rm production}\;{\rm of}\;{\rm bioga}s \times (R_{{\rm CH4}},{\rm }R_{{\rm CO2}}\;{\rm and }\;R_{{\rm N2O}})}$$
 $$\eqalign{&{\rm Daily}\;{\rm production}\;{\rm of}\;{\rm C}{\rm H}_{\rm 4}{\rm ,}\;{\rm C}{\rm O}_{\rm 2}\;{\rm and}\;{\rm N}_{\rm 2}{\rm O}\;{\rm on}\;{\rm pig}\;{\rm farms}\;{\rm per}\;{\rm head}\;\cr&{\rm of}\;{\rm pig}\;{\rm (}{\rm m}^{\rm 3}{\rm /head/day)} = (A_1)\;({\rm the \; number \; of \; animals \; raised})}$$
Based on the Ideal Gas Law (PV = nRT), daily production of CH4, CO2 and N2O by weight can be calculated using Eqn (3) as follows:
 $$\eqalign{&{\rm Daily}\;{\rm production}\;{\rm of}\;{\rm C}{\rm H}_{\rm 4}{\rm ,}\;{\rm C}{\rm O}_{\rm 2}\;{\rm and}\;{\rm N}_{\rm 2}{\rm O}\;{\rm per}\;{\rm head}\;{\rm of}\;\cr&{\rm pig}\;{\rm by}\;{\rm weight \;(kg/head/day)}=[(B) \times 10^3{\rm l}/{\rm m}^3(R \times T)) \cr&\times ({\rm M}{\rm W}_{{\rm CH4}}{\rm , M}{\rm W}_{{\rm CO2}}\;{\rm or}\;{\rm M}{\rm W}_{{\rm N2O}}) \times 10^{-3}{\rm kg/g}]}$$
where P is pressure (1 atm), V is volume (litres), n is number of moles (moles), R is 0.0821 litres × atm/(mole×K) and T = (273 + 25 °C) = 298 K. The molecular weights of CH4 (MWCH4), CO2 (MWCO2) and N2O (MWN2O) are equal to 16, 44 and 44 g/mole, respectively.
Pig production of CH4, CO2 and N2O per head of pig (kg/head/year) = (Eqn 3) × 365 days/year
Results
Comparing definitions of climate regions in IPCC and Taiwan according to monthly average temperature
Emissions of CH4 for swine, dairy cattle and non-dairy cattle in three climate regions were estimated by IPCC (Reference Eggleston, Buendia, Miwa, Ngara and Tanabe2006) for cool (<15 °C), temperate (15 and 25 °C) and warm (>25 °C) regions (Table 3). However, the definitions of climate regions in Taiwan used in the current study differed from the IPCC model. The investigation defined three climate regions based on the number of months with certain average temperatures in Taiwan. Based on the data from the Taiwan Central Weather Bureau (http://www.cwb.gov.tw/V7e/climate/monthlyData/mD.htm), the monthly average temperature from January 2011 to December 2011 reveals 4 months each with monthly average temperatures of <20, 20–25 and >25 °C in northern Taiwan (Table 4). Central Taiwan experienced about 4, 3 and 5 months with the monthly average temperatures of <20, 20–25 and >25 °C, respectively, while southern Taiwan had about 4, 2 and 6 months with these monthly average temperatures, respectively.
Table 3. Manure management emission of methane (CH4) for swine, dairy cattle and non-dairy cattle in three climate regions estimated by IPCC (Reference Eggleston, Buendia, Miwa, Ngara and Tanabe2006)

Table 4. Monthly average temperature from December 2010 to April 2012 in northern, central and southern Taiwan

Source: The Central Weather Bureau, Ministry of Transportation and Communications, Taiwan, ROC (http://www.cwb.gov.tw/V7e/climate/monthlyData/mD.htm).
The current study thus classified the three temperature periods as cool (monthly average temperature <20 °C), temperate (monthly average temperature 20–25 °C) and warm (monthly average temperature 26–30 °C). The three climate regions used herein corresponded to the regions of northern, central and southern Taiwan in the current study. Thus, the definition of climate regions used herein differs from that used by IPCC in Asia (Reference Eggleston, Buendia, Miwa, Ngara and Tanabe2006).
Production of biogas after anaerobic digestion of piggery waste water
The emission factors of GHG were measured and calculated from on-site samples, taken from the gas outlets of the selected anaerobic piggery waste-water treatment facilities prior to pressure stabilizers in northern, central and southern pig farms (Tables 5 and 6).
Table 5. Average biogas production in the northern, central and southern pig farms according to three climate regions

Data presented as mean ± sd.
NS, not significant.
Table 6. Average biogas production in the northern, central and southern pig farms

Data presented as mean ± sd.
NS, not significant.
Daily average biogas production per farm across the temperature zones ranged from 625 to 958 (P < 0.05), 1851 to 2129 (P > 0.05) and 628 to 696 m3/day (P > 0.05) in the northern, central and southern pig farms, respectively (Table 5). Results implied that the biogas production rates might reach their maximum when hydraulic retention time (HRT) of anaerobic digesters is >20 days. In contrast, there might be inadequate retention time for biogas production when HRT of anaerobic digesters was only 3 days.
Moreover, daily average biogas production per pig across the various temperature regimes was 0.064–0.098 (P < 0.05), 0.12–0.14 (P < 0.05) and 0.06–0.07 m3/day (P > 0.05) for the northern, central and southern pig farms, respectively (Table 5). Daily average biogas production per farm and average biogas per head across the three regions (northern, central and southern pig farms) varied from 696 to 1851 m3/day (P < 0.05) and 0.07 to 0.12 m3/head/day (P < 0.05), 667 to 2129 m3/day (P < 0.05) and 0.07 to 0.14 m3/head/day (P < 0.05), and 625 to 1893 m3/day (P > 0.05) and 0.06 to 0.13 m3/head/day (P > 0.05) for average temperatures of <20, 20–25 and 26–30 °C, respectively (Table 5). Daily average biogas production and average biogas per head ranged from 664 to 1926 m3/day (P < 0.001) and 0.07 to 0.13 m3/head/day (P < 0.05) (Table 6).
The analytical results demonstrated that proportions of GHG in biogas produced from anaerobic digestion of piggery waste water ranged from 0.62 ± 0.033 to 0.69 ± 0.028 for CH4 (P < 0.05), 0.28 ± 0.031 to 0.31 ± 0.033 for CO2 (P < 0.05) and 0.0002 ± 0.00037 to 0.001 ± 0.0015 for N2O (P > 0.05) in the three pig farms (Fig. 3). The average GHG compositions in the biogas for CH4, CO2 and N2O were 0.65 ± 0.03.5, 0.30 ± 0.01.1 and 0.0004 ± 0.00021, respectively. Additionally, the average emission levels of CH4, CO2 and N2O were 10.8–19.0 (P < 0.001), 12.3–25.3 (P < 0.001) and 0.03–0.09 (P > 0.05) kg/head/year, respectively (Table 6). Statistical results implied that both average biogas production and GHG contents in biogas were significantly different among three pig farms, except for N2O. These results might be due to different climates and manure management techniques (slatted v. unslatted) among the three pig farms in the current study.

Fig. 3. Comparison of average methane (CH4; grey bar), carbon dioxide (CO2; white bar) and nitrous oxide (N2O; black bar) in biogas of northern (n = 33), central (n = 47) and southern (n = 33) pig farms. All differences were significant.
Biogas mass flow meters were connected to the outlet of anaerobic basins prior to the pressure stabilizers in the current study. Removal of average COD for the northern, central and southern pig farms was 5669, 9685 and 6017 mg/l, respectively. Thus, it is about 0.52 [865 m3/day/(5669 mg/l × 294 m3/day × 103 litre/m3 × 10−6 kg/mg)], 0.66 [1926 m3/day/(9685 mg/l × 300 m3/day × 103 litre/m3 × 10−6 kg/mg)] and 0.28 litre/g-COD [664 m3/day/(6017 mg/l × 400 m3/day × 103 litre/m3 × 10−6 kg/mg)], respectively, for the northern, central and southern pig farms. Thus, overall average biogas production based on COD degradation was 0.49 litre/g-COD. Similarly, removal of average BOD for the northern, central and southern pig farms was 3774, 6085 and 3562 mg/l, respectively. Thus, it is about 0.78, 1.06 and 0.47 litre/g-BOD, respectively, for the northern, central and southern pig farms. Thus, overall average biogas production based on BOD degradation was 0.77 litre/g-BOD.
Water quality of anaerobically treated waste-water samples with different average monthly temperatures
The water quality of all waste-water samples, both after solid/liquid separation and after anaerobic digestion, from three pig farms located in northern, central and southern Taiwan under different temperature regions was not significantly different (P > 0.05) (Tables 7–9; Fig. 4).

Fig. 4. Average water quality of the piggery waste-water samples, after solid/liquid separation (grey bar) and after anaerobic digestion (white bar), in northern, central and southern Taiwan (n = 54). All differences were significant.
The experimental results showed that removal efficiency of COD, BOD and SS in the waste-water samples after anaerobic digestion was 0.57–0.86, 0.92–0.98 and 0.58–0.95 under different average monthly temperature in the northern pig farm, respectively. The average removal efficiency of COD, BOD and SS in the anaerobic-treated waste-water samples was 0.7 ± 0.16, 0.96 ± 0.032 and 0.7 ± 0.19 in the northern pig farm (calculated from data in Table 7).
Table 7. Comparison of water quality index in piggery waste-water samples either after solid/liquid separation or anaerobic digestion with change of monthly average temperature in the northern pig farm (n = 16)

Data presented as mean ± sd.
NS, not significant.
Removal efficiency of COD, BOD and SS in the waste-water samples after anaerobic digestion was 0. 7–0.86, 0.9–0.97 and 0.4–0.90 under different average monthly temperature in the central pig farm, respectively. The average removal efficiency of COD, BOD and SS in the anaerobic-treated waste-water samples was 0.76 ± 0.087, 0.90 ± 0.058 and 0.7 ± 0.24 in the central pig farm (calculated from data in Table 8).
Table 8. Comparison of water quality index in the piggery waste-water samples either after solid/liquid separation or anaerobic digestion with change of monthly average temperature in the central pig farm (n = 19)

Data presented as mean ± sd.
NS, not significant.
Finally, removal efficiency of COD, BOD and SS in the waste-water samples after anaerobic digestion was 0.77–0.88, 0.96–0.97 and 0.64–0.86 under different average monthly temperatures in the southern pig farm, respectively. The average removal efficiency of COD, BOD and SS in the anaerobic-treated waste-water samples was 0.83 ± 0.056, 0.962 ± 0.0081 and 0.8 ± 0.11 in the southern pig farm (calculated from data in Table 9).
Table 9. Comparison of water quality index in the piggery waste-water samples either after solid/liquid separation or anaerobic digestion with change of monthly average temperature in the southern pig farm (n = 19)

Data presented as mean ± sd.
NS, not significant.
In summary, the pig farm located in southern Taiwan seemed to have the best removal efficiency of COD, BOD and SS among the three pig farms. However, it was not significantly different among three pig farms.
From the seasonal change point of view, the experimental results showed that removal efficiency of COD in the waste-water samples after anaerobic digestion was 0.57–0.77, 0.70–0.88 and 0.83–0.86 for the average temperatures of <20, 20–25 and 26–30 °C in the three pig farms, respectively (P > 0.05). Removal efficiency of BOD in the waste-water samples after anaerobic digestion was 0.89–0.96, 0.85–0.97 and 0.97–0.98 for the average temperatures of <20, 20–25 and 26–30 °C in the three pig farms, respectively (P < 0.05). Removal efficiency of SS in the waste-water samples after anaerobic digestion was 0.58–0.65, 0.42–0.78 and 0.86–0.95 for the average temperatures of <20, 20–25 and 26–30 °C in the three pig farms, respectively (P > 0.05).
Most pig farms are installed with anaerobic digesters built underground. Thus, changes in average monthly temperature influenced the removal efficiency of COD, BOD and SS by anaerobic digestion, albeit not significantly, for the three pig farms (Table 10). The average removal efficiency of COD, BOD and SS by anaerobic digestion process for three pig farms was about 77, 93 and 70%, respectively (Fig. 4).
Table 10. Comparison of water quality index in the piggery waste-water samples either after solid/liquid separation or anaerobic digestion in northern, central and southern pig farms (n = 54)

Data presented as mean ± sd.
Discussion
Biogas production from anaerobic basins of pig farms according to monthly average rainfall
Biodegradable organic matter in waste water (e.g. BOD) functions as both the carbon and energy source for heterotrophic bacteria in waste-water treatment systems. Denitrifying bacteria employ both nitrate (NO3−) and nitrogen dioxide (NO2−) as terminal electron acceptors in treating piggery waste water. Meanwhile, the reduction potential (E′o) required for reducing NO3− to NO2−, NO2− to form N2 gas and CO2 to form CH4 is +0.42, +0.74 and −0.24 volts, respectively (Brock and Madigan, Reference Brock and Madigan1991). Redox potential couples with more negative reduction potentials and will donate electrons to couples with more positive reduction potentials. Thus, GHG, such as CH4, CO2 and N2O, can be produced during anaerobic digestion.
Tables 7 to 9 list the relationship between piggery waste-water quality and monthly temperature change in the three pig farms. Even a partial record of monthly average rainfall volume and rainy days from December 2010 to April 2012 in Taiwan (http://www.cwb.gov.tw/V7e/climate/monthlyData/mD.htm) reveals that both regular heavy rainfall and heavy rainfall resulting from typhoons can significantly affect the volume and concentration of pre-treated piggery waste water due to non-segregation of runoff and piggery waste water. Increased rainfall volume combining with piggery waste water decreases organic concentration in the waste water and shortens the HRT of the anaerobic waste-water treatment basins. This factor implies that increased rainfall volume reduces the retention time of waste water in the anaerobic basins and indirectly lowers GHG production. The number of pigs was assumed to remain constant during the experimental period on each selected pig farm.
The pig house is normally cleaned by a large volume of water twice a day in summer, while it is normally only cleaned once a day or once every several days in winter. The volume of waste water in summer must thus exceed the volume in winter and the organic concentration of waste water in winter must surpass than that in summer. The anaerobic basins of the TPWT system of pig farms may not produce more GHG in summer than in winter (Table 5) and increased temperature merely accelerates CH4 production rate (Kiene, Reference Kiene, Rogers and Whitman1991). Assuming constant BOD in waste water, increasing temperature may simply accelerate microbial consumption of labile organic matter, while CH4 production remains constant (Kelly and Chynoweth, Reference Kelly and Chynoweth1981).
Comparison of biogas production from manure management systems on pig farms between the IPCC and Taiwan
Most European and American countries consider livestock waste and waste water to be liquid fertilizers, livestock waste water is collected and stored in anaerobic lagoons or other storage systems and is eventually applied to the land as a liquid fertilizer during cultivation in the spring. In Asia, about 54, 40 and 7% of pig manure is managed as drylot, liquid/slurry and digester systems, respectively, for market and breeding pigs (IPCC, Reference Eggleston, Buendia, Miwa, Ngara and Tanabe2006). Both drylot and liquid/slurry systems are still the most common liquid system for managing liquid swine manure in Asia, except in Taiwan.
The lagoon system is a batch system and is drawn upon for land application only once a year. Low temperatures during winter suppress microbial activity and metabolism and emissions of GHG are higher in summer than in winter, assuming the same organic loading of waste water. The lagoon system is predominantly used for estimations of GHG production and emissions from swine manure management system by the IPCC in North America and Oceania. Indeed, the volume contained in the lagoon system does not normally display significant seasonal variation throughout a year. That is, the organic loading of waste water in the lagoon system remains almost constant throughout a year. Consequently, emissions in regions with a temperature >25 °C must exceed than those in regions with a temperature <15 °C.
However, the TPWT system is totally different from the lagoon system used in other regions of Asia. In the TPWT system, the volume of piggery waste water depends on the frequency of pig house cleaning and the volume of water used to do so. These factors influence the seasonal concentrations of organics in waste water. During summer, pig houses are normally cleaned twice a day. The volume of piggery waste water should include pig house cleaning water, bath water and cooling drop water in Taiwan. Some pig houses in central and southern Taiwan provide water dips and water drops to reduce the body temperature of pigs. During winter, pig houses are cleaned by water only daily or once every several days to decrease the possibility of respiratory tract infection in the pigs. Thus, the volume of waste water is higher in summer than in winter.
Production of GHG can be reduced when the waste water contains lower organic concentrations with decreased heads of pigs on farms in a continuous waste-water treatment system; even though bacterial metabolism is accelerated when monthly temperatures are higher. The HRT of anaerobic treatment facilities decreases in proportion to the increasing waste-water volume during summer. This phenomenon partially accounts for the decrease in the production of GHG. Methane production correlates closely to both the HRT of anaerobic waste-water treatment facilities and the organic concentrations in waste water. Therefore, the IPCC emission guidelines for GHG in Asia cannot be applied to Taiwan.
The manure management systems for pig operations include lagoon (0.50), liquid/slurry (0.20), drylot (0.20), daily spread (0.05) and compost (0.05) in South Africa (Moeletsi and Tongwane, Reference Moeletsi and Tongwane2015). The emission factors of CH4 for sows, boars and growers, obtained by applying the default CH4 conversion factors from IPCC (Reference Eggleston, Buendia, Miwa, Ngara and Tanabe2006) are 25.2, 25.2 and 14.1 kg/animal/year, respectively. Although different manure management systems and calculation methodologies are applied, the CH4 emission factor of the current study (14.4 kg/head/year) is similar to that of Moeletsi and Tongwane (Reference Moeletsi and Tongwane2015) (14.1 kg/animal/year).
Conclusions
The results suggested that the average emission factor of CH4 from anaerobic waste-water treatment of pig farms (14.4 kg/head/year) is lower than that (1–23 kg/head/year in temperate and warm regions) estimated by IPCC (Reference Eggleston, Buendia, Miwa, Ngara and Tanabe2006). This difference may result from differences in the organic concentrations in waste water and liquid manure (or slurry). However, emission of CH4 for pig operation in the three climate regions, cool (<15 °C), temperate (15–25 °C) and warm (>25 °C), estimated by IPCC in 1996 was 1, 4 and 7 kg/head/year, respectively (IPCC, Reference Houghton, Meira Filho, Lim, Tréanton, Mamaty, Bonduki, Griggs and Callander1996). Thus, the emission factors must be updated based on the latest technology and research papers. The current study modified biogas measurement approaches to obtain more reliable biogas measurement data for estimating GHG emission from different geographic locations of pig farms in Taiwan. The results of the current study can help to calculate GHG emissions from the livestock sector more efficiently.
Acknowledgements
The authors thank Mr Joel Aaron Oporta Amador for proof reading this paper.
Financial support
The authors would like to thank the Council of Agriculture (COA), Executive Yuan, Taiwan, ROC, for financially supporting this research under Contract No. 100AS-7.2.1-AD-U1 (2).
Conflict of interest
None.
Ethical standards
Not applicable.


