INTRODUCTION
Animal husbandry and manure management account for more than 0·80 of total ammonia (NH3) emissions from European agriculture, estimated at 2·9 Mt/year; land application of manure, especially slurry, contributes a large proportion of these losses, and represents between 0·30 and 0·40 of total emissions from livestock production (Hutchings et al. Reference Hutchings, Amon, Dämmgen and Webb2009).
Ammonia volatilization reduces the manure nitrogen (N) use efficiency in crop production and increases the uncertainty of crop N balance and optimal fertilizer N rate calculations (Sommer et al. Reference Sommer, Schjoerring and Denmead2004b). From an environmental perspective, the loss of NH3 to the atmosphere causes negative effects through acidification and eutrophication of natural ecosystems, as well as via secondary particulate matter formation (Sutton et al. Reference Sutton, Lee, Dollard and Fowler1998; Goebes et al. Reference Goebes, Strader and Davidson2003). For these reasons, international and European agreements have established regulations to limit this pollutant, which requires calculating national inventory levels of the contribution from agriculture to total emissions (Erisman et al. Reference Erisman, Bleeker and Van Jaarsveld1998). These inventories are based on emission factors that, in the advanced method of calculation, are also specific for the emissions produced during manure spreading.
Ammonia emissions from manure applied to the soil are shaped primarily by physical and chemical processes, and secondarily by biological ones. Environmental conditions (i.e. wind speed, temperature, precipitation and humidity), manure properties (i.e. dry matter content, viscosity, pH and TAN content), soil properties (i.e. pH, cation exchange capacity, porosity and infiltration rate) and the interaction between slurry and soil, as well as the slurry distribution method and the rate of application have all been shown to cause variations in the amount of NH3 lost, from approximately nil to 0·60 of the total ammoniacal-N (TAN) applied (Sommer et al. Reference Sommer, Genermont, Cellier, Hutchings, Olesen and Morvan2003). Under constant environmental conditions, the pattern of NH3 volatilization shows high loss rates immediately after slurry application due to the high initial concentration of TAN and the pH increase in the manured-soil surface (Søgaard et al. Reference Søgaard, Sommer, Hutchings, Huijsmans, Bussink and Nicholson2002). The volatilization rate then decreases rapidly as a result of a reduction in the concentration of ammonium (NH4+) in the fertilized soil surface from volatilization, infiltration and nitrification. The pattern of NH3 volatilization after soil application of slurry is usually described in the literature by the Michaelis–Menten type equation (Sommer & Ersbøll Reference Sommer and Ersbøll1994; Søgaard et al. Reference Søgaard, Sommer, Hutchings, Huijsmans, Bussink and Nicholson2002; Misselbrook et al. Reference Misselbrook, Nicholson and Chambers2005).
Anaerobic digestion, solid/liquid separation of liquid manure and other manure treatments may also influence gaseous losses because they change the physical and chemical characteristics of manure, and affect the extent of emissions after field spreading (Amon et al. Reference Amon, Kryvoruchko, Amon and Zechmeister-Boltenstern2006; Sommer et al. Reference Sommer, Jensen, Clausen and Søgaard2006; Petersen & Sørensen Reference Petersen and Sørensen2008). Solid/liquid separation reduces the dry matter (DM) in the liquid portion of the slurry, which boosts slurry infiltration. Anaerobic digestion increases TAN content and manure pH, which raises the NH3 volatilization potential, and decreases DM content which increases slurry infiltration rates and decreases NH3 emissions.
The effect of manure and soil properties on NH3 emissions has been extensively investigated in field (Thompson & Meisinger Reference Thompson and Meisinger2002; Sommer et al. Reference Sommer, Hansen and Søgaard2004a; Misselbrook et al. Reference Misselbrook, Nicholson and Chambers2005) and laboratory studies (Amon et al. Reference Amon, Kryvoruchko, Amon and Zechmeister-Boltenstern2006; Sommer et al. Reference Sommer, Jensen, Clausen and Søgaard2006). For laboratory assessment, the dynamic chamber is the most utilized method, in which NH3 emitted from manure is collected in acid solutions (sulphuric, boric or ortho-phosphoric) and determined via titration (Le Cadre et al. Reference Le Cadre, Genermont, Decuq, Recous and Cellier2005). Recently, slurry infiltration (Sommer & Jacobsen Reference Sommer and Jacobsen1999), slurry type (Sommer et al. Reference Sommer, Jensen, Clausen and Søgaard2006), urease inhibitor (Watson et al. Reference Watson, Akhonzada, Hamilton and Matthews2008) and no-till (Rochette et al. Reference Rochette, Angers, Chantigny, Macdonald, Bissonette and Bertrand2009) effects on potential NH3 emissions were investigated using dynamic chambers coupled with acid traps. Nevertheless, using acid traps is time-consuming (e.g. acid solution collection, separate laboratory analysis for NH4+ determination), with variable and, in general, low temporal resolution, especially when only small amounts of NH3 are emitted. This second drawback leads to loss of information, especially during the first hours after fertilizer application when emission rates vary rapidly.
Infrared photoacoustic spectroscopy has recently become popular for analysing several gases (e.g. CO2, N2O, CH4 and NH3) in air samples, due to its high accuracy and selectivity (Hoy Reference Hoy1995; Berg et al. Reference Berg, Brunsch, Hellebrand, Kern, Aneja, Schlesinger, Knighton, Jennings, Niyogi, Gilliam and Duke2006; Dinuccio et al. Reference Dinuccio, Berg and Balsari2008). Commercial applications of this technology allow automated air sampling, high temporal resolution of measurements and direct data recording and display of electronic datasets. Mathematical descriptions of the emission dynamics can consequently be performed more effectively. However, to date, few studies exist on the accuracy and reliability of using photoacoustic spectroscopy with dynamic chambers for NH3 emission assessment.
The present work reports the results of a laboratory assessment of NH3 emission after soil application of different treated and untreated pig slurry (i.e. no treatment, solid/liquid separation, anaerobic digestion followed by solid/liquid separation) using a system composed of dynamic chambers and a photoacoustic infrared gas analyser. The reliability of this method was evaluated via comparison to the most commonly used acid traps method.
MATERIALS AND METHODS
Treatments and soils
Three manure treatments were compared: untreated pig slurry (Untreated S), the liquid fraction of untreated pig slurry (Untreated S liquid) and the liquid fraction of anaerobically digested pig slurry (Digested S liquid). The pig slurry samples were sourced from a house for grower–finisher heavy pigs (160–180 kg/head), raised on a fully slatted-floor. Anaerobic digestion was performed in continuously fed laboratory reactors under mesophilic conditions (38–39°C), with a hydraulic retention time of 26 days and an organic loading rate of 1·35 kg volatile solids/m3/d. The solid and liquid fractions of untreated and digested slurries were separated using a laboratory centrifuge at 7000 rpm (Mantovi et al. Reference Mantovi, Fabbri, Soldano and Piccinini2009). All manure types were stored for a total of 120 days in 50-litre covered tanks at ambient temperatures to simulate farm storage before spreading. The different manures were then analysed for their main physical and chemical characteristics (Table 1) and stored at 4°C until the start of each trial.
Table 1. Main characteristics of the manures utilized in the experiment

* DM, dry matter.
† TOC, total organic carbon.
‡ TAN, total ammoniacal nitrogen.
The soil used in the experiment was collected during June 2008 from the tilled top 200 mm layer of two arable soil types in the western Po River Plain (Northern Italy). The two soils were labelled loam and silty-loam, based on their texture classification (Soil Survey Staff 1998) (Table 2). The soils were air dried and sieved at 5 mm to remove plant debris. A sample of each soil was ground (2 mm) prior to analysis for soil characterization. Loam and silty-loam soils have a sub-alkaline and a sub-acid reaction, respectively. While both of these soils were poor in organic matter and total N content, each had a different cation-exchange capacity (loam soil: low; silty-loam: medium) (Sposito Reference Sposito1989; Bourlot et al. Reference Bourlot, Barberis, Del Vecchio and Sacco2007). The bulk density of the dry soil, rewetted at 0·6 m3/m3 of water filled pore space (WFPS), was measured by drying 100 ml of soil (four replicates) at 105°C for 3 days; it equalled 1·34 and 1·45 g of dry soil/ml for loam and silty-loam soils, respectively.
Table 2. Main characteristics of the two soils utilized in the experiment

* TOC, total organic carbon.
Measurement system
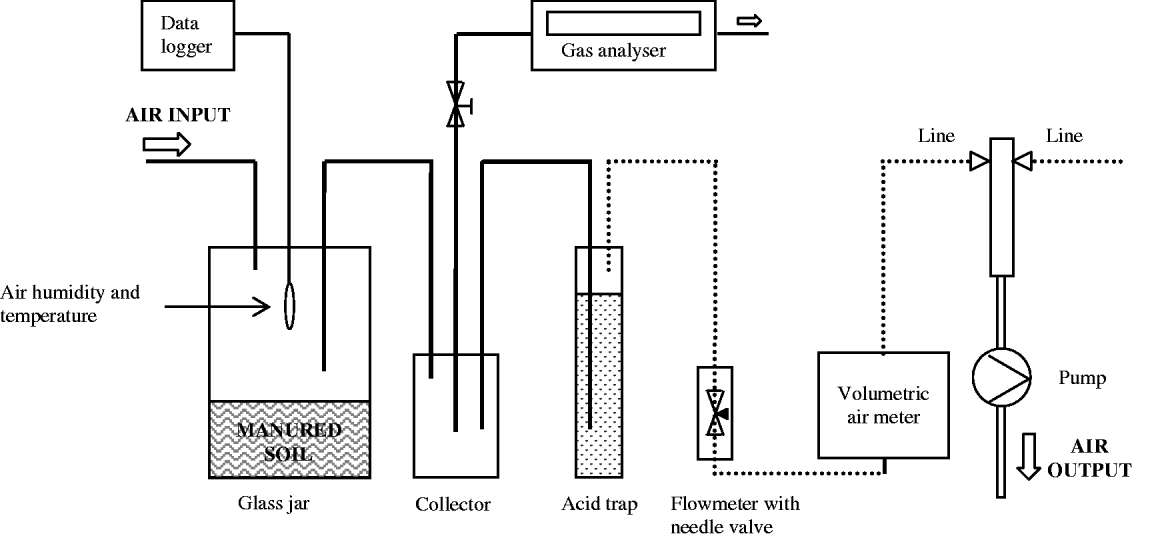
The measurement system (Fig. 1) was prepared in a climatic chamber and was composed of six measurement lines connected to a vacuum pump that provided airflow to the system. Each line was equipped with a cylindrical glass jar (3200 ml) for soil sample placement, a glass jar collector (1100 ml) for air sampling with a photoacoustic trace gas analyser (P-TGA) system (LumaSense Technologies, INNOVA 1412), a flow meter with needle valve for system air flow regulation and a volumetric air meter to measure total air passed through the line. One line was also equipped with a humidity and temperature data recorder to measure environmental conditions in the volatilization chamber. All parts had air-tight connections through input and output ports, using Teflon or nylon tubes with internal diameter of 4 mm. Teflon tubes were utilized to avoid NH3 adsorption in the system.
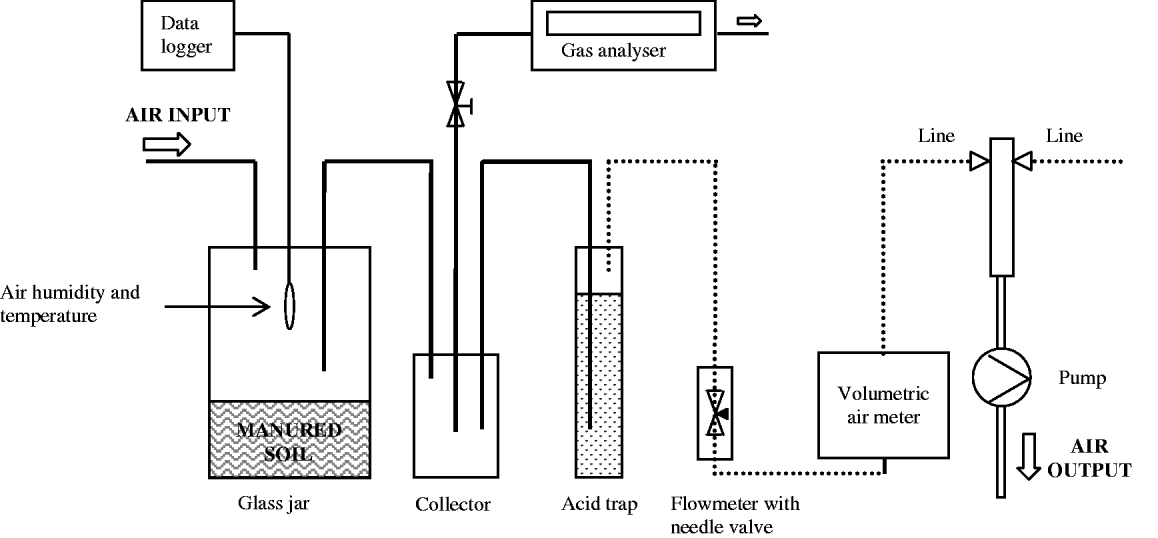
Fig. 1. Measurement system used in the experiment. Unbroken and dotted lines refer to Teflon and nylon tubes, respectively.
The air stream NH3 concentration was determined using the P-TGA. At each measurement, an air sample was collected by the P-TGA's internal pump by manually connecting it to the jar collector with a Teflon tube. The air suction/measurement cycle totalled 79 s, of which 38 s were for suctioning. The cycle was repeated three to four times until a steady-state NH3 concentration was attained (Dinuccio et al. Reference Dinuccio, Berg and Balsari2008), which represented the actual concentration of the air stream in the measurement system. The internal pump of the P-TGA had an average air flow rate of 24·7 ml/s so that the total amount of air subtracted from the system for one measurement was 2·82 litres. At the end of each measurement, the NH3 air entering the volatilization chambers (background) was monitored with the P-TGA and the amount was subtracted from the measured concentration of NH3. Under the operating conditions of this experiment, the limit of detection of the P-TGA was 0·2 mg/kg of NH3.
Ammonia volatilization experiment
The experiment was organized on a three randomized complete block design. Six cylindrical glass jars per block (three treatments per two soils) were filled with 1343 and 1451 g of dry soil for loam and silty-loam, respectively, to standardize to a final headspace volume of 2000 ml per jar. WFPS of 0·6 m3/m3 was attained by moistening the samples with 295 and 270 g of deionized water to loam and silty-loam, respectively. A pin-holed plastic film was used to cover each glass jar and then was placed in a climate-controlled room at 20°C for 6 days to stabilize the samples prior to experimental start. During this period, the jars were weighed each day; the water content was adjusted when necessary.
The experiment began with jar fertilization. Soil samples were fertilized manually on the jar's surface (0·0154 m2) at a rate of 90·7 kg N/ha. The fertilization time was different for every treatment and was recorded as a t 0 value for each jar. The measurement was then made in the same order as for fertilizer application. Immediately after fertilization, the six jars were closed, randomly connected to the lines of the measurement system and the pump was switched on. The flow rate settled at 2 litres/min, which corresponds to an air renewal rate of one headspace volume per minute in each volatilization chamber (Dinuccio et al. Reference Dinuccio, Berg and Balsari2008).
The experiment was conducted at 20°C for three different measurement sessions, representing the three blocks, which lasted about 50 h after fertilization.
A parallel experiment was carried out to evaluate the effect of incorporation on NH3 volatilization from untreated slurry. In this parallel experiment, untreated slurry was manually incorporated into the two soils at the same fertilization rate of the main treatments.
Measurement system evaluation
In order to evaluate the reliability of the method with P-TGA, a simultaneous comparison with the acid trap method was carried out. A Drechsel bottle (250 ml), for the containment of the acid trap solution (80 ml of 0·1 Normal sulphuric acid (N H2SO4) solution), was inserted into each line as showed in Fig. 1. The comparison between methods was carried out during five intervals of c. 3 h each during which the concentration of NH3 was measured three non-consecutive times for each treatment with P-TGA. At the end of each interval, the acid solutions contained in the acid traps were collected and the Drechsel bottles accurately washed with deionized water in order to remove all the trapped NH4+–N. The Drechsel bottles were then filled with acid trap solution if another interval of measurement was scheduled; otherwise, they were filled with deionized water. The acid traps samples were transferred to volumetric flasks, filled to 250 ml with deionized water and stored at 4 °C until the time for NH4+–N content analysis with an ionometer. The amount of NH3 trapped in acid solution during the measurement run was determined by a multi-meter equipped with a pH/Ion module and an ammonium selective electrode (ionometer, certified detection limit of 0·1 ppm of NH4+), and followed the method described by ISO TC 147/6778 (ISO 1984).
Data processing and analysis
Data measured by P-TGA were converted to an actual NH3–N emission surface rate by calculating the air flux rate using the elapsed time between the start and end of each measurement interval and their corresponding air volumes.
The emission rates measured for each replication were fitted using a least squares minimization procedure with the derivative of the Michaelis–Menten type equation (Eqn 1) presented by Sommer & Ersbøll (Reference Sommer and Ersbøll1994):
where t is the time from the fertilization event (h), dN/dt is the emission rate expressed in mg NH3–N/m2/h, N max is the total loss of NH3 (mg NH3–N/m2) as time approaches infinity, and parameter k m is the time t when N=½ N max. Moreover, parameter N max/k m represents the value of the emission rate (mg NH3–N/m2/h) when t=0.
The above mentioned parameters were analysed using an ANOVA procedure considering manure and soil as fixed effects, and their interaction and block as random effects.
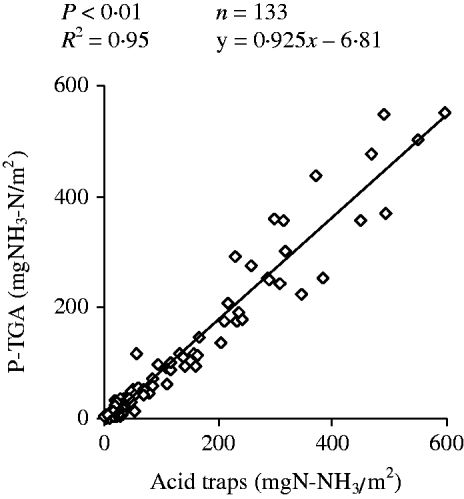
Emission data have been reported throughout the text as mean value±standard error of the mean (s.e.m.). In order to compare the P-TGA data with the NH3 trapped in the acid solution, total NH3–N emitted during each 3 h measurement interval was calculated by integrating the P-TGA data with the fitted equations for the time intervals. A linear regression analysis was carried out to compare these results with the total amount of measured NH3–N emitted using acid traps. The analysis was performed using the five measurement interval results, excluding the data below the detection limits of the P-TGA and ionometer (final n=133).
RESULTS
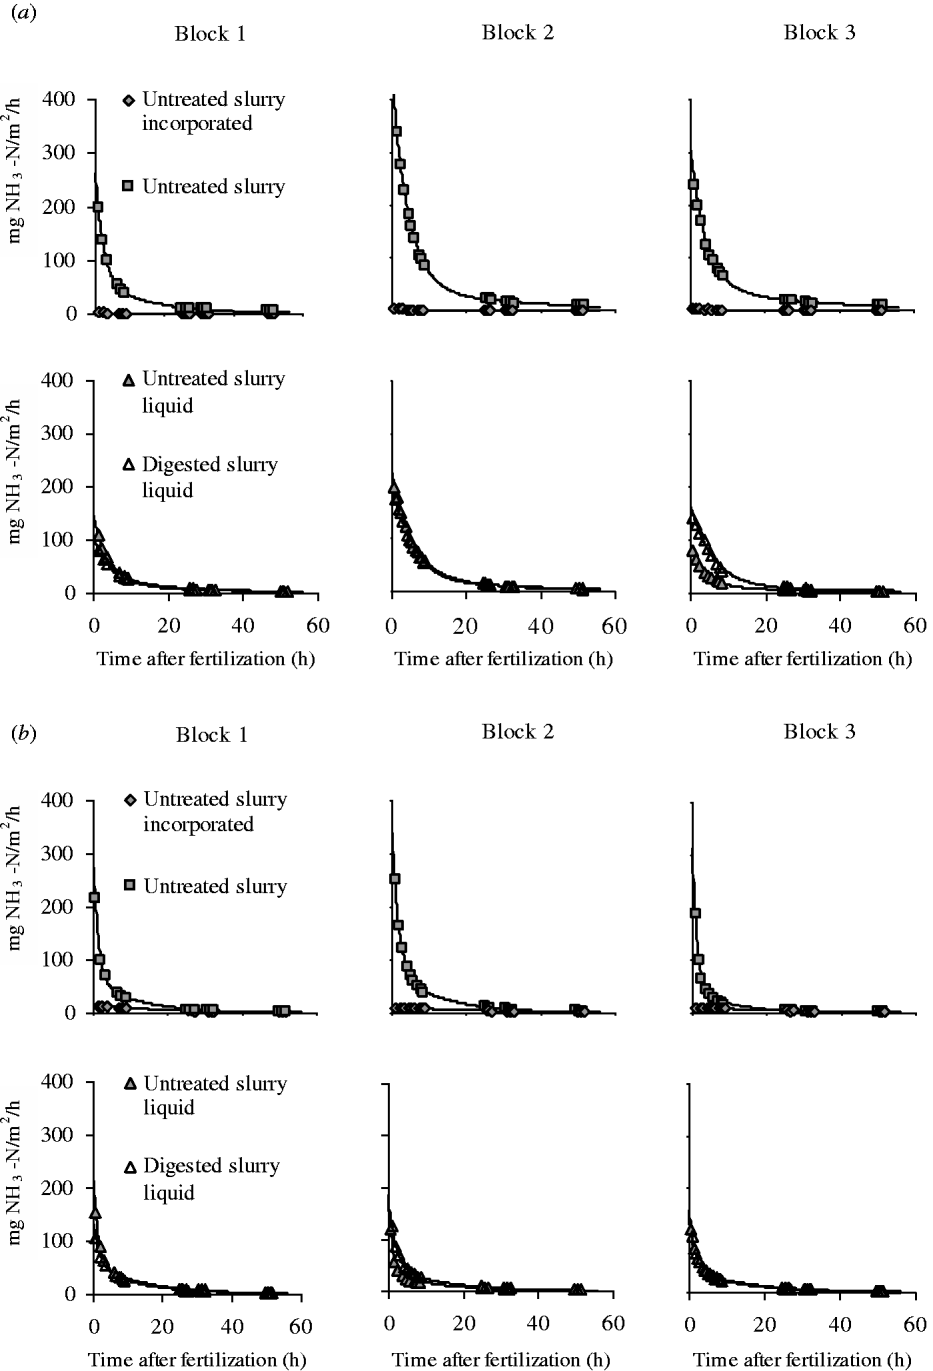
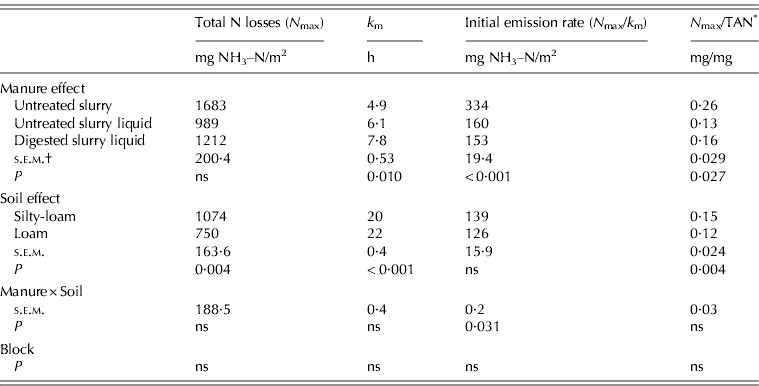
Measured NH3–N emission rates shown in Fig. 2 were significantly fitted with the derivative of the Michaelis–Menten equation (average R 2=0·99). As expected, surface-applied treatments showed very high emission rates immediately after fertilization, followed by a strong reduction in a few hours thereafter. In the Michaelis–Menten equation, these results correspond to a high initial emission rate (216·0 mg NH3–N/m2/h, on average) (Table 3). The low k m values also confirmed the quick reduction in emission rates during the first hours (6·3 h, on average).
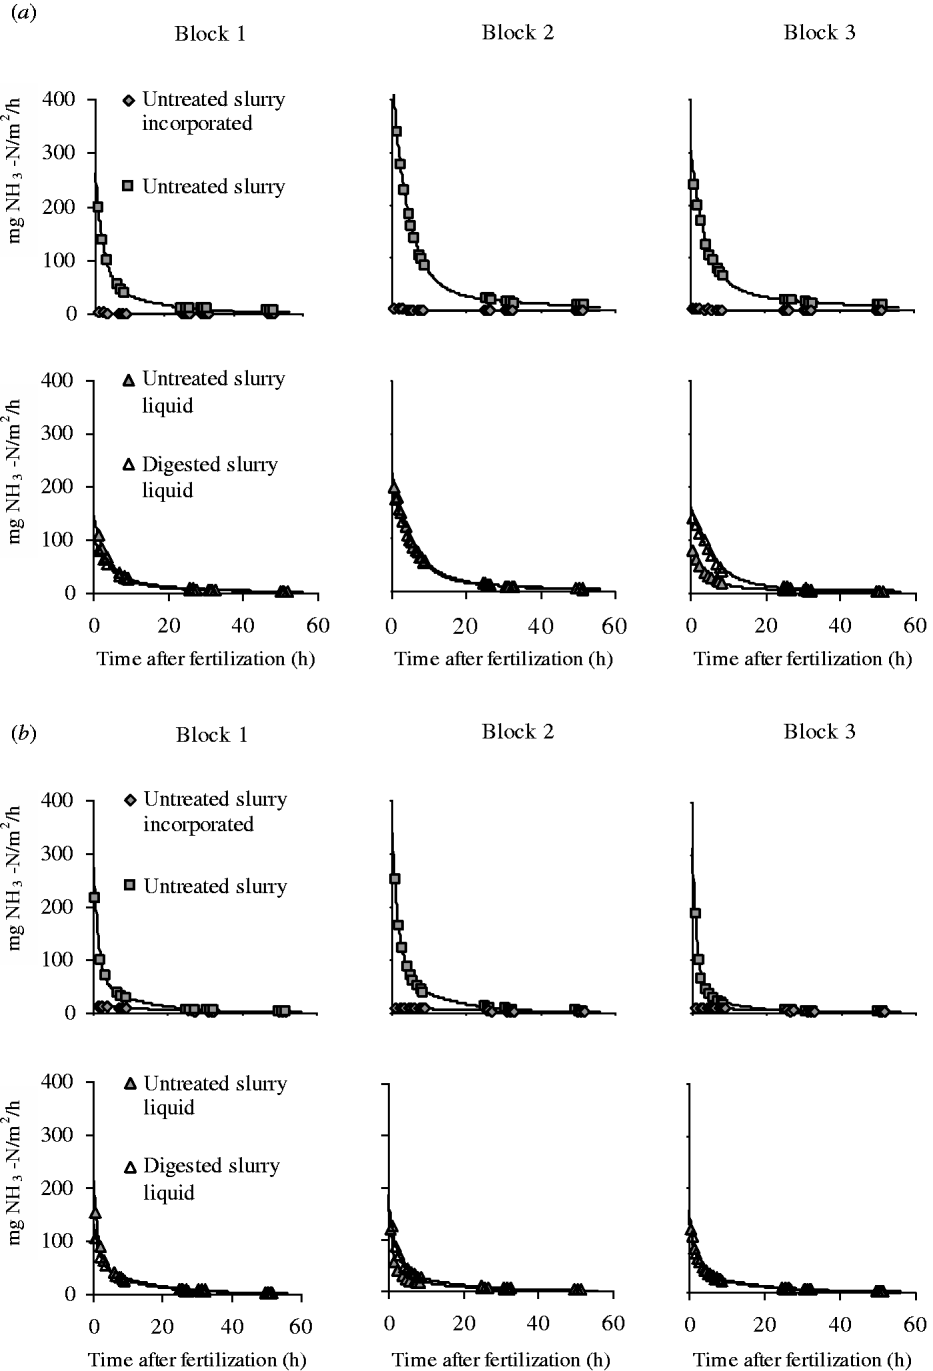
Fig. 2. NH3–N emission rates measured with the dynamic chambers combined with photoacoustic infrared gas analyser for the different fertilizer treatments in (a) silty-loam and (b) loam soils. Continuous lines represent the Michaelis–Menten fitting equation.
Table 3. Estimated values of the parameters of the Michaelis–Menten equation (dAE/dt=Nmax (km/(t+km)2)) and the results of ANOVA for the surface-applied manure treatments (d.f. of residual=10)

* TAN, total ammoniacal nitrogen.
† s.e.m., standard error of the mean.
ns, not significant.
Manure had no significant effect on total N losses, but the ratio total N losses/TAN was significantly affected. Untreated S showed a higher value (0·26 mg/mg) than Untreated S liquid (0·13 mg/mg), while the difference between the Untreated S liquid and the Digested S liquid treatment was not significant. Soil effect was highly significant both for total N losses and total N losses/TAN, showing higher values in silty-loam than in loam.
The initial emission rate was significantly influenced by the manure×soil interaction. Specifically, Untreated S showed higher emission rates in both soils (334·4 mg/NH3–N/m2/h, on average) v. the value for the liquid fraction of untreated and digested slurry (160·2 and 153·4 mgNH3–N/m2/h, respectively), with larger differences in silty-loam than loam soil.
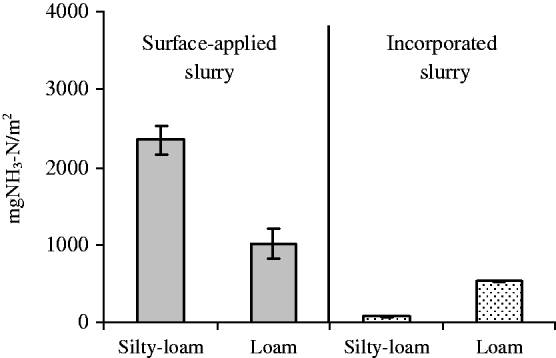
Incorporating untreated slurry caused very low and constant emission rates throughout the experiment (Fig. 2), with a low initial emission rate (7·6 mg NH3–N/m2/h) and a high k m value (39·0 h). Incorporated untreated slurry showed low total N losses (308·0 mg NH3–N/m2, averaged across the two soils) (Fig. 3), which represents a reduction of 81·7% compared with surface-applied slurry. Moreover, when slurry is incorporated, there is a tendency for higher emissions in loam than in silty-loam soil, as evidenced by the values of total N losses (537·1 and 79·0 mg NH3–N/m2, respectively).

Fig. 3. Total NH3–N losses from untreated slurry surface-applied and incorporated in the two soils utilized in the experiment. Error bars represent the s.e.m.
The linear regression between the P-TGA and the acid traps methods for NH3–N emission assessment (Fig. 4) was highly significant (R 2=0·95). However, when using P-TGA, a small underestimation was indicated by the coefficients (0·925±0·037) and intercept (–4·21±5·72 mg NH3/m2) of the linear equation.
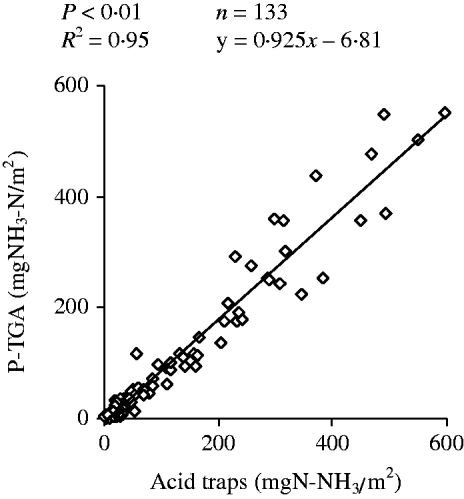
Fig. 4. Linear regression between NH3 emission estimated by dynamic chambers using acid traps (x) and photoacoustic infrared gas analyser (P-TGA; y) methods.
DISCUSSION
Treatments comparison
For surface-applied untreated pig slurry, total N losses averaged 0·26±0·064 mg/mg of applied TAN across the two soils. These values were similar to those reported by Sommer & Ersbøll (Reference Sommer and Ersbøll1994) for field application of pig slurry on harrowed sandy-loam soil. Moreover, the values of total N losses expressed as a percent of TAN are within the range reported by Misselbrook et al. (Reference Misselbrook, Nicholson and Chambers2005) for field application of pig slurry with low DM content. The emission inventory guidebook (Hutchings et al. Reference Hutchings, Amon, Dämmgen and Webb2009) indicated an emission factor for spread swine slurry of 0·40 of TAN within a range of 0·20–0·80; Reidy et al. (Reference Reidy, Dammgen, Dohler, Eurich-Menden, Van Evert, Hutchings, Luesink, Menzi, Misselbrook, Monteny and Webb2008) reported factors between 0·25 and 0·68.
Total N losses/TAN values were 0·13±0·064 for the liquid fraction of pig slurry and 0·16±0·064 for the liquid fraction of digested pig slurry, which suggests that NH3 emission from land application can be reduced when swine slurry is treated. Generally, it is assumed that a strong, positive relationship between slurry–DM content and volatilization exists (Søgaard et al. Reference Søgaard, Sommer, Hutchings, Huijsmans, Bussink and Nicholson2002; Sommer et al. Reference Sommer, Genermont, Cellier, Hutchings, Olesen and Morvan2003; Misselbrook et al. Reference Misselbrook, Nicholson and Chambers2005) due to the rapid infiltration of diluted slurries into the soil. Solid/liquid separation of both untreated and digested slurry reduces the DM content of the liquid fraction, thereby causing a NH3 emission reduction after application. The intermediate value of emission for the liquid fraction of digested slurry was probably due to the higher pH of this treated manure that counterbalanced the increased infiltration rate. Previous field studies on NH3 emissions from land application of anaerobic digested slurries have yielded contrasting results. Rubǽk et al. (Reference Rubǽk, Henriksen, Petersen, Rasmussen and Sommer1996) reported lower emissions with digested rather than with untreated cattle slurry after ryegrass surface application. While not significant, Pain et al. (Reference Pain, Misselbrook, Clarkson and Rees1990) found a tendency of digested pig slurry to reduce NH3 emissions compared with undigested slurry on grassland. Specifically, the authors reported a total N loss/TAN ratio of 0·21 and 0·13 for undigested and digested slurry, respectively, 48 h after land application. In contrast, others (Wulf et al. Reference Wulf, Maeting and Clemens2002; Chantigny et al. Reference Chantigny, Rochette, Angers, Massé and Côté2004; Amon et al. Reference Amon, Kryvoruchko, Amon and Zechmeister-Boltenstern2006) have reported NH3 emission values in a similar range for different digested slurries as opposed to untreated slurries. Chantigny et al. (Reference Chantigny, Angers, Rochette, Belánger, Massé and Côté2007) concluded that the discrepancy among studies might be explained by the higher pH of anaerobic digested slurry which could offset the benefit of improved infiltration.
Loam soil showed a lower total N loss than silty-loam soil for surface-applied slurries. This was probably due to its higher sand content that increased the slurry infiltration rate. Whatever process lay behind this difference, it was able to overcome the effect of the higher pH and lower cation-exchange capacity of the loam v. that of the silty-loam soil. However, in the instance of the incorporated untreated slurry, a higher volatilization was recorded in loam than in silty-loam soil, which might have been caused by the different pH of the two soils. These results underscored the importance of considering soil characteristics and different soil types when evaluating NH3 emissions from fertilizers.
Many cost-effective abatement techniques have been proposed to reduce NH3 volatilization. Broadcast application and immediate incorporation by plough reduced emissions by 80–90% on arable land (Hutchings et al. Reference Hutchings, Amon, Dämmgen and Webb2009). The average value found in the present experiment (82%) is within the expected range, even though the amount of NH3 emitted was estimated in laboratory and the incorporation was performed manually. Moreover, the low values of k m estimated for surface-applied manure treatments showed that half of the NH3 is emitted within 6 h after manure spreading; this result points to the importance of implementing regulations on immediate incorporation of manure.
The Michaelis–Menten equation described the pattern of NH3–N emission rates after manure application well. Several authors (Sommer & Ersbøll Reference Sommer and Ersbøll1994; Søgaard et al. Reference Søgaard, Sommer, Hutchings, Huijsmans, Bussink and Nicholson2002; Misselbrook et al. Reference Misselbrook, Nicholson and Chambers2005) have used this equation to model accumulated NH3 losses from field-applied manure, which relates equation parameters to measured variables, such as soil properties, manure properties and environmental conditions. In contrast, Sommer et al. (Reference Sommer, Jensen, Clausen and Søgaard2006) found that the Michaelis–Menten equation could not be fitted to NH3 emissions from slurry measured in dynamic chambers, and concluded that this model was not suitable for laboratory result interpretation. The present experiment gives an operational outcome for the analysis of potential NH3–N emissions under constant laboratory conditions and demonstrates the possibility of fitting the results to the Michaelis–Menten equation if NH3 emission rates are directly measured.
Measurement system evaluation
The present investigations highlighted several benefits associated with the P-TGA method to measure NH3 volatilization. First, the experiment showed that the combination of a photoacoustic infrared gas analyser with dynamic chambers could make reliable assessments of potential NH3 emissions when compared with the more frequently used acid traps. Second and distinct from the latter, direct NH3 concentration measurement with a P-TGA allows temporal resolution to improve the assessment of NH3 emission from manures. Specifically, the measurement system allowed the production of high-quality analyses of good fit, which permitted a good evaluation of the process dynamics. Third, the P-TGA system is less time-consuming both during dynamic chamber operations and for sample analyses compared with the acid-traps method. Although there is the initial cost of the instrument and scheduled maintenance (once or twice a year), it allows for a drastic reduction in the time and costs of NH4+ determination. Moreover, the measurement time schedule can be easily tested and modified to better match the NH3 volatilization dynamics, so that NH3 emissions can be determined for a wide range of fertilizer and soil types.
The Italian Ministry for Agriculture, Food and Forestry Policies research project ‘Assessment of the effects of the anaerobic digestion process on nitrogen availability in livestock manures’, coordinated by CRPA, Reggio Emilia, financed this research.


