


Management Implications
Linaria dalmatica (Dalmatian toadflax) and Linaria vulgaris (yellow toadflax) are nonnative perennials found throughout much of North America. Both species are aggressive invaders in western states, forming persistent colonies through root and rhizome spread and seed production. Hybrids resulting from cross-pollination between L. dalmatica and L. vulgaris have greater growth and reproductive potential than either of the parent species and are more difficult to control using currently available herbicides or biocontrol agents. Successful management of any weedy Linaria species depends on early detection, especially for invasive hybrid populations, but effective scouting over large expanses of wildland and rangeland in the Rocky Mountain region is generally impractical. Prior knowledge of areas vulnerable to invasion, especially by Linaria hybrids, would allow more effective direction of limited management resources. In this study, we used species distribution modeling based on environmental covariates associated with known locations of Linaria occurrence to identify regions of Montana, Wyoming, and Colorado at greatest risk of future invasion by L. dalmatica, L. vulgaris, and hybrid Linaria populations. Some areas where reports of L. dalmatica and L. vulgaris are sparse or nonexistent were nevertheless identified by our models as suitable habitat for Linaria hybrids. These areas should be prioritized for monitoring to facilitate elimination of hybrid populations while they are small enough for this to be feasible.
Introduction
Recent studies have explored the role of interspecific hybridization in stimulating new plant invasions or accelerating invasions already in progress (e.g., Gaskin Reference Gaskin2017; Hovick and Whitney Reference Hovick and Whitney2014; Hovick et al. Reference Hovick, Campbell, Snow and Whitney2012; Schierenbeck and Ellstrand Reference Schierenbeck and Ellstrand2009). Gene exchange between differentiated taxa can facilitate invasion in several different ways. Hybridization between introduced and native congeners may result in acquisition of adaptive alleles by the invading species (Rieseberg et al. Reference Rieseberg, Kim, Randell, Whitney, Gross, Lexer and Clay2007), while similar gene flow at the edge of an invasion front can enable isolated colonizing individuals to overcome Allee effects (Mesgaran et al. Reference Mesgaran, Lewis, Ades, Donohue, Ohadi, Li and Cousens2016). Hybridization in an invaded range, whether between an introduced and a native species, or between newly sympatric nonnative taxa, generates novel recombinant genotypes that may outcompete and displace the parent species in the invaded habitat: reported examples include Spartina (Ort and Thornton Reference Ort and Thornton2016), Fallopia (Parepa et al. Reference Parepa, Fischer, Krebs and Bossdorf2014), and Typha (Zapfe and Freeland Reference Zapfe and Freeland2015). There is also evidence that genome rearrangement and gene shuffling following hybridization can generate phenotypes capable of invading new habitats beyond the ranges occupied by the parent species (Hovick and Whitney Reference Hovick and Whitney2014; Rieseberg et al. Reference Rieseberg, Archer and Wayne1999).
Dalmatian toadflax [Linaria dalmatica (L.) Mill.], yellow toadflax (Linaria vulgaris Mill.), and their hybrids are invasive plants in the U.S. Intermountain West and other regions of North America. Linaria dalmatica is native to the Mediterranean (Alex Reference Alex1962) and was introduced to the United States in the late 1800s, possibly as an ornamental (Vujnovic and Wein Reference Vujnovic and Wein1997); it is now classified as a noxious weed in seven states (USDA-NRCS 2018). The native range of L. vulgaris extends from northern and central Europe into temperate Eurasia. It was brought to the eastern United States as a medicinal herb by European settlers in the late 17th century and became the first nonnative plant invasion to be recorded in North America: by the 1750s, expanding L. vulgaris populations were observed spreading beyond areas where they were originally planted (Mack Reference Mack2003). Linaria vulgaris has since invaded all lower 48 states, Alaska, and 9 Canadian provinces, and is listed as a noxious weed in 8 states (USDA-NRCS 2018). The native ranges of L. dalmatica and L. vulgaris do not overlap, and hybridization between these congeners has not been reported in Eurasia (Sutton Reference Sutton1988). Both species are perennial forbs that generally colonize disturbed areas (Arnold Reference Arnold1982; Vujnovic and Wein Reference Vujnovic and Wein1997), though L. vulgaris has also invaded intact native plant communities in high-elevation wilderness areas (Sutton et al. Reference Sutton, Stohlgren and Beck2007). These Linaria species are obligate outcrossers that can spread via roots and rhizomes (Saner et al. Reference Saner, Clements, Hall, Doohan and Crompton1995; Vujnovic and Wein Reference Vujnovic and Wein1997), and both have high levels of intraspecific genetic diversity within and among invading populations throughout their North American ranges (Boswell et al. Reference Boswell, Sing and Ward2016; Brown Reference Brown2008; Ward et al. Reference Ward, Reid, Harrington, Sutton and Beck2008).
It is unknown when co-invasion and gene flow between L. dalmatica and L. vulgaris first occurred in our study area of Montana, Wyoming, and Colorado. These interspecific hybrids were confirmed relatively recently (Ward et al. Reference Ward, Fleischmann, Turner and Sing2009), although cryptic hybrids resulting from several generations of backcrossing may be more widespread in invasive Linaria populations than previously realized (Boswell et al. Reference Boswell, Sing and Ward2016). Early-generation hybrids betweenL. dalmatica and L. vulgaris are vigorous fertile perennials that are morphologically intermediate compared with the parents; pollination among hybrids or via backcrossing to either parent also produces fertile progeny, resulting in complex multigenerational hybrid swarms in the field (Ward et al. Reference Ward, Fleischmann, Turner and Sing2009). These hybrid populations are of concern, because both parent species are highly invasive, and experimental evidence indicates their heterotic progeny are likely to be even more invasive. In a series of common garden experiments conducted in Colorado and Montana, hybrid Linaria genotypes outperformed the parent taxa across a number of vegetative and reproductive traits, including earlier emergence from dormancy, greater seasonal biomass accumulation, longer flowering time, larger number of flowering shoots, and more prolific seed production (Turner MFS 2012). Potential outcomes of hybridization between L. dalmatica and L. vulgaris include hybrid populations displacing one or both parents in currently invaded areas and expansion of hybrid genotypes with greater ecological amplitude into areas previously uninvaded by Linaria. Hybrid Linaria populations present additional management challenges, as currently available chemical and biological controls are often less effective on these populations (Sing et al. Reference Sing, De Clerck-Floate, Hansen, Pearce, Randall, Toševski and Ward2016). Accurate taxonomic identification can be complicated by decreasing morphological differences between late-generation backcrossed hybrids and the recurrent parent (Olson et al. Reference Olson, Paul and Freeland2009), leading in the case of Linaria hybrids to deployment of biocontrol agents that are suboptimally matched with the host plants (Boswell et al. Reference Boswell, Sing and Ward2016; Sing et al. Reference Sing, De Clerck-Floate, Hansen, Pearce, Randall, Toševski and Ward2016).
During initial stages of invasion, sparsely distributed colonizing populations often remain undetected until the invasion has become widespread (Mack et al. Reference Mack, Simberloff, Lonsdale, Evans, Clout and Bazzaz2000; Maxwell et al. Reference Maxwell, Backus, Hohmann, Irvine, Lawrence, Lehnhoff and Rew2012; Rauber et al. Reference Rauber, Cipriotti, Collantes, Martini and Frers2016). Spatial estimates of potential invasive distribution, such as those generated by statistical modeling, can help land managers prioritize resource allocation to locate invaders before eradication becomes unfeasible or prohibitively expensive (Kaplan et al. Reference Kaplan, van Niekerk, Le Roux, Richardson and Wilson2014; Koncki and Aronson Reference Koncki and Aronson2015; West et al. Reference West, Kumar, Brown, Stohlgren and Bromberg2016). Improved geographic information systems (GIS) and greater availability of modeling algorithms and detailed geospatial environmental data, including remote sensing data (Shafii et al. Reference Shafii, Price, Prather, Lass and Thill2003), have led to the use of species distribution modeling for many applications in ecological research (Jarnevich et al. Reference Jarnevich, Stohlgren, Kumar, Morisette and Holcombe2015; Peterson et al. Reference Peterson, Soberon, Pearson, Anderson, Martinez-Meyer, Nakamura and Araujo2011). Modeling aids assessment of future areas of invasion, because requisite data can be obtained relatively quickly, and models have also been shown to accurately predict future invasion areas (Jarnevich et al. Reference Jarnevich, Holcombe, Barnett, Stohlgren and Kartesz2010; Koncki and Aronson Reference Koncki and Aronson2015; West et al. Reference West, Kumar, Brown, Stohlgren and Bromberg2016). Species distribution models empirically relate species occurrence data and environmental covariates to create environmental suitability maps for a defined area (Elith and Leathwick Reference Elith and Leathwick2009). These models also identify the most significant environmental conditions contributing to distribution of a species, which is useful, as early detection of infestations is more effective when supported by knowledge of conditions that promote species invasions (Bradley and Marvin Reference Bradley and Marvin2011).
Maximum entropy (MaxEnt) modeling estimates the probability of species presence throughout a delineated study area by relating species occurrence at known locations to environmental characteristics of those locations (Fourcade et al. Reference Fourcade, Engler, Rodder and Secondi2014; Phillips et al. Reference Phillips, Anderson and Schapire2006). MaxEnt has been widely used as a species distribution modeling application for inferring species distributions, niches, and environmental tolerances (Warren and Seifert Reference Warren and Seifert2011). MaxEnt applies a machine learning technique that is not affected by sample size in the same way as generalized linear or additive statistical models and is therefore well suited for species with a small number of occurrence records (Benito et al. Reference Benito, Martinez-Ortega, Munoz, Lorite and Penas2009; López-Alvarez et al. Reference López-Alvarez, Manzaneda, Rey, Giraldo, Benavente, Allainguillaume, Mur, Caicedo, Hazen and Breiman2015), due to its regularization procedure, which prevents overfitting (Hernandez et al. Reference Hernandez, Graham, Master and Albert2006; Phillips et al. Reference Phillips, Anderson and Schapire2006). A comparison of different species distribution models showed superior performance for MaxEnt, even with small sample sizes (Wisz et al. Reference Wisz, Hijmans, Li, Peterson, Graham and Guisan2008), and MaxEnt has been successfully used to predict species distributions with as few data points as 5 (Pearson et al. Reference Pearson, Raxworthy, Nakamura and Peterson2007) and 11 (Kumar and Stohlgren Reference Kumar and Stohlgren2009). MaxEnt models developed from small sample sizes are also effective at predicting species occurrence in previously unsurveyed areas (Rebelo and Jones Reference Rebelo and Jones2010). These are important considerations when modeling a newly emerged invasive such as hybrid Linaria for which there are as yet few confirmed occurrences.
This research used MaxEnt modeling in combination with GIS processing to identify areas vulnerable to Linaria invasion in the northern Rockies. The objectives were (1) to identify the most important contributing environmental covariates associated with distributions of invasive L. dalmatica, L. vulgaris, and their hybrids; (2) to create environmental suitability maps for these three Linaria taxa; (3) to create overlay and environmental suitability maps estimating areas most at risk for Linaria hybrid distribution; and (4) to compare two different MaxEnt modeling approaches by measuring the degree of agreement between these environmental suitability and overlay maps.
Materials and Methods
Study Area
Our study area consisted of Montana, Wyoming, and Colorado, three states that comprise a large part of the drier Intermountain West. These states form a large contiguous unit with mountainous western zones and eastern plains, and they experience similar seasonal weather patterns, with a north–south latitudinal gradient for variables such as temperature, photoperiod, and length of growing season. The Rocky Mountains and the western Continental Divide run roughly north to south through all three states; this mountain range encompasses significant elevation differences and geographic variation, driving local variation in climatic conditions. East of the Rocky Mountains, the lower-elevation Great Plains region extends through all three states, characterized by higher mean temperatures and a longer growing season (WRCC 2016). Elevation in this study area ranges from 550 to 4,400 m (1,800 to 14,433 feet). Mean annual precipitation throughout the three-state area varies from highs of approximately 290 cm in the mountains to lows of less than 14 cm in southwestern Wyoming and south-central Colorado (Wang et al. Reference Wang, Hamann, Spittlehouse and Murdock2012). The most prevalent types of land cover and land uses in the study area are coniferous forest, grazed rangelands, farming, and some developed urban locations, representing a broad array of ecosystems and plant communities (USDA 2012).
Occurrence Data
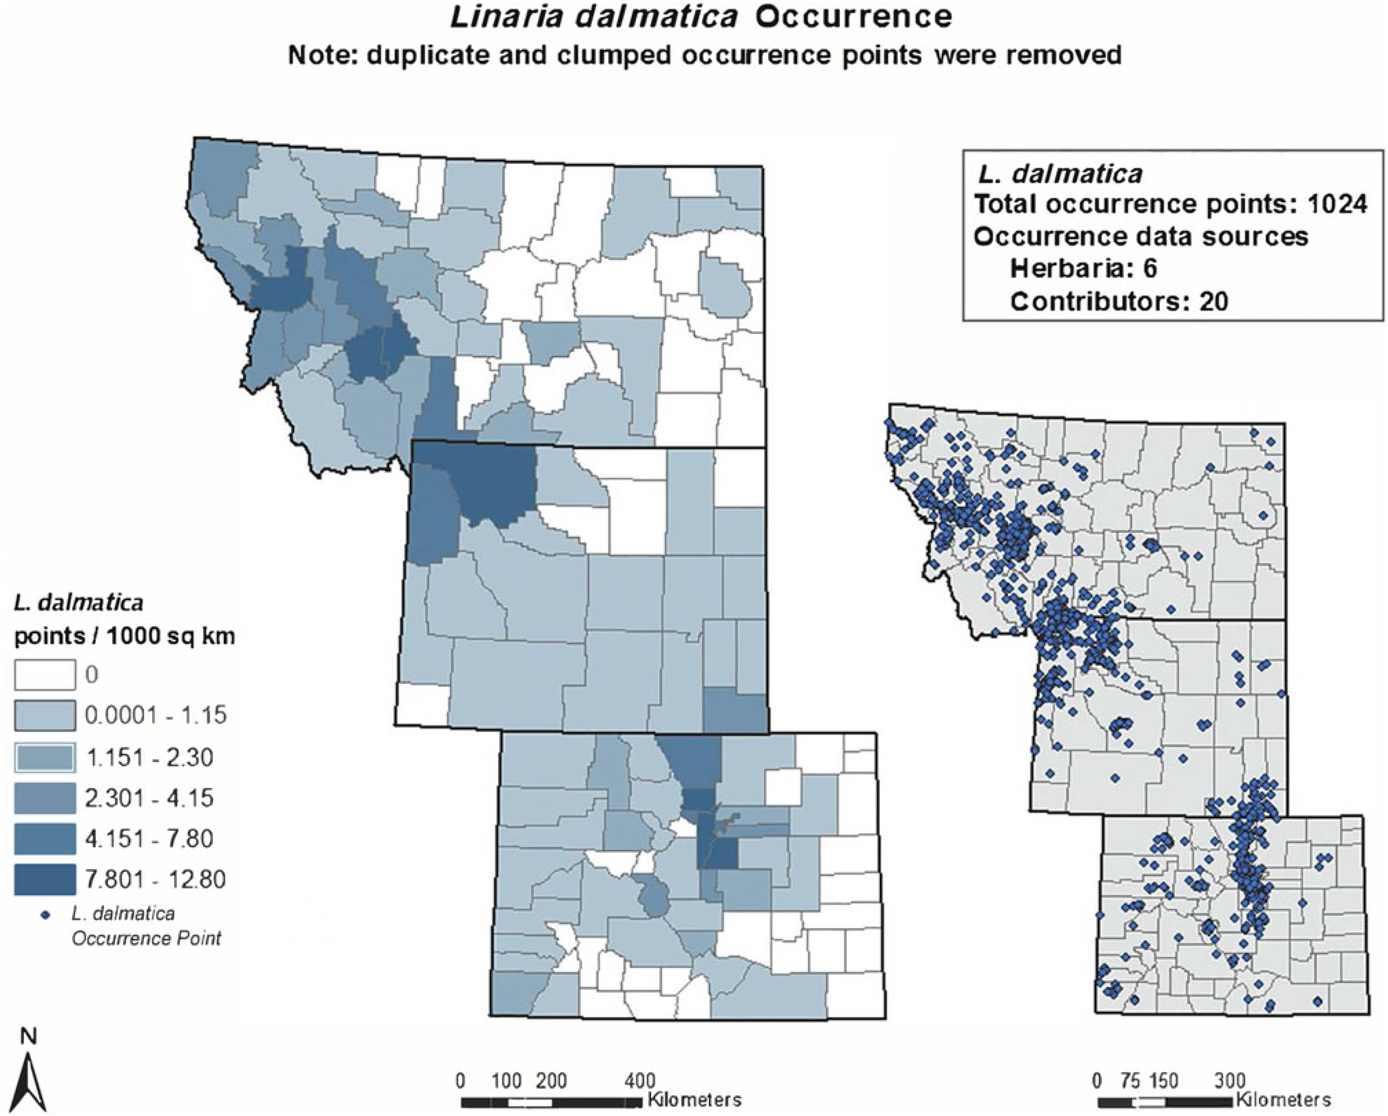
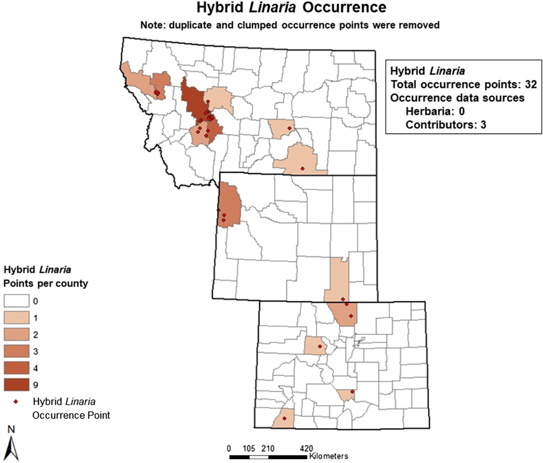
Occurrence data for L. dalmatica, L. vulgaris, and their hybrids were obtained from seven online herbaria accessed between November 22 and December 13, 2016: Rocky Mountain Region Digital Herbarium, University of Wyoming (2016), SEINet (2016), Consortium of Pacific Northwest Herbaria, University of Washington (2016), Global Biodiversity Information Facility (2016), Early Detection and Distribution Mapping System, University of Georgia (2016), University of Colorado–Boulder Museum of Natural History (2016), and iDigBio (2016). Occurrence data were also provided by individual contributors throughout the three-state area, ranging from county weed managers to federal agency regional managers. Twenty individuals contributed occurrence data for L. dalmatica and 18 for L. vulgaris, but only three for hybrids, indicative of low levels of recognition of hybrid populations and limited knowledge of their prevalence. We confirmed the taxonomic identity of all hybrid populations recorded as occurrence points, based on intermediate morphology as described in Ward et al. Reference Ward, Fleischmann, Turner and Sing(2009). For putative hybrid populations for which plant morphology was ambiguous, we used cpDNA and ncDNA markers as described by Boswell et al. Reference Boswell, Sing and Ward(2016) and Ward et al. Reference Ward, Fleischmann, Turner and Sing(2009) to confirm taxonomic identity. See Figures 1–3 for occurrence maps for each taxon.

Figure 1. Linaria dalmatica occurrence shown graphically as points per 1,000 km2 in each county of the study area and points of occurrence throughout the area. This map reflects where L. dalmatica was recorded by an observer, which may imply some degree of sampling bias, as not all areas were sampled equally.

Figure 2. Linaria vulgaris occurrence shown graphically as points per 1,000 km2 in each county of the study area and points of occurrence throughout the area. This map reflects where L. vulgaris was recorded by an observer, which may imply some degree of sampling bias, as not all areas were sampled equally.

Figure 3. Map of observed hybrid Linaria occurrence showing count of points per county.
After acquiring occurrence data for all taxa, we executed a spatial filtering step to reduce spatial autocorrelation (Brown Reference Brown2014). Filtering methods outperform unfiltered methods in correcting for sampling bias, which increases spatial autocorrelation and may lead to overfitted models with falsely high-performance values (Boria et al. Reference Boria, Olson, Goodman and Anderson2014; Dormann Reference Dormann2007). The spatial filtering step was performed in ArcGIS v. 10.2 using the Spatially Rarefy Occurrence Data tool in SDMtoolbox (Brown Reference Brown2014). This step eliminated duplicate points within a 3-km radius due to dense clustering of points in more intensively sampled areas. This step prevents statistically overweighting a clustered area. When filtering was complete, 1,024 points remained for L. dalmatica, 1,159 for L. vulgaris, and 32 for hybrids; these occurrence data were inputs for the subsequent modeling process.
Occurrence location bias on a larger spatial scale was addressed by creating a bias layer using the Gaussian Kernel Density tool in SDMtoolbox (Brown Reference Brown2014) and then inputting the layer into each MaxEnt run. The bias layer downweights the importance of occurrence points in regions greater than a 3-km radius with a greater number of samples (Elith et al. Reference Elith, Kearney and Phillips2010). This corrects for potential sampling bias and mitigates clumping resulting from more prevalent occurrence data in areas that are of greater botanical or management interest or exposed to increased human activity. For example, our original data set included multiple reports of invasive Linaria populations for the Greater Yellowstone area and the Colorado Front Range. These are likely sources of bias, because compared with other parts of our study area, the larger numbers of reported occurrences are likely to reflect increased human observation rather than a greater density of Linaria populations.
Environmental Covariates
There is little information on which environmental factors are the most important drivers of invasive Linaria establishment in the northern Rockies. Based on the biological and ecological characteristics of the Linaria taxa described earlier, we therefore selected 73 environmental covariates in the form of GIS layers for preliminary evaluation as possible distribution predictors (Supplementary Table 1). These covariates were categorized by climate, land use or cover, phenology metrics, soils, topography, and remote sensing–derived vegetation indices. The spatial resolution for all GIS layers was 1 km2 and Albers equal area conic was the coordinate system used. Some layers required resampling to conform to 1-km2 spatial resolution.
We downloaded and processed climate data using ClimateWNA (Climate Western North America) v. 5.30 (Wang et al. Reference Wang, Hamann, Spittlehouse and Murdock2012). Decadal, seasonal, and annual data for 1991 to 2000 and 2001 to 2010 were obtained for the study area. The inputs to ClimateWNA were a raster of the area and a selection of variables to download. An R script was created to average the two decadal layers for each covariate to generate 20-yr mean layers.
We then incorporated a land use/cover layer for 2011 from the National Land Cover Database provided by the Multi-Resolution Land Characteristics Consortium (Homer et al. Reference Homer, Dewitz, Yang, Jin, Danielson, Xian, Coulston, Herold, Wickham and Megown2015). This national layer was clipped to our study area following recommended protocols (MRLC 2016).
The phenology metrics and the vegetation drought response index (VegDRI) were downloaded from the U.S. Geological Survey EarthExplorer Web application (USGS 2016a). VegDRI weekly data were downloaded for 2010 to 2015; phenology metrics annual data were downloaded for 2010 to 2014 (2015 data were unavailable when modeling was performed). We calculated the annual and later the multiyear mean and standard deviation layers for the VegDRI and phenology metrics layers. For example, the 5 yr of VegDRI mean layers were averaged into a single layer representing the multiyear mean; the same processing was performed for 4 yr of phenology metrics data.
Soil data were downloaded from the World Soil Information site in the SoilGrids collection (Hengl et al. Reference Hengl, Mendes de Jesus, Heuvelink, Gonzalez, Kilibarda, Blagoti, Shangguan, Wright, Geng, Bauer-Marschallinger, Guevara, Vargas, MacMillan, Batjes, Leenaars, Ribeiro, Wheeler, Mantel and Kempen[2017] through ISRIC WDC-Soils). The proportion of clay at 0 to 5 cm was found to be a significant contributor to an earlier species distribution model for L. vulgaris created during preliminary research; clay percentages at depths of 0 to 5 cm and 5 to 15 cm were therefore evaluated as covariates for this expanded modeling project. We then used Earth Explorer to download the Global 30 Arc-Second Elevation GTOPO30 Digital Elevation Model (DEM) product (USGS 2016a). These data were analyzed in ArcGIS v. 10.2 to create layers for slope and aspect. The euclidean distance from the water layer was constructed from this DEM, and the vector water-body data for the study area were obtained from Earth Explorer.
Finally, we retrieved the normalized difference vegetation index (NDVI) and enhanced vegetation index products (MOD13A3 Vegetation Indices Monthly 1km) from the online MODIS Reprojection Tool (USGS 2016b). These products were obtained for each month from 2010 to 2015, then monthly data were averaged for each year, and the 6 yr were averaged for the final multiyear mean and standard deviation layers.
Species Distribution Modeling and Environmental Suitability Maps
Given its performance in estimating potential distributions compared with other modeling techniques (Phillips and Dudik Reference Phillips and Dudik2008), we chose maximum entropy modeling or MaxEnt (Phillips et al. Reference Phillips, Anderson and Schapire2006) to create environmental suitability maps. The entire MaxEnt modeling process was performed separately for each Linaria taxon.
The covariate selection process was performed incrementally using layers from each group of environmental covariates to determine which layers were the most significant contributors to taxon-specific estimated distributions. Covariates were grouped based on similar sources, such as climate or phenology indices. The “jackknife” and “response curve” outputs of MaxEnt were analyzed to rank the importance of each covariate to its model, and response curves for each taxon were reviewed in relation to published biological and ecological information to ensure they were biologically relevant (Supplementary Figure 1). This was an important consideration, as environmental covariates that can be related directly to the ecology or biology of a species have been shown to be more discriminating when modeling a predicted invasive range (Jimenez-Valverde et al. Reference Jimenez-Valverde, Peterson, Soberon, Overton, Aragon and Lobo2011; Rodder et al. Reference Rodder, Schmidtlein, Veith and Lotters2009). Correlation between covariates was handled throughout the modeling process by generating a correlation table and evaluating strong correlations (Pearson correlation coefficient |r| ≥ 0.80). After cross-correlations were assessed, one to two covariates from each set of correlated covariates were retained in the go-forward models (Lestina et al. Reference Lestina, Cook, Kumar, Morisette, Ode and Peairs2016). After identifying the covariate(s) with the most significant contribution to the model from one group, we added the next group of covariates. The determination process was repeated until the highest-contributing covariates for the current group were found, then the next group was added, and so on, until the final suites of covariates were identified (Table 1). Strongly correlated covariates were only retained in the final models when their presence or absence significantly influenced the model results: this was tested by comparing outputs from versions of the model that included one, the other, or both variables. This iterative process reduced the number of variables to eight for the L. dalmatica model, seven for the L. vulgaris model, and four for the hybrid model. Environmental covariates used as inputs for each species distribution model are listed in Table 1, and the percent contributions of the different covariates to each model are summarized in Table 2. Correlations among the final covariates are provided in Supplementary Tables 2–4.
Table 1. Final species distribution models for Linaria dalmatica (LD), Linaria vulgaris (LV), and hybrid Linaria (HL).a, b

a Abbreviations: MaxEnt (maximum entropy) settings are linear (L), quadratic (Q), product (P), threshold (T), and hinge (H) features; β is the regularization multiplier; AUC is area under the received characteristic curve; n is number of occurrence data points; NDVI is normalized difference vegetation index.
b Note that key model inputs, settings, and evaluation metrics are summarized here for each model, but should not be compared among models.
Table 2. Percent contribution of environmental covariates to each MaxEnt model.a
a Abbreviations: MaxEnt, maximum entropy; NDVI, normalized difference vegetation index.
Models were averaged across 10 replicates using the 10-fold cross-validation procedure in MaxEnt. We evaluated model performance using the area under the receiver operating characteristic curve (AUC). AUC measures the probability that a random presence point in the study area is ranked above background (or pseudo-absence) points (Phillips and Dudik Reference Phillips and Dudik2008). The value of AUC when assessing model performance has been the subject of critical debate (Lobo et al. Reference Lobo, Jimenez-Valverde and Real2008), especially when projecting invasive species distribution on spatial scales that greatly exceed the sampling regions (Mainali et al. Reference Mainali, Warren, Dhileepan, McConnachie, Strathie, Hassan, Karki, Shrestha and Parmesan2015). However, AUC remains a useful assessment option for models using presence-only data (Merow et al. Reference Merow, Smith and Silander2013) to estimate invasive species distributions across regions that reflect the scale of sampling (e.g., West et al. Reference West, Kumar, Brown, Stohlgren and Bromberg2016; York et al. Reference York, Evangelista, Kumar, Graham, Flather and Stohlgren2011). AUC values vary from 0 to 1; 0.5 shows the model performance is not better than random, values less than 0.5 are worse than random; 0.5 to 0.7 indicate poor performance; 0.7 to 0.9, reasonable/moderate performance; and 0.9, high performance (Peterson et al. Reference Peterson, Soberon, Pearson, Anderson, Martinez-Meyer, Nakamura and Araujo2011). We also assessed our models by comparing 0% and 10% training presence test omission rates. A 0% omission rate indicates that all the training presence locations were found within the predicted suitable environment, and the 10% omission rate indicates that 10% of training presence locations lie beyond the predicted taxon-specific suitable environment (Liu et al. Reference Liu, White and Newell2013). The default parameter settings in MaxEnt do not always produce the best distribution estimates (Kumar et al. Reference Kumar, Neven and Yee2014; Merow et al. Reference Merow, Smith and Silander2013); accordingly, MaxEnt was executed with varying feature types and regularization multipliers (specifically, 1, 1.5, 2, 2.5, and 3). We calculated the Akaike information criterion (corrected for small sample size: AICc) using environmental niche modeling tools or ENMTools (Warren et al. Reference Warren, Glor and Turelli2010). The AICc process was followed to determine MaxEnt settings for the optimal model considered in conjunction with biological characteristics of the taxon. The final models selected had the most biologically relevant covariates, though these were not the models with the lowest AICc scores (Supplementary Tables 5–7).
Estimating Potential Hybrid Distribution
We compared two different modeling approaches to predict hybrid environmental suitability: first, a hybrid MaxEnt model based on environmental parameters for currently known locations of hybrid Linaria populations; and second, a map overlay of estimated L. dalmatica and L. vulgaris distributions used to identify potential hybridization zones. The hybrid MaxEnt model was created with taxon occurrence data and candidate environmental covariates as inputs, using the same method employed for predicting L. dalmatica and L. vulgaris environmental suitability. A threshold was applied to the MaxEnt model output to produce a binary map showing areas where hybrid Linaria is and is not expected.
For the overlay map, the process involved the following steps, with the first two steps performed for both L. dalmatica and L. vulgaris. First, in ArcGIS, we converted the final average ASCII file created by MaxEnt into a grid raster with the ASCII to Raster tool. Second, we reclassified these grid rasters to threshold classification maps, using the “10th percentile training presence logistic threshold” from MaxEnt results (Carter and Young Reference Carter and Young2011). The values used for this threshold from MaxEnt outputs were: L. dalmatica = 0.4722 and L. vulgaris = 0.4762. This classification results in an area that covers 90% of the occurrence points in predicted environmentally suitable areas. This step reduced the environmental suitability maps for L. dalmatica and L. vulgaris to two classifications: suitable and unsuitable. Third, we added these classification maps together using the Raster Calculator tool. The resulting overlay map contained four values describing the environment as: (1) unsuitable for both taxa, (2) suitable for L. dalmatica, (3) suitable for L. vulgaris, and (4) suitable for both taxa and therefore potentially suitable for the formation of hybrid Linaria populations. It should be noted that this overlay approach assumes that co-invasion of L. dalmatica and L. vulgaris is the best predictor for hybrid occurrence. This assumption may be an oversimplification, as it excludes the possibility of propagule movement establishing hybrid populations in new areas independent of the parent species. This is discussed further under Estimated Invasive Range for Hybrid Linaria in the Results and Discussion section.
Completion of these steps made it possible to generate a hot-spots map for Linaria hybrids using classified areas with a threshold applied for (1) the MaxEnt hybrid environmental suitability map, applying the same threshold variable with a value for hybrid Linaria of 0.2771; and (2) the overlay map. The hot-spots map shows classes of suitability for these two areas as well as the combined area, that is, where both the MaxEnt model and the overlay map predicted environments suitable for Linaria hybrids.
Statistical Analysis
Following Broennimann et al. Reference Broennimann, Fitzpatrick, Pearman, Petitpierre, Pellissier, Yoccoz, Thuiller, Fortin, Randin, Zimmermann, Graham and Guisan(2012), a principal component analysis (PCA) was performed on environmental covariates to quantify the amount of environmental space shared by L. dalmatica and L. vulgaris (Austin and Smith Reference Austin and Smith1989; Green Reference Green1971). This method compares the environmental conditions available for a species within a defined study extent (background) with its observed occurrences and estimates the available environmental space defined by the first two axes from the PCA. Ten thousand random points were generated, and values were extracted from select covariate rasters at each point. An R script was used (Broennimann et al. Reference Broennimann, Fitzpatrick, Pearman, Petitpierre, Pellissier, Yoccoz, Thuiller, Fortin, Randin, Zimmermann, Graham and Guisan2012) to generate a graphical depiction of environmental-space overlap (Supplementary Figure 2). To evaluate the quantity and similarity of locations between the hybrid MaxEnt environmental suitability binary map (i.e., threshold applied to give values of 0 or 1) and the hybrid zone of the overlay map, we used the kappa statistic tool in the Map Comparison Kit (Visser and de Nijs Reference Visser and de Nijs2006; West et al. Reference West, Kumar, Brown, Stohlgren and Bromberg2016) (Supplementary Figure 3).
Results and Discussion
Model Performance and Comparison
Model assessments were based on AUC and omission rates at different thresholds. Our AUC metrics indicated acceptable model performance: L. dalmatica, 0.762; L. vulgaris, 0.810; and hybrid Linaria, 0.853 (Table 1). For the minimum percentile training presence test omission, an expected result is zero, or 100% correctly predicted presences. Our L. dalmatica and L. vulgaris results met this ideal. For hybrid Linaria, our result was 6.67%, that is, approximately 2 of 32 presences predicted incorrectly. The 10th percentile training presence test omission expected result is 10%, which it was for our hybrid Linaria model. The L. dalmatica and L. vulgaris values were 11.9% and 12.1%, respectively, indicating these models were slightly less accurate than expected. When comparing the predicted areas for hybrid occurrence between the MaxEnt hybrid environmental suitability map and the overlay map, the kappa statistic was 0.261, indicating a low degree of similarity. This may result from differences in the number of occurrence points used as model inputs: the overlay map was based on 1,024 points for L. dalmatica and 1,159 for L. vulgaris, derived from reported observations over several decades. However, the environmental suitability map for hybrid Linaria was based on only 32 occurrence points, due to the recent identification of these hybrid populations and limited recording of their presence to date. The model outputs also reflect different approaches and assumptions. The overlay map assumes that hybrid population establishment requires prior co-invasion by both parent species, and therefore only areas deemed suitable for both L. dalmatica and L. vulgaris are projected as hybrid habitat (Figures 4 and 5). In contrast, the model output based on environmental covariates associated with currently known hybrid populations estimates more extensive areas as suitable for hybrid populations (Figure 5), including several counties in north-central Montana projected as unsuitable for L. dalmatica and L. vulgaris (Figure 4) that have few or no occurrence data for these species (Figures 1 and 2). This result indicates that future Linaria hybrid invasions could be spatially or temporally disjunct with current distributions of the parents; combined with greater ecological amplitude, this may enable the hybrids to occupy a more extensive and diverse range of habitats.

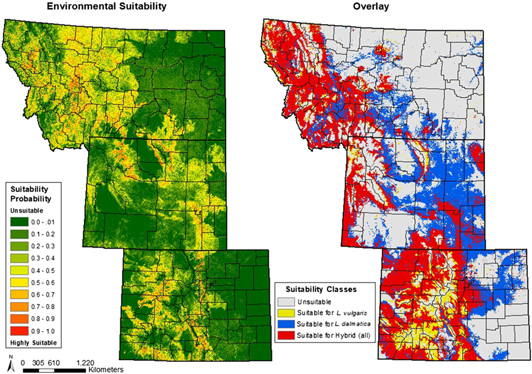
Figure 4. Estimated habitat suitability for Linaria dalmatica and Linaria vulgaris.

Figure 5. Estimated habitat suitability for Linaria hybrids based on environmental covariates of known hybrid populations (left) and on the overlay of habitat suitability maps for the parent species (right).
Numerous hybrid hot spots were common to both maps even if they were not classified with the same degree of risk by both modeling approaches (Figure 5), and mapped model outputs were generally consistent with known biological and ecological characteristics of the three Linaria taxa. Such differences emphasize the value of using more than one modeling method for an emerging taxon such as hybrid Linaria, for which few occurrence points are known. Areas identified by both models as suitable hybrid habitat are of particular concern and should be priorities for proactive scouting and management.
Predicted Invasive Ranges for Linaria dalmatica and Linaria vulgaris
The model-generated map for L. dalmatica identifies as suitable environment large areas of western Montana, northwestern and eastern Wyoming, and northeastern Colorado plus parts of the Western Slope and Front Range (Figure 4). These are mostly areas with higher temperatures compared with other parts of the region, as would be expected for a species originating from the dry climate of the Mediterranean. The model also showed that L. dalmatica establishment is more likely at elevations below 2,800 m, but this reflects a more complex interplay of environmental covariates than simple association of warmer summer temperatures with lower elevation. Linaria dalmatica overwinters aboveground as a vegetative rosette, limiting its ability to invade at higher elevations, where it would be exposed to extreme winter cold and extended periods of snow cover that could damage the overwintering rosette and inhibit spring shoot growth. Linaria dalmatica was also modeled as most likely to occur in open areas dominated by grasses and in areas with reduced vegetative cover but more roads or other human-created disturbances. This agrees with published studies describing L. dalmatica invasion (e.g., Blumenthal et al. Reference Blumenthal, Norton, Cox, Hardy, Liston, Kennaway, Booth and Derner2012; Vujnovic and Wein Reference Vujnovic and Wein1997).
For L. vulgaris, potential habitat was identified in western Montana, northwestern and southeastern Wyoming, and west of the Front Range in Colorado, reflecting this species’ tolerance of higher elevations with cooler temperatures and its preference for higher moisture (Figure 4). In contrast to L. dalmatica, elevation was not identified in our model as a significant environmental covariate for L. vulgaris. This reflects the fact that L. vulgaris overwinters entirely belowground and emerges from dormancy later in the spring than L. dalmatica, allowing it to survive colder winter temperatures and seasonally extended snow cover at higher elevations. Consequently, L. vulgaris has invaded a more diverse range of habitats across a wider range of elevations than L. dalmatica, from undisturbed subalpine meadows to lower-elevation areas with roads or other human-created disturbances (Sing et al. Reference Sing, De Clerck-Floate, Hansen, Pearce, Randall, Toševski and Ward2016). Higher mean NDVI is associated with L. vulgaris occurrence, reflecting the preference of this species for higher moisture conditions that maintain greener vegetation throughout the growing season. For both L. dalmatica and L. vulgaris, the emergence of land use/cover as a significant contributing covariate is largely driven by the limited potential of these species to establish in low-light habitat such as forest understory (Blumenthal et al. Reference Blumenthal, Norton, Cox, Hardy, Liston, Kennaway, Booth and Derner2012; Sutton et al. Reference Sutton, Stohlgren and Beck2007), restricting their predicted invaded ranges to nonforested areas.
Our models identified several areas where occurrence data were sparse or lacking (see Figures 1 and 2 for mapped occurrence points) as suitable habitat for both L. dalmatica and L. vulgaris (Figure 4). These areas included the Black Hills region in northeastern Wyoming, the southwestern corner of Wyoming west of the Red Desert, and large parts of northwestern Colorado. It is possible that L. dalmatica and/or L. vulgaris have invaded in these areas but their presence has been underreported, or populations have yet to spread extensively. The possibility that unrecognized or unreported populations may already be present should be considered by managers when using model output to identify areas at risk for Linaria invasion.
Estimated Invasive Range for Hybrid Linaria
As described earlier, we used two different modeling approaches to estimate the invasive range for hybrid Linaria within our study area. The overlay map (Figure 5) combines the L. dalmatica and L. vulgaris environmental suitability maps to identify areas at risk for hybrid populations. The model found 72.2% of L. dalmatica and 78.9% of L. vulgaris occurrence points within overlapping areas of habitat suitability that would also be suitable for hybrid Linaria. This approach assumes that hybrid Linaria invasion requires co-occurrence of L. dalmatica and L. vulgaris, with subsequent gene flow between them and formation of a hybrid zone. Invasion predictions based on the overlay map therefore exclude the possibility of hybrid introduction via seed movement from an established hybrid population elsewhere. A further limitation of the overlay map is that it is based on threshold values to produce binary suitability throughout the study area; in fact, habitat suitability is more accurately considered as a continuum; therefore, the overlay rendering represents a generalization. However, for the purposes of our modeling, constructing the overlay is informative despite these limitations, as it identifies areas where co-occurrence of the parent taxa and generation of novel hybrid populations is likely. The overlay map in Figure 5 highlights these at-risk areas. They include large parts of western Montana; the Black Hills region, the Laramie and Medicine Bow mountain ranges, and the foothills of the Big Horn and Wind River mountain ranges in Wyoming; and the Front Range and much of the Western Slope in Colorado.
As an alternative modeling approach, we used MaxEnt to generate an environmental suitability map for Linaria hybrids based on locations of known hybrid populations and associated environmental covariates. Many of these hybrids combine ecophysiological and phenological traits from both parents: Linaria hybrids emerge from dormancy earlier than the parent species, flower sooner and for longer, and often resemble the L. vulgaris parent in growth form, overwintering belowground, which enables them to survive at higher and colder elevations (Turner MFS 2012; Ward et al. Reference Ward, Fleischmann, Turner and Sing2009). The most significant contributing environmental covariates in our model suggest that hybrids tolerate warmer summer temperatures similar to the L. dalmatica parent, and will competitively exploit higher summer precipitation and a longer growing season in habitats similar to those preferred by the L. vulgaris parent.
The environmental suitability map (Figure 5) estimates a more limited potential hybrid distribution than the overlay map, with approximately half the study area identified as being of low environmental suitability. This reflects the low number of occurrence points (n = 32) used to generate the environmental suitability map. With fewer occurrence points, a smaller climatic and environmental range is deemed hospitable, and the hybrid environmental suitability map should therefore be considered a conservative prediction. This is reflected in the hybrid Linaria uncertainty map, which shows larger areas where the coefficient of variation from repeated model runs exceeded 0.05 than were obtained for the parent taxa (Supplementary Figures 4–6). Despite greater predictive uncertainty and the risk of underestimating suitable habitat, especially for species with broad ecological tolerance (Hernandez et al. Reference Hernandez, Graham, Master and Albert2006), MaxEnt models based on limited presence-only data have been shown to provide useful estimates of potential range for nonnative species at early stages of invasion (West et al. Reference West, Kumar, Brown, Stohlgren and Bromberg2016), including novel populations resulting from hybridization between an introduced plant species and a native congener (Jazwa et al. Reference Jazwa, Jedrzejczak, Klichowska and Pliszko2018). The areas modeled as suitable environments for hybrid Linaria in our study should not be considered as locations where invasion is inevitable, but as areas at greater risk of hybrid population establishment. These areas include several national parks, wilderness areas, and Native American reservations (shown in Supplementary Figure 7) that present additional management challenges, as described below under Applications and Implications of Model Outputs.
Part of north-central Montana was identified by the environmental suitability model as potential habitat for hybrid populations (Figure 5), even though neither parent has been reported there. This potential habitat is also mapped in yellow in Figure 6. This was surprising, as model projections show this area to be highly unsuitable for L. vulgaris and only marginally suitable for L. dalmatica (Figure 4). However, genetic recombination can expand the ecological amplitude of novel hybrids beyond that of either parent (Milne and Abbott Reference Milne and Abbott2000; Rieseberg et al. Reference Rieseberg, Kim, Randell, Whitney, Gross, Lexer and Clay2007; Turner MFS 2012), potentially allowing hybrid Linaria populations to invade a wider range of environments than either parent species. Our model output indicates this area should be monitored for new hybrids. Establishment of hybrid Linaria populations without prior co-invasion by the parent species could result from hybrid seed transported from elsewhere by wildlife or livestock or by human activity. Elimination of the parent populations by a biocontrol or herbicide that is ineffective on the hybrid could also allow hybrid populations to persist alone, as could displacement of the original co-invading parent species by more competitive hybrid phenotypes.
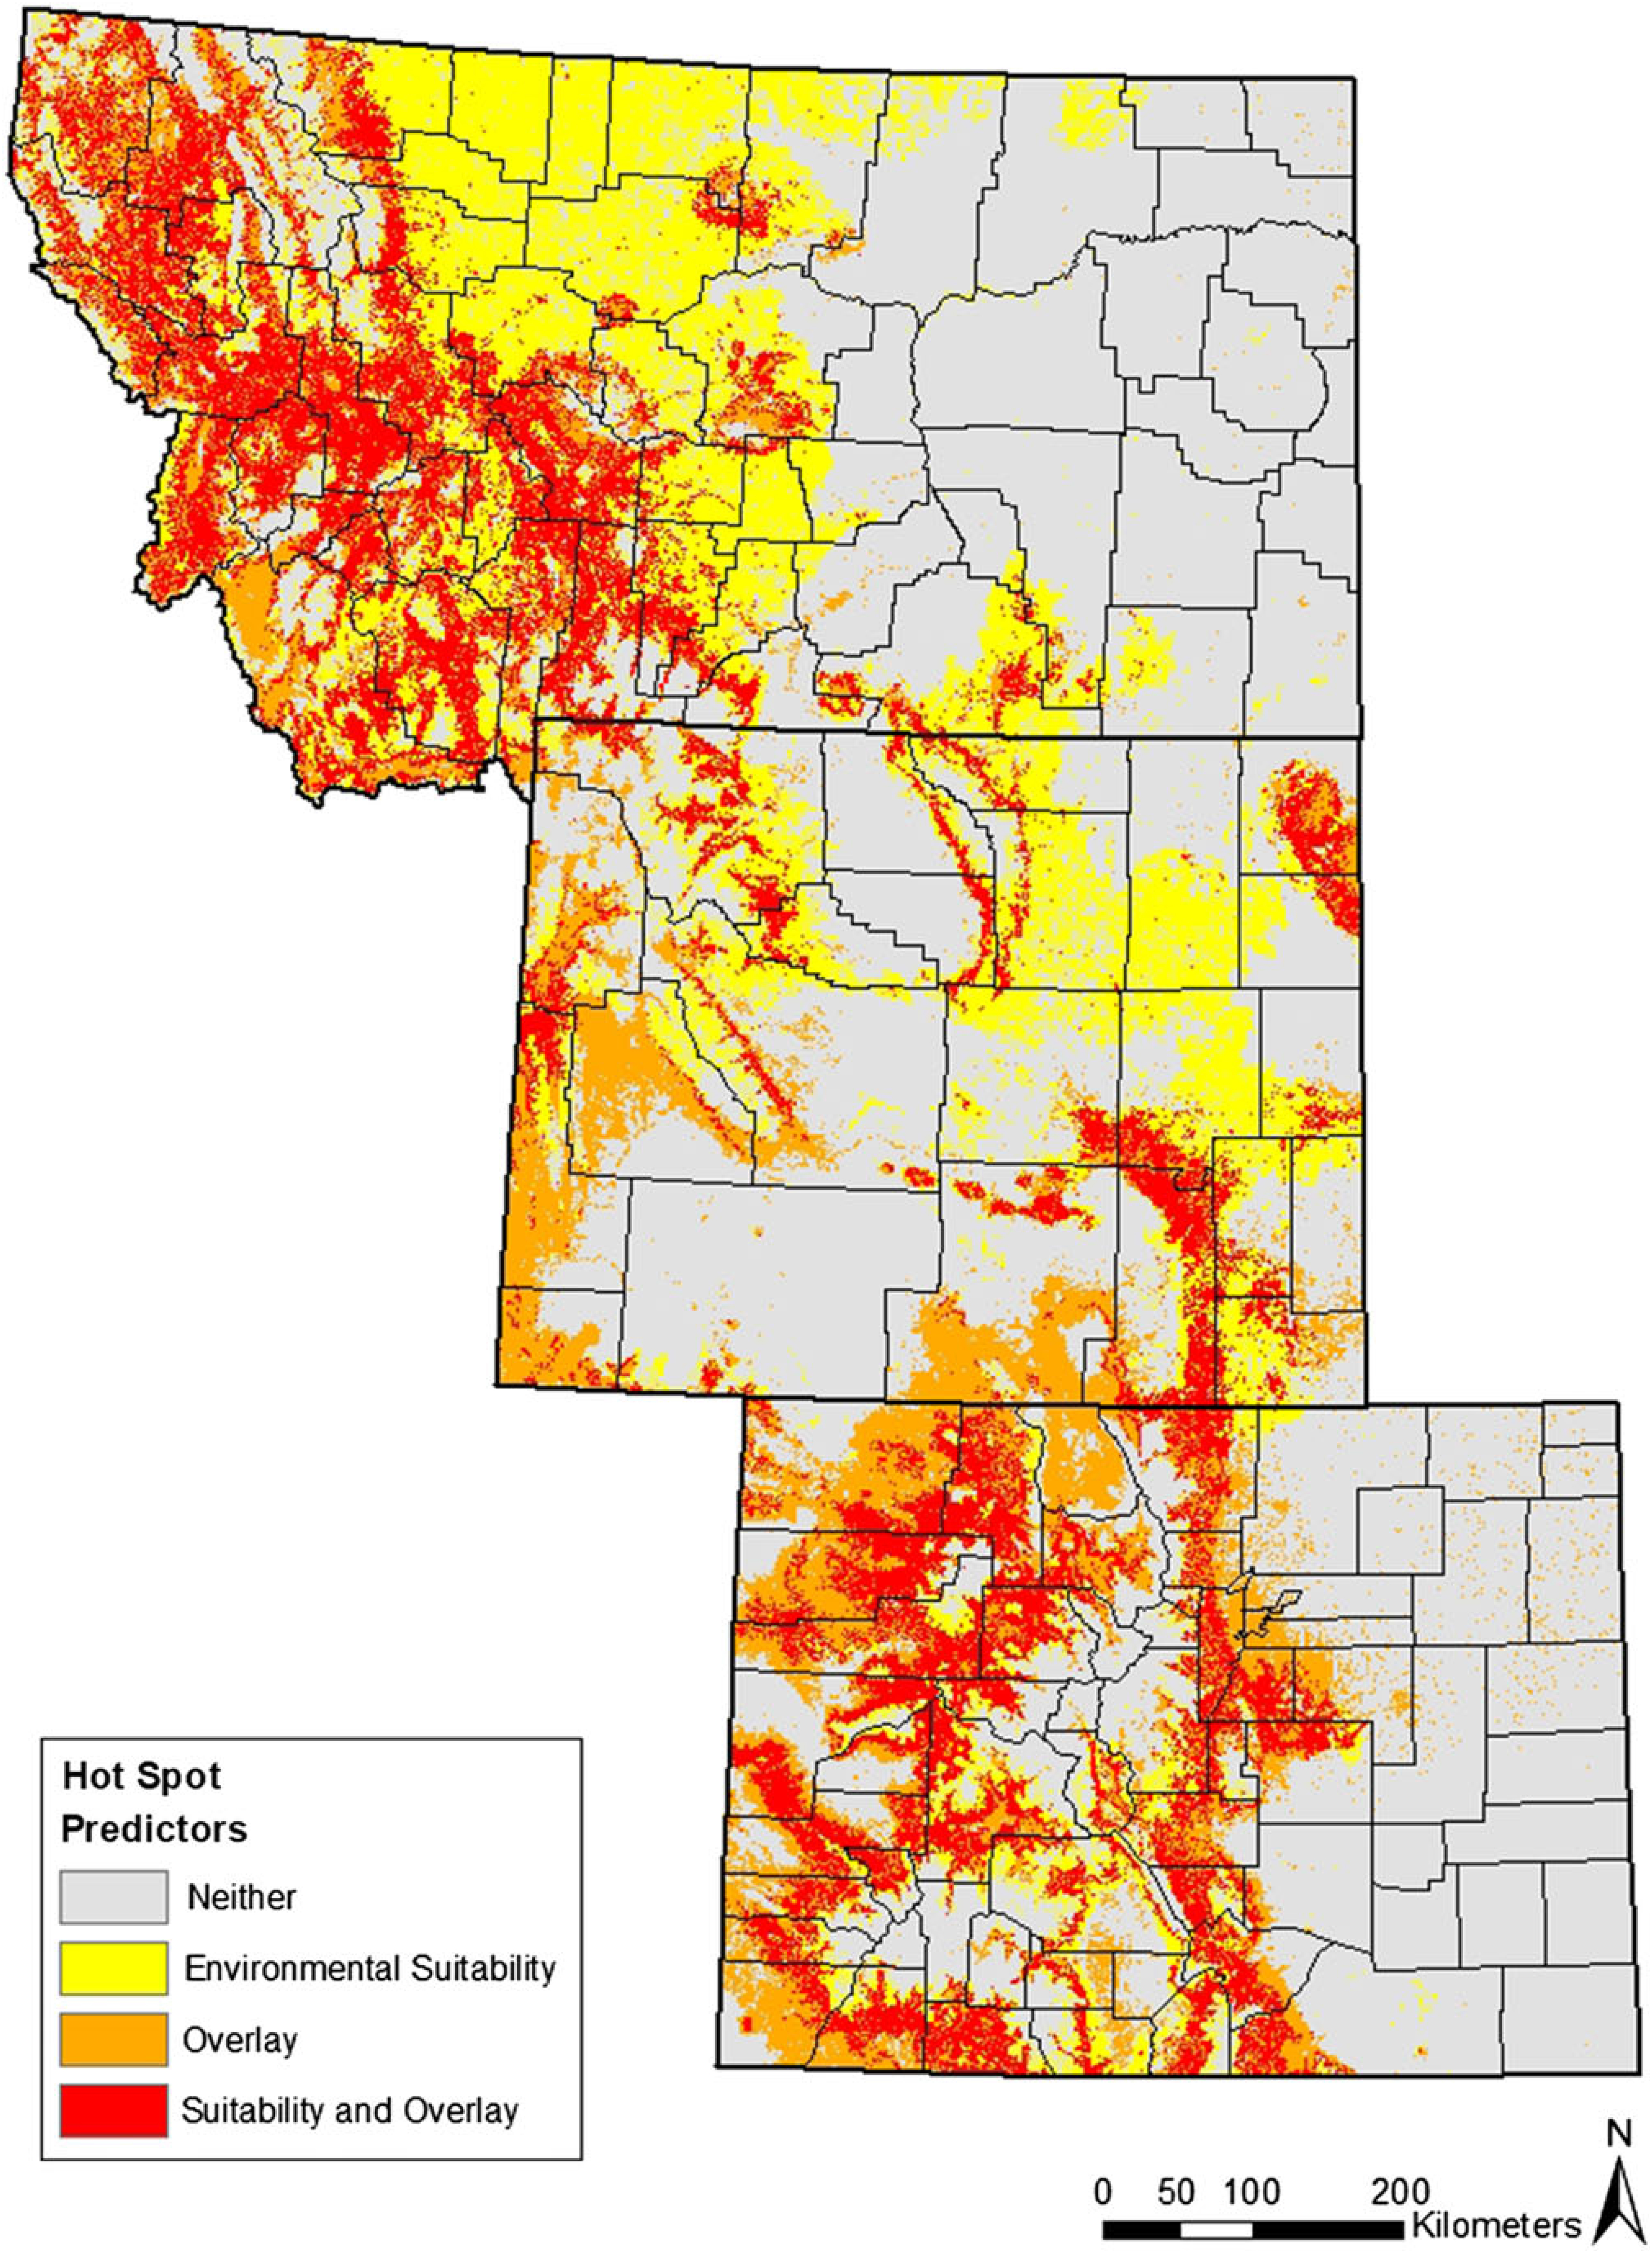
Figure 6. Predicted hot spots for hybrid Linaria invasion. High-risk areas (red) were identified as suitable habitat in both model outputs.
The overlay map and the environmental suitability map share areas of estimated hybrid distribution (Figure 5); by combining the two maps we can most accurately visualize the predicted distributions common to both models. Figure 6 shows these areas in red: these represent hot spots at highest risk of hybrid invasion. For L. dalmatica, L. vulgaris, and hybrid Linaria, 43%, 42%, and 81% of occurrence points are found in the hot-spot areas, respectively. This substantiates the strength of the model in predicting likelihood of environmental suitability for hybrid Linaria and shows that suitability exists in areas not fully inhabited by both parent species. These at-risk areas are western Montana, the Black Hills region, the Laramie Range in southeastern Wyoming, plus the Front Range and parts of the Western Slope of Colorado.
Caveats and Uncertainty in Modeling
Our models were calibrated using occurrence data and environmental covariates from only the region of interest, not the entire invaded ranges of L. dalmatica and L. vulgaris; they are therefore more correctly considered partial invasive species distribution models, or iSDM (Vaclavik and Meentemeyer Reference Vaclavik and Meentemeyer2009). All species distribution models are affected by decisions made during model calibration that may result in uncertainties in potential distribution estimates (Jarnevich et al. Reference Jarnevich, Stohlgren, Kumar, Morisette and Holcombe2015). These uncertainties arise from various sources when using presence-only or presence-background modeling techniques to predict environmental suitability for a species, including sampling bias, spatial autocorrelation, multicollinearity between environmental covariates, temporal resolution of data, and modeling techniques (Guisan et al. Reference Guisan, Graham, Elith, Huettmann and Distri2007a, Reference Guisan, Zimmermann, Elith, Graham, Phillips and Peterson2007b; Jarnevich et al. Reference Jarnevich, Stohlgren, Kumar, Morisette and Holcombe2015; Syfert et al. Reference Syfert, Smith and Coomes2013; Veloz Reference Veloz2009).
We addressed spatial autocorrelations by rarefying presence points and sampling bias before modeling by using the Gaussian Kernel Density of Sampling Locations tool in SDMtoolbox to create a bias file that facilitates control of background point selection. Spatially clustered occurrence points may indicate suitable habitat; however, such clustering can also result from increased human activity leading to more recorded observations within areas of special interest. Although we rarefied presence points, final occurrence maps for all three Linaria taxa show that more numerous observations sometimes overlapped with higher human population densities (e.g., the Colorado Front Range) or with more intensively studied areas of special interest, such as Yellowstone and the Grand Tetons (Figures 1–3). These areas may have been statistically overweighted in our models if these occurrence data did in fact reflect increased human observation rather than habitat suitability.
Hybrid Linaria populations incorrectly reported as L. dalmatica represent another potential source of field-sampling bias (SES, personal observation). Some L. dalmatica populations that appear to be taxonomically unambiguous based on plant morphology have been found to contain L. vulgaris DNA, introduced by an earlier hybridization event followed by repeated backcrossing (Boswell et al. Reference Boswell, Sing and Ward2016). The frequency of L. dalmatica and L. vulgaris populations that contain introgressed DNA from the other species is unknown. The 32 confirmed hybrid Linaria populations used as occurrence points in our model were early-generation hybrids with intermediate morphology. Later-generation and backcrossed hybrid populations were not included in this data set: their identification requires DNA marker analysis, because morphological traits are insufficient for reliable taxonomic assignment. Our model inputs may therefore have underestimated the current occurrence of hybrid Linaria populations in our study region, resulting in overly conservative mapping of potential habitat for these novel genotypes.
Multicollinearity between environmental covariates was handled throughout the modeling process by generating a correlation table and evaluating strong correlations during covariate selection. Some degree of correlation between environmental covariates is unavoidable, and acceptable thresholds for correlation coefficients vary among published modeling studies (Dormann et al. Reference Dormann, Elith, Bacher, Buchmann, Carl, Carré, García Marquéz, Gruber, Lafourcade, Leitão, Münkemüller, McClean, Osborne, Reineking, Schróder, Skidmore, Zurell and Lautenbach2013). To minimize overfitting and improve model estimates of at-risk areas where Linaria invasion has not yet been reported, we retained strongly correlated variables only when removal of one or the other significantly altered model output and the correlated variables had identifiably different biological or ecological effects. For example, number of summer degree days above 18 C was correlated with maximum autumn temperature in our data (Pearson’s coefficient |r| = 0.882), but we retained both variables in our L. vulgaris model, because number of summer degree days predominantly affects vegetative growth and onset of flowering in this species, while autumn temperature influences seedpod development and seed maturation. We note that the climatic covariates used may represent a source of uncertainty, as they were derived from decadal averages from the ClimateWNA application for 1991 to 2010, while the Linaria occurrence data were collected over time periods ranging from 1913 to 2016. The temporal differences between these data sets means the climatic covariates may not accurately represent the conditions that Linaria populations experienced when they were surveyed (Lestina et al. Reference Lestina, Cook, Kumar, Morisette, Ode and Peairs2016).
The fine-scale accuracy of any SDM-based occurrence maps will be constrained by the spatial resolution of data used as model inputs. The spatial resolution of GIS layers used in our models was 1 km2. This is sufficient to identify within-state zones at risk of Linaria invasion, but not to pinpoint individual management units. It would be possible, and potentially useful, to generate a finer-scale hot-spots map for a smaller area, such as a county, within the three states; however, doing so requires rerunning the modeling step using test data and environmental covariates from only that area to prevent loss of reliability and prediction accuracy (Kumar et al. Reference Kumar, Neven and Yee2014). A further trade-off is that at smaller spatial scales for environmental data, fewer occurrence points are usually available for modeling, reducing the accuracy of fine-scale model predictions (Guisan et al. Reference Guisan, Graham, Elith, Huettmann and Distri2007a; Hernandez et al. Reference Hernandez, Graham, Master and Albert2006).
Applications and Implications of Model Outputs
Despite these limitations, maps based on our modeling provide insights into current and potential future Linaria invasion in the U.S. northern Rockies. This is the first study to estimate potential geographic distribution of novel hybrid Linaria genotypes, which appear to be the most invasive of these weedy taxa (Turner MFS 2012). Management options for hybrid Linaria are limited: as previously noted, chemical and biocontrol methods used on L. dalmatica and L. vulgaris are often less effective on hybrids (Sing et al. Reference Sing, De Clerck-Floate, Hansen, Pearce, Randall, Toševski and Ward2016). Three species of stem-boring weevils, Mecinus janthinus Germar, Mecinus janthiniformis Tosevski & Caldara, and Mecinus heydenii Wencker, attack hybrid Linaria under greenhouse conditions (SES, personal observation), but the ability of these biocontrol agents to reduce hybrid populations in the field is so far untested. An additional complication is that public relations or regulatory issues may reduce herbicide application to an option of last resort in highly visible and environmentally sensitive locations, such as national parks and wilderness areas, several of which—as previously noted—are within areas predicted by our models to be at high risk of hybrid Linaria invasion. Early detection could allow elimination of hybrid Linaria populations by carefully targeted repeated herbicide application or by hand pulling when they are still small enough for such methods to be feasible.
Using our model-based maps to alert weed managers in areas at high risk of hybrid Linaria occurrence could allow more effective use of limited resources for scouting and early identification of hybrid populations. As already noted, the spatial resolution of our three-state model output is insufficient to pinpoint individual management units such as counties. However, our maps can identify at-risk areas where additional predictive distribution modeling on a finer spatial scale might be useful, in addition to targeted informational outreach to resource managers. Our maps also identify large areas where risk of Linaria invasion is relatively low, potentially allowing redirection of weed management resources to more urgent problems. There can be substantial benefits to this use of species distribution modeling: for example, Kaplan et al. Reference Kaplan, van Niekerk, Le Roux, Richardson and Wilson(2014) estimated that model-based targeting of areas at high risk of nonnative tree invasion in South Africa reduced search effort by 83%.
Previously published studies using MaxEnt modeling to estimate the potential distribution of invasive plants in a novel range have focused on individual species (e.g., Bromberg et al. Reference Bromberg, Kumar, Brown and Stohlgren2011; Choudhury et al. Reference Choudhury, Deb, Singha, Chakdar and Medhi2016; Koncki and Aronson Reference Koncki and Aronson2015; Ndlovu et al. Reference Ndlovu, Mutanga, Sibanda, Odidndi and Rushwort2018; West et al. Reference West, Kumar, Brown, Stohlgren and Bromberg2016). We could find only one previously published study in which species distribution modeling has been used to estimate the potential invasive range of hybrid populations resulting from gene flow between invasive parent species: Jovanovic et al. Reference Jovanovic, Hlavati-Sirka, Lakusic, Jogan, Nikolic, Anastasiu, Vladimirov and Sinzar-Sekulic(2018) reported, based on MaxEnt modeling, that suitable habitat in southeastern Europe for Bohemian knotweed (Reynoutria × bohemica Chrtek & Chrtková), a hybrid between Japanese knotweed (Reynoutria japonica Houtt) and giant knotweed [Reynoutria sachalinensis (F. Schmidt) Nakai], differs from that of the parent species. This appears to reflect the capacity of R. × bohemica to tolerate higher seasonal temperatures and drought. Our model-based maps suggest Linaria hybrids could resemble Reynoutria hybrids in their ability to invade areas beyond the ranges of the parent species (Figures 5 and 6). Gene flow between L. vulgaris and L. dalmatica is producing hybrid populations that challenge current management methods, especially those using biocontrol; these novel recombinant Linaria genotypes may also have the adaptive potential to colonize a wider range of habitats than the parent taxa (Sing et al. Reference Sing, De Clerck-Floate, Hansen, Pearce, Randall, Toševski and Ward2016; Turner MFS 2012). Further investigation of physiological and phenological differences between Linaria hybrids and the parent species is needed. As already noted, repeated backcrossing between early-generation hybrids and either L. vulgaris or L. dalmatica results in populations that resemble the recurrent parent but contain genetic material from its co-invading congener; whether this introgression increases the ecological amplitude and invasive capacity of the recurrent parent populations has yet to be investigated (Boswell et al. Reference Boswell, Sing and Ward2016).
The model projections presented here represent a single point in time, but future changes in climate and land use may modify the potential habitat and distribution of invasive Linaria taxa. Climatic factors were the most significant environmental variable identified in each of our models (mean maximum summer temperature for L. dalmatica, late-season mean maximum temperature for L. vulgaris, and number of frost-free days in the growing season for hybrid Linaria). This suggests that a warming climate in our study area could have significant impacts on future distribution of Linaria taxa in the U.S. Rocky Mountain region, including invasion of habitats not currently considered vulnerable. Updated distribution estimates will require further modeling with new occurrence and environmental data.
Author ORCID
Sharlene E. Sing, 0000-0001-5290-291X; Sarah M. Ward, 0000-0002-9288-1110.
Supplementary material
To view supplementary material for this article, please visit https://doi.org/10.1017/inp.2019.15
Acknowledgments
KRM received fellowship funding from the Colorado Mountain Club Foundation (http://www.cmc.org/About/CMCFoundation.aspx) and scholarship funding from GIS Colorado (http://giscolorado.org/scholarships). The funders had no role in study design, data collection and analysis, decision to publish, or preparation of the article, and no conflicts of interest have been declared. We thank different organizations that asked individuals to share Linaria occurrence data with us and the 20 contributors who did; these data greatly improved the quality of the models. We also thank Randall Boone for reviewing the map products and Jordan Lestina for contributing to the modeling.


