


Health technology assessments (HTAs) carried out to inform guidance made by the National Institute for Health and Clinical Excellence (NICE) in England are time-constrained (as in many countries) and rarely permit dedicated exploration of uncertainty beyond scenario analyses and probabilistic analysis. Increasingly, as many of the previous recommendations from NICE come up for review, technology appraisal groups are carrying out up-dates of previous systematic reviews and economic evaluations. This can often provide an opportunity to explore sources of structural uncertainty in decision models where the development of the new model is based upon the previous model.
In 2010, we undertook an update of the evidence for the effectiveness and cost-effectiveness of four treatments for Alzheimer's disease (AD). The final guidance was published in 2011 and can found here: http://publications.nice.org.uk/donepezil-galantamine-rivastigmine-and-memantine-for-the-treatment-of-alzheimers-disease-ta217. AD is a chronic condition and progression can be modeled on various domains (e.g., cognition, functional status, behavior), each of which can be measured on several different scales (Reference Wolfson, Moride and Perrault1). Defining disease progression and incorporating a treatment effect can therefore be difficult, requiring many assumptions often based on little or inconsistent evidence. Clearly this leads to a great deal of uncertainty associated with the development of a decision model for AD and several decision models have been published in this area (see Bond et al.) (Reference Bond, Rogers and Peters2).
Here, we detail the development of the decision model in the updated technology assessment which evolved through a series of stepped changes from the decision model developed by Loveman et al. (Reference Loveman, Green and Kirby3) for NICE's previous assessment of drug treatments for AD in 2006. The stepped changes made to the original model included those reflecting (i) changes in the NICE methods guide (4) between 2004 and 2010 (e.g., discount rates) and (ii) changes in the available evidence base. The development of the up-dated decision model was also informed by a prioritized list of the key limitations of the original model (that developed by Loveman et al.). This approach provides an opportunity to explore which changes have the greatest impact on the findings of the decision model, and the uncertainty associated with such changes in model structure.
Although the review and economic evaluation for NICE assessed four drug treatments for AD (donepezil, galantamine, rivastigmine, and memantine), for the purposes of illustrating our approach we focus on the cost-effectiveness of donepezil for people with mild to moderate AD. Donepezil was chosen as it was associated with the largest clinical evidence base as reviewed in Bond et al (Reference Bond, Rogers and Peters2). Results of the original and new decision models for galantamine, rivastigmine, and memantine can be found elsewhere (Reference Bond, Rogers and Peters2).
In the next section, a brief description of the original decision model is given. This is followed by a description of the seven cumulative changes made to the structure of the original model which led to the development of the new decision model. The results of deterministic and probabilistic analyses of the eight cumulative models are presented, followed by discussion of the findings and their limitations.
ORIGINAL DECISION MODEL
Description
A detailed description of the original decision model can be found elsewhere (Reference Loveman, Green and Kirby3;Reference Green, Picot and Loveman5). Briefly, this was a cohort-based model, developed in Excel, based on the AHEAD decision model (Reference Caro, Getsios and Migliaccio-Walle6), with three health states: pre-full time care, full-time care (FTC) and death (see Figure 1). FTC was defined as “equivalent institutional care” (Reference Stern, Tang and Albert7), including day and night “supervision of personal care, safety or medical care” (Reference Stern, Albert and Sano8). Occupancy within the pre-FTC and FTC states was predicted from risk equations incorporating five patient characteristics: modified Mini-Mental State Examination (MMSE) score, presence of psychotic symptoms, presence of extrapyramidal (movement disorder) symptoms, age at onset, and duration of illness. The risk equations were derived from an analysis of a U.S. population of 236 people with AD (Reference Caro, Getsios and Migliaccio-Walle6).
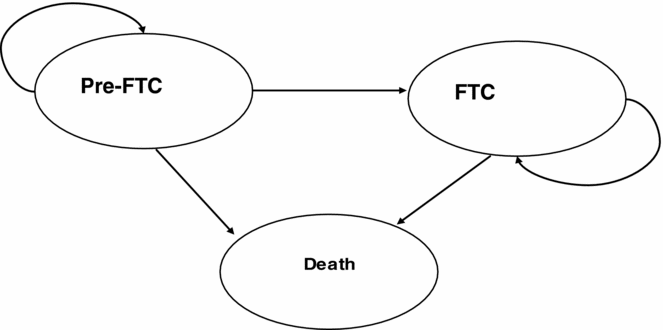
Figure 1. Original decision model structure. FTC, full-time care.
To allow incorporation of trial-based effectiveness estimates in the decision model, an initial treatment period of 6 months was assumed during which treatment and monitoring costs for the donepezil arm were accounted for but quality-adjusted life-year (QALYs) were not. After this initial 6-month treatment period, a treatment effect on ADAS-cog (Alzheimer's Disease Assessment Scale – cognitive subscale), translated onto the modified MMSE scale, was incorporated in the model. Drug treatment was assumed to continue for all treated individuals until they entered the FTC health state, where it was assumed that patients had severe AD (for which donepezil is not licensed). The decision model had monthly cycles and a time horizon of 5 years. Drug, monitoring and care costs falling on the National Health Service (NHS) and the Personal and Social Services (PSS) budget were accounted for, initially with an annual discount rate of 6 percent for costs and 1.5 percent for benefits (as per the guidance at the time [Reference Loveman, Green and Kirby3] p. 123). We take as our starting point the model and results as reported in Loveman et al. (Reference Loveman, Green and Kirby3), and not the “augmented model” as referred to elsewhere (Reference Getsios, Migliaccio-Walle and Caro9).
Identified Limitations of Original Model
Limitations of the original model were documented, with many of the structural changes leading to the new model based upon these (see references Reference Getsios, Migliaccio-Walle and Caro9–Reference Bosanquet and Yeates11) plus documentation related to (12) [http://guidance.nice.org.uk/TA111]). To identify and collate these limitations, all documents relating to the decision model used in the previous NICE appraisal were reviewed. This included (i) searching documentation on the NICE Web site [http://guidance.nice.org.uk/TA111], (ii) searching related articles subsequently published in the literature referencing either the HTA monograph (Reference Loveman, Green and Kirby3) or the study by Green et al. (Reference Green, Picot and Loveman5) and (iii) discussion with Colin Green (the health economist who developed the original model). The noted limitations were then categorized by those relating to structural uncertainty (i.e., uncertainty in developing and defining the model structure) and those relating to parameter estimation uncertainty. Most of the limitations related to structural uncertainty (see Table 1).
Table 1. Main Criticisms of the Original Model

FTC, full-time care; AD, Alzheimer's disease; MMSE, Mini-Mental State Examination; ADL, activities of daily living; RCT, randomised controlled trial; QALY, quality-adjusted life-year.
Changes to the original model were prioritized according to (i) the perceived importance of the stated limitation in the context of producing a cost–utility analysis according to current NICE methods guidance, and (ii) the expected feasibility of addressing the limitation. We also consulted NICE about prioritizing the potential improvements to the model. Changes to the original model were therefore prioritized as in Table 1. Further changes to the original model were necessary to update the model, that is, updated discount rates and parameter estimates and associated uncertainty.
METHODS
Evolution of the New Model
From the list of limitations, the following changes to the original model were identified: (a) update discount rates, (b) extend the model time horizon, (c) allow for treatment discontinuations, (d) update effectiveness parameter estimates, (e) use UK data to inform disease progression, (f) incorporate heterogeneity in patient baseline characteristics, (g) stratify the pre-FTC state by disease severity.
Changes (a) to (d) were considered to be the simplest in terms of the time and effort required to implement, and the fact that these changes had very little impact on other parts of the model. Changes (e), (f), and (g) were deemed to be more complex and time-consuming to implement because they relied on acquiring and analyzing individual participant data (IPD) and impacted upon structural and parameter changes to other parts of the model. Changes (a) to (g) are described below.
(a) Update Discount Rates
Recommendations of the UK Treasury have changed since the previous review and so discount rates were updated from 6 percent for costs and 1.5 percent for effects to 3.5 percent for both costs and effects (4).
(b) Extend Time Horizon
Extending the time horizon from 5 years to 20 years simply required extending the rows in the Excel spreadsheet.
(c) Treatment Discontinuations
The original model did not account for the impact of treatment discontinuations on costs or effects, in other words it was assumed that all patients continued taking treatment until they entered the health state “FTC.” For the new model, data on the proportions of individuals discontinuing treatment were available from the RCTs included in the systematic review of clinical effectiveness conducted by Bond et al. (Reference Bond, Rogers and Peters2). Although there was information across different dose levels and follow-up times in these RCTs, discontinuations were reported only at the final follow-up time (often only 6 months), and it was assumed that the corresponding effectiveness evidence was from an intention to treat (ITT) analysis. Based on the limited data points available and clinical opinion, a constant rate of discontinuation of donepezil of 4 percent per month was assumed in the new model. This impacted upon the costs in the decision model, but not on effectiveness.
(d) Updated Parameter Estimates
Updated parameter estimates were available from the systematic review of effectiveness studies reported in Bond et al. (Reference Bond, Rogers and Peters2).
(e) UK Patient Data
We used IPD on people with AD from the Oxfordshire area of the UK to inform disease progression (Reference Wolstenholme, Fenn and Gray13). This data set consist of 92 people with AD, collected from 1988/9 and followed for up to 11 years (mean, 3.5 years). At study entry, participants had had a diagnosis of AD for a median of 4 years (mean, 4.9 years). Use of this data set enabled us to overcome the limitations of the original model that disease progression, based on U.S. data, may not be generalizable to the population of England and Wales. However, because of different characteristics between the UK study (Reference Wolstenholme, Fenn and Gray13) and the U.S. study (Reference Stern, Tang and Albert7), use of the UK data had additional impacts on the structure and parameterization of the decision model as now described.
First, using the UK patient data led to a change in the definition of the health states in the cohort-based model. Data from Wolstenholme et al. (Reference Wolstenholme, Fenn and Gray13) allowed direct calculation of institutionalization as the event of interest. Thus, the new model was as in Figure 1 but with the two alive states defined as pre-institutionalized (people still living in their homes) and institutionalized.
Second, use of the UK patient data resulted in changes to the parameters used to predict movement between health states. In the original model, modified MMSE, presence of psychosis, age at onset, presence of extrapyramidal symptoms and duration of illness were all used to predict time to FTC. However, MMSE, Barthel Activities of Daily Living (ADL), and age were measured and collected by Wolstenholme et al. (Reference Wolstenholme, Fenn and Gray13) and used to predict time to institutionalization. Effectiveness data on these outcome measures would therefore also be needed, and so effectiveness was measured on MMSE and ADL (specifically the Barthel Index) in the new model rather than on ADAS-cog as in the original model. The new model therefore allowed for treatment effects on two important aspects of AD, cognition (MMSE), and functional status (ADL), and this was seen as an improvement on the original model, which only considered treatment effects on cognition (ADAS-cog).
Cost and mortality data were available from the UK data set, and so was used in the new model. Thus, mortality was not assumed to be constant as in the original model, but as a function of baseline age, MMSE, and ADL score (see Bond et al.) (Reference Bond, Rogers and Peters2), addressing a limitation of the original model in that un-stratified mortality rates were used.
(f) Incorporating Patient Heterogeneity
The patient cohort was split into three age groups in the new model to capture heterogeneity in patient age, and subsequently the risk of entering the institutionalization state.
(g) Stratifying Pre-institution State by Disease Severity
In the new model, disease severity was allowed to increase as patients approached the time when they became institutionalized. This (a) addressed the limitation that the pre-FTC state is too heterogeneous to be assigned a single cost and a single utility, and (b) allowed patients receiving an effective treatment to accumulate benefits before institutionalization, compared with patients not on treatment. To model decreasing utility as individuals approach institutionalization, data sources reporting utility by AD severity were identified. Many of these used MMSE to reflect severity, and because MMSE was available in the Wolstenholme et al. data set, it was chosen to map utility on to time to institutionalization (Reference Bosanquet and Yeates11). Analysis of the IPD from Wolstenholme et al. identified a relationship between MMSE and time to institutionalization (see Bond et al.) (Reference Bond, Rogers and Peters2). Thus, utility could be defined by time to institutionalization. The Wolstenholme et al. IPD also allowed direct modeling of a relationship between time to institutionalization and costs of care (Reference Bond, Rogers and Peters2).
Therefore, patients receiving an effective treatment would have higher average utilities and lower average costs in the pre-institutional state because an effective treatment is modeled as delaying time to institutionalization (see Bond et al.) (Reference Bond, Rogers and Peters2). Description of the utility weights by MMSE score has been reported elsewhere, but for example MMSE < 10 was assigned a utility of 0.33 and MMSE > 25 a utility of 0.69 (Reference Bond, Rogers and Peters2).
Each change (a) to (g) was made to the original model cumulatively in that order of priority. Thus, in the results section, Model (a) refers to the original model plus change (a), Model (b) refers to the original model plus change (a) and change (b), and so on.
Probabilistic Analyses
To account for uncertainty in parameter estimation we undertook probabilistic analysis of each model. As decisions in the development of a model can be uncertain we carried out further probabilistic analyses incorporating uncertainty in both parameter estimation and three elements of the model structure (see below). The probabilistic results are based on 10,000 simulations.
Many of the structural changes made to the model can be thought of in terms of “missing parameters or parameters assigned a single and often extreme value” (Reference Bojke, Claxton, Sculpher and Palmer14). For instance, in the original model, treatment discontinuations were not considered, yet this could be thought of in terms of the treatment discontinuation parameter being assigned the extreme value of zero, while in the new model this takes the value of 0.04 per patient per month with associated uncertainty. Considering structural uncertainty in these terms allows us to more fully characterize the uncertainty in the decision model and can help to explore the value of further research (Reference Bojke, Claxton, Sculpher and Palmer14).
Using the method described by Claxton (Reference Claxton15) and Bojke et al. (Reference Bojke, Claxton, Sculpher and Palmer14), we incorporate structural uncertainty into the probabilistic analysis to help more fully characterize model uncertainty. Each dichotomous choice for the following assumptions had a 50 percent probability (weight) of occurring:
• Data as basis for disease progression: UK or U.S. data set.
• Treatment discontinuations: 0 percent or 4 percent per month (with associated parameter uncertainty).
• Stratifying the pre-institutional state by severity: yes or no (only relevant for UK data set).
The probability of 50 percent is arbitrary and would ideally be informed by evidence, most likely expert evidence.
Expected Value of Partial Information (EVPI)
Calculation of the expected value of information allows an assessment of decision uncertainty within a model and the maximum amount of money a decision maker would be willing to pay for further information to reduce decision uncertainty (Reference Claxton16). Calculation of the expected value of partial information (EVPI) allows assessment of decision uncertainty associated with different groups of information. To calculate the partial EVPI we assume an effective lifetime of the decision of 10 years and a population of 380,000 individuals in England and Wales having Alzheimer's disease in 2005(Reference Knapp, Prince and Albanese17) with 50–64 percent of these having mild to moderate Alzheimer's disease and eligible for donepezil (Reference Knapp, Prince and Albanese17). The model inputs were categorized into six groups on which the partial EVPI is calculated. These groups correspond to three assumptions about model structure (UK or U.S. data set for disease progression, 0 percent or 4 percent treatment discontinuation per month, whether to stratify the pre-institutional state by severity) and three groups of parameters (utilities, effectiveness, and costs). All results are presented assuming that the willingness to pay (WTP) per QALY gained is £30,000. Note that, in these analyses, it is the decision uncertainty at the specified WTP value that is being assessed.
RESULTS
Evolution of the New Model
The cumulative results of the structural changes can be seen in Table 2. Addressing omissions from the original model and updating discount rates to 3.5 percent for costs and benefits leads to a cost per QALY of £88,000 (Model (a)) up from £81,000 per QALY gained in the original model.
Table 2. Cumulative Cost-Effectiveness Results per Patient

* Rounded to nearest £1,000.
** Rounded to nearest £500.
AD, Alzheimer's disease; BSC, best supportive care; QALY, quality-adjusted life-year.
Extending the time horizon from 5 to 20 years (Model (b)) leads to greater total costs and QALYs, and also to greater incremental QALYs. The original 5-year time horizon only captures 78 percent of the incremental QALYs modeled by the 20-year time horizon, whereas the incremental costs are almost unchanged. This leads to a smaller cost per QALY of £66,000 (Model (b)).
Treatment discontinuation is assumed in Model (c). Because this assumption only affects the costs of donepezil, the estimated incremental QALYs remain at 0.042, but the incremental costs are reduced by over 90 percent. Thus, the cost per QALY is reduced to £5,000 from £66,000 (in Model (b)).
Inclusion of updated parameter estimates (Model (d)) also has a large impact on cost-effectiveness: the cost per QALY increases from £5,000 to £34,000. Incremental QALYs are largely unchanged, but incremental costs increase. As noted above, these updated parameters relate to effectiveness and costs. In particular, the updated cost estimates suggest a much smaller difference between the mean costs associated with the pre-institutional (£2,051 per month) and institutional (£2,117 per month) states, thus fewer savings are made by delaying institutionalization.
Model (e) incorporates several changes as a consequence of using the UK data to model disease progression. Although the incremental costs and QALYs are different to Model (d), the cost per QALY is only reduced slightly (to £26,000 from £34,000 in Model (d)). Accounting for heterogeneity in patient ages has little impact on the results (Model (f)).
When costs and utilities in the pre-institutionalized care state are a function of the time to institutionalization, the incremental QALYs remain unchanged, but donepezil becomes cost-saving (Model (g); the new model). This is because pre-institutional costs are now based on time to institutionalization which is delayed due to treatment; therefore the mean cost in the pre-institutionalized state is lower for those receiving donepezil than for those not receiving donepezil, because those receiving donepezil are further from being institutionalized. Further details on this aspect of modeling can be found in Bond et al. (Reference Bond, Rogers and Peters2).
In summary, as Table 2 shows, the incremental QALYs associated with each of the cumulative models do not change considerably (ranging from 0.033 to 0.042); however, the incremental costs differ greatly depending on the assumptions made (ranging from donepezil saving £600 to costing an additional £3,000 per person over a lifetime), leading to critical differences in the ICERs (ranging from £88,000 per QALY to donepezil being cost-saving).
Parameter Uncertainty
The results from the probabilistic analyses for each of the eight models on the cost-effectiveness plane are shown in the Supplementary Figure, which can be viewed online at www.journals.cambridge.org/thc2013086. The 95 percent confidence ellipses (a two-dimensional representation of the joint 95 percent confidence intervals for the incremental costs and QALYs), and the mean incremental costs and QALYs (the diamonds) are shown for each cost-utility model. No model stands out in terms of their 95 percent confidence ellipse being in a different area of the cost-effectiveness plane than the other models. In fact as noted from the deterministic analyses above, all models lead to similar estimated gains in QALYs, but to different estimates of the incremental costs associated with donepezil treatment, leading to quite different conclusions on the cost-effectiveness of donepezil: at a WTP of £30,000 per QALY gained, the probability of donepezil being more cost-effective than best supportive care ranges from just 4 percent from Model (a) to 99 percent from the updated model (Model (g)). See Table 2.
The 95 percent confidence ellipses in the Supplementary Figure only account for uncertainty in the estimates used to parameterize the models, these probabilistic analyses should be considered the minimum uncertainty associated with the decision model.
Model Structure Uncertainty
When uncertainty concerning the three structural assumptions (UK or U.S. data, 0 percent or 4 percent treatment discontinuations, stratifying the pre-institutional state by severity or not) is incorporated into the probabilistic analysis, greater uncertainty is represented in the 95 percent confidence ellipses as would be expected (see Figure 2), and a more conservative estimate of the probability of donepezil being the most cost-effective treatment at a WTP of £30,000 per QALY gained is calculated: 31 percent. This too is as expected, because the two options for each of the three structural assumptions have been given a probability weighting of 50 percent, effectively averaging across models.

Figure 2. Incremental cost-effectiveness plane showing mean and 95% confidence ellipses.
The partial EVPI calculations from this analysis indicate that there is decision uncertainty (at a WTP of £30,000 per QALY) for both structural assumptions and parameter estimation: further information on the structural assumptions associated with treatment discontinuations, which only affects costs (partial EVPI = £315 million) and cost parameter estimation (partial EVPI = £140 million) would also be valuable. At a WTP of £30,000 per QALY, there is no decision uncertainty associated with any of the other assumptions and parameters.
DISCUSSION
Using a stepped approach, we have documented the evolution of a new model for donepezil treatment in patients with mild to moderate AD. Through this approach, we have shown that the cumulative assumptions have greater impact on the incremental costs than on the incremental QALYs. This is reflected in the partial EVPI analyses where further information on treatment discontinuations (which only affects the cost of donepezil treatment) and cost parameter estimation is shown to be valuable. As would be expected, consideration of both parameter uncertainty and model structure uncertainty in probabilistic analysis leads to a more conservative probability of donepezil being the most cost-effective treatment than just considering parameter uncertainty in the new model (where uncertainty regarding structural decisions is not assumed).
Cost-effectiveness modeling of chronic conditions, such as AD, is not straightforward and involves a great deal of uncertainty. Many decisions on model structure are required but often the uncertainty associated with these decisions is overlooked. Moreover, much of the data informing model parameter values in AD outcome models are out of date or difficult to generalize. Thus, the uncertainty associated with the model findings will be much greater than that which is often reported. It is in situations like this, where there is a great deal of uncertainty in model structure, that the explicit documentation of model development can be useful to policy makers to assess the likely impact of model structure decisions. Chronic conditions, in particular, and more rare conditions where little evidence is available on disease progression would be areas where this explicitness in model development would be useful in policy making.
In explicitly documenting stages of model development and attempting to characterize the related uncertainty, we have demonstrated that assumptions related to the cost of donepezil treatment have a large impact on the findings of the economic evaluation and consequently on the uncertainty of the commissioning decision. Our analysis demonstrates that structural uncertainty is an important source of uncertainty in addition to parameter uncertainty.
There are several limitations of this approach. First, we did not incorporate all possible sources of uncertainty. For instance, the proportion of people discontinuing treatment was assumed to increase linearly with time spent on treatment. Second, the probability weights assigned to each structural choice in Section 4.2 were arbitrarily set to 50 percent. Formal elicitation of expert opinion would be invaluable for assigning these weights, and uncertainty in the weights themselves should also be incorporated into the model. Third, in amending the original model, other sources of uncertainty have become apparent. In particular, although UK data are more relevant to a cost-effectiveness model for informing policy in England and Wales, the UK data set was based on just 92 participants, from one area of the United Kingdom (Oxfordshire) collected 10–20 years ago. The new model continues to share several limitations of the original model. These include the validity and reliability of the clinical effectiveness and cost estimates, and that a complex multi-dimensional chronic condition such as AD, is reduced to only two health states defined by care setting. Fourth, this approach does not lend itself to the comparison of decision models that are structurally very different. For instance, the decision model reported by Getsios et al. (Reference Getsios, Blume, Ishak and Maclaine18) for donepezil is a discrete event simulation model. This difference in modeling approach and the associated structural assumptions and parameter estimates required does not easily permit comparison with the original or new Markov models. For example, it is very difficult to compare effectiveness estimates: the discrete event simulation model uses equations based on annual rates of change and other covariates to predict institutionalization at different time points, while the new Markov model incorporates the average benefit based on baseline MMSE and ADL within the time to institutionalization equations. Finally, as stated in the introduction, the order of changes to the original model was prioritized based on several criteria that were pre-specified. However, this prioritization was subjective, and a different order of changes would lead to a different pattern in the cumulative results represented in Table 2 and the Supplementary Figure.
CONCLUSIONS
Explicit documentation and attempts to characterize uncertainty in model development leads to a greater appreciation of the uncertainty of findings from decision models. This also helps to identify which aspects of the model are associated with greatest uncertainty. Although widely publicized debate has highlighted the main aspects of structural uncertainty in cost-effectiveness models of AD, there has been much less debate about structural uncertainty in other disease areas. Explicit documentation of model development is valuable, regardless of the disease area.
SUPPLEMENTARY MATERIAL
Supplementary Figure: www.journals.cambridge.org/thc2013086
CONTACT INFORMATION
Dr Jaime Peters, BSc, MSc, PhD (j.peters@exeter.ac.uk), (Research Fellow in Health Economic Modelling), PenTAG, University of Exeter, Exeter, UK.
Associate Professor Rob Anderson, BA, MA, MSc, PhD (Associate Professor of Health Economics and Deputy Director of PenTAG), PenTAG, University of Exeter, Exeter, UK.
Dr Martin Hoyle, DipStats, MA, MSc, PhD (Senior Research Fellow in Health Technology Assessment Modelling), PenTAG, University of Exeter, Exeter, UK.
Professor Chris Hyde, MB, BS, MRCP, FFRH (Professor of Public Health and Clinical Epidemiology), PenTAG, University of Exeter, Exeter, UK.
CONFLICTS OF INTEREST
All authors report a grant to their institution from NIHR HTA programme ‘call-off’ contract to conduct health technologies for NICE Technology Appraisal programme. The funding relationship with NICE & Department of Health is at ‘arm's length’, with work allocated and monitored by the NIHR HTA Programme


