


I. INTRODUCTION
Due to its numerous applications, the problem of the direction-of-arrival (DOA) estimation of one or more incoming radio signals has attracted great attention in the industrial and scientific research communities. Radio direction finders (RDFs) have been widely employed in civil and military applications, e.g. for navigation [Reference Krim and Viberg1]. In particular, the drastic increase of amount of different professional/commercial radio services operating over a very wide radio spectrum (from dozens of MHz to 6 GHz) triggered a demand for ultrawideband (UWB) RDF systems covering the most popular part of the radio spectrum [Reference Russo2–Reference Tuan, Demmel and Russer7]. Existing RDF systems cannot however deal with these numerous applications due to their limited operational bandwidth. Thus, the design of UWB RDF systems is requested by different users. However, at the moment such designs are not investigated in open literature and are not commercially available.
RDF design is a cumbersome task that involves several disciplines such as antenna design, array calibration, signal processing algorithms for DOA estimation, and antenna array design. Ideally, UWB RDFs should feature a fractional bandwidth of at least 100% and small (in comparison to the largest wavelength) size, while still preserving an excellent performance in terms of DOA estimation accuracy. Since an RDF usually utilizes circular or cylindrical arrays, compact and conformal antennas are needed to satisfy the requirements in terms of size, weight, and shape. In addition, the antenna elements should feature a large impedance bandwidth, a frequency-stable radiation pattern with a reasonable directivity level useful to improve the accuracy of the DOA estimation and reduce the probability of ambiguity, as well as demonstrate as low as possible parasitic coupling between the array elements and the support structure. For reliable performance of DOA estimation algorithms, the antenna elements must feature a stable phase center for different DOAs (although the negative effect of variations in the phase response can be mitigated with calibration, it is highly desirable to reduce the post processing). As RDFs generally track narrowband signals, the time-domain response of the antenna is not a critical parameter, although a large bandwid this required. However, a low dispersion profile will be helpful when tracking UWB signals. Furthermore, suitable antenna covers are needed to increase the mechanical and environmental durability of the structure. However, since the cover has an important impact on the array performance, it must also be designed to enhance the antenna radiation properties.
Previous efforts on designing an antenna element dedicated to DOA estimation are mainly based on the adoption of dipoles and composite dipoles [Reference Choi, So, Park and Oh8], log-periodic antennas [Reference Liang and Chia9], patch antenna arrays with electromagnetic band gap (EBG) substrates [Reference Hirata10], and switched parasitic antennas [Reference Svantensson and Wennstrom11–Reference Taillefer, Hirata and Ohira13].
As for the antenna array design, a uniform circular array (UCA) configuration is widely adopted in practice. Such configuration is preferable due to the complete radio coverage in the azimuthal angular direction [Reference Xiao, Xiao and Tai14]. In the determination of the number of array elements, the ambiguity issues are properly taken into account. An RDF is said to have a “rank-n” ambiguity if one steering vector is a linear combination of n other steering vectors [Reference Tan, Goh and Tan15]. Although the ambiguity problem still remains unsolved, some useful results about ambiguity issues in UCA are available in the scientific literature [Reference Xiao, Xiao and Tai14, Reference Tan, Goh and Tan15].
To compensate the effects caused by parasitic coupling and variations in the antenna characteristics possibly responsible for a severe degradation of the system performance [Reference Friedlander16–Reference Ferreol, Larzabal and Viberg18], suitable calibration methods can be adopted. Array calibration techniques may be classified into two different classes: deterministic and blind methods. Deterministic methods are off-line calibration techniques [Reference Ferreol, Boyerb, Larzabal and Haardt19–Reference Kortke22]. The antenna mutual coupling matrix is previously calculated, measured, or estimated and the errors are filtered out by means of a suitable matrix compensation. These techniques are very accurate and reliable, but have some disadvantages due to the fact that heavy numerical computation and accurate pattern measurements are required. However, the main drawback of such methods is that they cannot be used during the system operation. Hence, the effect of the environment is neglected. On the other hand, blind methods are on-line calibration techniques [Reference Lin and Yang23–Reference Jansson, Swindlehurst and Ottersten25], based on the simultaneous estimation of the steering matrix and signal parameters. In general, there is no a priori assumption about the array topology or the antenna characteristics, so these methods are virtually immune to the effect of mutual coupling and errors. However, this can result in a waste of information potentially responsible for a poor resolution of the method, as well as a non-uniqueness of the solution.
The goal of this paper is to design a UWB RDF covering the band from 250 MHz to 3.3 GHz, where the accuracy of the estimation can vary depending on the application. Typical commercial systems feature a mean-square error (MSE) between 10 and 100 deg2 [26]. The requirements considered in our design are to assure a probability of detection larger than 90% with a MSE smaller than 50 deg2 over the whole operational bandwidth. A packet of radio signals is considered correctly detected when their exact number is determined and the MSE is smaller than 100 deg2. These requirements must be fulfilled when considering a maximum number of signals equals 3, a minimum separation between signals is equal to 10° and a minimum SNR of operation is equal to 8 dB. Since it is desirable to integrate RDF systems in mobile units, size constraints are usually provided. So, in order to make the antenna array suitable for a vehicle mounted system devoted to the control of the radio-frequency traffic, the maximum array radius is restricted to 45 cm for the low-frequency RDF subsystem, and to 13 cm for the high-frequency one. Furthermore, in order to avoid “rank-1” ambiguities in the estimation, the number of array elements must be either equal to 5, or equal or greater than 7 [Reference Xiao, Xiao and Tai14].
The design of such system has been carried out by using the following approach. Firstly, the individual antenna element is designed (Section II). The parasitic mutual coupling levels are evaluated by means of a full-wave analysis of the complete array structure, and a specially developed calibration technique is applied to compensate for both the mutual antenna coupling and the variations in the sensor characteristics (Section III). The performance evaluation of the designed RDF system is presented in Section IV. Section V summarizes the results and concludes this paper.
II. SINGLE-ELEMENT ANTENNA DESIGN
We select an elliptically shaped dipole antenna [Reference Shantz27–Reference Agrawall, Kumar and Ray29] as an array element. Such antennas are inexpensive and readily manufacturable on conformal substrates to realize UCAs. They are characterized by relatively small volume occupation, the typical size being λ o/5 [Reference Shantz27] at the lowest frequency of operation, where λ o denotes the free space wavelength. In addition, these antennas are known to feature UWB behavior with a return loss level below −10 dB over a fractional bandwidth of 10:1 or better [Reference Agrawall, Kumar and Ray29]. Despite of their planar geometry, elliptical dipoles also exhibit nearly omnidirectional dipole-like radiation patterns over a larger than 3 to 1 span in frequency, with a reasonably good directivity level (0–3 dBi). They are linearly polarized, as many of the dipoles employed in commercial systems, but in RDF applications both polarizations can be easily covered by using two different sub-arrays. Elliptically shaped dipole antennas also feature low-dispersion characteristics. In fact, a −40 dB ringing level after twice the duration of the pulse can be achieved together with a stable over DOA phase response [Reference Shantz27–Reference Agrawall, Kumar and Ray29].
The radiating element considered in the proposed design is an elliptical dipole with minor radius 95 mm, eccentricity 1.4, and gap between the antenna flairs equal to 2 mm. The antenna geometry has been optimized in such a way as to obtain a lowest operatingfrequency f ≃ 300 MHz. To this end, a specific parameter study, not discussed here for sake of brevity, has been carried out by means of the full-wave commercial field solver CST Microwave Studio.
A) Impact of the curvature radius
Since the considered RDF is basically a circular array, the antenna should be bended over a cylindrical surface. As it is shown in Fig. 1, two possible configurations relevant to the vertical and horizontal polarization of the antenna may be considered.

Fig. 1. Two different bending configurations of the butterfly antenna printed over a cylindrical conformal substrate for (a) vertical and (b) horizontal polarization of the radiated field.
The curvature radius of the adopted cylindrical substrate ranges from 15 to 45 cm. Figure 2 shows the impact of the curvature radius on the antenna return loss. In order to achieve a physical insight in the antenna characteristics, it is to be noticed that the wideband behavior of the considered radiating element results from the superposition of different modes [Reference Chen and Massey30]. The dominant mode is directly linked to the reflection of the surface currents at the open ends of the antenna flairs. Hence, the relevant radiation pattern is similar to that of a conventional linear dipole. At intermediate frequencies the current distribution is strongly affected by the envelope of the dipole flairs, and the antenna is mainly radiating in the direction of the envelope humps. Finally, at higher frequencies, the modes excited along the dipole arms feature a traveling-wave behavior, so that the radiating element may be regarded as the combination of two opposite tapered slot-line antennas [Reference Shantz27]. As it is shown in Fig. 2, bending the antenna along the H-plane has no impact on the resonant dominant mode and, hence, on the antenna operation at low frequencies. However, a degradation of the antenna response can be noticed at higher frequencies due to the curvature effect of the flair edges. Inversely, when the antenna is bent along the E-plane, the first resonant mode is strongly affected, whereas the antenna performance is almost the same at higher frequencies.

Fig. 2. Frequency behavior of the antenna return loss of the butterfly antenna bent along the H-plane (a) and E-plane (b). Planar antenna and curvature radius ranging from 15 to 45 cm.
The conformal deformation of the antenna substrate also has an impact on the radiation properties of the structure. It has been found that reducing the curvature radius results in a larger beamwidth in the E-plane where the antenna is bent along the E-plane. Moreover, the front-to-back radiation ratio tends to reduce as the curvature radius decreases (see Fig. 3). Both these effects are in agreement with the physical intuition, taking into account the analogy with the electromagnetic field focusing property of reflector-like antennas.

Fig. 3. Frequency domain behavior of the front to back radiation ratio return loss of the butterfly antenna bent along the H-plane (a) and E-plane (b). Planar antenna and curvature radius ranging from 15 to 45 cm.
In conclusion, the antenna bending in the H-plane is to be preferred since the circuital and radiation characteristics of the structure are less negatively affected by the curvature radius.
B) Antenna cover
As mentioned in the Introduction, a dielectric radome is needed to protect the RDF sensors against environmental hazards and mechanical impact.
Such cover may be also adopted to enhance the radiation properties of the individual antenna element, increasing the gain and reducing the front-to-back radiation ratio. In this way, the parasitic mutual coupling between the antenna elements and the support structure of the array can be reduced, and the accuracy of the DOA estimation enhanced.
As shown in Fig. 4, the considered antenna element is provided with a high-permittivity dielectric superstrate. It is well-known that the electromagnetic field tends to concentrate in high-dielectric-constant regions, so this layer can stimulate the radiation in the frontward direction enhancing the frontto-back radiation ratio (see Fig. 5). In particular, the antenna response is shifted toward lower frequencies where the superstrate is used, and the overall return-loss level is improved despite of the appearance of some parasitic resonances (see Fig. 6). Unfortunately, as it can be noticed in Fig. 7, the superstrate is also responsible for a reduction of the antenna bandwidth in terms of absolute gain.

Fig. 4. Sketch of the proposed antenna geometry.

Fig. 5. Frequency-domain behavior of the antenna front-to-back radiation ratio of the conformal butterfly antenna as a function of the superstrate thickness, h. The radiating structure is characterized by minor ratio equals 95 mm, eccentricity 1.4, gap between de antenna flairs 2 mm, and curvature radius 45 cm. The superstrate layer has a dielectric constant of 3.5.

Fig. 6. Frequency-domain behavior of the antenna return loss of the conformal butterfly antenna as a function of the superstrate thickness, h. The radiating structure is characterized by minor ratio equals 95 mm, eccentricity 1.4, gap between de antenna flairs 2 mm, and curvature radius 45 cm. The superstrate layer has a dielectric constant of 3.5.
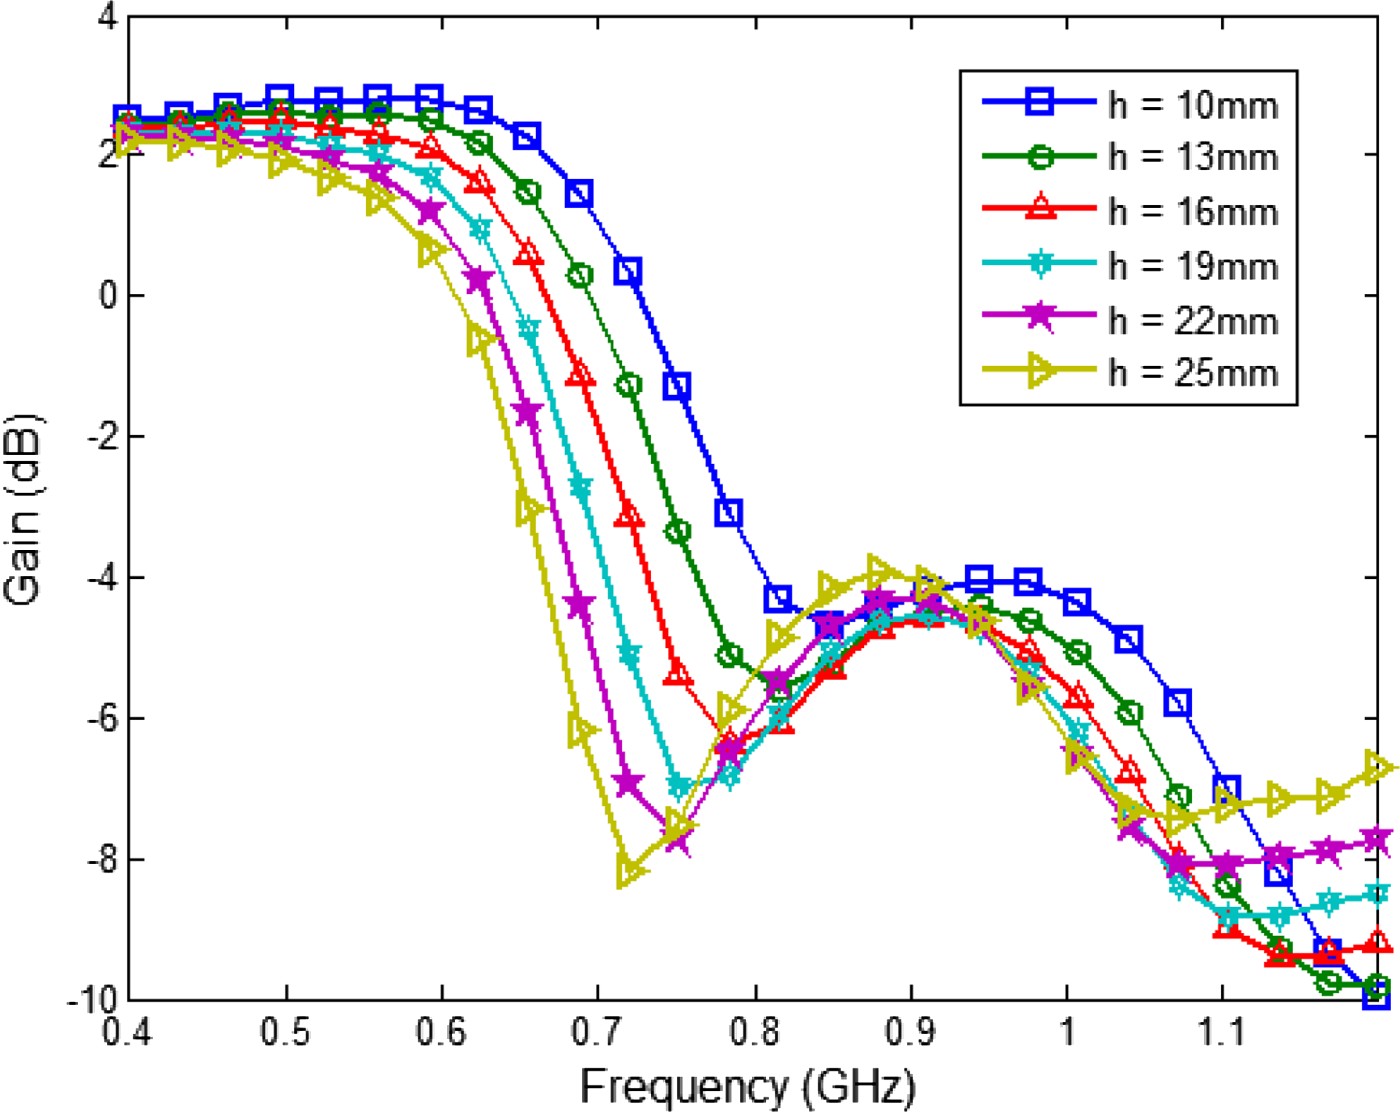
Fig. 7. Frequency-domain behavior of the antenna gain of the conformal butterfly antenna as a function of the superstrate thickness, h. The radiating structure is characterized by minor ratio equals 95 mm, eccentricity 1.4, gap between de antenna flairs 2 mm, and curvature radius 45 cm. The superstrate layer has a dielectric constant of 3.5.
In spite of this, the characteristics of the radiating structure can be enhanced by adding a parallel dielectric layer separated from the superstrate resulting in a combined superstrateradome structure. Such structure is responsible for multiple near-field reflections and interference processes, which can be tuned in order to achieve a better antenna performance in terms of gain and front-to-back radiation ratio. To this end, an extensive parameter study, aimed to the optimization of the superstrate-radome geometry, has been carried out. In this way, it has been found that, where the separation between the dielectric layers is reduced, the antenna response in terms of front-to-back radiation ratio tends to shift toward higher frequencies and, at the same time, the operational bandwidth with respect to the absolute gain level becomes smaller (see Fig. 8). On the other hand, as shown in Fig. 9, by increasing the thickness of theradome, an enhancement in terms of gain and front-to-back radiation ratio can be readily achieved.

Fig. 8. Frequency-domain behavior of the antenna gain (a) and front-to-back radiation ratio (b) of the conformal butterfly antenna as function of the distance L between the superstrate and the radome. The radiating structure is characterized by minor ratio equals 95 mm, eccentricity 1.4, gap between the antenna flairs 2 mm, and curvature radius 45 cm. Both the superstrate and the radome have thickness equals 10 mm and relative dielectric constant 3.5.
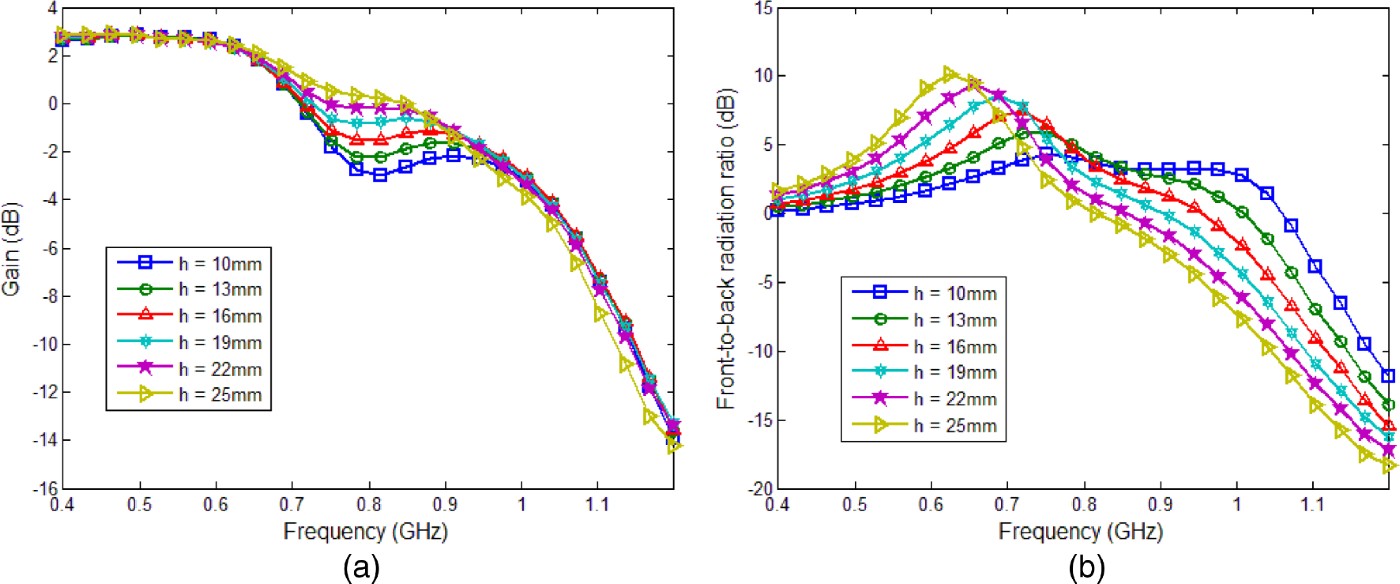
Fig. 9. Frequency-domain behavior of the antenna gain (a) and front-to-back radiation ratio (b) of the conformal butterfly antenna as function of the thickness of the radome layer, h. The radiating structure is characterized by minor ratio equals 95 mm, eccentricity 1.4, gap between the antenna flairs 2 mm, and curvature radius 45 cm. Both the superstrate and the radome have thickness equals 10 mm and relative dielectric constant 3.5.
C) Antenna optimization
A specific study has been performed to optimize the geometry of the considered elliptically shaped dipoles. As the individual radiating element is not capable to cover the whole required frequency band, two different antennas have been consequently designed, one to be embedded in a sub-array covering the frequency range from 250 to 950 MHz and the other one for a second sub-array covering the band from 900 MHz to 3.3 GHz. The optimal antenna dimensions are gathered together in Table 1.
Table 1. Antenna optimal dimensions.

The frequency-domain behavior of the return loss featured by the proposed antennas is shown in Fig. 10. Both antennas are characterized by a good impedance matching over the whole operational frequency range. Figures 11 and 12 show the gain and front-to-back radiation ratio of the considered antennas as a function of frequency. As it appears, the gain is greater than 0 dB in the frequency band between 250 and 900 MHz for the first sub-array element, and from 900 MHz to 3 GHz for the second sub-array element.Furthermore, the low- and high-frequency operating antennas feature a front-to-back radiation ratio larger than 0 dB in the relevant operational bands with a peak value of 9 and 8 dB, respectively.

Fig. 10. Frequency-domain behavior of the antenna return loss of the proposed conformal antennas.

Fig. 11. Frequency-domain behavior of the antenna gain at boresight of the proposed conformal antennas.

Fig. 12. Frequency-domain behavior of the antenna front-to-back radiation ratio of the proposed conformal antennas.
The radiation patterns in the E- and H-plane of the proposed antennas are shown in Figs 13 and 14. As it can be noticed, both antennas are characterized by a donut-like radiation pattern at the lowest frequencies of operation. As the frequency increases the radiated field tends to focus in the frontward direction, resulting in enhanced front-to-back radiation ratio and directivity levels. Finally, at higher frequencies secondary lobes appear, and the field radiation is mainly concentrated along the θ = ± 90 directions.

Fig. 13. Antenna gain (dB) of the low-frequency sub-array antenna element along the (a) E-plane and (b) H-plane.

Fig. 14. Antenna gain (dB) of the high-frequency sub-array antenna element along the (a) E-plane and (b) H-plane.
III. ARRAY DESIGN
It is known that the resolution and accuracy of the estimation increases with the array aperture and the probability of ambiguity decreases with the number of sensors [Reference Baygun and Tamk31].
As it has been shown in Section II, the larger the array radius the better the individual element antenna performance. Furthermore, the larger the array aperture, the smaller the negative effect of the antenna mutual coupling and errors in the sensor characteristics. So, the selection of the largest possible array radius is a logical choice. Taking this into account, the array radius can be determined according to the size constraints (the maximal radius of 45 and 13cm for the low- and high-frequency operating sub-arrays, respectively).
The minimal number of sensors in each array can be set initially to 5 to avoid the “rank-1” ambiguities [Reference Xiao, Xiao and Tai14]. Although the results introduced in [Reference Xiao, Xiao and Tai14] assume isotropic radiation patterns and the presented antennas perform a good front-to-back radiation pattern, a more directive radiation pattern reduces the probability of ambiguity, since not only the received phase must be equal, but the magnitude must also be compensated to produce an ambiguous arrival. Therefore, results introduced in [Reference Xiao, Xiao and Tai14] can be considered as a worst case for the array design. Further increase of the number of sensors is limited by two considerations:
– dense arrays have unacceptable high levels of parasitic coupling;
– unnecessary large array apertures should be avoided in order to reduce the probability of ambiguity [Reference Tan, Goh and Tan15].
Based on the above-mentioned considerations, the selected number of antennas, array radius, and array aperture of the designed arrays have been gathered together in Table 2. In Section V it will be shown that the selected parameters allow meeting the specified design requirements for the RDF.
Table 2. UCA characteristics.

IV. ARRAY CALIBRATION
The mutual coupling between the antenna elements and the effect of the support structure are responsible for a degradation of the array performance that decreases dramatically the accuracy of the DOA estimation [Reference Friedlander16–Reference Ferreol, Larzabal and Viberg18].
The parasitic antenna coupling can be conveniently evaluated by means of the full-wave analysis of the complete array structure. In particular, Fig. 15 shows the frequency-domain behavior of the return-loss and coupling coefficients between the antenna elements of the low-frequency operating UCA with radius equals to 45 cm. The geometry of the conformal butterfly antenna is defined by the first column of Table 1, whereas the array support structure has been modeled by an infinitely long cylindrical metallic mast with diameter of 7 cm. As it can be noted in Fig. 15, the parasitic coupling between the array elements is relatively high because of the nearly omnidirectional radiation property of the antennas and the reduced inter-element separation.

Fig. 15. Return-loss of single antenna element and mutual coupling between antenna elements for a five-element butterfly UCA with array radius equals 45 cm. The supporting structure is modeled by an infinitely long cylindric metallic mast with diameter 7 cm.
As for the variations in the antenna characteristics, in the most general case these are related to the following antenna characteristics: gain/phase, position, orientation, and radiation pattern. In general, the radiation pattern of each antenna element can be measured, so errors relevant to the antenna orientation and radiation properties can be readily filtered out. Antenna arrays for RDF applications are usually built in a very accurate manner, and errors in antenna positions are typically negligible. Therefore, only the errors in antenna gain/phase response are accounted in this paper.
It can be easily shown that variations in the antenna characteristics may be conveniently modeled by multiplication of each component of the steering vectors by a complex constant. Since variations in the antenna gain/phase are angle independent, they can be described by a global calibration matrix Z. However, the calibration method introduced here can be extended by using a local calibration matrix Z = Z(θ) to account for possible angle-dependent errors due to the antenna position, orientation, and radiation pattern.
Deterministic calibration methods are usually preferred for an initial calibration. Therefore, attention has been devoted to the development of a suitable deterministic method. In general, a calibration process based on a deterministic method follows three steps. Firstly, a calibration matrix, Ã, is defined to model the effect of parasitic coupling and variations in the antenna characteristics. Typically, a complex coupling matrix, Z, multiplying the ideal steering matrix, A; is introduced:
where each column of the matrix A is a steering vector, a(θ n), which represents the theoretical response of the array in the angular direction, θ n. For example, for a UCA of radius R and consisting of M elements, it follows that
where
g m(θ n) denoting the response of the mth antenna in the θ n direction.
Secondly, the steering vectors are measured by using suitable pilot signals and gathered together in the measured steering matrix, A m. Finally, the mutual coupling matrix, Z, is estimated via a minimization process in the least squares sense as
The minimization problem is typically solved by adopting a pseudo-inverse-based technique [Reference Su, Dandekar and Ling20]. Additional minimizations are carried out in order to compensate errors in antenna positions [Reference Chong Ng and See21] or non-idealities in the measurement procedure [Reference Kortke22].
A very interesting calibration approach is introduced in [Reference Ferreol, Boyerb, Larzabal and Haardt19]. This technique is based on the analytical modeling of the antenna mutual coupling effects. Using this model, it is possible to reduce the number of unknowns in the aforementioned minimization procedure, as well as to take into account the impact of the array support structure.
Unfortunately, the variations in the sensor characteristics are neglected in the calibration approach presented in [Reference Ferreol, Boyerb, Larzabal and Haardt19]. Therefore, to overcome this limitation an extended technique is developed in this paper by including the effect of the aforementioned source of error.
Figure 16 shows the different antenna mutual coupling contributions for a five-element UCA. As discussed in [Reference Ferreol, Boyerb, Larzabal and Haardt19] the coupling matrix for this specific array configuration, Z C, is a Toeplitz matrix given by
![Z_C=\left[{\matrix{ 1 & \alpha & \beta & \beta & \alpha \cr \alpha & 1 & \alpha & \beta & \beta \cr \beta & \alpha & 1 & \alpha & \beta \cr \beta & \beta & \alpha & 1 & \alpha \cr \alpha & \beta & \beta & \alpha & 1 \cr } } \right]\comma \; \eqno \lpar 5\rpar](https://static.cambridge.org/binary/version/id/urn:cambridge.org:id:binary:20151022075450975-0612:S1759078711000146_eqn5.gif?pub-status=live)
where α and β denote the coupling coefficients between adjacent and non-adjacent antennas, respectively. Since the variations in the antenna characteristics can be conveniently modeled by the multiplication of each component of the steering vectors by a complex constant, the impact of such non-idealities can be analytically described as the following Hadamard product:
where the matrix E is given by
![E=\left[{\matrix{ {e_1 } & \ldots & {e_1 } \cr \vdots & \ddots & \vdots \cr {e_M } & \ldots & {e_M } \cr } } \right].\eqno \lpar 7\rpar](https://static.cambridge.org/binary/version/id/urn:cambridge.org:id:binary:20151022075450975-0612:S1759078711000146_eqn7.gif?pub-status=live)

Fig. 16. Parasitic coupling phenomena in an UCA for RDF. Coupling between the array elements (a) and supporting structure (b).
Furthermore, it is possible to combine both calibration matrices, E and Z C, in the calibration steering matrix:
where M e is equal to E T reduced to a M × M size, and Z o is the complete calibration matrix given by
![Z_o=\left[{\matrix{ {e_1 } & {\alpha e_2 } & {\beta e_3 } & {\beta e_4 } & {\alpha e_5 } \cr {\alpha e_1 } & {e_2 } & {\alpha e_3 } & {\beta e_4 } & {\beta e_5 } \cr {\beta e_1 } & {\alpha e_2 } & {e_3 } & {\alpha e_4 } & {\beta e_5 } \cr {\beta e_1 } & {\beta e_2 } & {\alpha e_3 } & {e_4 } & {\alpha e_5 } \cr {\alpha e_1 } & {\beta e_2 } & {\beta e_3 } & {\alpha e_4 } & {e_5 } \cr } } \right].\eqno \lpar 9\rpar](https://static.cambridge.org/binary/version/id/urn:cambridge.org:id:binary:20151022075450975-0612:S1759078711000146_eqn9.gif?pub-status=live)
Additionally, as pointed out in [Reference Friedlander16], the impact of the array support structure can be usefully modeled by introducing the modified steering vector:
with
a(θ) being the conventional steering vector, and a b(θ) the steering vector relevant to the support structure and
where
![Z_b=\left[{\matrix{ {\alpha _0 } & {\alpha '} & {\beta '} & {\beta '} & {\alpha '} & \gamma \cr {\alpha '} & {\alpha _0 } & {\alpha '} & {\beta '} & {\beta '} & \gamma \cr {\beta '} & {\alpha '} & {\alpha _0 } & {\alpha '} & {\beta '} & \gamma \cr {\beta '} & {\beta '} & {\alpha '} & {\alpha _0 } & {\alpha '} & \gamma \cr {\alpha '} & {\beta '} & {\beta '} & {\alpha '} & {\alpha _0 } & \gamma } } \right]\eqno\lpar 13\rpar](https://static.cambridge.org/binary/version/id/urn:cambridge.org:id:binary:20151022075450975-0612:S1759078711000146_eqn13.gif?pub-status=live)
is the coupling matrix block accounting for the array mast and the antenna arms. It is worth remarking that this matrix can be extended to effectively describe more complex coupling sources, such as the impact of sub-arrays operating at other frequency bands, or it can be reduced to eliminate sources with low contribution to the coupling. For instance, in a vertically polarized antenna array with low-profile feeding structures the parasitic coupling with the vertically oriented mast is dominant, so we canassume α 0 = β′ = α′ = 0. In addition, this coupling matrix block can also be extended to properly model variations in the antenna characteristics:
![Z_b=\left[{\matrix{ {e_1 \cdot \gamma } \cr {e_2 \cdot \gamma } \cr {e_3 \cdot \gamma } \cr {e_4 \cdot \gamma } \cr {e_5 \cdot \gamma } \cr } } \right].\eqno \lpar 14\rpar](https://static.cambridge.org/binary/version/id/urn:cambridge.org:id:binary:20151022075450975-0612:S1759078711000146_eqn14.gif?pub-status=live)
Finally, the minimization of (4) in the least-square sense can be carried out similarly than in [Reference Friedlander16]. In this way the calibration process is successfully completed.
The proposed calibration technique has been tested with two incoming signals having SNR = 10 dB and separated by 20 impinging on the low-frequency operating UCA consisting of five conformal butterfly antennas whose geometry is described in Table 1. In the considered investigations, the variations in antenna characteristics have been assumed to feature a normal distribution with a 5% standard deviation with respect to the nominal value. Moreover, nine uniformly distributed pilot signals have been employed in the measurement process.
The proposed technique has been compared to the original one [Reference Ferreol, Boyerb, Larzabal and Haardt19], and to the conventional calibration technique based on the pseudo-inverse concept [Reference Su, Dandekar and Ling20] (Fig. 17). As it appears from Fig. 17, the performance of the original technique is severely degraded by the presence of variations in antenna characteristics. On the other hand, the performance of the conventional calibration method is degraded due to the effect of the mast. As it can be easily inferred, such degradation is particularly severe at frequencies where the front-to-back radiation ratio of antenna elements is poor.

Fig. 17. Probability of detection (a) and MSE (b) for the extended calibration technique and methods introduced in [16, 19], where nine pilot signals have been employed for the calibration. Variations in the antenna characteristics have a normal distribution with a 5% standard deviation of relevant nominal values. Two incoming signals having SNR = 10 dB, and separated by 20° have been employed for the performance evaluation.
V. PERFORMANCE EVALUATION
The performance of the system has been investigated by computing the MSE and the probability of detection (PoD) in different operative scenarios. In this way, one can evaluate three basic features of the system: the minimum detectable separation between signals; the minimum SNR of operation; and the maximum detectable number of signals. To determine the minimum SNR of operation; the analysis has been carried out by using two well-separated radio signals impinging on the array. The minimum separation between signals is estimated under the assumption of high SNR. Finally, the maximum number of signals is determined by considering well-separated incident radio signals with high SNR. The MUSIC algorithm [Reference Schmidt32] has been adopted as DOA estimation procedure in order to allow the direct comparison between the designed array and other antenna systems already available in the scientific literature. However, it is to be stressed out that the performance of the whole system can be enhanced by using more advanced algorithms based on the joint estimation of DOA and propagation time of arrival (TOA) [Reference VU, Braga, Huyart and Begaud33].
The assessment of the designed RDF has been performed by means of Monte-Carlo simulations with 1000 random selections of the DOA. Figure 17 shows the PoD and MSE for the designed array at different frequencies. No ambiguities are observed at high frequencies. Theoretically, if M is the number of sensors, the MUSIC algorithm for DOA estimation is able to detect M − 1 signals [Reference Schmidt32]. However, where the number of signals approaches the theoretical limit, the system performance starts to degrade (Fig. 18).

Fig. 18. Probability of detection for a different number of incoming signals with a separation of 20° and SNR equal to 20 dB.
The performance of the UCA has been also analyzed for impinging UWB signals. Specific tests have been carried out for two radio signals featuring the same power spectrum (from 150 to 1000 MHz at −3 dB level) and propagating along random spatial directions with a separation of 20°. It has been found that the PoD increases from 87% for SNR = −5 dB up to 100% at SNR = 5 dB, while the MSE decreases from 6.7 deg2 (at SNR = −5 dB) to 4.3 deg2 (at SNR = 20 dB).
VI. CONCLUSION
We have designed a compact antenna arrays for RDF system covering the ultra-wide bandwidth from 250 MHz to 3.3 GHz. This design consists in the development of an UWB conformal elliptically shaped dipole array element and antenna radome, as well as in the optimization of the array topology, a novel calibration procedure and assessment of the RDF performance.
An extensive parameter study has been performed in order to investigate the impact of the conformal deformation of the antenna superstrate on the electromagnetic characteristics of the elliptical dipole. An antenna radome has been designed in such a way as to enhance the front-to-back radiation ratio. In order to cover the whole required operational frequency band, two different sub-arrays and antenna elements have been optimized for the [250, 950] MHz and [0.9, 3.3] GHz frequency sub-bands, respectively. As a result, a novel conformal UWB antenna array has been developed. Within its operational sub-bands the optimized antennas are well matched to the feeding line, featuring frequency-stable donut-like radiation patterns, and reasonably high absolute gain level along the broadside direction. Furthermore, they are characterized by positive front-to-back radiation ratio with a peak value of 8 dB.
As the parasitic mutual coupling between the antenna elements, scattering from the array support structure and variations in the antenna characteristics result in a degradation of the accuracy in the DOA estimation, a novel calibration technique has been developed to compensate for these non-idealities. The main novelty of this calibration technique lies in the fact that it efficiently compensates for performance variations of different antenna elements. Consequently, it outperforms conventional array calibration techniques as it has been shown in simulations. Area of applicability of this technique extends far beyond RDF arrays.
Finally, the performance of the RDF system with the developed antenna arrays has been analyzed by means of Monte-Carlo simulations in different operative scenarios. It has been shown that the RDF guarantees a probability of detection of 0.9 with an MSE smaller than 50 deg2 over the whole operation bandwidth. This is fulfilled for a maximum number of signals equals to 3, a minimum separation between signals equals to 10° and a minimum SNR of operation equals to 8 dB. Furthermore, the designed array is free from “rank-1” ambiguities. Although the developed RDF performs similar to existing narrowband systems within their operational bandwidth, it is however capable to efficiently cover the complete radio spectrum from 250 MHz to 3.3 GHz and, in this way, fully satisfy demanding design specifications for future generation RDF applications.
In future research, a dedicated study aimed to the enhancement of the RDF performance in terms of number of detected radio signals (NoS) is to be carried out. To this end, a suitable joint TOA/DOA estimation procedure might be adopted in place of the MUSIC algorithm. This is potentially of great benefit since the limitation on the NoS due to the number of antenna sensors in the RDF can be overcomed in this way.
 Iñigo Liberal was born on October 31, 1985 in Pamplona, Navarra, Spain. He received the M.Sc. degree from the Public University of Navarra (UPNA), Pamplona, Spain. In 2008, he was the recipient of a scholarship to carry out his master thesis at the International Research Centre for Telecommunications and Radar (IRCTR) at the Delft University of Technology, The Netherlands. Since August 2009 he has been with the Antenna Group at the Public University of Navarra (UPNA), where he is currently working towards his Ph.D. His main research interests are in the field of microwave applications of ferromagnetic micro and nanowires, the design of low-profile metamaterial-based antennas, and UWB antenna systems.
 Diego Caratelli was born in Latina, Italy on May 2, 1975. He received the Laurea (summa cum laude) and Ph.D. degrees in electronic engineering from “La Sapienza” University of Rome, Italy in 2000 and 2004, respectively. In 2005 he joined as a Contract Researcher the Department of Electronic Engineering, “La Sapienza” University of Rome. Since 2007 he is with the International Research Centre for Telecommunications and Radar (IRCTR) of Delft University of Technology, the Netherlands, as a Senior Researcher. His main research activities include the design, analysis, and experimental verification of printed microwave and millimetre-wave passive devices and wideband antennas for satellite, WLAN, and GPR applications, the development of analytically based numerical techniques devoted to the modeling of electromagnetic field propagation and diffraction processes, as well as the analysis of EMC/EMI problems in sensitive electronic equipment. Dr. Caratelli was the recipient of the 2010 Young Antenna Engineer Prize at the 32th European Space Agency Antenna Workshop. He is a member of the Italian Electromagnetic Society (SIEm).
 Alexander G. Yarovoy graduated from the Kharkov State University, Ukraine, in 1984 with the diploma with honour in radiophysics and electronics. He received the Candidate Phys. and Math. Sci. (Ph.D. equivalent) and Doctor Phys. and Math. Sci. (D.Sc. equivalent) degrees in radiophysics in 1987 and 1994, respectively. In 1987 he joined the Department of Radiophysics at the Kharkov State University as a Researcher and became a professor there in 1997. From September 1994 to 1996, he was with Technical University of Ilmenau, Germany as a Visiting Researcher. Since 1999 he is with the International Research Centre for Telecommunications-Transmission and Radar (IRCTR) at the Delft University of Technology, the Netherlands. Since 2009 he leads there a chair of Microwave Technology and Systems for Radar. His main research interests are in ultra-wideband (UWB) microwave technology and its applications (in particular, UWB radars) and applied electromagnetics (in particular, UWB antennas). Prof. Yarovoy is the recipient of a 1996 International Union of Radio Science (URSI) “Young Scientists Award” and the European Microwave Week Radar Award in 2001 for the paper that best advances the state-of-the-art in radar technology (together with L.P. Ligthart and P. van Genderen). Prof. Yarovoy served as the Chair of the 5th European Radar Conference (EuRAD 2008), Amsterdam, The Netherlands, and Co-Chairman and the Technical Program Committee Chair of the Tenth International Conference on Ground Penetrating Radar (GPR2004), Delft.


