


Introduction
Breast cancer is one of the most common diseases and the second leading cause of death amongst women worldwide. The main reason for its occurrence is the hysterical growth of malignant cells in the human breast tissues and the only way to overcome it is its early diagnosis, followed by the right treatment [Reference Moore1]. Many breast imaging techniques like X-ray mammography, ultrasound, magnetic resonance imaging (MRI) are already available for its detection, but these techniques suffer from some inherent disadvantages. The X-ray mammography has difficulty in detecting cancer at early stages, it is ionizing, painful, and expensive too [Reference Karli and Miniaturized2, Reference Bohra and Shaikh3]. The ultrasound and MRI are non-ionizing but none of these methods is used in routine cancer screening. Also, these methods cannot detect the early signs of cancer, so they have importance in later diagnostics to verify the malignity of the breast tissue [Reference Bohra and Shaikh3]. On the other hand, microwave imaging (MWI) is the most attractive emerging technique for early breast cancer detection as it emits non-ionizing radiations; it is inexpensive, unproblematic, harmless, and able to detect small tumors also, at an early stage [Reference Lazaro, Villarino and Girbau4–Reference Pozar6]. The basic principle of MWI utilizes the fact that the presence of tumor/malignant cell can be detected in a human body cell based on the dielectric contrast between a cancerous cell and a healthy cell. This means that a microwave signal directed towards the scanned body part will suffer different amount of reflections from a healthy cell and a cancerous cell due to variable water content in them. For this application, antennas with wide bandwidth, low side lobes and less mutual coupling with smaller sizes are therefore preferred. For this procedure, an ultra-wide frequency band from 3 to 10 GHz is desired to scan the given body part to get a S 11 (dB) response. Since ultra wideband (UWB) is an unlicensed band with short pulses and lower power levels and also helps to achieve a better spatial resolution (at higher frequencies) and better depth of penetration (at lower frequencies also); it is the preferred band for MWI applications. For this purpose, small-sized UWB antennas are desired in order to make the MWI equipment handy. To fulfill these requirements, microstrip patch antennas (MPAs) are the most preferred choice because of their inherent advantages of small size, lightweight, ease of fabrication, and planar configuration etc. But these antennas suffer from an inherent drawback of narrow bandwidth [Reference Lazaro, Villarino and Girbau4, Reference Mahmud, Islam and Samsuzzaman7]. To obtain a wide bandwidth of operation, many bandwidth improvement techniques with MPAs have been worked on by researchers such as increasing the substrate's thickness [Reference Paul, Hosain Md., Sarker, Morshed, Prio and Sarkar8–Reference Uma Shankar, Gajanand and Anubhav11], use of different types of feeding methods [Reference Garg, Bharti and Bahl12], use of low dielectric substrates [Reference Choudhury13, Reference Kaur, Khanna and Kartikeyena14], use of offset fed patch antennas [Reference Azim, Aldhaheri, Sheikh and Islam15] use of triangular slots in the patches [Reference Azim, Islam and Misran16] etc. but with some of these methods, the performance of the antennas in terms of gain also degrades. Using slots in the patches is an efficient method of bandwidth improvement [Reference Kaur and Kaur17], as it increases the number of current loops on the antenna surface thereby exciting multiple resonances [Reference Azim, Islam and Misran16]. The nearby resonances then merge to show an UWB of operation.
Therefore instead of increasing the thickness of substrate for bandwidth and gain improvement, which is an expensive method, the main aim of this article is to propose a stacked (multilayered) aperture coupled microstrip antenna (cost-effective without affecting the antenna dimensions much [Reference Pozar6, Reference Kaur and Kaur18, Reference Malik, Kalaria and Kartikeyan19]) with slots and a defected ground structure (DGS) for bandwidth improvement to excite an UWB of operation for use in monostatic radar-based microwave imaging applications [Reference Ghassemi, Rashed-Mohassel, Neshati, Tavakoli and Ghassemi20–Reference Matin and Mohd Ali22].
Many antennas like biconical [Reference Tiang, Sadoon, Tareq, Aim and Abdullah23], Vivaldi [Reference Al-Zuhairi and Gahl24], horn [Reference Azim, Aldhaheri, Sheikh and Islam15], and MPA [Reference Bhaskaran and Krishnan25, Reference Zulfiker Mahmud26] are available in the literature for use in MWI applications [Reference Tiang, Sadoon, Tareq, Aim and Abdullah23–Reference Zulfiker Mahmud26]. Since the detection of breast cancer requires conformable antennas mainly with UWB properties; the larger antenna structures cannot be used in the proposed research work. Some MPAs are also available in the literature for MWI applications, but the reported MPAs do not excite an UWB and were using the ISM (industrial scientific and medical) band for MWI of breast [Reference Azim, Aldhaheri, Sheikh and Islam15, Reference Bhaskaran and Krishnan25]. Therefore stacked MPA is proposed for the current research work; many stacked MPAs are already available in the literature but they excite multibands of operation [Reference Kaur, Khanna and Kartikeyena14, Reference Kaur27, Reference Kaur, Khanna and Kartikeyena28, and Reference Kaur and Khanna29]. Since the proposed research work concentrates on using an UWB for biomedical applications, the current research article proposes the use of an UWB stacked aperture coupled microstrip antenna (SACMPA) for microwave imaging of breast tissues to detect any malignant cells/tumors in the breast.
The proposed SACMPA has a “ + ” shaped slot in ground plane (DGS) to improve the bandwidth at the multiband excited by the conventional stacked MPA. The proposed stacked antenna works on the basic operating principle of introducing slots in the active and parasitic patches and using a stub attached to the feedline to get a wideband performance at the excited multiband which merge to show an UWB of operation. The designed SACMPA, therefore, shows a simulated UWB from 4.9 to 10.9 GHz, with an impedance bandwidth of 6 GHz. The proposed antenna is fabricated and experimentally tested for S parameters on a Vector Network Analyzer (VNA) and gain in an anechoic chamber for its validation. A simulation set up with a breast phantom is then designed using CST MWS V'17 software. This phantom has a skin layer, followed by a fat layer (towards center) and then a malignant cell at the center of the phantom. The designed SACMPA is made to radiate and then collect the backscattered signals from the phantom. The validation of these results is done by measuring the S 11(dB) response of the antenna radiating parallel to an experimental phantom made from petroleum jelly with a wheat flour tumor of 4 mm diameter placed at its center. A variation in the two S 11 (dB) values allows the tumor to be detected in the breast. A beam-forming algorithm; Delay and Sum (DAS) is then used to process the different time-delayed S parameters (in the vicinity of the breast phantom). The resulting signal values are then used to plot the image of location of tumor in the breast using MATLAB (monostatic radar technique). Further for finding the approximate location of tumor in the breast phantom; multistatic radar technique is introduced. The phantom is then surrounded by an array of three such SACMPAs around it. “S” parameters from all the three antennas when compared in the presence and absence of the tumor cell depict that the one closest to the tumor shows a better variation in the “S” parameters as compared to others, detecting an approximate location of tumor in the breast.
The organization of the article is as follows; the section “Antenna design and mathematical analysis ” presents the design of the proposed SACMPA and its mathematical analysis, the section “Antenna fabrication and validation of simulated results” presents antenna simulated and measured results for validation, the section “Design of a breast phantom and simulation results: S parameter analysis with the proposed SACMPA for tumor detection” presents the simulations for phantom design and its “S” parameters in presence of the breast phantom, the specific absorption rate (SAR) results for identifying the antenna's safety for human exposure and experimentally measured results with a breast phantom model. The section “Beam-forming DAS algorithm” presents the use of beam-forming algorithm for monostatic radar technique in forming 2D images of the tumor location from the measured S parameters (using MATLAB). The section “Beam-forming DAS algorithm” presents the simulation procedure that is repeated with an array of three antennas placed around the phantom to detect the approximate location of the tumor cell in the breast phantom and the section “Simulation results for approximate location of the tumor using an array of three SACMPAs around the Phantom” concludes the article.
Antenna design and mathematical analysis
The proposed SACMPA consists of three layers of FR4 glass epoxy substrate (ɛ r = 4.4, h = 1.57 mm, tan δ = 0.024) each with dimensions of 37 × 43 × 1.57 mm3. The topmost and the middle layers of FR4 have a parasitic patch and an active patch of copper (with a thickness of 0.035 mm) deposited on their surface, respectively.
Antenna design
The final optimized active and parasitic patches on the top and middle layers of the stacked aperture coupled antenna are shown in Figs 1(a) and 1(b), respectively. The dimensions of both the patches are selected as 20.27 × 15.4 mm2 (active patch) and 27 × 21 mm2 (parasitic patch). The antenna design parameters are calculated using the transmission line model [Reference Balanis30]. The bottom-most layer of FR4 has the feed network; a DGS of copper on its top and a feed line printed on its bottom as shown in Figs 1(c) and 1(d). A perspective view of the assembled antenna is shown in Fig. 2. To obtain maximum coupling of electromagnetic (EM) waves to the active and parasitic patches, these are positioned with respect to the middle of aperture coupled slot. A DGS is then realized by modifying the aperture slot as “ + ” shape in the antenna's ground plane. This disturbs the shielded current distribution depending upon “ + ” shaped defect, thereby decreasing the size and cross-polarization of the antenna, as it provides the resonance at the same bands at which the antenna is already resonant [Reference Kaur27]. The optimization of the aperture slot to a “ + ” shape is done by iterating it for three different slot geometries. The optimization of slot in the ground and further design process is explained in the points below:
• (with a conventional SACMPA with rectangular active and parasitic patches). It shows that with a horizontal aperture, (perpendicular to feedline) the proposed antenna is not matched to the feed network and hence design does not show any impedance bandwidth below-10 dB (S parameter), this is shown as a solid black curve in Fig. 3. Therefore the next antenna geometry considers the aperture slot in a ground plane rotated by 90° (i.e. parallel to feedline); the proposed antenna geometry also shows a poor impedance matching with the feed network and operates only at one resonant frequency i.e. at 3.6 GHz (dotted red curve). To excite same two resonant bands that are excited by the conventional rectangular (active and parasitic patches), a “ + ” shaped (combination of horizontal and vertical slots) aperture is cut from the ground plane. The resulting “S” parameter response represented by a solid pink curve in Fig. 3 shows two main resonances of 3.6 and 8.4 GHz with the excited frequency bands as (3.6–3.8,8.3–8.5 and 10.9–12 GHz with bandwidth of 200 MHz, 200 MHz, and 1.1 GHz, respectively).
• In order to further improve the impedance matching of the antenna to the feed network so as to improve the impedance bandwidth and get an UWB behavior; slots were introduced in both the active and parasitic patches. The active patch is modified to a “swastika” shaped patch which is formed by cutting two horizontal and two vertical slots along the four corners of the active rectangular patch. Another horizontal slot was cut from the middle portion of the patch and helped in the improvement of proposed SACMPA's impedance bandwidth. A further improvement in the “S” parameter response is obtained by introducing an optimized “U” shaped slot in the parasitic patch, along with two inverted “L” shaped slots cut out from the patch edges. The “S” parameter response of the proposed SACMPA with slots in active and parasitic patches is illustrated in Fig. 3(b). Here it is observed that without any slot in the active patch, the antenna shows a dual band performance (3.6–3.8 and 7.2–8 GHz) as a red dotted curve and with the incorporation of slots to form a “swastika” shaped patch, (along with rectangular slot in the middle) a multiband performance is observed (5–6, 6–6.6, and 6.9–10 GHz), as a solid pink S parameter curve. Figure 3(b) (dotted blue curve) shows that without any slot in the parasitic patch, the antenna operates at multiband (5–5.4, 5.4–6, and 6.69–10 GHz) with improved return losses. But for the lower frequency bands from 5 to 6.5 GHz, the impedance matching is not very good. Then with the incorporation of a “U” shaped slot along with inverted “L” shaped slots in the parasitic patch allows the resulting SACMPA to operate at an UWB (4.9 −10.9 GHz with the excited band below −15 dB).
• The tuning stub added to the feed line (shown in Fig. 1(d)) also helps in optimizing the required impedance bandwidth from the proposed SACMPA. Besides controlling the characteristic impedance of the feed line, the width of the feed line affects the coupling to the slot. To a certain degree, thinner feed lines couple more strongly to the slot, therefore the optimized value of feed line width, in this case, is chosen to be 3.3 mm for a better impedance matching. Figure 3(c) shows a combined S parameter response of the proposed SACMPA, with a stub attached to the feedline and without a stub attached to feedline. It is seen from Fig. 3(c) that the proposed antenna geometry with stubs attached to feedline show better results in terms of its impedance bandwidth performance and is therefore incorporated in the final antenna design. Table 1 shows the detailed parametric specifications of the proposed antenna's layers.

Fig. 1. (a) Parasitic patch with U-shaped slot, (b) Swastika shaped active patch, (c) “ + ” shaped DGS in ground plane, (d) Feed line with rectangular shaped tuning stub.

Fig. 2. Perspective view of antenna layers.
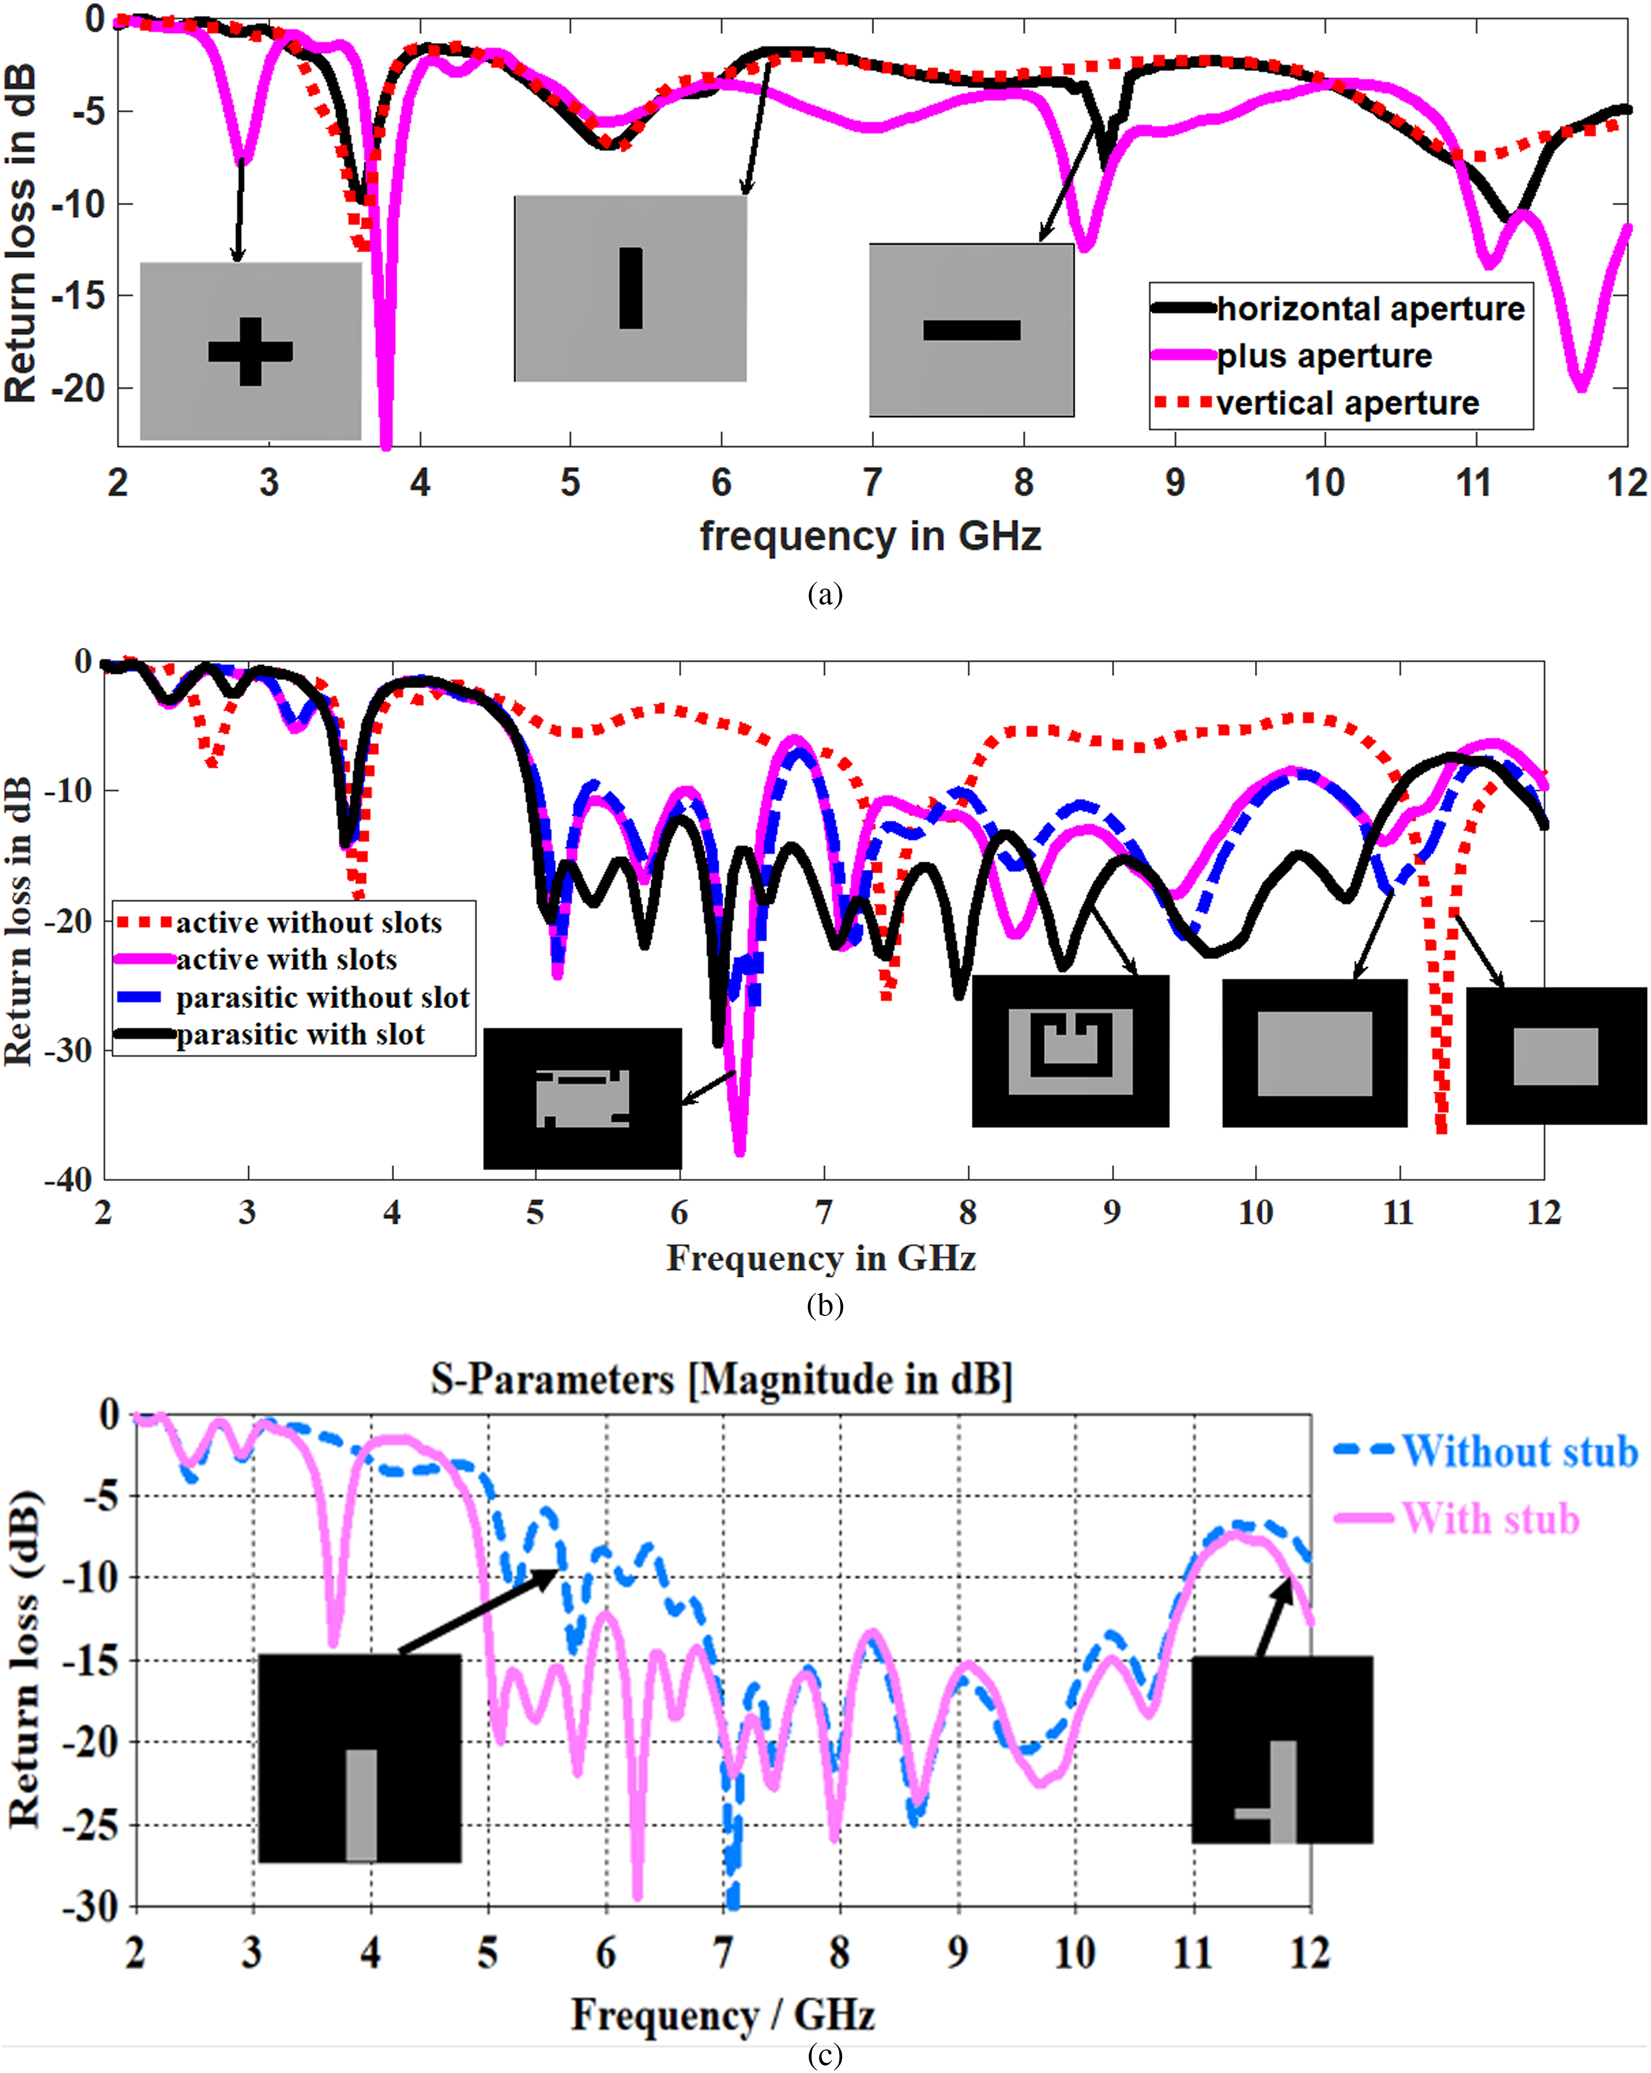
Fig. 3. (a) Parametric variation of aperture (slot) in ground plane with a conventional SACMPA. (b) S parameter response for different slotted geometries of active and parasitic patches. (c) Return loss for antenna with stub and without stub attached to feed line.
Table 1. Optimized parametric values of SACMPA parts

Mathematical analysis and design of proposed antenna structure
This subsection mentions the mathematical analysis and design procedure for the un-slotted stacked aperture coupled MPA with a “ + ” shaped DGS. The proposed SACMPA consists of two patches stacked over each other and the feed network (perspective view shown in Fig. 2(e)) with the active and parasitic patches electromagnetically coupled to the feed network through a “ + ” shaped slot in the ground plane. Therefore there are mainly two resonances associated with each patch of the stacked antenna structure associated with a band of frequency around each resonance. The two resonant bands merge to show the final UWB of operation (the antenna structure optimized with slots for desired performance). The resonance of each of the patch is affected by the effective dielectric constant (ɛ ff) that arises because of two dielectric substrates used in the near vicinity of each other in a stacked geometry. Due to the presence of two substrates, the effective dielectric constant is given by [Reference SvaEina31]
 $$\varepsilon _{\,ff} = \varepsilon _{r1}q_1 + \displaystyle{{{\lpar {1-q} \rpar }^2} \over {\varepsilon _{r2}\lpar {1-q_{1-}q_2} \rpar + q_2}}, $$
where q = q 1 + q 2 + q 3, q 1 the filling fraction and its value is given by
 $$q_1 = 1-\displaystyle{{h_1} \over {2w_{1e}}}\ln \left( {\displaystyle{\pi \over {h_1}}w_{1e}-1} \right), $$
where w 1e is the effective width, its value is given as
 $$w_{1e} = w_1 + 2\displaystyle{{h_1} \over \pi} \ln \left\{ {17.08\left( {\displaystyle{{w_1} \over {2h_1}} + 0.92} \right)} \right\},$$
q 2 and q 3 are also the filling fractions given as q 2 = 1 − q 1−q 3
 $$q_3 = \displaystyle{{h_1-g} \over {2w_{1e}}}ln\left\{ {\pi \displaystyle{{w_{1e}} \over {h_1}}\displaystyle{{\cos \,(\pi g/2h_1)} \over {\pi \lpar {(h/h_1)-(1/2)} \rpar + (\pi g/2h_1)}} + \sin \displaystyle{{\pi g} \over {2h_1}}} \right\}.$$
In equation (4) the value of g is given by
 $$g = \displaystyle{{2h_1} \over \pi} \left\{ {\displaystyle{\pi \over {(\pi w_{1e}/2h_1)-2}}\left( {\displaystyle{h \over {h_1}}-1} \right)} \right\},$$
where h 1 is the height of the lower substrate.
Equations (1) is used to find the effective dielectric constant of the un slotted active resonator as 3.93, with a fringing length of 7 mm. Using equations (6), (7), and (8) [Reference SvaEina31]; a resonant frequency of 9 GHz is calculated for active patch length dimensions of 25 mm. These dimensions are optimized to 20.27 mm to excite resonances of 3.6, 7.4, and 11.2 GHz.
 $$f_r = \displaystyle{C \over {2\lpar {l_1 + \Delta l_1} \rpar \sqrt {\varepsilon _{ef}}}} \;, $$
 $$\Delta l = 0.421l_1\displaystyle{{\lpar {\varepsilon_{1e} + 0.3} \rpar \lpar {(w_1/h_1) + 0.264} \rpar } \over {\lpar {\varepsilon_{1e}-0.258} \rpar \lpar {(w_1/h_1) + 0.8} \rpar }}\;, $$
 $$\varepsilon _e = \displaystyle{{\varepsilon _{r1} + 1} \over 2} + \displaystyle{{\varepsilon _{r1}-1} \over 2}\left( {1 + 12\displaystyle{{h_1} \over {w_1}}} \right)^{\displaystyle{{-1} \over 2}\; \;}. $$
Similarly, an effective dielectric constant of 4.05 is calculated for the un-slotted parasitic patch using equation (1). This is used in equations (6)–(8) to calculate a fringing length of 9.86 mm and a corresponding patch length of 32 mm that gives a calculated resonance of 2.5 GHz. To excite the nearby resonant bands of frequencies excited by the active patch, the parasitic patch dimensions are optimized to 27 mm. This excites the resonant frequencies of 5.1, 6.4, and 9.5 GHz.The method of introducing slots in the two patches and use of a feedline with stub (explained in the section “Antenna design”) helps the antenna to excite the desired UWB to form the proposed SACMPA. The two antenna resonators are electromagnetically coupled so mutual capacitance and inductance sets up between them. When both the resonators are radiating, maximum impedance bandwidth can be achieved. At the resonant frequency, the response of the parasitic element is given as
 $$\displaystyle{{V_2} \over {V_1}} = \sqrt {\displaystyle{{L_2} \over {L_1}}\left( {\displaystyle{{K_1} \over {K^2 + (1/QT_1QT_2)}}} \right)} $$
where V 1 and V 2 are the voltage across active and parasitic patches. L 1 and L 2 are the inductances of active and parasitic patch elements, K 1 is the actual coupling coefficient and K is the critical coupling coefficient. When the actual coupling coefficient equals to the critical coupling coefficient such as K 1 = K. Then we take K = 1/QT 1QT 2
The values of mutual inductance (L m) and mutual capacitance (C m) are given by [Reference Yadava and Babau32]
 $$L_m = \displaystyle{{K^2\lpar {L_1{\rm \;} + {\rm \;} L_2} \rpar {\rm \;} + {\rm \;} \sqrt {(K^2{\lpar {L_1{\rm \;} + {\rm \;} L_2} \rpar }^2 + {\rm \;} 4K^2\lpar {1{\rm \;} -{\rm \;} K^2} \rpar L_1L_2){\rm \; \;}}} \over {2\lpar {1{\rm \;} -{\rm \;} K^2} \rpar }}{\rm \;} $$
 $$C_m = \displaystyle{{-\lpar {C_1{\rm \;} + {\rm \;} C_2} \rpar + \sqrt {{\lpar {C_1 + C_2} \rpar }^2-C_1C_2\lpar {1-(1/K^2)} \rpar }} \over 2}$$
And the final resonance exhibited by this LC structure is given as  $1/2\pi \sqrt {LC}.$
The final SACMPA was optimized with slots in both active and parasitic patches to achieve the required bandwidth around the excited resonances. This was done using the mathematical model and an UWB of operation was achieved from the optimized SACMPA.
Antenna fabrication and validation of simulated results
The proposed SACMPA was designed using CST MWS V’ 17 with perfect boundary conditions and simulated using a time-domain solver (hexahedral mesh settings). This section mentions the fabrication of the proposed antenna's prototype. The simulated results of the proposed antenna are compared with the measured ones to validate the applicability of the proposed antenna for its use as a sensor in biomedical uses. The antenna performance metrics like impedance bandwidth, broadband gain, and radiation pattern results characterizing its radiation metrics are presented in this section.
Fabrication of the proposed SACMPA's prototype
The proposed UWB antenna was fabricated on an FR4 (h = 1.57 mm and ɛ r = 4.4) substrate using wet etching process and tested for validation of simulated results in order to utilize it for MWI applications. The process involves making a layout of the different layers of SACMPA using COREL DRAW software and then their fabrication on three FR4 substrate layers. The final assembled antenna consists of three metal printed layers of FR4 joined using an adhesive; panacol vitralit. On each layer of FR4, the corresponding metal (copper) layers of thickness 0.035 mm are printed using a wet etching process. An SMA connector (50Ω) is soldered at the termination of feedline, between the feedline and ground plane to energize the antenna. The snapshots of all the fabricated individual antenna layers are shown in Figs 4(a)–4(d). Figure 4(a) shows the parasitic patch on topmost substrate layer, Fig. 4(b) shows the active patch on the middle substrate layer and Figs 4(c) and 4(d) show the feed network of the antenna on the bottom-most layer of FR4 (on its top and bottom), respectively. Figure 5(a) shows the picture of the assembled antenna with all the layers to form the final antenna and Fig. 5(b) represents the snapshot of proposed antenna placed inside anechoic chamber during gain measurements. The validation of S 11 (dB) parameters of the proposed SACMPA was done by testing it on the Agilent's VNA model no. E 5063A (operating frequency range of 100 KHz to 18 GHz). Figure 6(a) shows the combined plot of simulated impedance bandwidth (4.9–10.9 GHz) and measured impedance bandwidth (4.9–10.5 GHz). Figure 6(b) shows the snapshot of proposed antenna testing on a VNA. Figures 6(a) and 6(b) depict close proximity between the simulated and measured results with a 93% match between the two results. A little discrepancy between the simulated and measured impedance bandwidth results can be attributed to the reflecting and absorbing objects in its vicinity of the test equipment. Some minor fabrication errors (while fabricating the prototype of the antenna) or the alignment error among the antenna layers, leading to impedance mismatch could also be reason for small variations between simulated and measured results. The measured S parameter response of the proposed SACMPA shows an UWB response (4.9–10.5 GHz) with a little impedance mismatch at 7.95 GHz and is, therefore, suitable for the proposed biomedical applications of interest.

Fig. 4. Fabricated antenna layers: (a) upper parasitic patch layer, (b) lower active patch layer, (c) defected ground plane with plus-shaped DGS, (d) feed-line attached with stub.

Fig. 5. (a) Assembled SACMPA (b) Antenna testing in anechoic chamber.

Fig. 6. (a) Comparison plot between simulated and measured “S” parameters of antenna with respect to frequency. (b) Proposed SACMPA testing on VNA.
Broadband gain and radiation pattern
Figure 7(a) shows the combined plot of the proposed antenna's simulated and measured broadband gain at the desired UWB of operation. The measurement of proposed SACMPA's gain characteristics is done in an anechoic chamber at all the sub frequencies of the excited UWB (4.9–10.9 GHz). The received power (dBm) is used in the FRISS transmission equation [Reference Balanis30] to calculate the gain of proposed SACMPA at all the desired frequencies. The proposed SACMPA has a simulated peak gain of 6.32 dB and measured peak gain of 6 dB at a resonance of 9.1 GHz. The entire band has an average simulated gain of 3 dB and a measured average gain of 3.18 dB, which is well suited for near field communications. A small discrepancy between the simulated and measured gain results is seen and its reason can be accounted to the fact that the measured S parameters of the proposed SACMPA are also shifted towards left as compared to the simulated ones, due to impedance mismatch. Similar behavior can be observed in the case of measured gain plot for the frequency range from 9 to 11.9 GHz, which is shifted towards left as compared to the simulated gain results.

Fig. 7. (a) Broadband gain; (b) 3D Radiation pattern at 9.1 GHz (c) E plane at 9.1 GHz, (d) H plane at 9.1 GHz (e) E plane at 7.8 GHz (f) H plane at 7.8 GHz of the SACMPA.
Figure 7(b) shows the 3D plot of the proposed antenna's radiation pattern at 9.1 GHz, it shows a gain of 6.3 dB and radiation efficiency of 65% approximately. Figures 7(c) and 7(d) show the comparison of the simulated and measured polar plots of radiation pattern (i.e. E plane by placing the antenna in YZ plane and H plane by placing antenna in XZ plane, respectively) of the proposed SACMPA at 9.1 GHz. Figures 7(e) and 7(f) show the comparison of the simulated and measured polar plots of radiation pattern at 7.8 GHz.The co- and cross-polarization gain pattern plots for both the frequencies is also shown. It is observed that polar plot for antenna (Fig. 7(c)) shows main lobe magnitude is 6.27 dB and half-power beam width (HPBW) (3 dB) of the major lobe as 47.2°. Figure 7(d) shows main lobe magnitude of 6.35 dB and HPBW (3 dB) of the major lobe as 37.3°. The simulated and measured values are scaled down by a level −20 dB to represent those on the polar plot conveniently.
Design of a breast phantom and simulation results: S parameter analysis with the proposed SACMPA for tumor detection
The basic principle of microwave imaging for the tumor detection is the variation in electrical properties between malignant and normal breast tissues. Therefore the MWI of the human breast can be carried out by transmitting an UWB pulse (using an antenna) to the area that has to be scanned and reconstructing an image of the received backscattered S parameter signals from the respective area.
In the proposed research article, the proposed UWB SACMPA is used for the transmission and reception of signals to/from the scanned area of interest. Therefore, a simulation set up is developed (in CST MWS V'17) in which a spherical breast phantom model is designed with same electrical properties, like that of an actual human breast. It has a skin layer (4 mm diameter) followed by a fat layer (32 mm diameter) and then a malignant cell/tumor (8 mm diameter) towards the center of the breast phantom. Table 2 mentions the dielectric properties that are considered for each of the breast phantom layers. The dielectric contrast maintained between normal skin tissues and a tumor is normally 5:1 because malignant tissues in the breast exhibit an increased water content as compared to the normal breast tissues [Reference Moore1, Reference Karli and Miniaturized2]. The proposed UWB SACMPA is then made to radiate parallel to this phantom at a distance of 10 mm from it. The location of the antenna around the phantom is defined by using the nonlinear time-domain inverse algorithm [Reference Persson, Zeng and Fhager33]. The basic idea of this algorithm is to compare the measured signals with calculated ones and based on the difference between these two signals, the position of antenna around the breast phantom is then iteratively defined. The SACMPA radiates an UWB pulse towards the breast phantom and then the same antenna acts as a receiver for reception of all the reflected signals from the antenna. When the difference between the calculated and measured signals is small, the reconstruction is said to be completed. A continuous function (P) containing the difference between measured and calculated signals is found out using equation (11) [Reference Persson, Zeng and Fhager33].
 $$P\lpar {\varepsilon, \sigma} \rpar = \mathop \int \limits_0^{{\rm T\;}} \mathop \sum \limits_{m = 1}^M \mathop \sum \limits_{n = 1}^N \lpar {{\vert {E_m^{calculated} \lpar {\sigma, \varepsilon, R_n,t} \rpar -E_m^{measured} \lpar {R_n,t} \rpar } \vert }^2} \rpar dt.$$
Here permittivity(ɛ) and conductivity (σ) are the profiles of the spherical phantom under test, E m(σ, ɛ, R n, t) is data calculated by using FDTD (finite difference time domain) method and $\; E_m^{measured} \lpar {R_n,t} \rpar $ is the measured data when antenna “m” is used as a transmitter. M and N are the number of transmitters and receivers, respectively, used with the phantom and R n denotes the position of n th antenna element. Here the main aim of the reconstruction method is to minimize the objective function P.
Table 2. Electrical properties of the layered breast phantom

Figures 8(a)–8(c) show the designed three layers of the breast phantom with their electrical properties modeled in CST MWS 17. The tumor cell considered here is a benign tumor (This is a form of tumor cell that lacks the ability to enter the adjacent tissues and when these types of tumors are removed, they generally do not grow back) with an epsilon of 67 and electric conductivity of 49 S/m. Due to a significant contrast of permittivity with other cells in the breast, malignant tumors produce localized regions of relatively large backscattered energy, which after passing through the beam-former helps to form an image and thus locate the tumor [Reference Bohra and Shaikh3]. For the designed set up in software, the spherical breast phantom is placed exactly parallel to the major lobe (with HPBW of 47°) of the proposed antenna along the Z-axis.
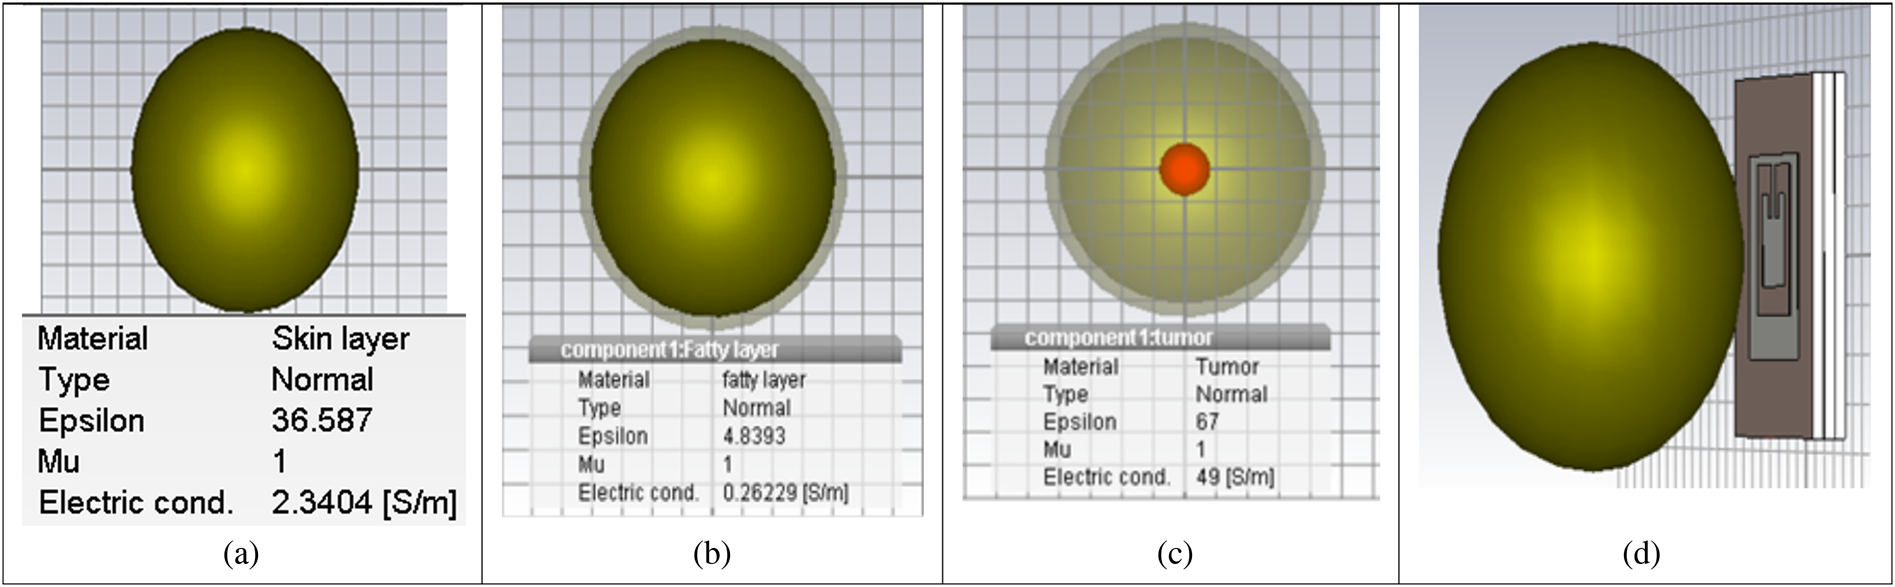
Fig. 8. Spherical breast phantom model (a) Skin layer of 4 mm, (b) Fatty layer of 32 mm inside skin, (c) Tumor of 8 mm diameter inside fat (d) Phantom placed parallel to the broadside radiating antenna structure.
Figure 8(d) shows the antenna placed parallel to the designed breast phantom at an optimized distance of 10 mm from it. It is evident that malignant tissues having higher water content will produce more reflections of the transmitted pulse. This is shown in Fig. 9 where a comparative S parameter plot for two cases of proposed SACMPA radiating parallel to the breast phantom with (4 mm) and without tumor is shown. Figure 9 shows an upwards shifted S parameter plot (dotted green plot with tumor in the phantom) as compared to the normal S parameter response (solid red line plot without tumor in the breast phantom). It is observed that the frequency bands of 5.035–5.528, 5.658–5.873, 6.522–6.66, 7.241–7.683, 8.378–8.735, 9.418–10.176, and 10.57–10.646 GHz show more reflection in the presence of a tumor in the breast phantom and hence makes the detection of tumor in the phantom quite noticeable. Table 3 mentions the variation in magnitudes of S 11 (at the signals received from a phantom without a tumor and the one with a tumor) at different frequencies of the transmitted UWB by the antenna which helps in detecting the presence of tumor in the breast. Based upon the variation in results obtained between the S 11 parameters of a tumor affected breast phantom and a healthy breast phantom; it is concluded that an UWB pulse emitted to cancer affected breast tissues can be received by the same antenna (monostatic radar) for early detection of a malignant cell in the affected breast tissues.

Fig. 9. (a) Comparison of simulated return loss parameters in the presence and absence of tumor of 4 mm placed at center. (b) Comparison of simulated return loss parameters in the presence and absence of tumor (radius of 5 mm) placed at off-center (−4, 0).
Table 3. Variation in the antenna return loss parameters in the presence and absence of tumor in the breast (with respect to Fig. 9(a))

In order to verify the proposed technique for different tumor locations and sizes, the same procedure was repeated for a tumor with a radius of 5 mm and the tumor location shifted off-center with coordinates of (−4, 0). Figure 9(b) depicts the comparison of S parameter plot for the cases of proposed SACMPA radiating parallel to a breast phantom with and without tumor respectively for the tumor of diameter 10 mm. Since both the graphs convey almost the same information, the proposed research work concentrates on detection of a smaller sized (radius = 4 mm) tumor placed at the center of breast phantom.
SAR results of the antenna on the breast phantom
The simulation setup presented in preceding sections has been proposed for biomedical applications; therefore the SAR for the proposed SACMPA used for this set up on breast tissues is analyzed (while making the measurements for MWI purposes). Figures 10(a) and 10(b) show the SAR results on the breast phantom in contour form for the antenna radiating at two resonances of 5.7 and 6.5 GHz, respectively, in the presence of breast phantom. These contours are symmetrically distributed on the breast phantom and signify the concentration of power on the phantom when antenna radiates an UWB pulse towards the phantom. It is seen from Figs 10(a) and 10(b) that the SAR on the breast phantom at the resonant frequencies of 5.7 GHz is 0.271 W/Kg and at 6.5 GHz is 1.115 W/Kg for 1 g of body tissue. This makes the antenna absolutely safe for human exposure (below 1.6 W/Kg for 1 g) and suitable for the proposed biomedical applications [Reference SvaEina31].

Fig.10. SAR values on the breast phantom at (a) 5.7 GHz and (b) 6.5 GHz.
Experimental validation of the proposed tumor detection technique with an artificial breast phantom (monostatic radar technique)
The experimental setup for the verification of stimulated results for breast cancer detection consists of the proposed fabricated SACMPA connected to the VNA E5063A radiating parallel to an experimentally prepared breast phantom (Fig. 11). Literature survey on breast phantom fabrication techniques shows that phantoms made from oil and gelatin [Reference Tiang, Sadoon, Tareq, Aim and Abdullah23, Reference Sachin, Abhishek, Binod, Mukesh and Gautam34], mixture of kerosene oil, safflower oil with formaldehyde [Reference Garrett and Fear35], carbon black graphite and urethane rubber [Reference Shahira Banu, Vanaja and Poonguzhali36], petroleum jelly and wheat flour [Reference Bhaskaran and Krishnan25] are the available choices for breast phantom fabrication. Because of the ease of availability and cost of fabrication, a breast phantom model made from polyethylene material as skin layer, petroleum jelly as the fat layer, and mixture of wheat flour plus water as tumor inside this structure is used in the preparation of prototype of the breast phantom for MWI purpose [Reference Bhaskaran and Krishnan25]. Figures 11(a) and 11(b) show the snapshots of the prototype of breast phantom and tumor inside the phantom, respectively. The petroleum jelly has a permittivity of 2.36 and a conductivity of 0.0012 S/m. The mixture of wheat flour and water has the permittivity of 23 and conductivity of 2.57 S/m. The tumor is made by mixing 5 g of wheat flour to 2.5 g of water and placed at the center of the breast phantom. This antenna structure connected to the VNA is placed at a distance of 10 mm from the breast phantom to radiate and collect backscattered signals from the phantom respectively. Table 4 shows the description of the electrical properties of different layers of the breast phantom.

Fig. 11. (a) Breast phantom (b) Tumor made of wheat flour at center of breast phantom.
Table 4. Electrical properties of breast phantom

Figure 12 shows the set up for measuring the backscattered signals from the breast phantom using the proposed SACMPA. Figure 13 shows the comparison plot of antenna “S” parameters measured with the phantom (having tumor) and with phantom (not having tumor) using a VNA. It is observed that when the breast phantom with tumor is placed parallel to the SACMPA, more reflections in the S parameter results can be observed. The reason for this variation is because of the fact that there is a variation amongst the dielectric properties of healthy breast tissues and the ones with tumor cells [Reference Ruvio, Solimene, Cuccaro, Browne, Gaetano and Amman37]. An increased water content in the tumor cells is the main cause that leads to this variation in the electrical properties of the breast tissues and hence more reflections from a tumor affected area can be seen in the S parameter plot of the antenna.

Fig. 12. Measured S parameters of the proposed antenna in the presence of breast phantom.

Fig. 13. Comparison of measured S parameters of the proposed antenna with and without the tumor affected breast phantom.
In order to find out the location of tumor in the breast phantom model using the monostatic radar technique, the beam-forming algorithm; DAS is used. This is implemented in MATLAB and the image depicting the location coordinates of tumor in the breast phantom is formed. The section “Beam-forming DAS algorithm” mentions the details of the beam-forming algorithm and processing of the obtained S parameters.
Beam-forming DAS algorithm
DAS beam-forming is a simple, robust, and less time-consuming method for the detection of breast cancer [Reference Mojtaba, Maryam, Saripan and Hasan38]. The procedure involves collection of backscattered signals from a breast phantom using the proposed UWB SACMPA (with a SAR below 1.6 W/Kg for a 1 g tissue), that illuminates the breast area to be screened. A difference in the “S” parameters of the UWB antenna around the breast phantom (for the cases of phantom with tumor and without tumor) at varying time intervals is then recorded and used in equation (12) to plot an image of tumor location of the screened area using MATLAB.
The DAS algorithm is mentioned in equation (12) as [Reference Mojtaba, Maryam, Saripan and Hasan38]
 $$F\lpar {x,y,z} \rpar = \int_0^\tau {{\left( {\mathop \sum \limits_{i = 1}^M w_i\lpar {x,y,z} \rpar \times y_i\lpar {t-T_i\lpar {x,y,z} \rpar } \rpar } \right)}^2dt,} $$
where w i is the location-dependent weighting factor associated with attenuation, M = N (N−1)/2 and N is the number of antennas in the array, the limits of integration depend upon the frequency band in use, y i(t) is signal at a certain reference time.
The implementation of this beam-forming algorithm for image processing involves the received antenna responses to be recorded at appropriate time-delays T i. The time-delay T i for the proposed SACMPA is calculated based on the antenna's position, which is the position of the focal point r = (x, y, z) and the wave propagation speed (3 × 10⁸ m/s) using the proposed antenna as a sensor.
To collect the backscattered signals from the breast phantom at different time delays, the proposed SACPMA is therefore moved over the breast phantom (for both the cases of phantom with tumor and without tumor) along the elevation plane positions (0, π) and also along the azimuthal plane positions (0, 2π). The S parameters for the backscattered signals are recorded at a step size of 10° each in the elevation plane. At each 10° variation of elevation plane; 36 samples are recorded for azimuthal plane variations. Total 648 observations are recorded. These signals (for the same location at a given frequency) are then subtracted to remove any redundant data that does not show any variation in the “S” parameter for the two cases. The resulting data for each location at each frequency is then coherently summed up and integrated using equation (12). The integration is performed on the windowed signal, and the length of the integration window is chosen according to the antenna's bandwidth (i.e. τ). Figure 14 shows the time domain pulses plotted after coherently summing up the S parameter difference signals at each location (after conversion from frequency to time domain). The weighing factor, in this case, is chosen to be 1 since the attenuation is assumed to be minimal. Finally a 2D image of reconstructed data is plotted using MATLAB as shown in Figs 15 and 16 for the mentioned two cases of tumors (4 mm at the center and 5 mm off center).

Fig. 14. Time-domain pulses after coherent sum of S parameter.

Fig. 15. (a) 5 mm (radius) tumor placed at (−4, 0) inside breast phantom at center. (b) 4 mm (radius) tumor placed at center (0, 0) inside breast phantom.

Fig. 16. Spherical breast phantom placed in between array of SACMPAs.
The difference of S parameter data that is calculated for different positions (time delays) for at each frequency is then summed up. The resulting values for the azimuthal and elevation planes are then plotted to generate a 2D image of the tumor location in MATLAB as shown in Fig. 15(a), for the case of tumor placed 5 mm inside the breast phantom at (−4, 0) coordinates. Figure 15(b) also shows the 2D image formed by placing 4 mm tumor at (0, 0) coordinates inside the breast phantom using the same procedure. This image formed in MATLAB helps in finding the location of tumor in the breast. Figures 15(a) and 15(b) also show the approximate sizes of both the tumors as 10 mm (diameter) and 8 mm (diameter).
In order to prove the efficiency of the proposed system in context to the existing literature in this regard, Table 5 compares the performance of the proposed breast cancer detection technique as to the existing techniques reported in the literature. It is observed that the techniques reported in [Reference Tiang, Sadoon, Tareq, Aim and Abdullah23, Reference Al-Zuhairi and Gahl24, Reference Zulfiker Mahmud26] used multistatic radar-based cancer detection (using larger sized antennas except one); therefore the mentioned MWI techniques required the use of an antenna array for the detection and imaging procedure. Secondly, the work reported in [Reference Tiang, Sadoon, Tareq, Aim and Abdullah23, Reference Al-Zuhairi and Gahl24, Reference Zulfiker Mahmud26] did not take into account the SAR of the antennas on the breast phantoms, the frequency band used in the reported work was also poorly matched in terms of impedance bandwidth and some of the researchers did not validate their technique with a breast phantom experimentally. The work reported in [Reference Bhaskaran and Krishnan25] makes use of a MPA with a reduced ground but their proposed antenna was not able to excite the UWB, the tumor diameter was considered as 13 mm in this case. Compared to available research work in literature, the proposed monostatic radar-based MWI system involves the use of a single antenna and uses an UWB for “S” parameter analysis as compared to wideband used by other MPAs for MWI. The experimental validation of the proposed technique is also reported which was missing in some of the previously reported research work. The tumor detected using the mentioned procedure is also much smaller (4 and 5 mm) than the earlier detected size (13 mm) of tumor using an MPA (monostatic radar-based technique). This makes us conclude that the proposed research work is one step ahead of the available research work in the area of MWI and can be successfully used for proposed biomedical applications.
Table 5. Comparison of proposed breast cancer detection technique with the existing ones

The approximate location of the tumor in the breast can also be found out by further extending the research work to a multistatic radar-based technique for detection of tumor in the breast. This process involves an array of antennas to be used for tumor detection, where one antenna acts as a transmitter and all others act as receivers. Multiple antennas are used at different locations in the breast to record the backscattered signals, the antenna that shows the maximum “S” parameter variation for the cases of breast phantom with and without tumor. The proposed research work is therefore extended to an array of three such SACMPA's, where all antennas are made to transmit and receive the backscattered signals at three different locations from the breast phantom. The plane where the antenna that shows a maximum variation from the ideal measured value of S 11, in the presence of breast phantom is considered to be the approximate location of the tumor in the breast. This is illustrated in the section “Simulation results for approximate location of the tumor using an array of three SACMPAs around the Phantom” of the research article.
Simulation results for approximate location of the tumor using an array of three SACMPAs around the phantom
The study carried out in the sections “Design of a breast phantom and simulation results: S parameter analysis with the proposed SACMPA for tumor detection” and “Beam-forming DAS algorithm” is extended to find out the approximate location of the tumor cell in the breast phantom using an array of three proposed SACMPAs. This is done by placing the proposed array of three such SACMPAs parallel to the breast phantom (along three planes) as shown in Fig. 16. Each antenna is made to transmit and then receive the backscattered signals from the phantom along the three planes. A combined plot of the six S ij (dB) parameters with respect to frequency is shown in Fig. 17.

Fig. 17. Combined plot of S parameters for an array of three antennas.
Figure 17 shows a combined plot of all reflection (S ij; i = j) and transmission (S ij; i not equal to j) coefficients for the array radiating parallel to the breast phantom. Since all the transmission coefficients (S iji not equal to j) are below a level of −15 dB, there is a low level of correlation between the three antennas that are used for tumor detection. The level of correlation is also related to the S parameters for two antennas by equation (13), this equation can be extended to three an array of three antennas also [Reference Aggarwal and Kaur39].
 $$ECC = \displaystyle{{ \vert S_{ii}^{^\ast} S_{\,jj} + S_{\,ji}^{^\ast} S_{ij} \vert ^2} \over {\lpar {1-{\vert {S_{ii}} \vert }^2- \vert S_{\,ji} \vert^2} \rpar \lpar {1- \vert S_{\,jj} \vert^2- \vert S_{ij} \vert^2} \rpar }}. $$
Since all three antennas excite the same UWB and the correlation between them is <0.5, the antennas in the array are not interfering with each other's radiations; therefore this set up can be easily used for the microwave imaging of the human breast. It is seen from Fig. 18 that the antenna placed in front of phantom (red colored plot) shows maximum variation in its S parameters compared to a case of S parameter without tumor. This allows an approximate detection of the location of tumor in the breast which is the YZ plane for the current case.

Fig. 18. S 11, S 22, and S 33 plots of the three antennas against frequency.
Conclusions
The current research article presents a monostatic radar-based microwave imaging procedure for detection of tumor in breast tissues using the “S” parameter analysis technique. The proposed method uses a stacked aperture coupled patch antenna (with plus-shaped DGS) with two rectangular stacked patches having slots to achieve a measured UWB of operation from 4.9 to 10.5 GHz and a measured peak gain of 6 dB at 9.1 GHz. The antenna experimental measurements show a 93.3% match between the simulated (frequency band of 4.9–10.9 GHz) and measured results. A simulation set up with a breast phantom (with same electrical properties as that of a human breast) placed parallel to the antenna is designed in CST MWS V'17. The placement of the antenna around the phantom is defined using a non-linear time-domain inverse algorithm. The antenna is allowed to transmit UWB pulses to the breast phantom and receive backscattered signals from it. A variation in the S parameter results between a breast phantom with tumor compared to a case of phantom without tumor helps in the detection of any malignant cells in the breast tissues. Experimental validation of the simulated results is done using a breast phantom made from polythene and petroleum jelly (mixture of wheat flour and water as the tumor). Spatial beam-forming using DAS algorithm is then performed to process the measured backscattered signals collected at different time intervals (different locations on the breast phantom). The processed data using the DAS algorithm is then plotted in MATLAB to form a 2D image depicting the location of tumor coordinates in the breast phantom. The proposed microwave imaging antenna system is safe for human exposure as the radiating antenna shows a simulated SAR (on the breast phantom) below 1.6 W/kg for 1 g of tissue.
The procedure is further extended to a multistatic radar-based technique where an array of three proposed SACMPAs placed around the breast phantom and then comparing the S parameter values with an ideal case of without tumor. It is seen that the antenna that shows maximum variation from the ideal case is supposed to be the approximate location of tumor in the phantom.
 Gagandeep Kaur received her degree of B.Tech. in Electronics and Communication Engineering in 2015 from University College of Engineering, Punjabi University, Patiala. She completed her M.E. in Electronics and Communication Engineering with specialization in ultra-wideband microstrip patch antennas in 2017 from Thapar University Patiala, India. She is currently pursuing Ph.D. in microwave imaging using ultra-wideband microstrip and dielectric resonator antennas from Thapar University Patiala. She has published two papers in reputed international conferences and one paper in a Scopus indexed journal. Her research interests include the design, analysis, and implementation of multiband and ultra-wideband Aperture coupled microstrip patch antennas and Dielectric resonator Antennas for Microwave Imaging purposes.
 Amanpreet Kaur received her Ph.D. degree in 2016 (specialization in microstrip antennas for wireless communications) from Thapar University, Patiala, India. She is working as an assistant professor at Thapar University since 2006. Her research interests include wireless communication systems (MIMO Systems), microstrip antennas for wireless communication systems and microwave imaging of human tissues using UWB antennas. She has guided 30 M.E. thesis and has handled projects worth Rupees 25lakhs. She is also a life member of IETE (Institution of Electronics and Telecommunication Engineers). She has 22 research papers in international journals and conferences and eight publications in SCIE journals, and many SCI journals (Taylor IEEE ACCESS, Springer, Cambridge and ELSEVIER).


