


I. INTRODUCTION
Behavioral modeling has been developed as an essential tool in many aspects of modern microwave engineering. It often plays a key role in the processes of measurement, modeling, and simulation that are used for the design and verification of components and systems. It can also greatly improve the efficiency of microwave and RF circuit computed-aided design (CAD) technology. Accurate behavioral models have the ability to provide speedy and reliable simulation results, thereby assisting product innovation. S-parameter models are perhaps the most successful behavioral models to date, as they can completely and accurately capture the dynamic terminal characteristics of any linear, time-invariant multi-port network. The description is sufficient to predict the response to any physical signal, provided only that the signal is small enough. Although the S-parameter model is a powerful concept, it has the fundamental drawback of requiring linear operating conditions. It can only be applied to model components or systems involving nonlinearities when the signal amplitude is reduced to a sufficiently low level [Reference David1–Reference Jan, Denis, Jean-Pierre and Jean-Michel4]. However, as microwave technology develops, the operating frequencies, complexity of signal formats, and power levels, are all increasing steadily, creating a demand for behavioral models that can handle significant nonlinearities while also providing good accuracy over a wide bandwidth.
Verspecht and Root introduced the poly-harmonic distortion (PHD) model to describe nonlinear behavior [Reference Jan and David5–Reference Verspecht, Williams, Schreurs, Remley and McKinley8] in 2006. Based on the basic concept of the PHD model, the commercial simulation environment from Agilent, advanced design system (ADS), offers the X-parameter model as a black-box, frequency-domain modeling technique. X-parameters are the linearization of the spectral map depending on a large-signal operating point (LSOP), and include the interaction of small tones with large ones.
The X-parameter model (or PHD model) provides a convenient way of modeling RF systems or components, and also shows good accuracy. However, it should be noted that the use of 50 Ω X-parameter data cannot exactly predict the behavior around the entire Smith Chart; it can only give good accuracy in a region local to the point where the X-parameter data are extracted. The method of using load-pull data in conjunction with the X-parameter model is very helpful in predicting the variation of the nonlinear device characteristics with load impedance [Reference Simpson9, Reference Horn, Root and Simpson10]. Horn et al. [Reference Horn, Root and Simpson10] illustrates how load-pull can be used with X-parameter measurements to allow the behavior of the device to be accurately characterized for high reflection coefficients.
However, when used in conjunction with load-pull, this kind of extended X-parameter model also has some drawbacks. The first is that the use of the load-pull method causes an explosion in file size as model dimensionality is increased by the requirement for additional parameters [Reference Dylan and Boumaiza11]. In addition, the X-parameter description is also dependent on bias, frequency and input power and inclusion of these parameters make the model even larger. The conclusion is that if a model is required to provide good accuracy over a wide range of use, the user must accept a data file with a huge size. Another factor is that as more measurements are included, more time is needed for both extracting and simulating the model.
Another extension of the original PHD concept, proposed by Qi and Woodington from Cardiff University, provides impressive results [Reference Hao, Johannes and Paul12–Reference Simon14]. This work makes the PHD model not just dependent on the large signal from the input side, but also from the load side, which allows the model to include more information.
By looking closely at the PHD model (or the X-parameter model), it can be seen that the model is constructed using the harmonic superposition principle, and the principle holds when there is a LSOP set by a number of large-signal input tones (often just one, e.g. A 11), plus a number of other small input tones at the harmonics. In this case, the overall effect of the small harmonic components can be assumed to be the linear superposition of the effect of each individual harmonic component acting alone. In a presentation by Verspecht [Reference Verspecht15], it is mentioned that the quadratic PHD (QPHD) model can give better results when compared with the basic first-order model. Based on this fact, we explore another way to improve the accuracy of the PHD model, as an alternative to the Cardiff model, by increasing the order of the derivatives of the small perturbations, such that we include more information in the model. We then add in a load-dependent parameter to improve accuracy at non-50 Ω conditions.
In this paper, a new, modified, QPHD (MQPHD) model is presented. In Section II, the basic theory of the first-order PHD model, the QPHD model, and the new MQPHD model are described. The extraction procedures for the QPHD model and the MQPHD are also provided. In Section III, both the simulation and experimental test results of the MQPHD model are presented. Methods for further optimization of the proposed method, as well as conclusions, are given in Sections IV and V, respectively.
II. PHD MODEL
Given a device-under-test (DUT), its terminal behavior at a specific port and harmonic can be represented by a spectral mapping function F pm. Here all of the relevant incident spectral components A qn can be used to obtain each reflected spectral component, B pm. Whereby q and p range from one to the number of signal ports, and m and n range from zero to the highest harmonic index. The mathematical expression is as shown in (1)
 $$B_{pm}=F_{pm} \lpar A_{11}\comma \; A_{12}\comma \; A_{13}\comma \ldots\comma \; A_{21}\comma \; A_{22}\comma \; A_{23}\comma \ldots \rpar .$$
A) The basic PHD model
According to [Reference Jan and David5, Reference Verspecht, Williams, Schreurs, Remley and McKinley8], the harmonic superposition principle can be used to achieve a linearization around a large-signal incident signal. After that, the expression of the basic PHD model can be obtained as in equation (2)
 $$\eqalign{B_{pm}& =FB_{pm} \left({\left\vert {A_{11} } \right\vert } \right)P^m+\mathop \sum \limits_{qn} S_{pm\comma qn} \left({\left\vert {A_{11} } \right\vert } \right)P^{m - n} A_{qn} \cr & \quad +\mathop \sum \limits_{qn} T_{pm\comma qn} \left({\left\vert {A_{11} } \right\vert } \right)P^{m+n} A_{qn}^{\ast} \comma \;} $$
where
 $$P=e^{+j\emptyset \lpar A_{11} \rpar } .$$
The PHD model can be seen as a Taylor series [Reference Qinglong and Shengli16] for all harmonic components around a large-signal excitation. It simply describes the reflected-waves resulting from a linear mapping of the incident-waves, in a similar way to classical S-parameters. The difference is that while it contains a contribution associated with the incident-waves (A qn) it also has terms associated with their conjugates ( $A_{qn}^{\ast} $) Any phase shift in the incident-waves will just result in the same phase shift in the reflected wave. Here, the main large-signal A 11 creates a phase reference point for all of the other incident waves. The first term in (2) represents the large-signal operating condition response due to an incident signal consisting of a large-signal A 11 at port 1 and harmonic 1. The second and third terms in (2) describe the change in the traveling wave leaving port p at harmonic m due to the small-signal perturbations arriving at each port, at each harmonic frequency, while the large signal A 11 continues to be applied. The ability of the system to generate harmonics is represented by FB pm while the ability of the system to perform frequency conversion of small perturbation signals is represented by S pm,qn and T pm,qn QPHD model.
The basic PHD model described in the previous section takes into consideration only the first-order small perturbations. If the perturbation is small enough, the model will have a good level of accuracy. However, if there is a large-perturbation effect, the model performance begins to degrade.
Here we extend the basic PHD model to a quadratic formulation, which includes the second-order nonlinearity of the small-signal perturbation. We start from the describing function (1). After using the harmonic superposition principle, equation (4) is obtained.
 $$\eqalign{{B_{pm}} = \;& {F_{pm}} \left( {\vert {{A_{11}}} \vert,0, \ldots ,0} \right){P^{ + m}}\; \cr & + \displaystyle{{\partial {F_{pm}}} \over {\partial Re\left( {{A_{qn}}{P^{ - n}}} \right)}}{\vert_{\vert {{A_{qn}}} \vert,0, \ldots ,0}}{P^{ + m}}Re\left( {{A_{qn}}{P^{ - n}}} \right) \cr & + \displaystyle{{\partial {F_{pm}}} \over {\partial Im\left( {{A_{qn}}{P^{ - n}}} \right)}}{\vert_{\vert {{A_{qn}}} \vert,0, \ldots ,0}}{P^{ + m}}Im\left( {{A_{qn}}{P^{ - n}}} \right)\; \cr & + \displaystyle{1 \over {2!}}[\displaystyle{{{\partial ^2}{F_{pm}}} \over {\partial Re{{\left( {{A_{qn}}{P^{ - n}}} \right)}^2}}}{\vert_{\vert {{A_{qn}}} \vert,0, \ldots ,0}}{P^{ + m}}Re{\left( {{A_{qn}}{P^{ - n}}} \right)^2} \cr & + \displaystyle{{{\partial ^2}{F_{pm}}} \over {\partial Im{{\left( {{A_{qn}}{P^{ - n}}} \right)}^2}}}{\vert_{\vert {{A_{qn}}} \vert,0, \ldots ,0}}{P^{ + m}}Im{\left( {{A_{qn}}{P^{ - n}}} \right)^2} \cr & + \displaystyle{{{\partial ^2}{F_{pm}}} \over {\; \; \; \; \partial Re\left( {{A_{qn}}{P^{ - n}}} \right)\partial Im\left( {{A_{qn}}{P^{ - n}}} \right)}}{\vert_{\vert {{A_{qn}}} \vert,0, \ldots ,0}} \cr & \quad{P^{ + m}}Re\left( {{A_{qn}}{P^{ - n}}} \right)Im\left( {{A_{qn}}{P^{ - n}}} \right)].} $$
The function can be seen as a second-order Taylor series for all harmonic components around a large-signal excitation. We will also find that the real and imaginary parts of the small perturbation signals must be treated as separate and independent entities, implying the non-analyticity of the spectral mapping F pm By substituting the real and imaginary parts of the perturbation signals by A qn and their conjugates  $A_{qn}^{\ast} $ we finally obtain the expression of the QPHD model in (5).
 $$\eqalign{{B_{pm}} &= F{B_{pm}}\left( {\vert {{A_{11}}} \vert} \right){P^m} + \mathop \sum \limits_{qn} {S_{pm,qn}}\left( {\vert {{A_{11}}} \vert} \right){P^{m - n}}{A_{qn}} \cr & \quad+ \mathop \sum \limits_{qn} {T_{pm,qn}}\left( {\vert {{A_{11}}} \vert} \right){P^{m + n}}A_{qn}^{\ast} \mathop { + \sum }\limits_{qn} {U_{pm,qn}}\left( {\vert {{A_{11}}} \vert} \right){P^{m - 2n}}{A_{qn}}^2 \; \cr &\quad + \mathop \sum \limits_{qn} {V_{pm,qn}} \left( {\vert {{A_{11}}} \vert} \right){P^{m + 2n}}{A_{qn}}^{\ast2} \; \cr &\quad+ \mathop \sum \limits_{qn} {W_{pm,qn}}\left( {\vert {{A_{11}}} \vert} \right){P^m}{A_{qn}}{A_{qn}}^\ast .}$$
Note that FB, S, T, U, V, and W are defined as follows:
 $$FB_{pm}=F_{pm} \left({\left\vert {A_{11} } \right\vert \comma \; 0\comma \ldots\comma \; 0} \right)\comma \; $$
 $$\eqalign{& {S_{pm,qn}}\left( {\vert {{A_{11}}} \vert} \right) \cr & \quad = \displaystyle{{\displaystyle{{\partial {F_{pm}}} \over {\partial Re\left( {{A_{qn}}{P^{ - n}}} \right)}}{\vert_{\vert {{A_{qn}}} \vert,0, \ldots ,0}} -\! j\displaystyle{{\partial {F_{pm}}} \over {\partial Im\left( {{A_{qn}}{P^{ - n}}} \right)}}{\vert_{\vert {{A_{qn}}} \vert,0, \ldots ,0}}} \over 2},} $$
 $$\eqalign{& {T_{pm,qn}}\left( {\vert {{A_{11}}} \vert} \right) \cr & \quad = \displaystyle{{\displaystyle{{\partial {F_{pm}}} \over {\partial Re\left( {{A_{qn}}{P^{ - n}}} \right)}}{\vert_{\vert {{A_{qn}}} \vert,0, \ldots ,0}} +\! j\displaystyle{{\partial {F_{pm}}} \over {\partial Im\left( {{A_{qn}}{P^{ - n}}} \right)}}{\vert_{\vert {{A_{qn}}} \vert,0, \ldots ,0}}} \over 2},} $$
 $$\eqalign{&{U_{pm,qn}}\left( {\vert {{A_{11}}} \vert} \right) \cr & \quad = \displaystyle{{\displaystyle{{{\partial ^2}{F_{pm}}} \over {\partial Re{{\left( {{A_{qn}}{P^{ - n}}} \right)}^2}}}{\vert_{\vert {{A_{qn}}} \vert,0, \ldots ,0}} - \displaystyle{{{\partial ^2}{F_{pm}}} \over {\partial Im{{\left( {{A_{qn}}{P^{ - n}}} \right)}^2}}}{\vert_{\vert {{A_{qn}}} \vert,0, \ldots ,0}}} \over 8} \cr & \qquad - \displaystyle{{2j\displaystyle{{{\partial ^2}{F_{pm}}} \over {\partial Re\left( {{A_{qn}}{P^{ - n}}} \right)\partial Im\left( {{A_{qn}}{P^{ - n}}} \right)}}{\vert_{\vert {{A_{qn}}} \vert,0, \ldots ,0}}} \over 8},} $$
 $$\eqalign{& {V_{pm,qn}}\left( {\vert {{A_{11}}} \vert} \right) \cr & \quad = \displaystyle{{\displaystyle{{{\partial ^2}{F_{pm}}} \over {\partial Re{{\left( {{A_{qn}}{P^{ - n}}} \right)}^2}}}{\vert_{\vert {{A_{qn}}} \vert,0, \ldots ,0}} - \displaystyle{{{\partial ^2}{F_{pm}}} \over {\partial Im{{\left( {{A_{qn}}{P^{ - n}}} \right)}^2}}}{\vert_{\vert {{A_{qn}}} \vert,0, \ldots ,0}}} \over 8} \cr & \qquad + \displaystyle{{2j\displaystyle{{{\partial ^2}{F_{pm}}} \over {\partial Re\left( {{A_{qn}}{P^{ - n}}} \right)\partial Im\left( {{A_{qn}}{P^{ - n}}} \right)}}{\vert_{\vert {{A_{qn}}} \vert,0, \ldots ,0}}} \over 8},} $$
 $$\eqalign{& {W_{pm,qn}}\left( {\vert {{A_{11}}} \vert} \right) \cr & \quad= \displaystyle{{\displaystyle{{{\partial ^2}{F_{pm}}} \over {\partial Re{{\left( {{A_{qn}}{P^{ - n}}} \right)}^2}}}{\vert_{\vert {{A_{qn}}} \vert,0, \ldots ,0}} + \displaystyle{{{\partial ^2}{F_{pm}}} \over {\partial Im{{\left( {{A_{qn}}{P^{ - n}}} \right)}^2}}}{\vert_{\vert {{A_{qn}}} \vert,0, \ldots ,0}}} \over 4}.}$$
It is clear that the QPHD model includes more information about the DUT than the first-order case: it extracts the second-order nonlinear coefficients of the small perturbation, involving both real parts and imaginary parts. Because of this, the QPHD model can be expected to give superior results, and in particular to give good prediction for a wider range of reflection coefficient values.
B) MQPHD model
In this work, a MQPHD model has been developed, which shows improved results when compared with the standard QPHD approach. The model can be expressed as follows
 $$\eqalign{B_{pm} &= F B_{pm} \left(\vert A_{11} \vert \right) P^m + \sum \limits_{qn} S_{pm,qn} \left(\vert A_{11} \vert \right) P^{m - n} A_{qn} \cr &\quad + \sum \limits_{qn} T_{pm,qn} \left(\vert A_{11} \vert \right) P^{m + n} A_{qn}^{\ast} \cr &\quad + \alpha_{mf} (\vert A_{11} \vert, \Gamma_L) \left[\sum \limits_{qn} U_{pm,qn} \left(\vert A_{11} \vert \right) P^{m - 2n} A_{qn}^2 \right. \cr & \quad + \sum \limits_{qn} V_{pm,qn} \left(\vert A_{11} \vert \right) P^{m + 2n} A_{qn}^{\ast 2} \cr &\left. \quad + \sum \limits_{qn} W_{pm,qn} \left(\vert A_{11} \vert \right) P^m A_{qn} A_{qn}^{\ast}\right].}$$
Here a correction coefficient α mf has been introduced, which can vary with different reflection coefficients (or load conditions). We set a trial value for α mf and then optimize this value within a certain chosen range to build the modified model. With the change of load impedance, the correction coefficient will change as well. As shown later, the MQPHD model shows much better results than the regular QPHD model.
The main difference between the QPHD model and the MQPHD is that the former can be seen as just a truncated second-order Taylor series, while the latter is a first-order Taylor series with a modified second-order term, enabling it to achieve more accurate results.
According to the theory provided before, we can obtain a similar result for the DC equation from [Reference Qinglong and Shengli16, 17]. Horn et al. [Reference Horn, Root and Simpson10], as follows:
 $$\; \; I_i=X_i^I \left({\left\vert {A_{11} } \right\vert } \right)+\mathop \sum \limits_{\lpar j\comma l\rpar \ne \lpar 1\comma 1\rpar } {\rm Re}\left({S_{i\comma jl}^Y \left({\left\vert {A_{11} } \right\vert } \right)A_{jl}+T_{i\comma jl}^Y \left({\left\vert {A_{11} } \right\vert } \right)A_{jl}^{\ast}} \right).$$
Including the modification already introduced, this becomes:
 $$\eqalign{{I_i} =& X_i^I \left( {\vert {{A_{11}}} \vert} \right) + \mathop \sum \limits_{\left( {j,l} \right) \ne \left( {1,1} \right)} {\rm Re}\left( {S_{i,jl}^Y \left( {\vert {{A_{11}}} \vert} \right){A_{jl}} + T_{i,jl}^Y \left( {\vert {{A_{11}}} \vert} \right)A_{jl}^\ast } \right) \cr & + \mathop \sum \limits_{(j,l) \ne (1,1)} {\alpha }_{DC}(\vert {{A_{11}}} \vert,{\Gamma _L}) \cr & \quad{\rm Re} \left( {\matrix{ {U_{i,jl}^Y \left( {\vert {{A_{11}}} \vert} \right){A_{jl}}^2 + V_{i,jl}^Y \left( {\vert {{A_{11}}} \vert} \right)A{_{jl}^{\ast} 2}} \cr { + W_{i,jl}^Y \left( {\vert {{A_{11}}} \vert} \right){A_{jl}}A_{jl}^\ast }} } \right).} $$
Later, DC current results will be compared using the different models.
C) Model extraction methodology
There are several different methods to extract X-parameter (basic PHD) models. Examples are: the offset-tone method [Reference David and Jan6], the orthogonal phase method [Reference Verspecht, Root, Wood and Cognata18], and the randomized phase method [Reference Verspecht, Root, Wood and Cognata18]. However, there are six parameters in the regular QPHD model, which is more than the orthogonal phase method can handle. Additionally, the offset-tone method requires specialized equipment [Reference David and Jan6]. Thus, we choose instead a more straightforward measurement technique, namely, the randomized phase method. Theoretically, if a model has m parameters, then m independent measurements are sufficient to extract the model. However, in order to reduce residual model errors and system noise errors inherent in real measurements, usually more measurements are taken than theoretically required. Here we use 12 measurements for all simulation and experimental measurement examples below.
Taking the simple case of a two-port device as an example, looking at the scattered wave from port 2 at the first harmonic, assuming the phase of the large signal is zero, and restricting B 21 to depend only on A 21 and A 11 then (5) can be reduced to
 $$\eqalign{{B_{21}} &= F{B_{21}}\left( {\vert {{A_{11}}} \vert} \right) + {S_{21,21}}\left( {\vert {{A_{11}}} \vert} \right){A_{21}} + {T_{21,21}}\left( {\vert {{A_{11}}} \vert} \right)A_{21}^\ast \cr &\quad + {U_{21,21}}\left( {\vert {{A_{11}}} \vert} \right){A_{21}}^2 + {V_{21,21}}\left( {\vert {{A_{11}}} \vert} \right){A_{21}}^{\ast 2} \cr &\quad + {W_{21,21}}\left( {\vert {{A_{11}}} \vert} \right){A_{21}}A_{21}^\ast .}$$
After sample points are taken, we can arrive at a matrix formulation of the problem, as shown in (15), whereby B 21 is the output wave at port 2, A 21 and its conjugate  $A_{21}^{\ast} $ are the small signal perturbations, and FB, S, T, U, V, and W are the parameters of the QPHD model. It is assumed that n measurements have been taken, where n is larger than the number of model parameters. This matrix formulation can be represented symbolically as shown in equation (16).
 $$\left[\matrix{B_{21\comma 1} \cr B_{21\comma 2} \cr \vdots \cr B_{21\comma n}} \right] = \left[\matrix{1 &A_{21\comma 1} &A_{21\comma 1}^{\ast} &A_{21\comma 1} A_{21\comma 1} &A_{21\comma 1}^{\ast} A_{21\comma 1}^{\ast} &A_{21\comma 1} A_{21\comma 1}^{\ast} \cr 1 &A_{21\comma 2} &A_{21\comma 2}^{\ast} &A_{21\comma 2} A_{21\comma 2} &A_{21\comma 2}^{\ast} A_{21\comma 2}^{\ast} &A_{21\comma 2} A_{21\comma 2}^{\ast} \cr \vdots & \vdots &\vdots & \vdots & \vdots &\vdots \cr 1 &A_{21\comma n} &A_{21\comma n}^{\ast} &A_{21\comma n} A_{21\comma n} &A_{21\comma n}^{\ast} A_{21\comma n}^{\ast} &A_{21\comma n} A_{21\comma n}^{\ast}} \right] \left[\matrix{FB_{21} \cr S_{21\comma 21} \cr T_{21\comma 21} \cr U_{21\comma 21} \cr V_{21\comma 21} \cr W_{21\comma 21} } \right]\comma \; $$
 $$[B] =[A] [Q].$$
Because [A] is complex and not always square, we have to obtain the pseudo-inverse
 $$[A]^H [B] = [A] ^H [A] [Q].$$
The super-script “H” refers to the Hermitian conjugate operation. Now, the model parameters can be obtained through the equation below:
 $$[Q] =([A]^H [A])^{ - 1} [A]^H [B].$$
After the 50 Ω QPHD model is obtained, the MQPHD model can be calculated using MATLAB. The FB, S, T, U, V, and W terms in the MQPHD model are exactly the same as in the QPHD model. We use these parameters to extract α f(ΓL) at different load conditions to build the MQPHD model. The reflected wave values B 21−m are first measured at the load points where we want to extract the dependence of α f(ΓL) Then, in order to obtain the most accurate α f value for the model, we optimize the α f value at each load point, using the Newton method to minimize the following error function:
 $$Error\lpar \alpha \rpar =\vert B_{21 - m} - B_{21 - \alpha _f } \vert .$$
III. MODEL VALIDATION
Both computer simulations and experimental tests are used to verify the new MQPHD model.
Only the fundamental wave is taken into consideration in the example. In this case, the relationship between the incident and reflected waves can be expressed as (20)
 $$\eqalign{ {B_{21}} &= F{B_{21}}( {\vert {{A_{11}}} \vert} ) + {S_{21,21}}( {\vert {{A_{11}}} \vert}){A_{21}} \cr & \quad + {T_{21,21}}( {\vert {{A_{11}}} \vert} ){P^2}A_{21}^\ast + {\alpha _f}(\vert {{A_{11}}} \vert, \Gamma_L) \cr & \quad [ {{U_{21,21}}( {\vert {{A_{11}}} \vert} ){P^{ - 1}}{A_{21}}^2 + {V_{21,21}}( {\vert {{A_{11}}} \vert} ){P^3}{A_{21}}^{\ast2} } \cr & \quad{+ {W_{21,21}}( {\vert {{A_{11}}} \vert} )P{A_{21}}{A_{21}}^\ast }].} $$
And the expression for DC current is shown as (21)
 $$\eqalign{& I_i = X_i^I \left(\vert A_{11} \vert \right) + {\rm Re} \left(S_{i,21}^Y \left(\vert A_{11} \vert \right) A_{21} + T_{i,21}^Y \left(\vert A_{11} \vert \right)A_{21}^{\ast} \right) \cr & \quad + \alpha_{DC} (\vert A_{11} \vert, \Gamma_L) {\rm Re} \left(\matrix{U_{i,21}^Y \left(\vert A_{11} \vert \right) A_{21}^2 + V_{i,21}^Y \left(\vert A_{11} \vert \right) A_{21}^{\ast \,2} \cr + W_{i,21}^Y \left(\vert A_{11} \vert \right) A_{21} A_{21}^{\ast}} \right).}$$
The DUT here is a 10 W GaN packaged transistor (CGH40010F) manufactured by Cree, and the equivalent circuit model used for simulation is also supplied by the manufacturer.
Measurements were performed on the GaN transistor, and the model was extracted by the methodology previously described. This model was then used to compare simulated data with experimentally measured data, in order to verify the accuracy of the model.
A) Computer simulations
The input power in this example is 20 dBm, 1 GHz, and the device is biased at V GS = −3 V, and VDS = 28 V.
Figure 1 shows the gain curve with the input available power varying from −20 to 35 dBm. From this figure we can see that the input-referred 1 and 3 dB compression points of this DUT are around 10 and 23.5 dBm, respectively, and at 20 dBm input power, the compression is around 1.6 dB, which means the nonlinearity is quite strong.

Fig. 1. Input versus gain curve.
As an example, we choose load data points that have the same magnitude of reflection coefficient, but different phases. We compare the MQPHD model results with those from the regular quadratic model and also from the X-parameter description (i.e. a first-order PHD model). The X-parameter model is obtained from a circuit simulation in ADS (using a device equivalent circuit model provided by Cree), and the QPHD and the MQPHD models are extracted using the method described in Section II(D).
Figure 2 illustrates the points chosen on the Smith Chart. The red circles, as shown in Fig. 2, represent the test data points, where the amplitude of the reflection coefficient is 0.5, with the phase values starting from 0°, and ending at 345°, with a step size of 15°, making 24 points altogether.
Fig. 2. Loads points chosen as example in Smith Chart.
The fundamental output voltage at port 2 of the transistor has been selected as our comparison quantity. The comparison results for this case are shown in Fig. 3. The x-axis and y-axis represent the real and imaginary parts of the voltage. The blue curve (circles) represents the output of the circuit model, which we consider to be the true value; the black curve (triangles) is from the X-parameter model; the magenta curve (diamonds) is from the QPHD model; the red curve (stars) is from the MQPHD model. From this figure, we can see that, the QPHD model provides better prediction than the X-parameter model; however, the MQPHD provides an even better fit, which means the modified model represents the best match to the simulated data.
Fig. 3. Output voltage from simulation of different model at the example load points.
The relative errors of the output voltage from different behavioral models were calculated using the following equation, and this measure is used in the comparison results that follow.
 $$\eqalign{Relative\,\,error = \displaystyle{{\vert measured\,\,value-behavioral\,\,model\,\,value \vert} \over {\vert measured\,\,value \vert}}.}$$
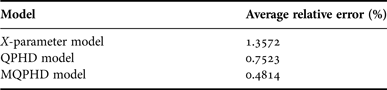
Figure 4 and Table 1 show the relative error and average relative error of different behavioral models. As we can see, MQPHD model has much better accuracy when compared to the X-parameter model. Compared with the regular QPHD model, the modified model also provides significant improvements in accuracy.
Fig. 4. Relative error of output voltage from different models.
Table 1. Average relative error from different models for fundamental voltage.
Besides the fundamental voltage comparison shown before, the DC current model simulation results are also provided. In this example, we use the same load points as shown on the Smith chart in Fig. 2, and the model extraction procedure is the same as the fundamental extraction method. We choose the current model as shown in (21), as our DC model example.
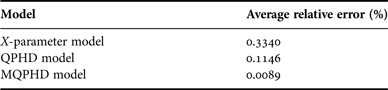
Figure 5 shows the DC drain current results from different models corresponding to the various load reflection coefficients, as shown in Fig. 2. As can be seen, the MQPHD model provide us with the superior results, much better than the X-parameter model and the regular QPHD model, the results from this approach almost matching the circuit model perfectly. Figure 6 shows the relative error from the three different models, as can be seen, the X-parameter model has the highest relative error of 5%, which is a significant error in the DC current, and might cause large errors in power efficiency calculations; the regular QPHD model provides better accuracy, but its highest relative error is also in excess of 2%; the MQPHD model gives a nearly perfect result, its relative error close to zero across the sweep. The average relative errors of different behavioral models are shown in Table 2. The DC MQPHD model has superior improvement compared with the fundamental frequency MQPHD model shown previously. This is because the DC model has only one variable, i.e. the amplitude, while the latter cases have two, both amplitude and phase.
Fig. 5. Drain DC current from different models at different load conditions.
Fig. 6. Relative error of drain DC current from different models.
Table 2. Average relative error from different models for DC current.

B) Experimental tests
In order to validate the proposed behavioral modeling technique in a real-world environment, measurements were given from the same Cree GaN transistor in the laboratory. The device was operated at 1 GHz and excited by a 20 dBm large signal. V GS and V DS were biased at −3 and 28 V, respectively. The test bench used here is a Mesuro nonlinear measurement system.
The model extraction method of Section II(D) was used in this experiment, under 50 Ω terminations. After the model was obtained, it was used to predict the performance of the DUT at different load points around the Smith chart. The load points we choose here are shown in Fig. 7, whereby the amplitude of the reflection here is 0.2, and the phase varies around the center point, with 24 points in total.
Fig. 7. Loads points chosen as example in Smith Chart.
The fundamental reflected wave at port 2 of the transistor is used as comparison quantity. The comparisons results for this case are shown in Fig. 8. There are three behavioral models in this figure, the X-parameter model in black (triangles), and the QPHD model in magenta (diamonds), and the MQPHD model in red (stars), with the blue curve (circles) representing the measured results. From this figure, we can see that the QPHD model provides better prediction than the X-parameter model; however, the modified model provides us even better results, just as with the simulation results presented previously.
Fig. 8. Fundamental reflected wave B 21 from simulation of different measured model at the example load points.
Figure 9 and Table 3 show the relative error and average relative error of different behavioral models. As we can see, the MQPHD model has much better accuracy than X-parameter model; compared with regular QPHD model, the modified model also provides an improvement in accuracy. The improvement is smaller compared to the simulation results in Fig. 4. The reason is that the example load points here are closer to the center of the Smith Chart where the model is extracted (amplitude of reflection coefficient, 0.2 < 0.5), the accuracy of the QPHD model is already very good, much smaller than 1%, so it is difficult to improve greatly on this low value.
Fig. 9. Relative error of reflected wave from different models.
Table 3. Average relative error from different models.

Figure 10 shows the DC drain current results from different models corresponding to the various load reflection coefficients, as shown in Fig. 8. As can be seen, the MQPHD model provides us with the best results, much better than the results from X-parameter model, and the regular QPHD model, the data almost matching those of the measured data perfectly. Figure 11 and Table 4 show the relative error and average relative error from the three different models, respectively, as can be seen, the MQPHD model gives a nearly perfect fit, its relative error close to zero, superior to both the X-parameter model and QPHD model.
Fig. 10. Drain DC current from different measured models at different load conditions.
Fig. 11. Relative error of drain DC current from different measured models.
Table 4. Average relative error from different models for DC current.
IV. MODEL OPTIMIZATION
As shown above, the modified model has better accuracy compared with both the X-parameter model and the regular QPHD model. However, it has a disadvantage: it takes time to find the best correction coefficient α mf or α DC or DC part) to get the optimal result at each load condition. If we use this method to sweep the whole Smith chart, it would be rather time-consuming.
An effective way to overcome this problem is to find the best α mf at a set of different chosen load points and then use two-dimensional (2D) interpolation to obtain an α mf value at any given load condition. This greatly simplifies the building of the modified model throughout the whole Smith chart.
As an example, we chose 24 test load condition points to compare directly extracted values of α f at these points with values obtained using 2D interpolation. The chosen 24 points are in blue (crosses) as shown in Fig. 12. The red load points (circles) shown in Fig. 12, are used for the interpolation test. The amplitude of reflection coefficient of these load points are 0.6 and 0.8, respectively. Firstly, we extract α f at all the red circle load points, then we use these α f value to do interpolation to find the α f at the blue load points (crosses), finally we use these α f value obtained from 2D interpolation to calculate the reflected wave B 21 and compare this with the B 21 obtained from the model which extracted the α f directly.
Fig. 12. Directly extracted α f value reference points (red circles) and test points for interpolation (blue crosses).
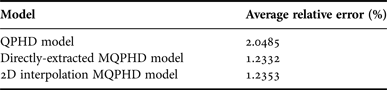
The results of this comparison are shown in Fig. 13, and the values of α f are shown in Fig. 14. Here, the magenta curve (diamonds) shows the results from the QPHD model, the red curve (stars) is from the MQPHD model, for which the α f value is found by direct extraction, the blue curve (squares) comes from the MQPHD model, for which the α f value is obtained using the 2D interpolation method. From Table 5 we can see that the interpolation points provide an almost exactly same accuracy compared to the case where α f is directly extracted, demonstrating the effectiveness of the optimization method. This approach will greatly decrease the model extraction time, because it is not then necessary to extract α f at every point.
Fig. 13. Relative error comparisons between the 2D interpolated model and the directly extracted version.
Fig. 14. α f values from both the 2D interpolated model and the directly extracted version.
Table 5. Average relative error from direct extracted model and optimized model.
V. CONCLUSION
The QPHD model is studied and implemented, and the relative errors are provided in this paper. A new MQPHD model, is presented based on the regular QPHD model. The modified model introduced here has been shown to give more accurate results compared to X-parameter model and the regular QPHD model over a wide range of conditions. As a result, it can be used with very different reflection coefficients providing better accuracy compared with the other two approaches. This MQPHD model provides an effective method to describe a DUT throughout the whole Smith chart using only 50 Ω parameters, with a relatively compact model format.
ACKNOWLEDGEMENTS
The authors would like to thank MACOM Technology Solutions, Inc., Belfast, Mesuro Ltd., Cardiff, Cree Inc., and Science Foundation Ireland for their contributions to, and support of, this work.
Jialin Cai received his B.E. and M.E. degrees both in Electronic Engineering, from Zhejiang University in 2007 and Southeast University in 2009, respectively. He is currently studying towards the Ph.D. degree in the RF and Microwave Research Group at University College Dublin (UCD), Ireland. His research interests include high-frequency nonlinear device modeling and simulations. He also has interest in power amplifier and frequency multiplier design.
Justin B. King received his B.E. and Ph.D. degrees in Electronic Engineering from University College Dublin (UCD), Dublin, Ireland, in 2006 and 2012, respectively. His current research interests include nonlinear electrothermal device characterization, with emphasis on high-power GaN transistor modeling for modern PA design. He is also interested in device physics, nonlinear simulation algorithms, and impedance synthesis techniques. He is currently a Postdoctoral Research Fellow at the RF and Microwave Research Laboratory in UCD.
Thomas J. Brazil received his Ph.D. degree in Electronic Engineering from the National University of Ireland, Dublin, Ireland, in 1977. He subsequently worked on microwave subsystem development with Plessey Research, Caswell, UK, before joining University College Dublin (UCD), Dublin, Ireland, in 1980. He currently holds the Chair of Electronic Engineering at UCD and is Head of the School of Electrical, Electronic and Communications Engineering. His research interests are nonlinear modeling and characterization techniques at the device, circuit, and system level within high-frequency electronics. He also has interests in nonlinear simulation algorithms and several areas of microwave subsystem design and applications. He is Head of the Microwave Research Group, UCD. Prof. Brazil is an elected member of the IEEE Microwave Theory and Techniques Society (MTT-S) AdCom and the Royal Irish Academy (RIA). He was elected to the Council of the RIA in 2006 and elected Secretary of the Academy in 2009. He was elected to the Senate of the National University of Ireland in 2012.


