


Introduction
Construction of the Mars Climate Simulation Chamber (MCSC)
The earliest engineering of the Mars Simulation Chambers was realized back in 1959 (Davis & Fulton Reference Davis and Fulton1959; Davis et al. Reference Davis, Craft and Fulton1959; Fulton Reference Fulton1958). Since then more than ten similar devices have been engineered, technical details of which are well-described in scientific literature and on the Internet, as well as the previous article (Calvin & Gazenco Reference Calvin and Gazenco1979; Davis & Fulton Reference Davis and Fulton1959; Davis et al. Reference Davis, Craft and Fulton1959; Dring Reference Dring1981; Fulton Reference Fulton1958; Galletta et al. Reference Galletta, Ferri, Fanti, D'Alessandro, Bertoloni, Pavarin, Bettanini, Cozza, Pretto, Bianchini and Debei2006; Jensen et al. Reference Jensen, Merrison, Hansen, Mikkelsen, Kristoffersen, Nornberg, Lomstein and Finster2008; Motamedi et al. Reference Motamedi2015; Ramus & van der Meer Reference Ramus and van der Meer1983; Tarasashvili et al. Reference Tarasashvili, Sabashvili, Tsereteli and Aleksidze2013; Zhukova & Kondratyev Reference Zhukova and Kondratyev1965; Zill et al. Reference Zill, Mack and DeVincenzi1979). The present paper describes the very detailed construction and technical details of the MCSC equipment that has not been discussed in the previous article due to its complexity and vastness of the information.
MCSC is a double-coated chamber 15 m3 in volume, equipped with climate-imitating and measuring tools (Fig. 1). Remote semi-automated operation is maintained by the electric-scheme and the supporting computer programmed in accordance with the preliminary calculations (Tarasashvili et al. Reference Tarasashvili, Sabashvili, Tsereteli and Aleksidze2013). The external freezing chamber (EFC) (Fig. 2) is the outermost shell of the MSCS equipped with a refrigerator for the regulation of the temperature, and a tomb for the imitation of atmospheric and pressure parameters. The inner vacuum-glass chamber (IVC) (Fig. 3) is the metal-coated glass box that is sealed hermetically during experiments. The frontal part of this section is constructed from 3 cm-thick iron and includes an entrance door for working personnel. The walls of the inner section are made of 8 mm glass and are covered with a double-layered roof where each layer is made of 2 mm-thick glass. Additionally, the corners of the chamber are glued with 2 mm Plexiglas to improve hermetic properties as well as the safety and the sterility of the internal environment. During the actual performance of the MCSC this section is sealed by a four-screwed door made of 8 mm double glass sitting within a 10 mm iron frame. The inner site of the door and outer site of the entrance are coated by strips of vacuum-rubber that ensures solid attachment on both sides (Fig. 4).
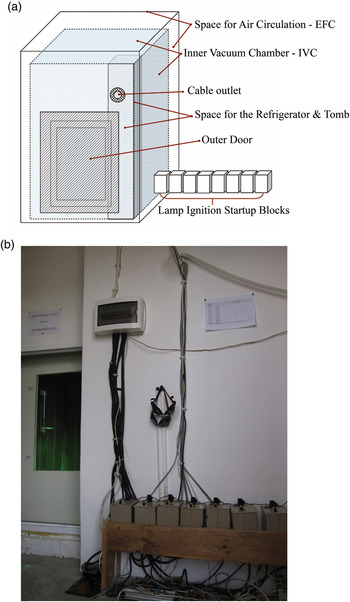
Fig. 1. (a) General schematics of the MCSC ‘Artificial Mars’: MCSC is a double-coated chamber 15 m3 in volume, equipped with climate-imitating and measuring tools; Remote semi-automated operation is maintained by the electric-scheme and the supporting computer programmed in accordance with the preliminary calculations. (b) External view of the MCSC ‘Artificial Mars’: Main circuit block – A and eight start-up blocks for the lamps’ ignition – B are visible.

Fig. 2. Schematics of the EFC and the space for the cold air circulation; EFC is the outermost shell of the MSCS equipped with a CO2–Freon refrigerator for the regulation of the temperature, and a tomb for the imitation of the atmospheric and pressure parameters. A – main start-up circuit block; B – circuit block for lamp ignition start-up blocks; C – computer regulating diurnal cycle.

Fig. 3. The IVC with 10 m3 volume is the metal-coated glass box that is sealed hermetically during experiments. The frontal part of this section is constructed from 3 cm-thick iron and includes an entrance door for the working personnel.

Fig. 4. The inner site of the IVC door and outer site of the entrance are coated by strips of vacuum-rubber that ensures solid attachment on both sides. Every possible empty space and all attached surfaces of the EFC and IVC are filled with low-temperature resistant vacuum-silicate.
The iron wall of the IVC has a special outlet through which the cables of the illuminating equipment, compressor tube and CO2 – balloon tube are exposed to the outer environment reachable by working personnel. Every possible empty space and all attached surfaces of the EFC and IVC are filled with low-temperature resistant vacuum-silicate.
Materials and methods
Technical characteristics of the equipment and approximation of the Martian environmental conditions
Along with the complicated engineering of the structure, exact values were required for the imitation of the accurate hourly variations of surface irradiation as is on planet Mars at different space coordinates. This specific model of Mars Surface Radiation has allowed us to obtain data in a way which has been transformed into a programmed electric scheme, which operates the illumination equipment within the MCSC. The MCSC equipment list includes a freezer, vacuum-tomb, CO2-supply balloons, illuminating gadgets and remote-operation computer programming.
As defined in the previous article, the original calculations and data are used for the construction of technical tools of the MCSC simulating variations of the surface irradiation and temperature of Mars. At the same time, programming of the supporting computer and the electric schemes provide proper remote control and set the environmental parameters that are analogues to the 24 h 39 m circadian cycle as exists on Mars (Tarasashvili et al. Reference Tarasashvili, Sabashvili, Tsereteli and Aleksidze2013).
Spectral and thermal characteristics of the illuminating equipment
Accurate imitation of radiation–temperature parameters within planetary simulation chambers is of great importance, especially when conducting biological experiments and investigating the functionality and survivability of living organisms ‘on the planet’, where these parameters vary significantly and could have an influence on the environmental conditions, as well as the physiology and behaviour of the life-forms thriving in those conditions (Smith et al. Reference Smith, Schuerger, Davidson, Pacala, Bakermans and Onstott2009; Berry et al. Reference Berry, Jenkins and Schuerger2010; Schuerger et al. Reference Schuerger, Clausen and Britt2011, Reference Schuerger, Moores, Clausen, Barlow and Britt2012, Reference Schuerger, Mancinelli, Kern, Rothschild and McKay2003). Illumination parameters on the planet Mars is imitated within the IVC, where the Sun is ‘substituted by’ eight 400 W power lamps: four of which are Hg–Ar–Hal vapour DRT-400 lamps (http://www.medrk.ru/shop/index.php?id_group=71&id_subgroup=129&id_goods=8565) (Fig. 5(a)) and other four – metal-halogen DRE-400 lamps (http://www.elgamma.com.ru/_info/602/608.html) (Fig. 5(b)). The Lamp operation sequence corresponds to the diurnal change of the Sun's radiation intensity in W cm−2 on the Martian surface at Martian 6 am (06:00 sunrise) to 6 pm (18:00 sunset) that mimics disappearance of the Sun beyond the Martian horizon indicating a sharp decrease of the surface temperature (Drollet et al. Reference Drollet, Teai, Faucon and Martin1997; Quesada & Vincent Reference Quesada and Vincent1997; Berry et al. Reference Berry, Jenkins and Schuerger2010; Tarasashvili et al. Reference Tarasashvili, Sabashvili, Tsereteli and Aleksidze2013; http://mars.nasa.gov/mer/spotlight/20070612.html; https://en.wikipedia.org/wiki/Climate_of_Mars, http://www-mars.lmd.jussieu.fr/mars/info_web/MCD4.3_validation.pdf; http://ccar.colorado.edu/asen5050/projects/projects_2001/benoit/solar_irradiance_on_mars.htm). ‘Sunset’ indicates the start-up signal for the freezer operating from 18:00 to 06:00 (Table 1).

Fig. 5. (a) 400 W power Hg–Ar–Hal vapour DRT-400 lamp (not ignited due to the danger of the UV exposure); (b) metal-halogen DRE-400 lamp – ignited.
Table 1. The Lamp operation sequence corresponds to the diurnal changes of the Sun's radiation intensity in W m−2 on the Martian surface at Martian 6 am (06:00 sunrise) to 6 pm (18:00 ‘Sunset’) that mimics disappearance of the Sun beyond the Martian horizon indicating a sharp decrease of the surface temperature, and ‘Sunset’ indicates the start-up signal for the freezer operating from 6 pm (18:00) to 06:00 am. DRT-400 lamps are numbered as 1, 2, 4 and 7 and DRE-400 numbered as 3, 5, 6 and 8, respectively. Each item operates at its max for 2 h from the restart (factory-defined non-stop operation time). Irradiance intensities on the working area for each case (time of the day on Mars) are given approximately

For the dispersive light sources the emissions are within specific spectral ranges. This kind of emission spectrum is formed by the conjunction of the radiated light-beams:
 $${\rm \Phi} _{\rm \Sigma} = {\rm \Phi} _{\rm \lambda} + {\rm \Phi} _{\rm \lambda} + {\rm \Phi} _{\rm \lambda} + \cdots + {\rm \Phi} _{\rm \lambda}, $$
where ФΣ is the total radiation flux of the source with the specific spectrum and Фλ the radiation flux of the discrete lines (Thorington et al. Reference Thorington, Parascandola and Cunningham1971; Jager & Minnaert Reference Jager and Minnaert2013). Therefore each of the certain wavelength ranges can be imitated by the combination of two or more dispersed radiation sources using wave interferences. Two artificial dispersive radiation sources: DRT-400 and DRE-400 are used in our MCSC, combination of which allows us to simulate relative spectral composition of the Solar irradiation as accurately as possible.
Hg–Ar UV – linear quarts lamp DRT-400 and Hg–Ar–Hal vapour UV-LED lamp DRE-400
An electromagnetic (EM) radiation spectrum of the light-bulb DRT-400 and its spectral distribution (Fig. 6(a)) appears to be one of the rare radiation sources with a maximum approximation of Solar EM parameters suitable for the use within MCSC. These Hg–Ar vapour lamps come with a detailed description of the intensity parameters from the manufacturer all between 0.5 and 2500 W with 50 Hz operation frequency. We have given our priority to the 400 W radiation sources for several reasons:
-
1. Minimum intensity emitted by a single 400 W lamp corresponds well to the illumination of Martian Sunrise–Sunset moments at 06:00 and 18:00;
-
2. A smaller size of single equipment allows easier variation of the distances and angle alignments along the main working surface (e.g., 45–90–120° possible alignments, if needed);
-
3. Easier to change, cheaper and safer when handling during actual operation (radiation measurements and other special circumstances).
As we can see, a DRT-400 emits the electromagnetic spectrum quite accurately approximating spectral parameters of Solar EM radiation. A DRT-400 has the radiant flux from 120 to 320 nm of UV and the rest of the incandescent spectra through far infrared with a total illumination intensity of 400 W m−2 (Fig. 6(a)). However, the lamp operates on an argon-filled quartz tube fused with mercury vapour and lacks a radiating area from 460 to 540 nm that would create a significant spectral decline in overall radiation. Such a decline might interrupt the proper performance of the biologically important experiments and therefore, affect the reliability of the obtained results – it is well known that phototrophs are particularly sensitive to the spectral composition and the intensity of the light-source (Kehoe & Grossman Reference Kehoe and Grossman1994; Horneck et al. Reference Horneck, Rettberg, Rabbow, Strauch, Seckmeyer, Facius, Reitz, Strauch and Schott1996; Tarasashvili & Aleksidze Reference Tarasashvili, Aleksidze, Meech, Keane, Mumma, Siefert and Werthimer2007; Stowe et al. Reference Stowe, Brodie-Kommit and Stowe-Evans2011; Jager & Minnaert Reference Jager and Minnaert2013). For this particular reason, an additional radiation source is supplied for the correction of these ‘spectral gaps’ within the EM spectra fluxes from the DRT-400 lamps and is complemented with DRE-400 UV-LED lamps that operate on metallic halogen vapours with a similar intensity and radiant flux from 380 to 700 nm (Fig. 6(b)). Overall spectrum obtained from both lamps (summarized relative spectral distribution (nm) and relative irradiance intensity, from which the spectral irradiance values (W m−2 nm−1) can be obtained, is shown in (Fig. 6(c)). Therefore, we found it convenient to combine these dispersive light sources within the MCSC for maximum accurate simulation of the Solar radiation on the equatorial region of the Martian surface.

Fig. 6. (a) Electromagnetic spectrum of Hg arc UV 50 Hz linear quarts lamp DRT-400; (showing spectral distribution and relative irradiation intensity at each wavelengths). (b) Spectral emission parameters of Hg–Ar–Hal vapour UV-LED lamp DRE-400 that emits EM radiation from 380 to 700 nm due to the presence of halogen vapour within the light-bulb. DRE-400 comes with several intensity variations as well. For the reasons listed above for the DRT-400 lamp, priority has been given to the DRE-400 Watt equipment. (c) Summarized spectral distribution and irradiance from both DRT-400 and DRE-400 lamps – ‘spectral gap’ from 460 to 540 nm is filled and, as it is shown in the graph, the resulting spectrum is very close to the spectral parameters of the Solar radiation at the surface of Mars http://solardat.uoregon.edu/SolarRadiationBasics.html. For the equatorial region – calculated in (Tarasashvili et al. Reference Tarasashvili, Sabashvili, Tsereteli and Aleksidze2013).
Isoenergetic irradiance of the working surface
Our Mars Surface Irradiation Model has provided us with a detailed description and values for the technical simulation of Mars surface irradiation within the MCSC. For example, according to the calculated data form the previous article (Table 2 – listed as ‘Table 1’ in the original source), the maximum possible intensity of Solar irradiation on the Mars surface could vary between E = 62.5 and 65.03 mW cm−2, e.g. 650 W cm−2 (Tarasashvili et al. Reference Tarasashvili, Sabashvili, Tsereteli and Aleksidze2013); namely, this intensity is present within the MCSC during ‘the Martian equatorial afternoon’ (sometimes reaching 700 due to the extended equipment runtime). Namely, for such intensities four of the 400 W incandescent spectrum illumination devices have to be placed 45 cm away from the research area. A calculation of this is based on an obvious equation:
 $$\displaystyle{{400\,{\rm W}} \over {4{\rm \pi} r^2}} = E = 65.03\,{\rm mW}\,{\rm cm}^{-2}, $$
where r-radius may vary in accordance to the geological features, e.g. canyon, crater or mountain.
Table 2. Irradiation of Martian surface in mW cm− 2 during 12 h day at selected orbital points. Here maximum afternoon irradiation is shown E = 65.03 mW cm− 2 or E ~ 650 W m−2.

Although four lamps are enough for the simulation of the afternoon irradiation, it has been found that at this distance (45 cm) samples may be affected with the excess heat coming from the equipment; therefore, average distance of the samples from the lamps has been increased to 1.5 m above the working surface and with regards to the inverse square law, two more lamps have been added for the simulation of the afternoon irradiation (Table 1).
Thus, this afternoon intensity of the irradiation within MCSC is set in accordance with the real illumination conditions on the Martian equator for the same time of day, as are the intensities for the morning and evening hours as well. We have concluded that this simulated irradiation maximum and its daily variations provide intensities, which challenge the appearance of various adaptation mechanisms in biological structures.
Maintaining the appropriate artificial light-sources with sufficient spectral parameters is not enough for the simulation of the experimentally reliable accurate illumination of the working surface. For the artificial radiation sources proper FGS – Flux-Guiding Systems have to be set. One of the main parameters of FGS is the reflectance, which by itself depends on: (1) size and concavity and (2) chemical composition of the beam-reflecting surface. There are various constructions of FGS, but for our purposes parabolic FGS was preferred due to its ability to reflect and redirect the emission beams from any point of the radiation source with evenly distributed radiation intensity directed towards the working surface. As we use at least two disperse radiation sources, each of the lamps is turned at 45 angular degrees from 0.4 (during the simulation of the Solar activity at the maximum) to 1.5 m above the 1.5 × 1.5 m2 experimental area, where most of the samples are placed (Fig. 7).

Fig. 7. Distribution of the lamps above the MCSC working surface (where the majority of the samples are placed). Lamps are within background parabolic reflector shells to ensure direct illumination of the experimental surface area; to ensure the positive wavelength interference between linear radiation sources (DRT-400 and DRE-400) lamps 3, 1. 8 and 7 are turned at 45 angular degrees towards the working area. If needed, 45–90–120° alignments can be achieved for each lamp.
Dependence of the reflection coefficient on different metal coatings
The reflective characteristics of the different materials depend first of all on their chemical composition and the wavelengths of the reflected light. Figure 8 shows the inter-dependence of the reflected light coefficient and the chemical composition of the reflecting material within 100–1200 nm spectral range.

Fig. 8. Distribution of the lamps above the MCSC working surface (where the majority of the samples are placed). Lamps are within background parabolic reflector shells to ensure direct illumination of the experimental surface area; to ensure the positive wavelength interferences between linear radiation sources (DRT-400 and DRE-400) lamps 3, 1. 8 and 7 are turned at 45 angular degrees towards the working area. If needed, 45–90–120° alignments can be achieved for each lamp.
The results demonstrate that the aluminium has very high-quality reflectance characteristics, while the reflecting capabilities are much lower for all the other frequently used coating materials including silver and chromium. Apart from its reflectance aluminium has perfect thermal-conduction capabilities that play a crucial role for the heat sink off the working surfaces and therefore makes it the most appropriate material for the construction of the illuminating and reflecting equipment (http://anomet.com/aluminum/; http://muri.lci.kent.edu/References/NIM_Papers/Permittivity/1983_Ordal_optical.pdf).
Results and discussions
Changes in intensities within the MCSC during Martian day – imitation of the Martian diurnal cycle
Each of the lamps reaches its maximum irradiance intensity between 300 and 600 s past the actual ignition start-up (Fig. 9). Apart from this, conjunction of both types of the lamps simulates very accurate spectral composition and the intensity of the Solar radiation at Mars equatorial regions on the MCSC working surface. The graph depicted in Fig. 10 shows the increase in the intensity of single DRT-400 and DRE-400 lamps during and after about 600 s after the ignition start-up.

Fig. 9. Illuminated working surface within the MCSC showing initial (a) and amplified (b) radiation intensities of all DRT-400 and DRE-400 lamps reaching maximum irradiance intensity in about 600 s past the actual ignition start-up (IVC video-camera).

Fig. 10. Increase of the intensity of the single DRT-400 and DRE-400 lamps during and 600 s after the ignition start-up.
Illumination analogue for Mars has to be 43% of the Solar on Earth. From our previous calculations, the Martian equatorial surface receives approximately 65.03 mW cm− 2 of total irradiance that is 650 W m−2. (Here we should mention that the maximum irradiation detected during the Solar maximum scenario is 950 W m−2, which we do not consider to be of a permanent nature, however it is possible to simulate); therefore, the maximum irradiance obtained from the combinations of the DRT-400 and DRE-400 lamps within the MCSC increases from 650 W m−2 to about 690 W m−2 for 1 h during 1100–1300 ‘Martian time’. Figure 11 shows the distribution of the intensities on the working area during various hours of the simulated ‘Martian’ daytime.

Fig. 11. Distribution of the E – irradiation intensities W m−2 on the 1.5 × 1.5 m2 working area of the MCSC during different hours of the ‘Martian day’. Intensities have been measured with Buildmet Technologies Solar Power Meter – DC Watt–metre. Illumination parameters in lux m−2 are shown in Table 1. For the accurate measurements working area has been divided into 100 cm2 squares.
Principal ignition scheme
The ignition cycle of the illuminating equipment (four DRT-400 and four DRE-400 lamps, respectively) and the operation of the freezer and tomb are programmed and coordinated by the computer and the adjusted electric scheme. The sequenced operation of both devices provides proper remote control of the environmental parameters analogue to 24 h 39 min circadian cycle of the planet Mars. The principal scheme for the operation of the electrical systems within the MCSC is shown in Fig. 12. All schematics are adapted to the operation with the 220 v/65 Hz electricity supply.

Fig. 12. Principal scheme for the operation of the electrical systems within the MCSC: illuminating equipment – four DRT-400 and four DRE-400 lamps, tomb and refrigerator. 1. Lamp electrodes; 2. Circuit of the solenoid; 3. Lamp; 4. Switch button; ‘a’ and ‘b’ – holders; C1 – capacitor; R – resistor.
For the initialization of the operation, an electricity charge is forced at ‘a’ and ‘b’ holders and applied anodic voltage of 220 V is forced on the electrodes of the lamp Fig. 12(1). In case this voltage is not enough for the ignition of the lamp, a switch button Fig. 12(4) can be manually activated. In both cases the series circuit of the solenoid Fig. 12(2) closes and the capacitor C1 matches current resonance. As a result of this, anodic voltage increases several times and may reach 800 V, which is enough for the ignition of the lamp. After the ignition of the lamp, the switch button contributes the disconnection of the resonance circuit and the lamp moves to its normal operation regime. The recommended duration for the optimal performance of each of the DRE-400 and DRT-400 lamps is determined by the manufacturers’ instructions; therefore, every lamp is switched off after 2 h and is substituted with others in accordance with the programming (Table 1).
Electric scheme and programming of the supporting computer
Martian diurnal circadian rhythms are remotely set by the electric scheme and the supporting computer. Operation includes two independent electric schemes, one of which (Fig. 13) automatically switches on and off the resonance circuit. The duration of the ignition is 10 s and includes four turnover cycles for reliability. There are eight lamps within the IVC; therefore, the scheme contains eight independent channels. All channels are identical to each other: the first channel receives a high-voltage signal from the operating computer and as a result of this a high-rank voltage impulse is formed on the DD 1.2 micro-scheme outlet with a duration of 12–15 s; this opens micro-scheme DD 5.1 and counter DD 1.1 enters an initial action state.

Fig. 13. Diurnal Cycle System operation scheme – DCS: N1: DD; KD and K – electric micro-schemes; COM – to the computer; NO – normally open circuit; NC – normally closed circuit.
Counter generator, which sends the signal to the counter clock DD 11 is set on DD 10.1 and DD 10.2 microchips. From here, 0.4 Hz impulses are fed through the DD 5.1 and DD 8.1 microchips to the transistor which acts on the relay, consistently switching its power on and off four times over; the lamp ignites and the operation of the counter clock is aborted. In 3–5 s microchip DD 5.1 receives low-rank signals from the DD 1.2 outlet and prevents the reconnection of the relay contacts. An operation principle of all other seven channels is in the analogue to the one described above.
Counter clock and computer programming of the timing
The counter clock (Fig. 14) consists of a master oscillator with <1 Hz frequency divider, display counter of the hours and minutes, control unit of the indicators and power supply unit. The counter clock could be preliminarily set for any desirable time moment variations. For the maintenance of the 24 h conversion factor, the system is equipped with an auto-reset unit that develops reset pulses as soon as the display clock reaches 24 h 00 min (displayed as 00:00). Toggles are provided for the continuous change and set of the given time moments. Upon receipt of the clock impulses, a level of the Boolean ‘1’ alternately emerges at other counter outputs. As the display clock reaches 17:50 the freezer turns on and operates until 06:00 of the Martian morning. Occasionally, a CO2 balloon and vacuum pump are operated manually for the adjustment of the CO2 at 990 000 ppm value at the 4826 Pa pressure level.

Fig. 14. Principal electric scheme maintaining simultaneous combined operation of the Diurnal Cycle System DSC operation scheme (Fig. 13); counter clock and refrigerator.
Nine blocks of the transistor switches are connected to the counter outputs through the diode array. During hour display the transistor switches alternately open and maintain the sequenced operation of various circuits, in accordance with the clearly defined program. Transistor switches wind of the relay coil as level of the Boolean ‘0’ is assured. And once again, as the level of the Boolean ‘1’ is supplied, the relay fires and shunts the triac, which results in the ignition of the appropriate lamp on each of the channels.
Night-time temperature and humidity changes
The results obtained from our model are used for the precise imitation of variations of the Martian surface temperature within the MCSC, programming of the supporting computer and electric scheme provide proper remote control of the environmental parameters analogue to 24 h 39 m circadian cycle on the planet. In accordance with the discussions above, regarding the thinness of the Martian atmosphere, the temperature is considered to be the function of the irradiance as determined by Planck's law (for the Sun at 6000 K) and is not imitated by separate equipment other than lamps emitting incandescent spectra within the MCSC chamber – ‘Artificial Mars’. However in the MCSC, the actual imitation of the thin Martian atmosphere is technically difficult, and the temperatures recorded are slightly different from those expected from calculations (Fig. 15). Assuming the Martian atmosphere is much thinner than imitated in the MCSC, the radiation/temperature relations are expected to be even more precise and accurate. Low-temperature environment is maintained by the refrigerator and dry CO2 ice cubes, placed regularly between the samples on the working surface.

Fig. 15. Shows diurnal changes of the irradiance intensities W m−2 (watts per square meter) and temperature in accordance with the operating lamps within the Mars Chamber during ‘Martian Day’ as is on the equator; the first lamps are reach maximum luminosity at 6.30 am (Tarasashvili et al. Reference Tarasashvili, Sabashvili, Tsereteli and Aleksidze2013). Excess and/or lack of the radiation intensity are regulated by the adjustment of the distance of the lamps from the experimental surface. Max Watts reported on Martian surface – 790 W m−2 during Solar-maximum scenario (http://ccar.colorado.edu/asen5050/projects/projects_2001/benoit/solar_irradiance_on_mars.htm) and average 650 W m−2 in accordance to Table 2 at everyday scenario. Standard error percentage value varies within 5% for both parameters.
For more accurate biological experiments, samples preliminarily selected within MCSC are placed within separate true vacuum chamber, CO2 chamber (no lights) and/or refrigerators maintaining much lower temperatures from −80 to −180°C.
According to the literature (http://www.space.com/29857-mars-humidity-alien-life.html; http://www.universetoday.com/14872/air-on-mars/) the humidity of the Martian atmosphere varies from 10 to 100% and is significantly tied to the temperature and radiation changes. In order to maintain long-term low-humidity conditions within the MCSC, a large amount of the silica gel is placed along the walls of the IVC of the MCSC; silica gel is widely used in the transportation and preservation of the electric gauges due to its humidity-absorption capabilities; at the same time it does not interfere with the chemical composition of the atmosphere and selectively absorbs a large amount of the water vapour (Aristov et al. Reference Aristov, Tokarev, Restuccia and Cacciola1996; Gordeeva et al. Reference Gordeeva, Tokarev, Parmon and Aristov1998). It has to be mentioned that due to its placement, humidity is largely absorbed from the walls while condensing during the night and thus does not prevent accumulation of the water on biological samples as it has to be on Mars.
Figure 16 shows the average diurnal humidity changes inside the IVC of the MCSC. Humidity changes have been recorded using KLIMA GUARD Digital Thermo-Hygrometer by TFA-Germany. Humidity changes vary from the lowest 0% to the highest 100% within the simulated Martian atmosphere.

Fig. 16. The average diurnal temperature–humidity changes inside the IVC of the MCSC measured using KLIMA GUARD Digital Thermo-Hygrometer by TFA-Germany. Humidity is at maximum (95–100%) from 2.00 to 5.00 am (night-time) presumably due to low-temperature condensation and the decreased absorption capability of the frozen (stiff) silica gel; however, drops sharply from 6.00 to 8.00 am due to the ignition of the first lamp and remains at minimum (9–0%) from 11.00 am to 5 pm due to the high temperatures and active absorption by the silica gel (see Fig. 17). Content of the water vapour within simulated atmosphere increases sharply (from 0 to 85%) from 6.00 pm due to the ‘sunset’ – last operating lamp is turned off and the refrigerator starts new working cycle. The thermo-hygrometer was placed within the IVC from the beginning of the MCSC operation and data shows the average from the 5 years recordings. Standard error deviation is 5%.
Chemical composition of the atmosphere in MCSC
Atmospheric composition is regulated using a block of dry ice, CO2 balloon and dry-type vacuum tomb. Experimental material and a large amount of the CO2 ice are placed within the Vacuum Glass Chamber and sealed; the ignition of the illuminating equipment initiates the evaporation of the dry ice; at the same time CO2 gas is supplied from the balloon and the vacuum-tomb starts.
Elimination of the oxygen is considered to be satisfactory when the inner video-camera shows the change in the colour of the chemical indicator – methylene blue solution placed by the samples of the actual working surface. At this time pressure at the barometer indicates decrease down to 30 000–40 000 Pa. Water vapour produced together with the vaporization of the CO2 ice causes a fog that is soon reduced by the absorption by the silica gel (as mentioned above) (Fig. 17). Therefore, the atmospheric composition is from 90% CO2 (downwards at the samples) to 85% (approximately 2 m above the samples).

Fig. 17. ‘Foggy ‘Martian’ morning – soon the water vapour will be eliminated by the large amount of the silica gel and radiation of the lamps (e.g., condenses at night).
Influence of the chemical glassware and other preservation materials on light-gas penetration and selection of the equipment and covering materials
It is well documented in photobiology that the light-source's spectral composition and intensity has a great influence on biological material (Falkowski & LaRoche Reference Falkowski and LaRoche1991; Vincent et al. Reference Vincent, Downes, Castenholz and Howard-Williams1993; Drollet et al. Reference Drollet, Teai, Faucon and Martin1997; Häder & Figueroa Reference Häder and Figueroa1997; Ehling-Schulz & Scherer Reference Ehling-Schulz and Scherer1999; http://www.nrcresearchpress.com/doi/abs/10.1139/a93-001#.Vu2RC9J97wc); while within MCSC, characteristics of the experimental and preservation containers and the test-tubes for the biological material can play a crucial role in the acquisition of the circadian rhythms, complementary chromatic adaptation (CCA) and many other physiological processes (Kehoe & Grossman Reference Kehoe and Grossman1994; Tarasashvili & Aleksidze Reference Tarasashvili, Aleksidze, Meech, Keane, Mumma, Siefert and Werthimer2007; Stowe et al. Reference Stowe, Brodie-Kommit and Stowe-Evans2011; Tarasashvili et al. Reference Tarasashvili, Sabashvili, Tsereteli and Aleksidze2013); as we can see from Fig. 18 absorption spectra of all preservation glassware allows the penetration of the spectra and intensity of the MCSC illumination almost uninterrupted, especially that of highly mutagenic UV wavelengths.

Fig. 18. Transmission spectra of the (a) transparent film covering samples on the Petri dish; (b) quartz glassware used for the storage of the samples for microbiology experiments; (c) uncoated UV fused silica bottles; and (d) the 1 mm soda-lime glass for the long-term preservation of the initial materials for the future experiments. Here transmission capability of the glassware decreases slightly, so the 50% transmission in the UVB range allows the penetration of some the spectra and intensity of the MCSC illumination, including highly mutagenic UV wavelengths. This is close to the extreme conditions of the Earth's environments where these samples have been initially obtained. With the same applications, we could say that conditions within these vessels would be approximately the same as at few millimetres deep under the Martian regolith or in the shade.
The transparent microbiological film (Fig. 8(a)) is used to cover the Petri dishes where direct surface exposure to the irradiation is important though this 0.01 mm film allows complete penetration of all the wavelengths. For different purposes, the rate of the gas exchange between the sample and inner MCSC environment is important, especially in case of autotrophic metabolism, since within a sealed jar CO2-rich atmosphere can be changed with an O2-rich environment in a matter of seconds. However, transparent microbiological film demonstrates intense gas-exchange capabilities, whereby glassware is ‘sealed’ using nylon mesh (cotton mesh has shown undesirable characteristics of decreasing gas-exchange capabilities, rapidly absorbing the water vapour and contaminating).
Uncoated UV-fused silica bottles (Fig. 8(b)) are ideal for the long-term preservation of the obtained material: 0.5 mm-thick walls are fully transparent to the simulated Martian irradiation and are steadily affected by the sharp temperature changes. Materials in these vessels are covered with the nylon mesh to allow uninterrupted gas-exchange. A 1 mm-thick quartz glassware (Fig. 8(c)) is used mainly for the preservation of the samples for which the frequent spectroscopic measurements are important, e.g. the rate of the microbial growth or the metabolite accumulation. The disadvantage of the use of these materials is that they are very fragile and expensive; however, respond well to the rapid changes of the radiation, pressure, humidity and temperature within MCSC.
As shown in Fig. 8(d), 1 mm-thick soda-lime glassware allows the penetration only of the 50% of the initial wavelengths generated within MCSC. These vessels are used for the preservation of the initial samples only, obtained from the Earth's extreme environments, which we consider to be the future experimental material. This keeps extreme conditions and at the same time gently triggers the adaptation processes to the more extreme MCSC environments. Every selected experimental material is transferred then to the vessels covered with the transparent film or made by quartz or UV-fused silica. Obtained samples permanently remain in those vessels (quartz or UV-fused silica) under MCSC conditions.
Pressure maintenance and ozone problem
As mentioned above, the IVC – inner vacuum chamber of the MCSC is made of 8 mm-thick glass (Fig. 3) where the sharp changes of the temperature (−80 to +30°C) can be simulated. However, due to the fragility of the glass this adds limitations to the scale of the low pressure that can be safely maintained within the MSCS and therefore it is never decreased below 4826 Pa, which is far from the conditions simulating Mars surface pressure. If the effect of the low pressure is to be checked the problem can be solved by placing biological samples within a small vacuum-chamber maintaining an appropriate pressure and CO2 atmosphere; besides the fact that connecting surfaces are sealed with strong silicate glue, this helps us to minimize the leakage of the gases down to a manageable rate.
Although the environment within the MCSC usually has 895 000–900 000 ppm CO2 environment, there is evidence that the amount of the ozone is increasing within the chamber during its operation. As shown by the calculations, the initial amount of the ozone is approximately between 5000 and 55 000 ppm (measured with a Dobsonian spectrometer) and is most likely the product of the CO2 photolysis (Warneck Reference Warneck1964) (http://cires1.colorado.edu/jimenez/AtmChem/CHEM-5151_S05_L7.pdf). However, the amount of the ozone does not significantly decrease during the ‘Martian night’ and therefore seems obvious that the production of the distinct oxygen emissions by the photo-chemo synthesizing autotrophic organisms is not largely contributing to the ‘ozone problem’. At the same time, there is a strong scientific evidence that the Martian atmosphere has ozone (http://www.universetoday.com/56753/ozone-on-mars-two-windows-better-than-one/; http://sci.esa.int/mars-express/52881-a-seasonal-ozone-layer-over-the-martian-south-pole/), and this may form a UV protective layer above the samples or the near-surface area on Mars and thus may contribute to the survival of the much more sensitive microorganisms. Ozone problem is the subject of the detailed investigation as this may prove the possibility of the existence of life on Mars, thus adding reliability to the experimental results obtained within MCSC.
MCSC performance limitations
Mars gravity versus Earth gravity
Influence of the gravity on biological processes in animals is well known from the numerous research and experiments performed on the ISS – International Space Station (Grindeland et al. Reference Grindeland, Popova, Vasques and Arnaud1990; Fritsch-Yelle et al. Reference Fritsch-Yelle, Charles, Jones and Wood1996) (https://www.researchgate.net/profile/Susan_Crawford-Young/publication/7298502_Effects_of_microgravity_on_cell_cytoskeleton_and_embryogenesis/links/0deec51abb48e8dea6000000.pdf). There is strong evidence, however, that gravity also has mutagenic effects on the microorganisms (http://www.sciencedirect.com/science/article/pii/0168165696013843; Klaus Reference Klaus and Britton2002) and has small influence on plants (Moor Reference Moor1990; http://www.sciencedirect.com/science/article/pii/S007476960861620). Interestingly, a number of studies have shown that low-gravity environment contributes greatly to the repair of the RNA and/or DNA strands damaged by the space radiation (http://link.springer.com/article/10.1007/BF02870950#/; Horneck et al. Reference Horneck, Rettberg, Kozubek, Baumstark-Khan, Rink, Schäfer and Schmitz1997; Nickerson et al. Reference Nickerson, Ott, Wilson, Ramamurthy and Pierson2004).
MCSC does not simulate low Martian gravity; however, its relatively large size allows the usage of the equipments (e.g., clinostate) for the low-gravity simulations, especially for the investigation of the possible crop-production on Mars (Stutte et al. Reference Stutte, Monje, Hatfield, Paul, Ferl and Simone2004).
UV-protective ozone layer and EM-field versus Mars
On Earth, living organisms are well protected from harmful Solar radiation and the ozone layer of the planet. However on Mars, organisms would thrive under violent radiation; for this reason, during experiments biological samples are placed only from 0.4 (Solar maximum simulation) to 1.5 m distances from the light sources within the MCSC chamber simulating Martian surface conditions. At these distances the EM-field of the Earth cannot possibly have any protective effect on the samples, as it does on the planetary scale, and therefore the influence of the above-mentioned factors are negligible. Therefore, we may state that samples are exposed to the well-simulated environmental conditions present on Mars.
Acknowledgements
We would like to thank Shota Rustaveli National Science Foundation (www.rustaveli.org.ge) for their continuing support to the project; we are grateful to the Department of Optics and Cybernetics at Georgian Technical University for providing the modern tools for the measurement of the Radiation and Electromagnetic Sources; we would like to express the gratitude to the N. Tsereteli International School for providing us with the tools for the atmospheric measurements and the Department of Geology and Minerals at the Iv. Javakhishvili Tbilisi State University for their valuable materials and expert advice; we thank anonymous reviewer for making this manuscript considerably better.


