Introduction
It has been suggested that various environmental settings simultaneously contributed to the chemical building blocks from which life originated (Stüeken et al. Reference Stüeken, Anderson, Bowman, Brazelton, Colangelo-Lillis, Goldman, Som and Baross2013). Most probably among these microenvironments were different types of water bodies on volcanic islands, such as rock pools supplied with seawater in the rhythm of the tides (tide pools) and rock pools above the splash zone which contained freshwater. Organic reactions in rock pools may have substantially contributed to chemical evolution on the early Earth. However, direct chemical information from the time before life began is scarce and mainly restricted to a few very old rocks and minerals and to pristine organic material in meteorites and comets. Prebiotic chemical research, therefore, strongly relies on theoretical and experimental simulations. An example is laboratory studies on the repeated wetting and drying of potentially prebiotic reaction mixtures.
Wet‒dry cycles are regarded as characteristic of the fluctuating environment in primordial rock pools at volcanic sites (Lathe Reference Lathe2004; Deamer Reference Deamer, Losos, Baum, Futuyma, Hoekstra, Lenski, Moore, Peichel, Schluter and Whitlock2014; see Fig. 1 for a modern counterpart of these rock pools). Several prebiotic simulation experiments have therefore used alternating wetting and drying, mostly to facilitate oligomer formation (see for example: Lahav et al. Reference Lahav, White and Chang1978; Lahav & White Reference Lahav and White1980; Saetia et al. Reference Saetia, Liedl, Eder and Rode1993; Olasagasti et al. Reference Olasagasti, Kim, Pourmand and Deamer2011; DeGuzman et al. Reference DeGuzman, Vercoutere, Shenasa and Deamer2014; Mamajanov et al. Reference Mamajanov, MacDonald, Ying, Duncanson, Dowdy, Walker, Engelhart, Fernández, Grover, Hud and Schork2014; Forsythe et al. Reference Forsythe, Yu, Mamajanov, Grover, Krishnamurthy, Fernández and Hud2015).
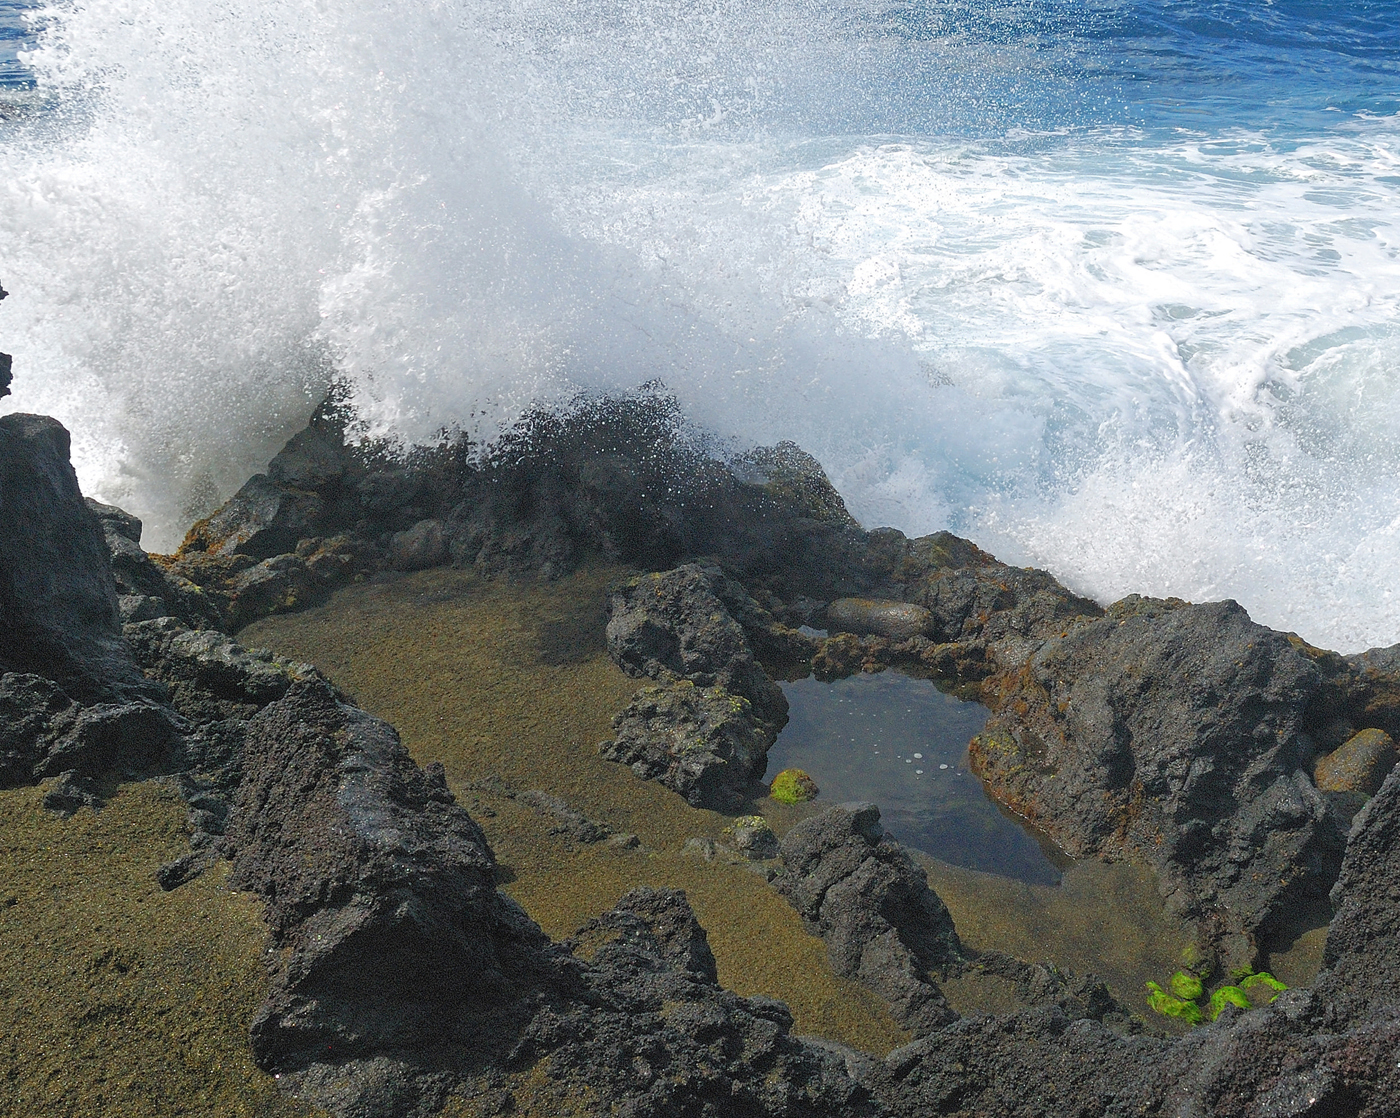
Fig. 1. Rock pool with olivine-dominated sand surrounded by igneous rock. This photo was taken at 21° 17′ 34.1″ S 55° 48′ 20.7″ E on the volcanic island of La Réunion, Indian Ocean, in August 2011.
Wetting‒drying depends on the presence of sufficiently high temperatures and, of course, subaerial environments. Throughout the Late Hadean–Early Archean, Earth's rate of heat production was much higher than today (Franck Reference Franck1998; Martin et al. Reference Martin, Claeys, Gargaud, Pinti and Selsis2006). As a consequence, volcanic activity was strong. At that time, most of the crust was flooded (Arndt & Nisbet Reference Arndt and Nisbet2012). However, subaerial volcanoes very probably existed, either as island arcs, if plate tectonics already operated (Turner et al. Reference Turner, Rushmer, Reagan and Moyen2014), or as islands formed by hot mantle upwelling (Van Kranendonk Reference Van Kranendonk2011), or both. Magma chambers provided the surface of the volcanic islands with thermal energy, for example by lava flows, which episodically heated the surface. If thick enough, the resulting lava fields remained warm for longer periods of time. Areas of elevated temperatures also occurred where hot hydrothermal water raised to the surface. Tide pools on the volcanic islands were regularly filled with seawater, while rock pools more distant from the coast were sporadically filled with rainwater. On the warm ground, the water must have evaporated quite rapidly from the rock pools, at least from the shallow ones.
All this took place under a virtually anoxic atmosphere with an O2 partial pressure at a ground level that did not exceed 10‒5 times the present-day value and could have been much lower (Kump Reference Kump2008; Haqq-Misra et al. Reference Haqq-Misra, Kasting and Lee2011).
Several factors can or must be considered when conducting experimental simulations of wetting‒drying processes in primordial rock pools. For this reason, we have designed an apparatus that allows the adjustment of key parameters and conditions such as the duration of the wet–dry cycles, temperature, pH value, a strictly oxygen-free atmosphere and the inorganic content material of a rock pool. The apparatus, its operating principle and some test applications will be described in the following.
Materials and methods
Description of the wet‒dry apparatus (WDA)
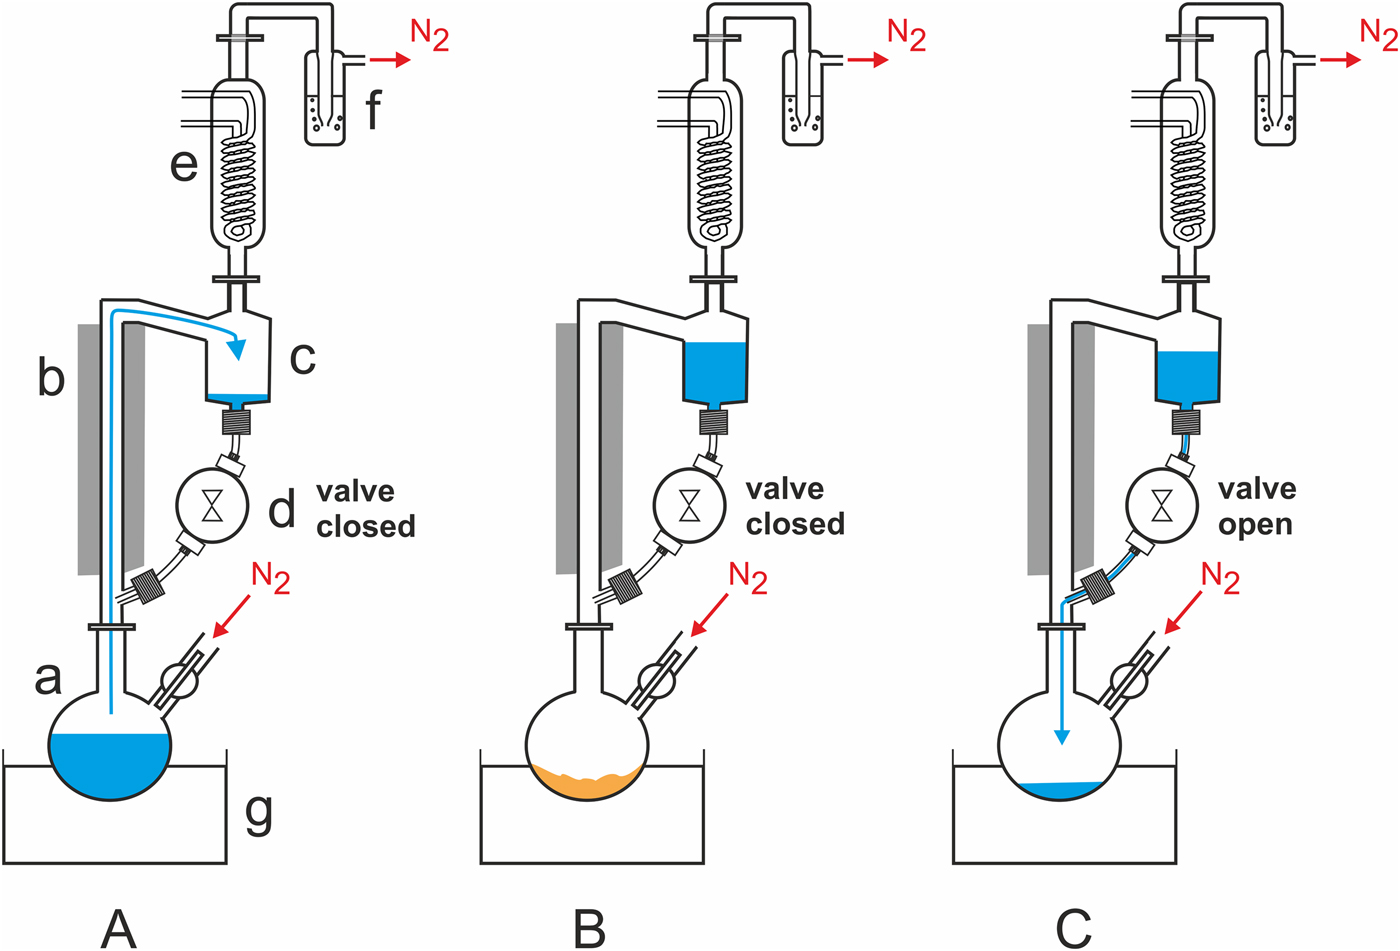
Experimental setup: A Schlenk flask (‘a’ in Fig. 2(A)) is attached to a heat-insulated glass riser (b), whose upper part is linked to a 50-ml reservoir (c). The reservoir is connected to the lower part of the riser via a time controlled magnetic polytetrafluoroethylene (PTFE) valve (d; Staiger, Erligheim, Germany). Perfluoroalkoxy alkane (PFA) tubings and poly(p-phenylene sulfide)/polytetrafluoroethylene (PPS/PTFE) screw joints are used to connect the valve with the glass parts. A reflux condenser (e) is mounted on top of the reservoir. Its outlet is connected to a safety bubbler (f). An oil bath (g) is used to heat the flask. The whole WDA can be purged with nitrogen or another gas or gas mixture before and during the experiment. For a technical drawing and dimensions of the WDA, see supplemental online material (SOM)-Fig. S1.
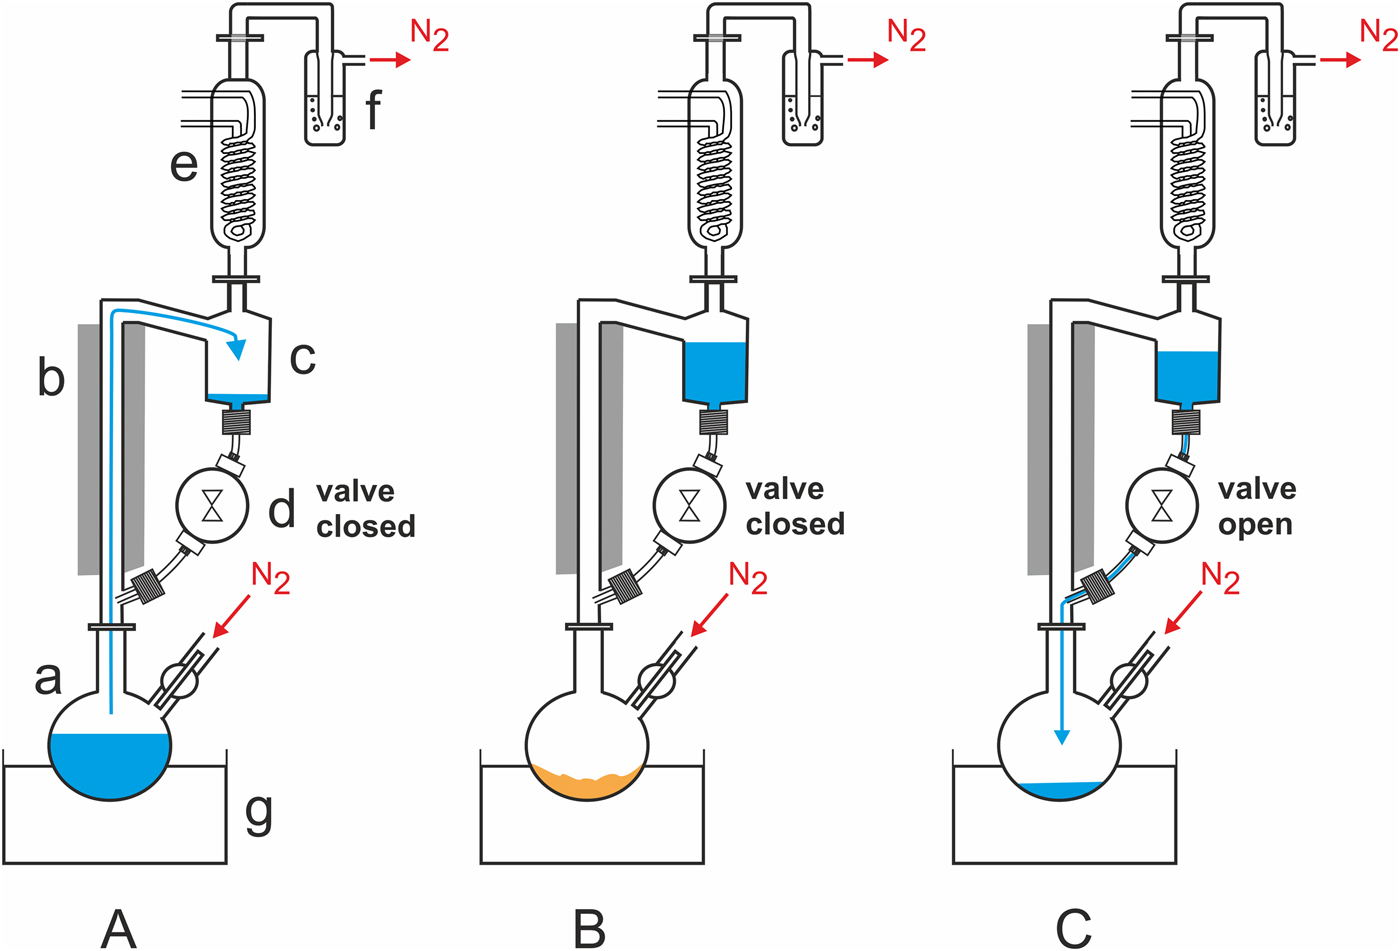
Fig. 2. Schematic representation of the components and operating principle of the automated WDA. See the section Materials and methods and SOM for a detailed description.
Operating principle: (i) while the magnetic valve is closed, the Schlenk flask is heated and the water inside slowly evaporates. Assisted by the gas stream, the water vapour rises into the reflux condenser. There it condenses and the liquid water accumulates in the reservoir (Fig. 2(A)). (ii) After the water has completely evaporated, the residue is dry heated (Fig. 2(B)). (iii) After a pre-set time, the magnetic valve opens briefly to allow the water to flow back into the hot flask (Fig. 2(C)). When the valve has closed, the next wet–dry cycle starts.
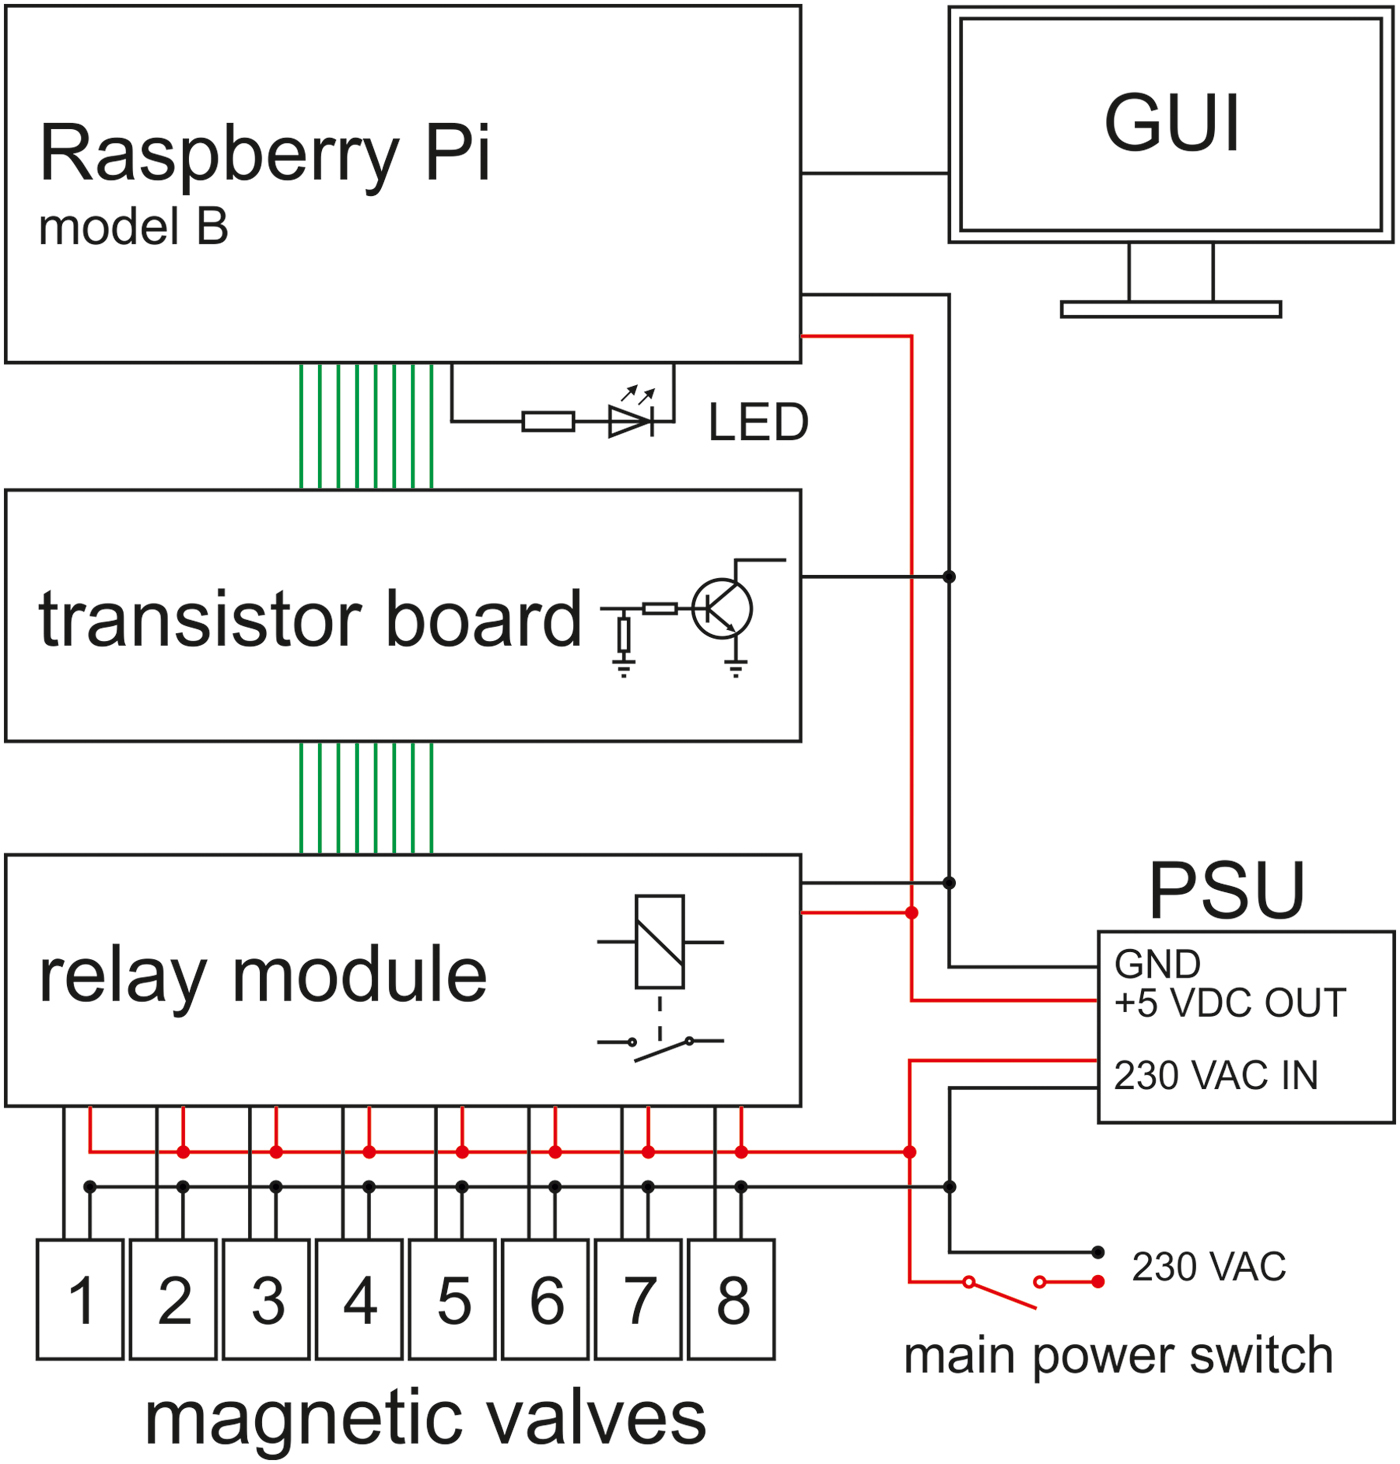
In our laboratory, up to eight WDAs can be simultaneously operated and jointly controlled. Figure 3 shows an array of four WDAs. Each magnetic valve is controlled by an interactive bourne-again shell script (bash script). The operating system is Linux (Raspbian Jessie with PIXEL, version: September 2016, release date: 23 September 2016, kernel version: 4.4), which is installed on a Raspberry Pi model B (RPi). After starting the script, the following can be entered via the front-end (see SOM-Fig. S2): (i) name of the experiment, (ii) desired number of cycles, (iii) cycle duration and (iv) additional information about the experiment. The additional information, the experimental parameters and the current date are saved in a log file under the name of the experiment as entered. Figure 4 shows the circuit diagram of the WDA controller. The transistor board is necessary because the signal output voltage of the GPIO ports of the RPi is 3.3 VDC, whereas the relay module requires a signal input voltage of 5 VDC. The LED indicates a successful activation of the GPIO ports after the operating system has been started. For further details, see SOM text.
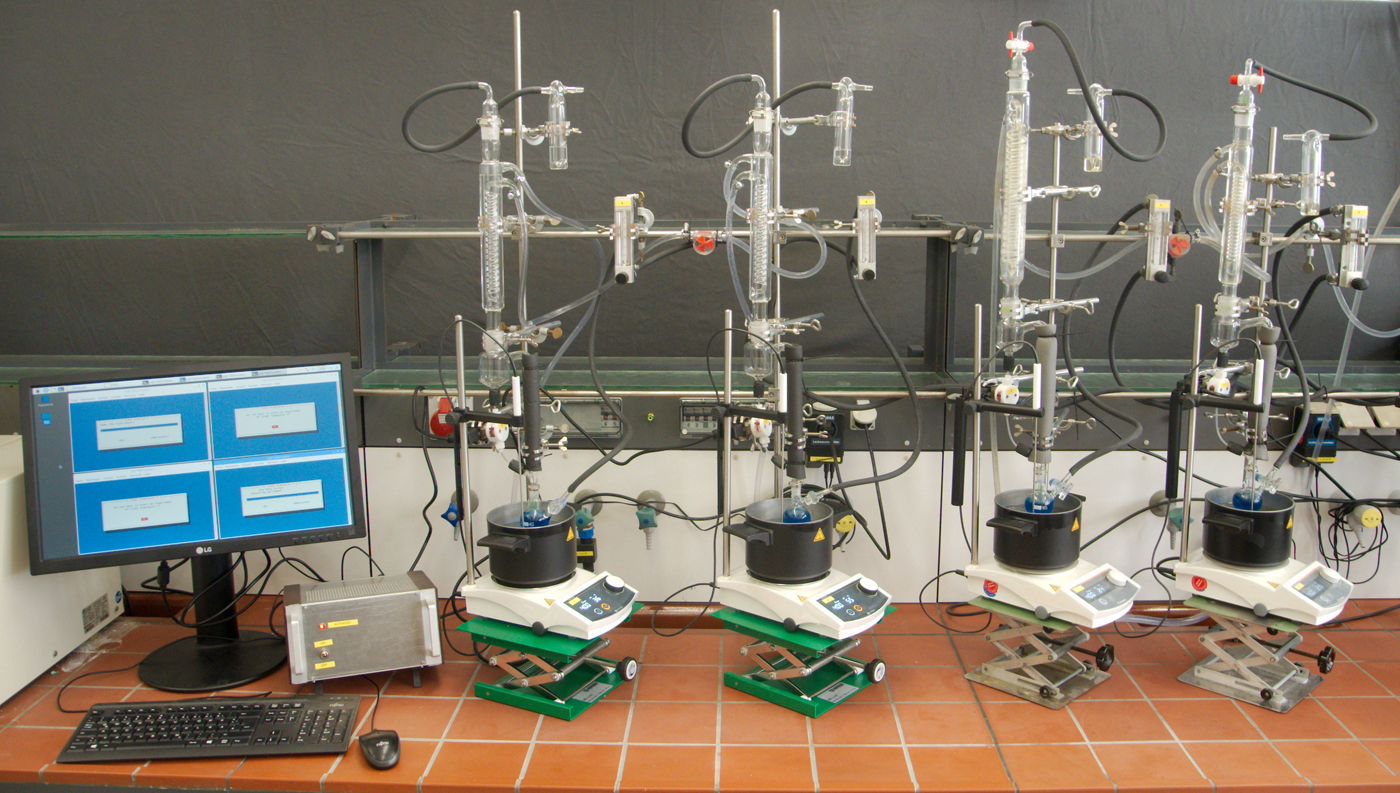
Fig. 3. Four simultaneously operated and jointly controlled WDAs. The control electronics can be seen on the left.
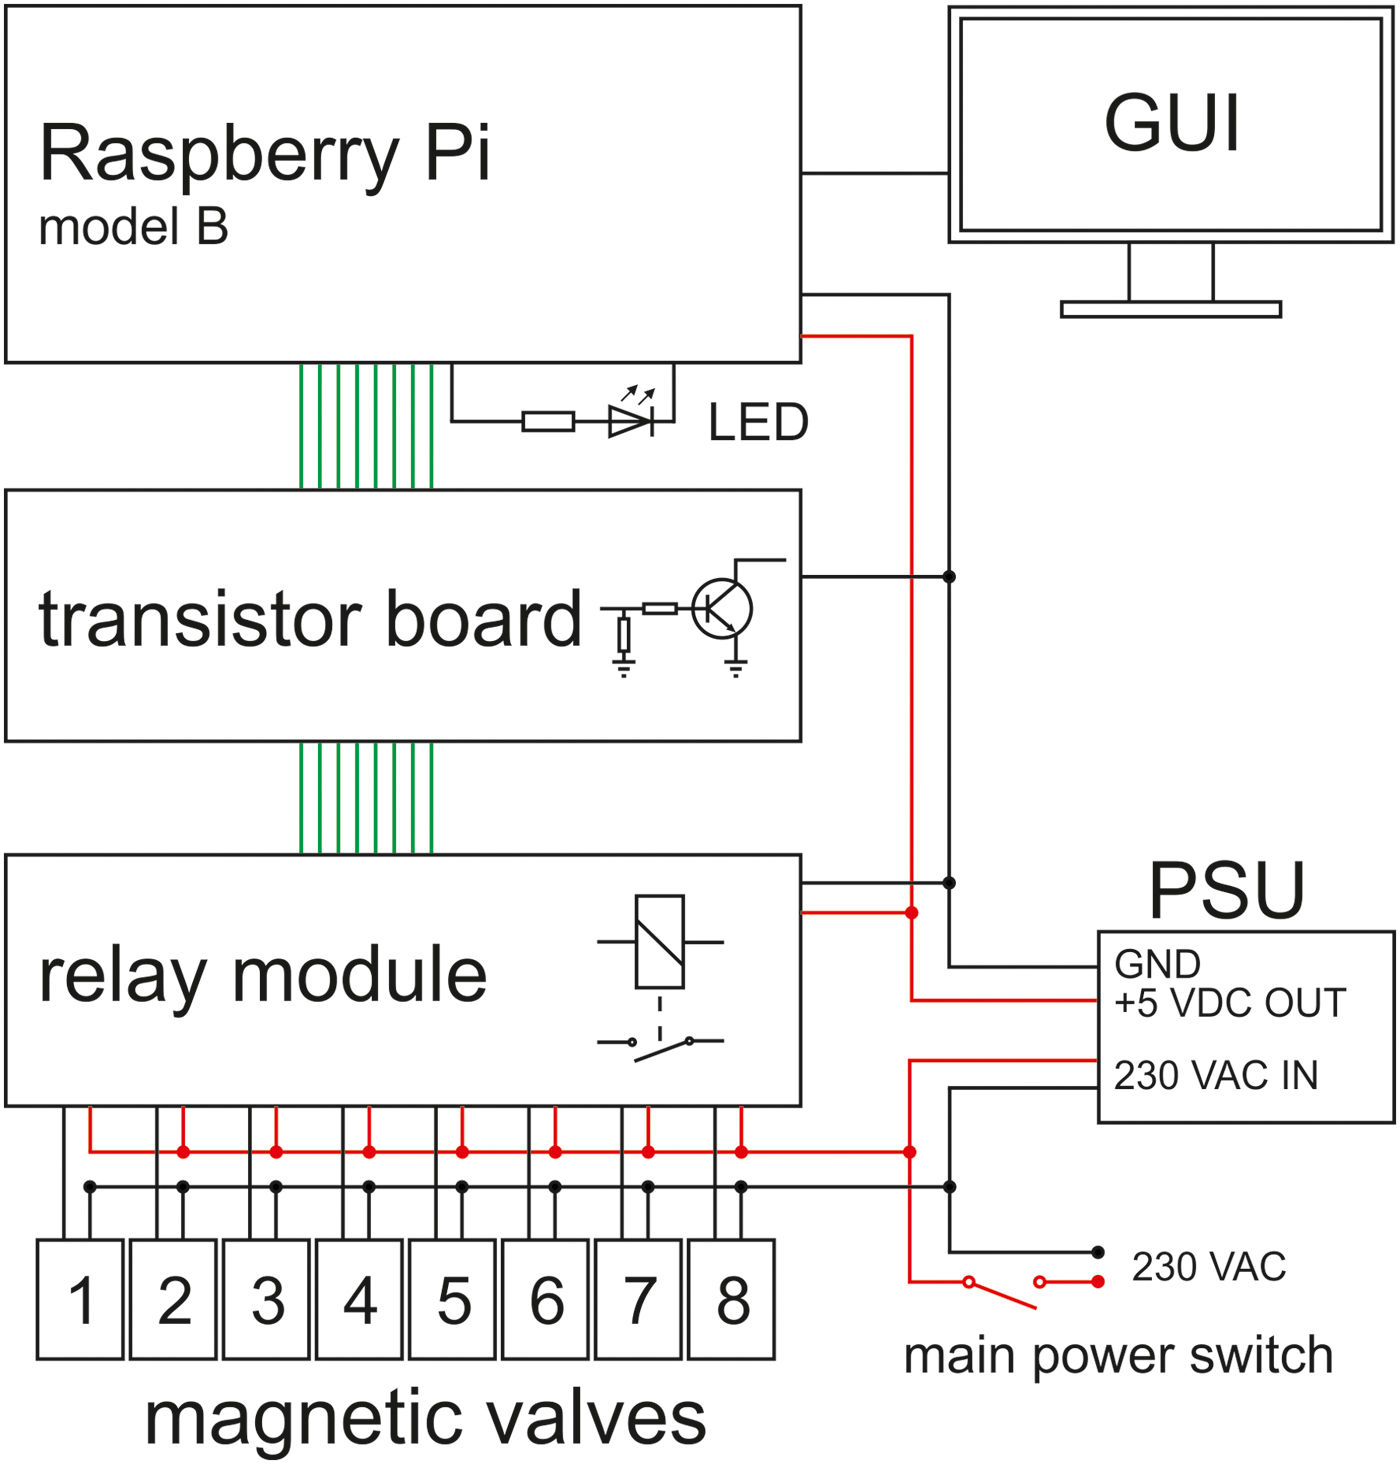
Fig. 4. Schematic circuit diagram of the WDA controller. The power supply unit (PSU) supplies the hardware (Raspberry Pi and relay module) with 5 VDC. The green lines represent the signal lines controlling the magnetic valves (1–8). GUI, graphical user interface.
Chemicals and minerals
Glycine (Acros, >99%), 2,5-diketopiperazine (Fluka, 98%), diglycine (Fluka, 99%), triglycine, tetraglycine, pentaglycine and hexaglycine (Sigma-Aldrich), hexanoic acid (Sigma-Aldrich, ≥99.5%), heptanoic acid (Sigma-Aldrich, ≥99%), octanoic acid (Sigma-Aldrich, ≥98%), linoleic acid [(9Z,12Z)-9,12-octadecadienoic acid; Alfa Aesar, 95%], mixture of cis- and trans-9,11- and -10,12-octadecadienoic acid methyl esters (Sigma-Aldrich), pyrogallol (benzene-1,2,3-triol; Acros, 99%), 1-fluoro-2,4-dinitrobenzene (Sanger's reagent; Fluka, >99%), N-(tert-butyldimethylsilyl)-N-methyltrifluoroacetamide (Acros, 98%), triethylamine (Fluka, ≥99.5%), trifluoroacetic anhydride (Sigma-Aldrich, ≥99%) and 0.25 mol l–1 trimethylsulfonium hydroxide solution in methanol (Acros) were used as received. The following analytical standards were obtained from Sigma-Aldrich: hexanal, (2E)-2-heptenal, (2E)-2-octenal, (2E,4E)-2,4-decadienal, nonanedioic acid and 2-pentylfuran. Hydrochloric acid and the ammonium salts were of analytical grade. All chemicals used to prepare high-performance liquid chromatography (HPLC) buffer solutions and all organic solvents were of HPLC or LC-MS grade. Double distilled water, prepared in a BD 50 quartz glass distillation apparatus (Westdeutsche Quarzschmelze), was used throughout. Deaerated water was prepared by bubbling pure nitrogen through double distilled water for at least 2 h. If it was necessary to remove residual traces of oxygen, the nitrogen was passed through two flasks containing alkaline pyrogallol solution before it was used to prepare the deaerated water. Nitrogen gas was 99.999% pure. According to the manufacturer, it contained 3 vol ppm oxygen (Westfalen Reference Westfalen2017).
Ca-montmorillonite (SAz-1), kaolinite (KGa-2) and nontronite (NAu-2) were obtained from the Clay Minerals Society. Fractions with particle sizes ≤2 µm were used throughout. They were prepared by sedimentation (for details, see Dalai et al. Reference Dalai, Pleyer, Strasdeit and Fox2017). The olivine used was from Shigar, Pakistan and was supplied by M. Jentsch Mineralien (Extertal, Germany). X-ray powder diffraction revealed that it consisted mainly of forsterite (Mg2SiO4) and to a lesser extent of fayalite (Fe2SiO4). Only olivine crystals that visually appeared homogeneous were used. Prior to use, the olivine samples were crushed and passed through a sieve stack. The particle size fraction between 100 and 250 µm was used. No further treatment of the minerals was performed.
Test reactions in the WDA
Typical procedure for experiments with glycine and clay minerals
A Schlenk flask containing 30 ml of water, 1 g of clay mineral and 55 mg of glycine was attached to the rest of the WDA. The whole setup was then purged with nitrogen for 14 h. After that, the wet‒dry cycling was started by heating the flask to 150°C. During the whole experiment, the oil bath was kept at this temperature and a constant flow of nitrogen gas (3.6 l h–1) was maintained. After 6 h, the magnetic valve opened for 30 min and allowed the water to flow back into the hot flask. Then the next cycle started. In this way, 4, 8, 12, 16 or 28 successive wet‒dry cycles were performed. After the last dry phase, the flask was detached from the apparatus and its content was extracted with water.
Procedure for wet‒dry experiments with linoleic acid
The preparation of the experiments was carried out inside a glove box containing a pure argon atmosphere (<1 ppm O2). In all cases, 200 µl (643 µmol) of linoleic acid and 30 ml of deaerated water were mixed in a Schlenk flask. Four different systems were then studied under wetting‒drying conditions: (a) the linoleic acid‒water mixture under air, (b) the linoleic acid‒water mixture together with 1 g of olivine under air, (c) the linoleic acid‒water mixture in a 99.999% nitrogen atmosphere and (d) the linoleic acid‒water mixture together with 1 g of olivine in a 99.999% nitrogen atmosphere. Each Schlenk flask was attached to a WDA. Throughout the experiments with the systems (a) and (b), the top of the WDA was left open and the WDA was flushed three times with air to ensure that no oxygen deficiency occurred. In the experiments with the systems (c) and (d), a nitrogen flow of 3.6 l h–1 was adjusted and maintained throughout the experiment.
By heating the oil bath to 150°C the wet‒dry cycling was started. An experiment consisted of eight cycles. The net heating time was 48 h, during which the valve opened every 6 h for 15 min. At the end of the eighth and last dry phase, the oil bath was removed and the flask was allowed to cool down. Afterwards, the flask was detached and its contents extracted.
The experiments with the systems c and d were repeated in a static nitrogen atmosphere (i.e. without nitrogen flow). This was necessary because the gas flow spread the linoleic acid, which is a liquid, in the whole apparatus. In order to prevent air from entering the apparatus during the static atmosphere experiments, a glass pressure relief valve (Rettberg, Göttingen, Germany) was attached to the top of the WDA to maintain a slight overpressure (ca. 0.1 bar). The valve was connected to the nitrogen supply as shown in SOM-Fig. S3. The WDA was purged with nitrogen for 24 h before the Schlenk flask which contained the linoleic acid was attached against a countercurrent of nitrogen.
Experiments with pyrogallol
Special care was taken to exclude oxygen throughout the experiments. An alkaline pyrogallol solution was prepared in an argon glove box (<1 ppm O2) by dissolving 0.8 g of pyrogallol in 30 ml of a deoxygenated 2% sodium hydroxide solution in a Schlenk flask. The flask was then taken out of the glove box and attached to the WDA against a counter flow of nitrogen gas. A nitrogen stream of ca. 72 l h–1 was adjusted and maintained throughout the experiment. The high nitrogen flow rate ensured that no negative pressure occurred by the cooling effect of the water flowing back into the hot flask at the end of each dry phase. The oil bath was heated to 110°C. Then four wet‒dry cycles were performed during which the magnetic valve opened every 6 h for 15 min. At the beginning of the fifth wet phase, 1 ml of air was injected directly into the solution with a syringe. The observed colour change allowed to draw conclusions on the oxygen sensitivity of the pyrogallol solution. The nitrogen used contained 3 ppm of residual O2. In a repetition of the experiment, the nitrogen was passed through two strongly alkaline pyrogallol solutions to remove the residual oxygen, as described by Shriver & Drezdzon (Reference Shriver and Drezdzon1986). The experiments were also conducted with 30 ml of pure water instead of the pyrogallol solution in order to instrumentally determine the O2 content of the liquid phase. The dissolved oxygen was measured with a FiveGo F4 instrument equipped with an LE621 IP67 sensor (Mettler-Toledo).
Analytical instrumentation and procedures
Gas chromatography‒mass spectrometry (GC–MS)
Gas chromatograms were recorded on an Agilent 6890N/5973 GC/MSD system (Agilent, Waldbronn, Germany) equipped with a HP-5MS capillary column (Agilent, 30 m length, 0.25 mm inner diameter, 0.25 µm film thickness, 5% diphenyl‒95% dimethyl polysiloxane). Helium was used as carrier gas. The inlet temperature was 280°C and the inlet pressure 1.60 bar. The mass detector was operated in the full-scan mode (35–650 amu, 1.24 scans s–1, electron impact ionization at 70 eV).
2,5-diketopiperazine (DKP) was analysed as its bis(tert-butyldimethylsilyl) derivative (see below for the derivatization procedure). Typically 1 µl of the analyte solution was injected into the GC-MS. The temperature program was as follows: 140°C (hold for 8 min)→180°C (5°C min–1)→320°C (10°C min–1). For quantification, the selected ion chromatogram at m/z 342 was used.
For GC-MS analysis of linoleic acid methyl ester, typically 0.2 µl of the analyte solution were injected using a split ratio of 9 : 1. The following temperature program was used: 100°C (hold for 4 min)→240°C (6°C min−1, hold for 4 min), →300°C (20°C min−1). For quantification, the selected ion chromatogram at m/z 294 was used.
For GC-MS analysis of other fatty acid methyl esters and decomposition products, 5.0 µl of the analyte solution were injected in splitless mode. The temperature program used was 75°C (hold for 4 min)→240°C (6°C min−1, hold for 4 min), →320°C (20°C min−1).
High-performance liquid chromatography
An HPLC system from Sykam (Fürstenfeldbruck, Germany) was used. It consisted of the following components: reagent organizer S7121, solvent delivery system S1122, low-pressure gradient mixer S8111, injector valve bracket S5111, column oven Jetstream II Plus (ERC, Riemerling, Germany) and UV/Vis diode array detector S3210.
For ion-pair chromatography, a BDS Hypersil C18 column (3 µm particle size, 250 mm length, 4.6 mm internal diameter) from Thermo Fisher Scientific was used. Typically, a sample injection volume of 75 µl was used. The mobile phase consisted of a 10 mmol l–1 aqueous solution of sodium hexanesulfonate (C6H13SO3Na) acidified with phosphoric acid to pH 2.5 (Bujdák & Rode Reference Bujdák and Rode1999). The flow rate was 1 ml min–1, the column temperature 40°C and the detection wavelength 210 nm.
For HPLC analysis of the 2,4-dinitrobenzene derivatives, a modification of the method by Dalai et al. (Reference Dalai, Pleyer, Strasdeit and Fox2017) was used. The column was a Nucleodur C18 Gravity (3 µm particle size, 150 mm length, 4.6 mm internal diameter) from Macherey-Nagel (Düren, Germany). Typically, 50 µl samples were injected. UV absorbance at 340 nm was used for detection. A mixture of acetonitrile and 10 mmol l–1 trifluoroacetic acid in water served as the mobile phase. The following gradient program was used: 20→25% of acetonitrile over the first 20 min, then 25→80% of acetonitrile over the next 20 min. The flow rate was 1 ml min–1 and the column temperature 40°C.
The derivatization of glycine peptides was performed, with a few modifications, as described by Dalai et al. (Reference Dalai, Pleyer, Strasdeit and Fox2017). One hundred and fifty μl of the clay mineral extract (see below) were placed in a 2 ml plastic tube. After addition of 100 µl (3.5 µmol) of a 1% solution of 1-fluoro-2,4-dinitrobenzene and 20 µl (20 µmol) of 1 mol l–1 sodium hydrogen carbonate in water, the tube was heated to 40°C for 1 h in a thermoshaker. The sample was then cooled to room temperature and 10 µl (20 µmol) of a 2 mol l–1 hydrochloric acid were added. After mixing, the resulting solution was dried in a vacuum desiccator over sodium hydroxide. Finally, the residue was dissolved in 300 µl of dimethyl sulfoxide. The solutions were protected from light.
High-resolution/high-accuracy MS
Mass spectra were obtained on a Thermo LTQ Orbitrap XL instrument (ThermoScientific, Bremen, Germany) equipped with an electrospray ionization (ESI) ion source. External mass calibration was performed with the Pierce LTQ ESI Positive Ion Calibration Solution (caffeine, MRFA and Ultramark 1621). For internal calibration, lock-mass ions from the ambient air were used (Olsen et al. Reference Olsen, de Godoy, Li, Macek, Mortensen, Pesch, Makarov, Lange, Horning and Mann2005). The spectrometer was operated in the positive ion mode with an ionization voltage of 1.5 kV and a capillary temperature of 200°C. Data acquisition was in the 50–1800 Da mass range using the Orbitrap mass analyzer operated with a target mass resolution of 60 000 (defined at m/z 400). The mass spectrometer was coupled to a nanoACQUITY UPLC system from Waters (Milford, Massachusetts, USA) equipped with a Waters BEH 130 C18 column (250 mm × 75 µm, 1.7 µm particle size). Gradient elution was from 1 to 50% acetonitrile in 0.1% aqueous formic acid over 60 min. Data processing and analysis were performed with Xcalibur software (ThermoScientific).
Infrared spectroscopy
Infrared spectra were measured in attenuated total reflection (ATR) mode with a Thermo Nicolet 5700 FTIR spectrometer equipped with an ATR Smart Orbit accessory (ThermoScientific, Dreieich, Germany). A total of 600 scans were recorded per spectrum. The measurement range was 4000–400 cm–1 with a resolution of 2 cm–1.
X-ray powder diffractometry
Powder diffractograms of olivine were obtained on a Bruker D8 Focus instrument (Bruker AXS, Karlsruhe, Germany) with a Sol-X energy dispersive detector (Baltic Scientific Instruments, Riga, Latvia). The measurements were performed with CuKα radiation (λ = 1.5418 Å) in the 2θ range 5°–120°. Sodium chloride was used as an internal 2θ standard.
Extraction and quantification of glycine and glycine peptides after wet‒dry experiments with clay minerals
The extraction was carried out as described by Dalai et al. (Reference Dalai, Pleyer, Strasdeit and Fox2017). In short, 10 extraction stages were performed with a 100 mg sample (3 × 600 µl and 7 × 450 µl of water). In each stage, the suspended sample was shaken for 1 h and then centrifuged. The supernatants were collected and the volume of the combined supernatants was made to 5 ml. Prior to derivatization or direct analysis, the extracts were filtered through a 0.20 µm PET membrane to remove possible particulate matter. Glycine was directly quantified by ion-pair HPLC using calibration curves, while DKP was quantified as its bis(tert-butyldimethylsilyl) derivative by GC-MS (see below) and diglycine was quantified as its 2,4-dinitrophenyl derivative by HPLC, also using calibration curves (see above). The absolute amounts of the higher peptides up to hexaglycine were calculated from the known amount of diglycine under the assumption that the extinction coefficient did not significantly vary between the different dinitrophenyl peptides (for this assumption see for example Fujio et al. Reference Fujio, Noma and Amano1959). To ensure the correct assignment of the peaks, spiking with reference compounds was performed.
Derivatization of DKP
Derivatization was carried out in two steps: (i) protection of amino groups by N-trifluoroacetylation, which was necessary to prevent the formation of DKP from glycylglycine; (ii) transformation of DKP into its bis(tert-butyldimethylsilyl) derivative using a modified method of Shimoyama & Ogasawara (Reference Shimoyama and Ogasawara2002). Typically, an aliquot of 500 µl of the clay mineral extract was placed in a 1-ml V-vial and evaporated to dryness under vacuum. To the dry residue, 100 µl of dry acetonitrile, 6 µl (42 µmol) triethylamine and 5 µl (36 µmol) of trifluoroacetic anhydride were added. The vial was then tightly closed and heated for 60 min at 40°C. DKP was stable under these conditions, whereas amino groups were trifluoroacetylated. After that, the sample was evaporated to dryness in a stream of nitrogen. To the dry residue, 75 µl of dry acetonitrile and 25 µl (106 µmol) of N-(tert-butyldimethylsilyl)-N-methyltrifluoroacetamide were added. The vial was tightly closed and the mixture was heated for 3 h at 100°C with frequent shaking (approximately every 30 min). After cooling to room temperature, the volume was made to 100 µl with dry acetonitrile. Then the solution was transferred to a GC vial and measured.
The excess of the derivatizing reagent used was sufficient for quantitative reaction. The completeness of the second derivatization step was tested by comparing the GC peak area of the product 1,4-bis(tert-butyldimethylsilyl)piperazine-2,5-dione in experiments with different excesses of the reagent. Pure glycine and glycylglycine were also derivatized as described above to ensure that they do not form DKP during the derivatization process. Furthermore, pure DKP was derivatized as described above as well as only with N-(tert-butyldimethylsilyl)-N-methyltrifluoroacetamide. Comparison of the resulting chromatograms showed that DKP is stable under the chosen conditions. Furthermore, mixtures of DKP, glycine and glycylglycine in various ratios were derivatized to ensure that quantification was not affected by side reactions occurring during the derivatization process (e.g. DKP hydrolysis or formation).
Extraction and quantification of linoleic acid after wet‒dry experiments
The residues in the flasks containing linoleic acid or linoleic acid plus olivine were extracted ten times with 1 ml of tert-butylmethyl ether each time. The final volume was made to 10 ml. Additionally, the aqueous phase in the reservoir was extracted with 10 ml of dichloromethane. Both extracts were used for GC-MS analysis. Before measurement, the extracts were filtered through a 0.45 µm PTFE membrane to remove particulate matter. The dichloromethane extract was divided in half, one half was measured directly with GC-MS and the other half was derivatized with trimethylsulfonium hydroxide (see below). The tert-butylmethyl ether extract was also derivatized with trimethylsulfonium hydroxide. Decomposition products were identified by comparing their retention times and mass spectra with those of authentic samples.
Derivatization of fatty acids
Fatty acids were methylated with trimethylsulfonium hydroxide as described by Butte (Reference Butte1983). 50 µl of the tert-butylmethyl ether or dichloromethane extract were mixed with 150 µl of a 0.25 mol l–1 methanolic trimethylsulfonium hydroxide solution. After 10 minutes at room temperature, the mixture was injected directly into the GC (inlet temperature 280°C). The completeness of the derivatization reaction was tested using a 4-, 8- and 12-fold excess of the reagent; in all three cases, the peak area of the linoleic acid methyl ester was the same and no underivatized linoleic acid could be detected. Thus a 4-fold excess would have been sufficient for quantitative reaction. In practice, we used a 12-fold excess to take into account that derivatizable decomposition products may additionally be present.
Results and discussion
Versatility of the WDA
The setup and operating principle of the WDA are described under Materials and methods. Below, we also describe some test applications using typical experimental conditions and a standard design of the apparatus. However, the basic functional principle allows a much wider range of conditions and the study of additional aspects, partly after slight modification of the experimental configuration. For example:
(i) T emperature (fluctuations). In our test applications, the temperature of the flask content at the beginning of the wet phase was ca. 100°C (boiling point of the aqueous solution). The temperature slowly increased as a result of evaporation of water and reached between 110 and 150°C, depending on the heating bath temperature, when the dry phase started. Thus, the WDA performs not only wet‒dry but also temperature fluctuations. The possible prebiotic role of combined fluctuations of water content and temperature was recognized early on by Lahav et al. (Reference Lahav, White and Chang1978). With the standard design of the WDA, the usable temperature range is ca. 100‒200°C. Certain technical modifications would allow an upper-temperature limit of 250°C. The low-temperature limit is determined by the wet phase duration which, of course, increases with decreasing temperature of the heating bath and will become unreasonably long when the temperature is too low. The temperature limits may be different for non-aqueous solutions. This is worth mentioning because organic solvents can be prebiotically interesting, for example, in the context of the oil-slick scenario (Lasaga et al. Reference Lasaga, Holland and Dwyer1971; Cleaves & Miller Reference Cleaves and Miller1998; Nilson Reference Nilson2002).
(ii) Cycle duration. In the experiments described in the present paper, the duration of a complete cycle was 6 h. The wet phase varied between 2 and 3 h and the dry phase between 3 and 4 h, depending on the composition of the reaction mixture and the flow rate of the nitrogen stream. When no gas stream was used (see experiments with linoleic acid), the dry phase was much shorter. There are no fundamental restrictions on the cycle duration. However, a value of 6 h was chosen for practical reasons (exactly four complete cycles per day) and because it is in the range of the suggested tidal cycle duration on Earth 3.9 Ga ago (Lathe Reference Lathe2006). Since the duration of the wet and the dry phases can be independently adjusted, a combination of short wet and long dry phases, for example, is possible with the WDA. This will be important if rock pools above the splash zone are to be simulated which are refilled with (rain)water after longer time intervals.
(iii) Liquid and gas phase. The only materials that come into contact with the liquid and gaseous components in the WDA are PFA, PTFE, perfluoroelastomer (FFKM) and borosilicate glass 3.3. As these materials are largely inert, a broad range of acids, bases, salty solutions, organic solvents, gases or gas mixtures can be employed.
(iv) Solid phase. Virtually all types of prebiotically relevant solids can be used, for example, rocks, minerals, meteoritical materials and insoluble organics such as tholins (Sagan & Khare Reference Sagan and Khare1979) and thermomelanoids (Fox et al. Reference Fox, Dalai, Lambert and Strasdeit2015).
(v) Volatile products. Gas absorption bottles filled with different absorbing solutions can be easily connected to the gas outlet of the WDA. They can be used to selectively collect different classes of volatile compounds (e.g. acids), which may help to elucidate the chemical processes occurring during wet‒dry cycling. Cold traps may also be used.
(vi) Reaction flask. The standard version of the WDA has a one-necked round bottom flask with a gas inlet (Fig. 2). However, because of the modular construction, different flasks are possible. A two-necked flask with a gas inlet, for example, would allow taking samples against a counter flow of gas during the experiments. If a quartz flask is used, UV irradiation of the reaction mixture, preferably by use of a fibre-optic cable, would be possible.
Test application I. Glycine and clay minerals
Inspired by the work of Lahav et al. (Reference Lahav, White and Chang1978), we chose to study the behaviour of glycine (Fig. 5) in the presence of clay minerals as a first test application of the WDA. Instead of exactly repeating the literature experiments, our experiments were adapted to the WDA by selection of the minerals, glycine content, temperature range, atmosphere (N2) and cycle and experiment duration. The clay minerals used were kaolinite (KGa-2), montmorillonite (SAz-1) and nontronite (NAu-2). Lahav et al. (Reference Lahav, White and Chang1978) also used kaolinite so that at least the results of one of our experimental approaches are more or less directly comparable with their results. Furthermore, in the present study, a closer look was taken at the decomposition of glycine.

Fig. 5. Structures of glycine (Hgly), cyclic glycine dipeptide (2,5-diketopiperazine, DKP) and linear glycine homopeptides (Glyn).
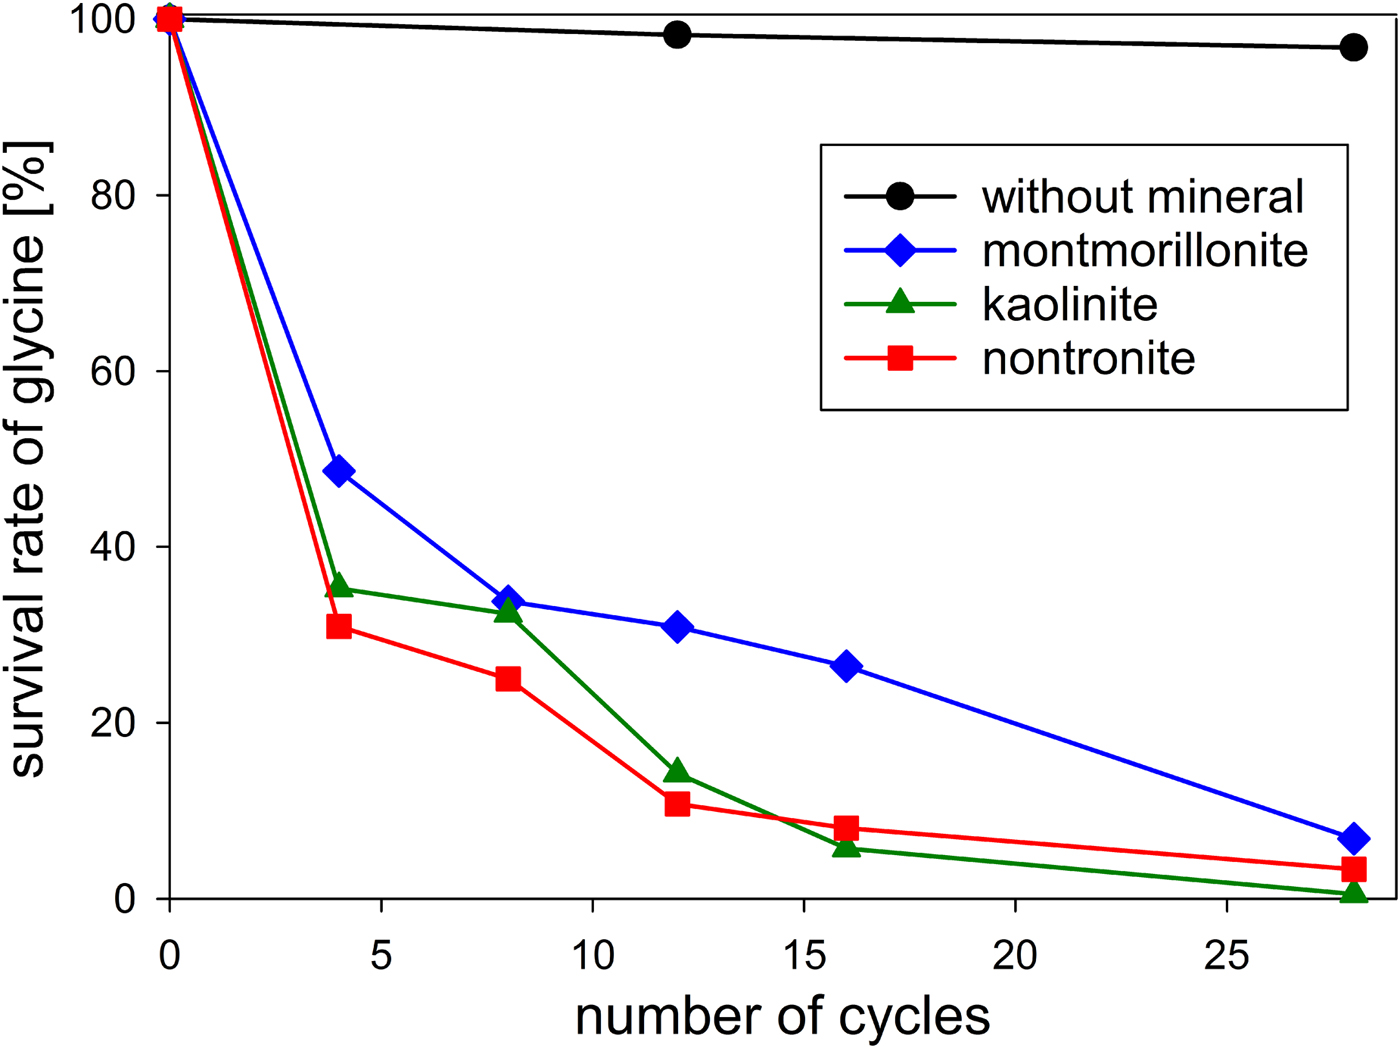
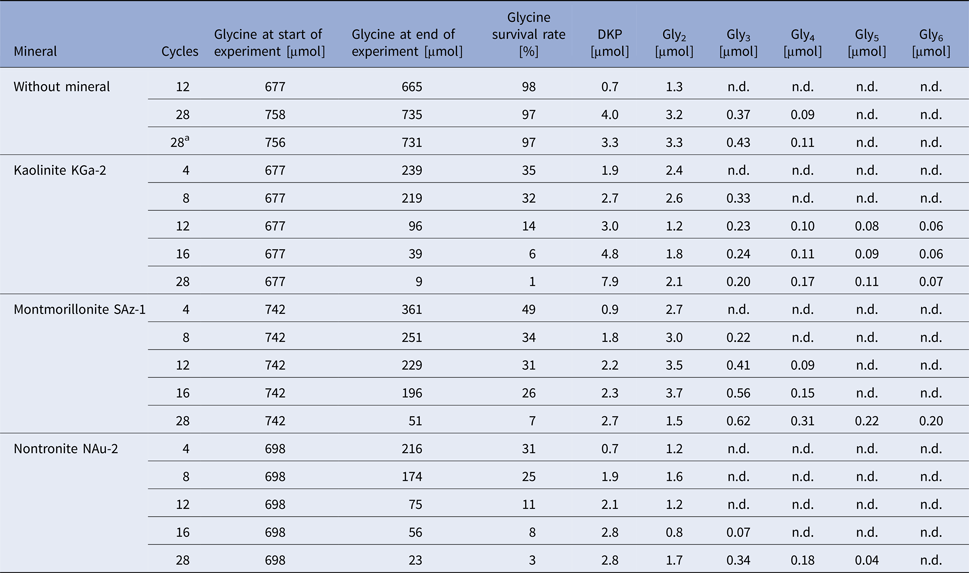
First, we investigated the behaviour of glycine in the absence of minerals. After 12 wet–dry cycles (in total, ca. 36 h each at 100°C and 150°C) 98% of the glycine had survived; after 28 cycles (in total, ca. 84 h each at 100°C and 150°C) 97% were still present (Table 1 and Fig. 6). In an experiment without wet–dry cycling, Dalai (Reference Dalai2013) has dry heated glycine at 150°C for 48 h under nitrogen. She observed that 98% of the amino acid remained unchanged. Comparing this result with that of our 12-cycle experiment, which included ca. 36 h of dry heating at 150°C, we see that the glycine survival rate was equally high in both cases. Obviously, the wet phases had no effect.
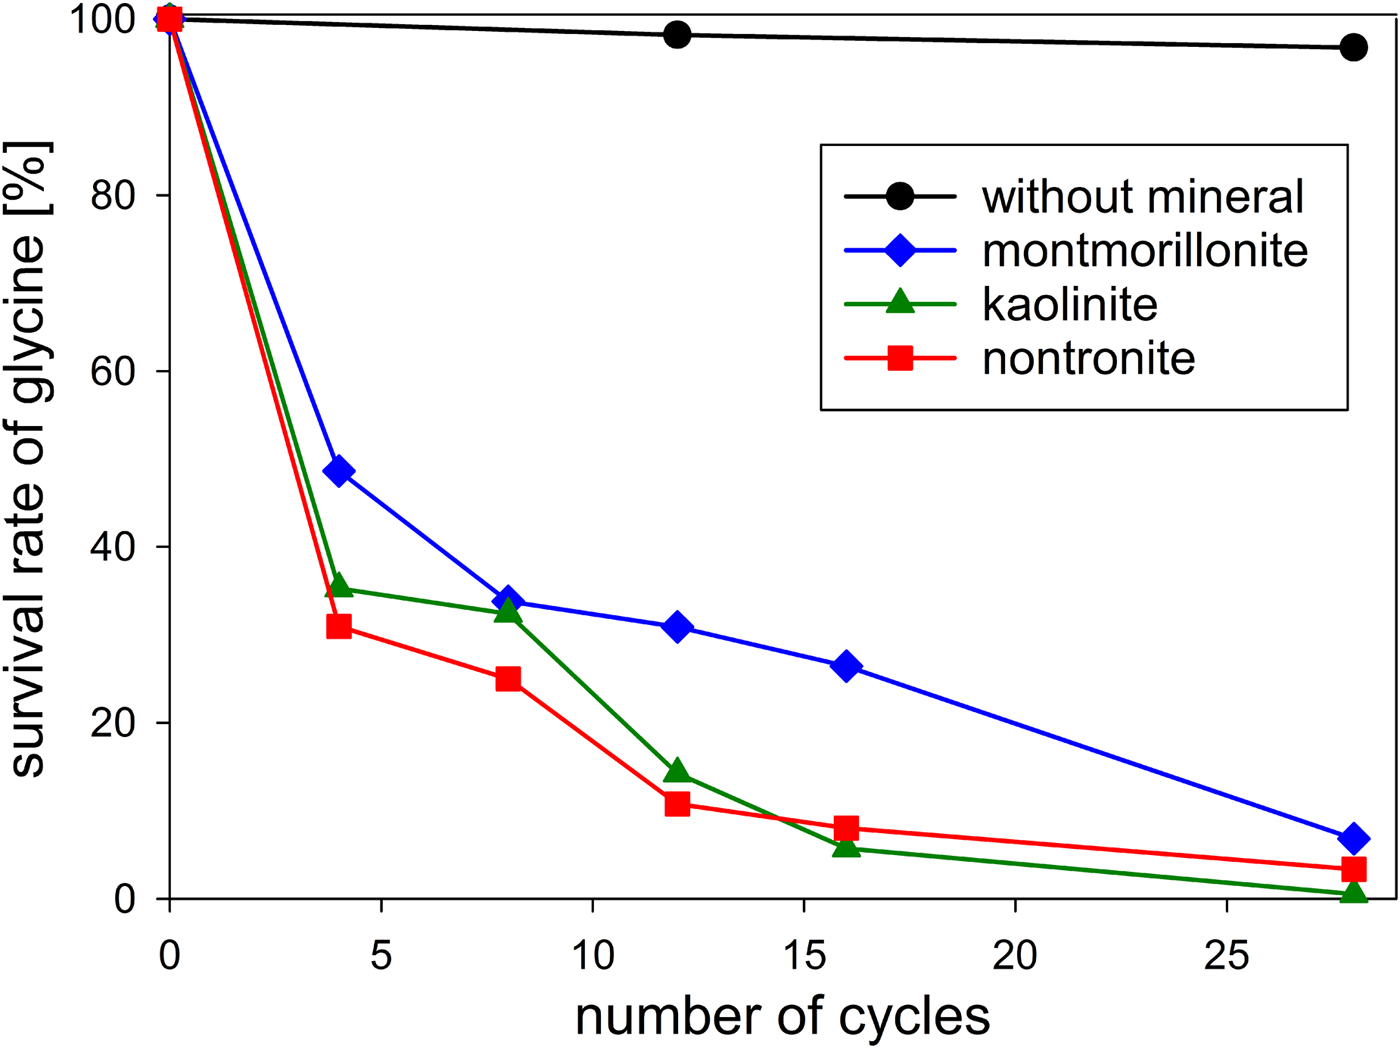
Fig. 6. Survival of glycine during wet‒dry cycles in the absence and in the presence of clay minerals in an anaerobic atmosphere.
Table 1. Survival and oligomerization of glycine during wet‒dry cycles in the absence and in the presence of different clay minerals
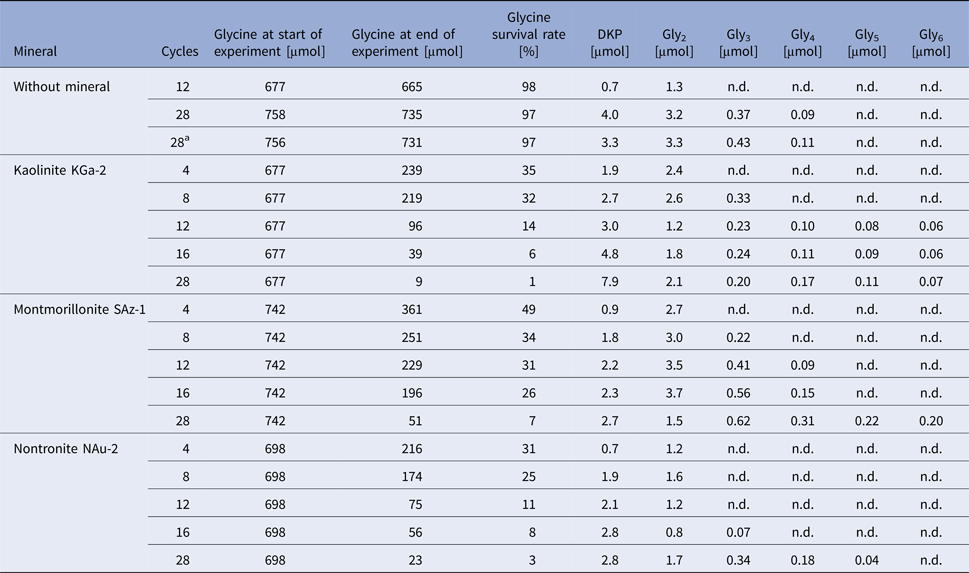
The μmol values given for glycine and peptides are the total amounts in the respective experiment.
n.d., not detected by HPLC using UV/Vis detection.
a Repeat of the previous experiment.
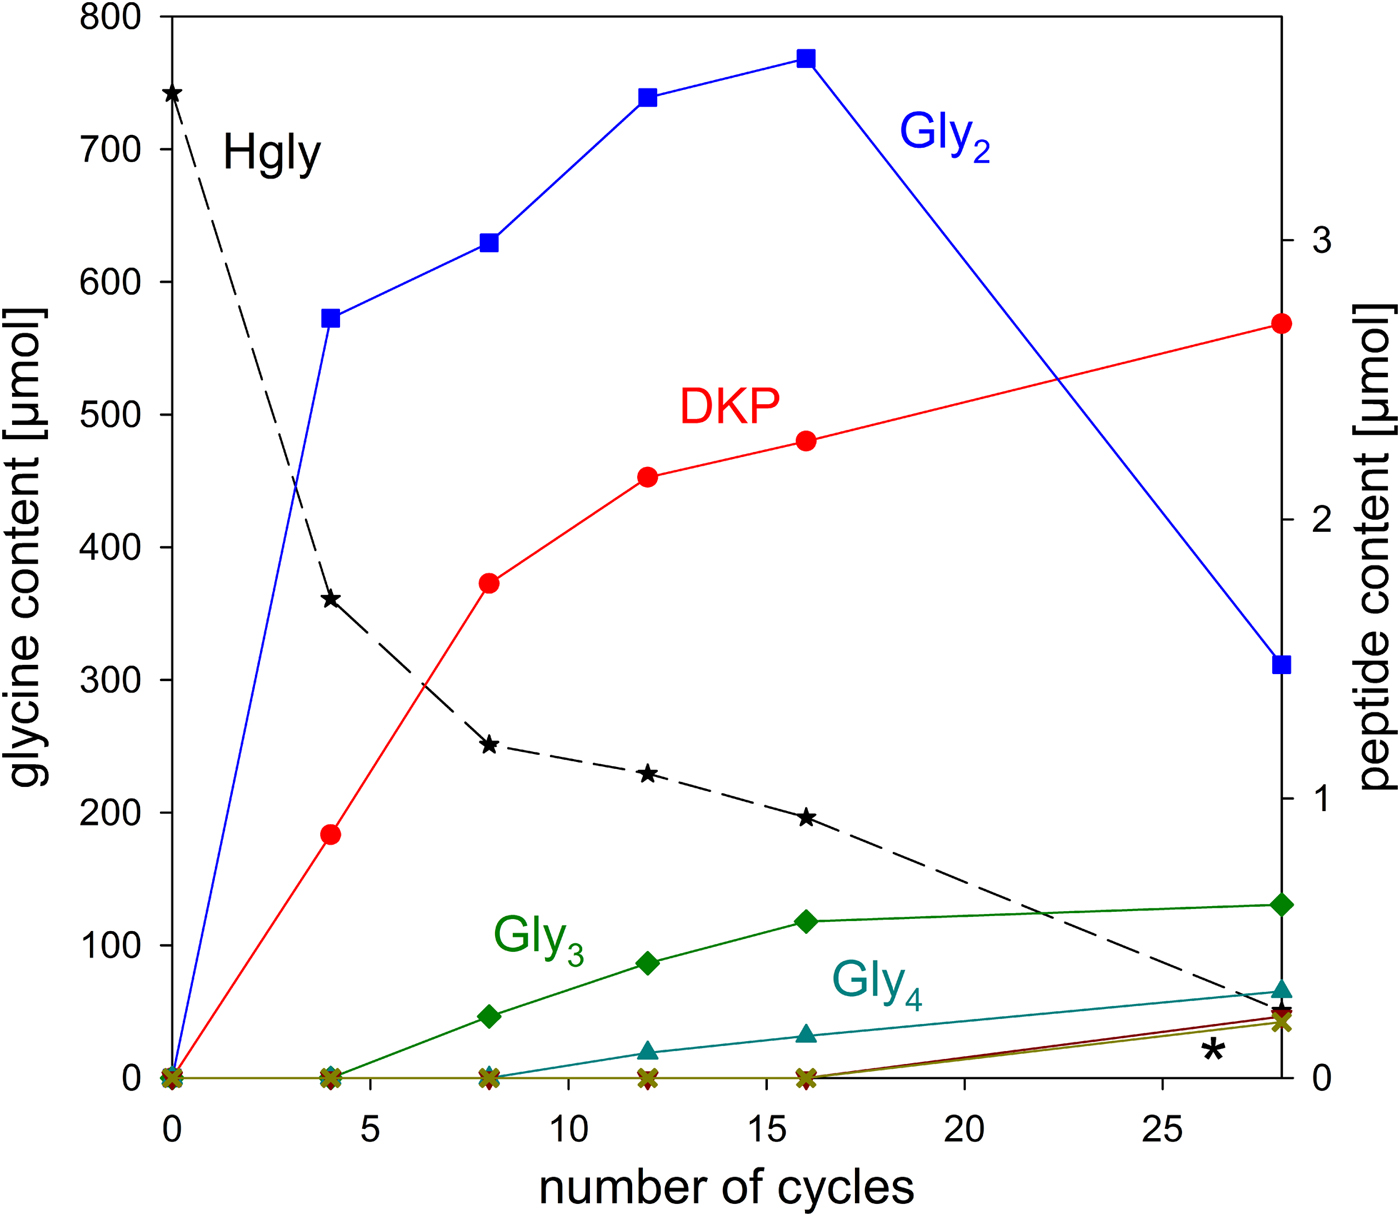
There were, however, differences in the residue composition between dry heating and wet–dry cycling. Dry heating of glycine yielded small amounts of the cyclic dipeptide DKP (Fig. 5) as the only peptide. Wet–dry cycling, in contrast, also produced the linear dipeptide Gly2 (Fig. 5, 0.4% yield) in addition to DKP (0.2% yield, Table 1). Possibly Gly2 was formed from DKP by ring-opening hydrolysis during the wet phases. After 28 cycles, tri- and tetraglycine were also detected by HPLC (0.2 and 0.05% yield, respectively; Table 1). In order to check if peptides longer than Gly4 had been formed, high-resolution/high-accuracy MS was used to analyse the sample. It revealed that all linear peptides from Gly2 to Gly10 were present (SOM-Table 1). Thus, wet–dry cycling led to longer oligomers than dry heating alone. This is a general observation – not limited to glycine – which has motivated some recent theoretical studies (Varfolomeev & Lushchekina Reference Varfolomeev and Lushchekina2014; Higgs Reference Higgs2016; Ross & Deamer Reference Ross and Deamer2016). According to Higgs (Reference Higgs2016), for example, oligomer formation occurs during a dry phase but is constrained by restricted diffusion. In the subsequent wet phase, however, repositioning of the molecules takes place, so that in the next dry phase oligomerization can progress. Therefore, and despite possible hydrolysis during the wet phases, longer oligomers are formed than by dry heating alone. In a best-case scenario, wet–dry cycling will generate an equilibrium chain length distribution that approaches the one that would occur if free diffusion was possible in the dry phase.
The stability of glycine under wet–dry conditions decreased dramatically when clay minerals were added. With all three minerals tested, the glycine survival rate dropped below 10% after 28 cycles (Table 1 and Fig. 6). The decrease of the glycine content follows approximately first-order kinetics; the fits are quite good, given that the systems are heterogeneous (see SOM-Fig. 4). As in the experiments without minerals, all peptides up to the decamer (Gly10) were identified in the 28-cycle experiment with montmorillonite (SOM-Table 2). The peptides up to Gly6 were quantified (Table 1). Overall, a trend can be observed that the amount and length of peptides increased with increasing number of cycles. Also, there is a clear tendency for the formation of longer peptides (Gly4‒6) in the presence of a clay mineral – even though DKP and Gly2 were still formed preferentially. Figure 7 shows the individual peptide contents as a function of cycle number for the montmorillonite experiment. It can be seen that the amounts of DKP and Gly3‒6 increased steadily over the 28 cycles of the experiment. In contrast, the amount of Gly2 reached a maximum at cycle 16 (3.7 µmol, 1% yield) and then decreased to 1.5 µmol (0.4% yield) at cycle 28. With the other two minerals, a maximum in the amount of Gly2 occurred already at cycle 8 (kaolinite: 2.6 µmol, 0.8% yield; nontronite: 1.6 µmol, 0.5% yield). Then, after an intermediate decrease, another maximum was reached at cycle 28. Such a renewed increase was not observed in the montmorillonite experiment. One might speculate that here the second maximum was beyond the 28-cycle limit.
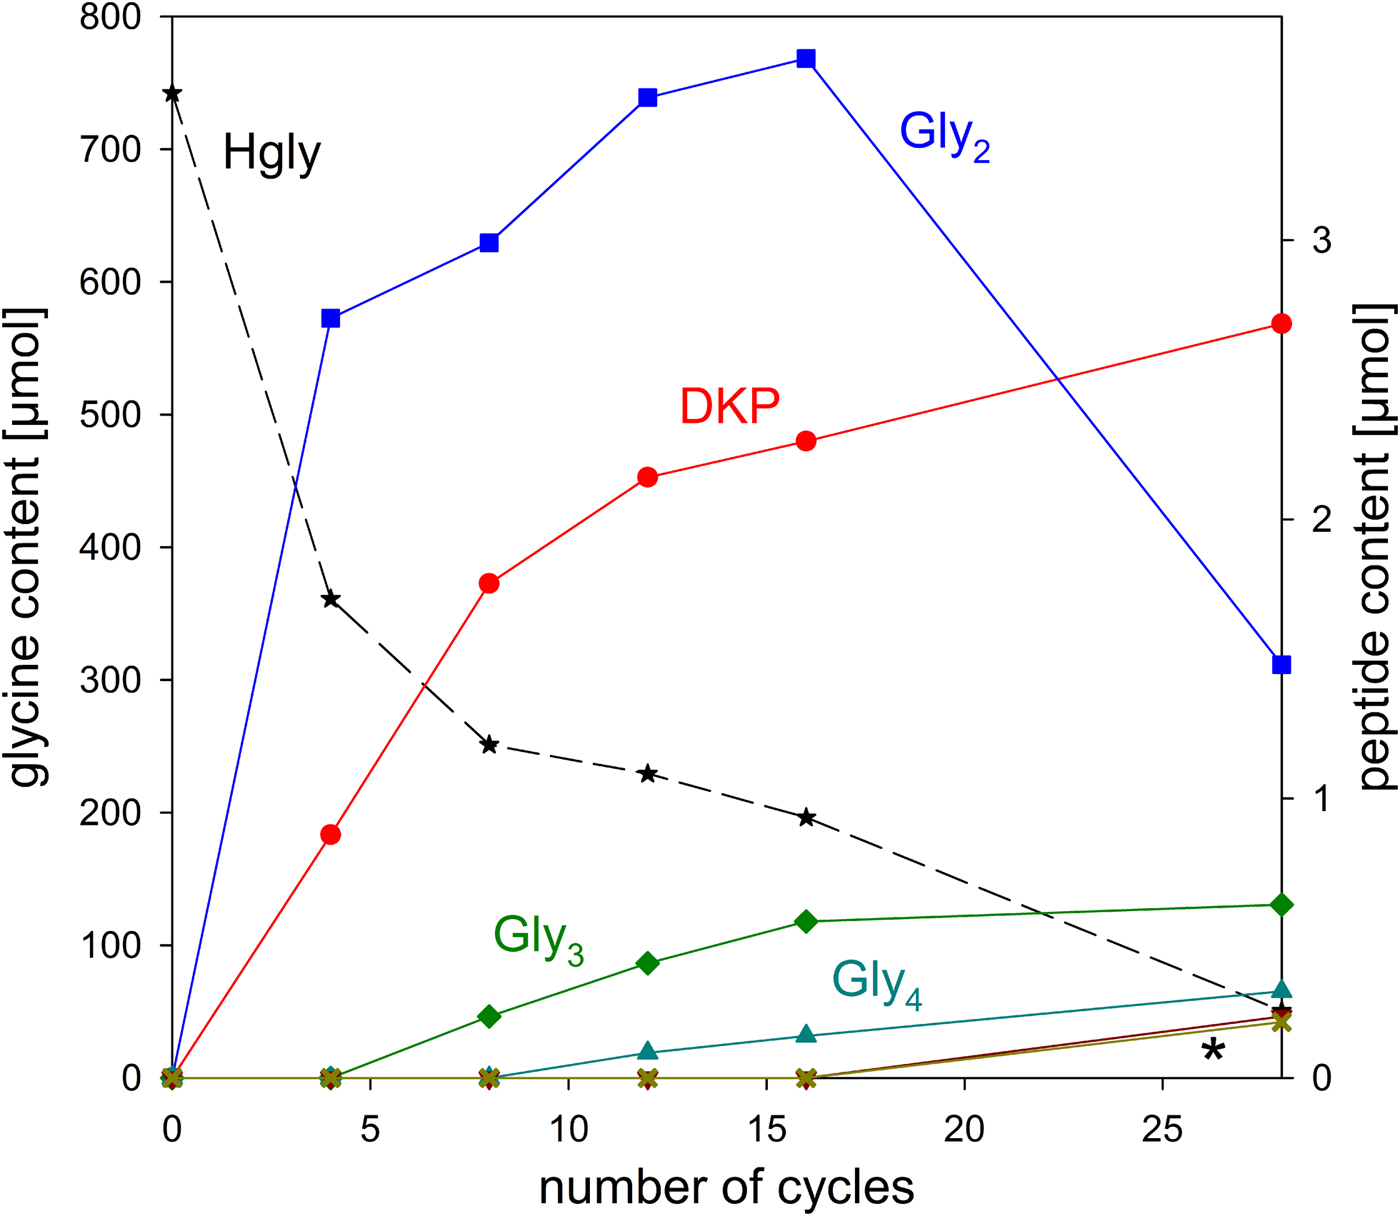
Fig. 7. Changes of the glycine and peptide contents in the system glycine‒montmorillonite during wet‒dry cycling. The asterisk indicates the overlapping curves for Gly5 and Gly6.
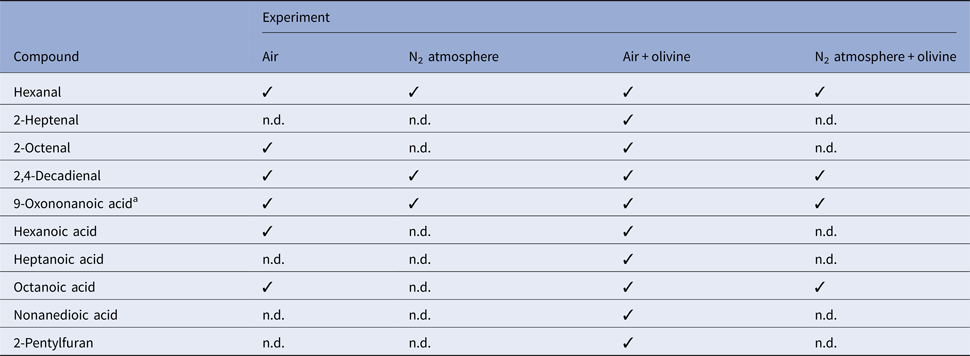
Table 2. Volatile decomposition products formed from linoleic acid in wet‒dry cycling experiments
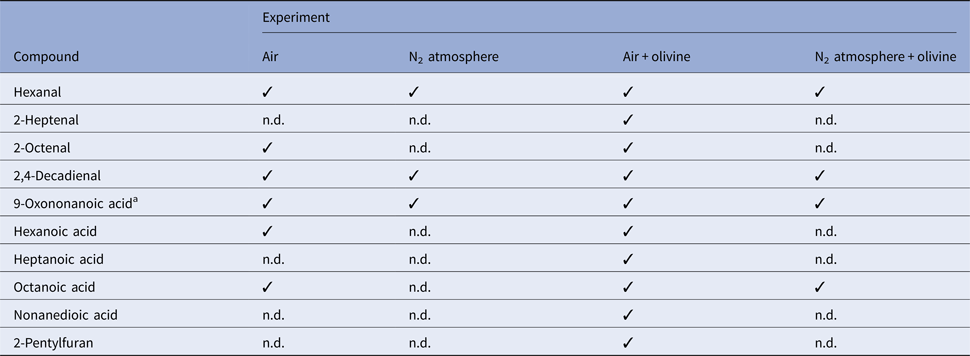
The compounds were identified by mass spectrometry and comparison of the GC retention times with those of authentic samples.
a Compound identified only by its mass spectrum. ✓, Detected. n.d., not detected.
Two sources of Gly2 have to be considered, namely the condensation of glycine molecules in the dry phase and the partial hydrolysis of other peptides, particularly DKP, in the wet phase. The reverse reactions – Gly2 hydrolysis (wet phase) and condensation to other peptides (dry phase) – are the potential sinks. Obviously, in our mineral experiments, the formation initially prevailed, because the Gly2 yields increased up to a certain point in time. But then the situation changed and the loss of Gly2 dominated. The first idea that may come to mind is that, at this point in time, the rate of formation of Gly2 and its precursor DKP decreased because not enough glycine was left. However, on a molar base still 50- to 100-fold more glycine was present than Gly2, when the Gly2 content started decreasing. Another possibility is that the more of the peptides Gly3‒6 that formed in the course of the experiment, the more crucial binding sites of the mineral were occupied by them. Gly2 may not have been able to displace these longer peptides. As a result, Gly2 formation and/or protection against hydrolysis decreased. These models, however, cannot explain why a second maximum of the amount of Gly2 was observed with two of the minerals. The situation is further complicated by as yet unidentified decomposition reactions (see below). Therefore, further studies are required, which are however beyond the scope of the present paper whose purpose is to illustrate the applicability of the WDA.
The decrease of glycine over time varied only marginally between the minerals used (Table 1 and Fig. 6). With regard to peptide formation, however, there were clear differences. For example, the formation of longer peptides is promoted in the order: kaolinite > montmorillonite > nontronite. With kaolinite all peptides up to Gly6 could be detected with HPLC already after 12 cycles. With montmorillonite it took 28 cycles before detectable amounts of Gly6 had formed and with nontronite Gly6 was not observed at all. Regarding the overall yield of peptides, kaolinite was again the most efficient mineral: 3.3% of the glycine had been transformed into peptides after 28 cycles. The corresponding numbers for montmorillonite and nontronite were 1.9% and 1.6%, respectively.
In the mineral experiments, peptide formation only accounted for a minor proportion of the glycine decrease. In fact, several unidentified decomposition products were detected by HPLC. We know from the analysis of the 2,4-dinitrophenyl-derivatized samples that many of these products were amines. To trap volatile acidic and basic products, the kaolinite experiment was repeated twice using an absorption bottle which contained 30% ammonia solution and 20% hydrochloric acid, respectively. The bottle was attached to the gas outlet of the WDA. After 12 cycles, the content of the bottle was analysed. No products were detected in the ammonia solution. From the hydrochloric acid, however, ammonium chloride was isolated and identified by its IR spectrum, indicating that the reaction mixture released NH3. The fact that no acetic acid was found suggests that the NH3 may not have been produced by deamination of glycine but in secondary decomposition reactions.
It is interesting to compare the results of our 28-cycle kaolinite experiment with the results obtained by Lahav et al. (Reference Lahav, White and Chang1978) in their experiment no. 7, in which kaolinite was also used. The number of cycles (28 and 27, respectively) and the initial amount of glycine per milligram of clay (677 and 791 nmol, respectively) were similar in both experiments. But there were marked differences in the overall duration of the dry phases (ca. 3.5 d versus 67.4 d) and the temperature range (100–150°C versus 60–94°C). Furthermore, we performed our experiment in a pure N2 atmosphere, which might have suppressed some decomposition reactions. Despite these differences, the amount of Gly2 formed was the same within a factor of 1.7 (2.1 and 3.5 nmol mg−1 clay, respectively). The yields of Gly3 and Gly4, however, were considerably higher in the experiment by Lahav et al. (by a factor of 8 and 3.5, respectively); but on the other hand, the authors detected only traces of Gly5 and no Gly6. The overall yield of linear peptides was also higher (1.8% versus 1.0%). Thus, we cautiously conclude that higher temperatures and short cycles, as present in our experiment, favour the formation of longer peptides, but also reduce the overall yield of linear peptides. DKP formation and the decrease of glycine over time were not investigated by Lahav et al. and therefore cannot be compared between the two experiments.
In this section, we demonstrated that our newly designed apparatus enables the fully automated execution of wet–dry cycles over a 1-week period. Long-time experiments – with open/close commands for the magnetic valve also during nights and weekends – are possible without the need for an operator. Furthermore, we showed that it is possible to collect for analysis volatile reaction products at the gas outlet of the apparatus.
Test application II. Stability of linoleic acid
Compartmentalization is regarded as a key step in the origin of life; in this context, vesicles and micelles have been extensively studied (see for example: Deamer Reference Deamer2016, Reference Deamer2017; Hanczyc & Monnard Reference Hanczyc and Monnard2016). Linoleic acid, a doubly unsaturated long-chain fatty acid (Fig. 8), is among the compounds that can form vesicles (Gebicki & Hicks Reference Gebicki and Hicks1976). Therefore, it seems reasonable to consider it as a potential model compound in origins of life research, although it has been argued that unsaturated fatty acids are less prebiotically plausible than saturated ones (Hanczyc et al. Reference Hanczyc, Fujikawa and Szostak2003). Linoleic acid is sensitive to air oxidation (see for example Frankel Reference Frankel1991; Porter et al. Reference Porter, Caldwell and Mills1995); otherwise it is quite stable and can, for example, survive in fossil teeth for at least one million years (Das & Harris Reference Das and Harris1970). Thus, linoleic acid was considered ideal to test the suitability of the WDA for experiments with air-sensitive compounds.

Fig. 8. Structure of linoleic acid [(9Z,12Z)-9,12-octadecadienoic acid].
According to a model proposed by Damer & Deamer (Reference Damer and Deamer2015), amphiphile vesicles, minerals and hydration–dehydration cycles on volcanic islands could have been central to the evolution of systems of functional polymers (‘protocells’). Against this background, we investigated the stability of linoleic acid (as a potential prebiotic amphiphile) in wet–dry cycling under various experimental conditions: in air and under nitrogen and in the presence and absence of the mineral olivine. A mineral was included in this study because our test application I (see above) had already shown that minerals can drastically alter the behaviour of an organic molecule in wet–dry cycles. Olivine was chosen because it is commonly associated with volcanic rock pools (Fig. 1).
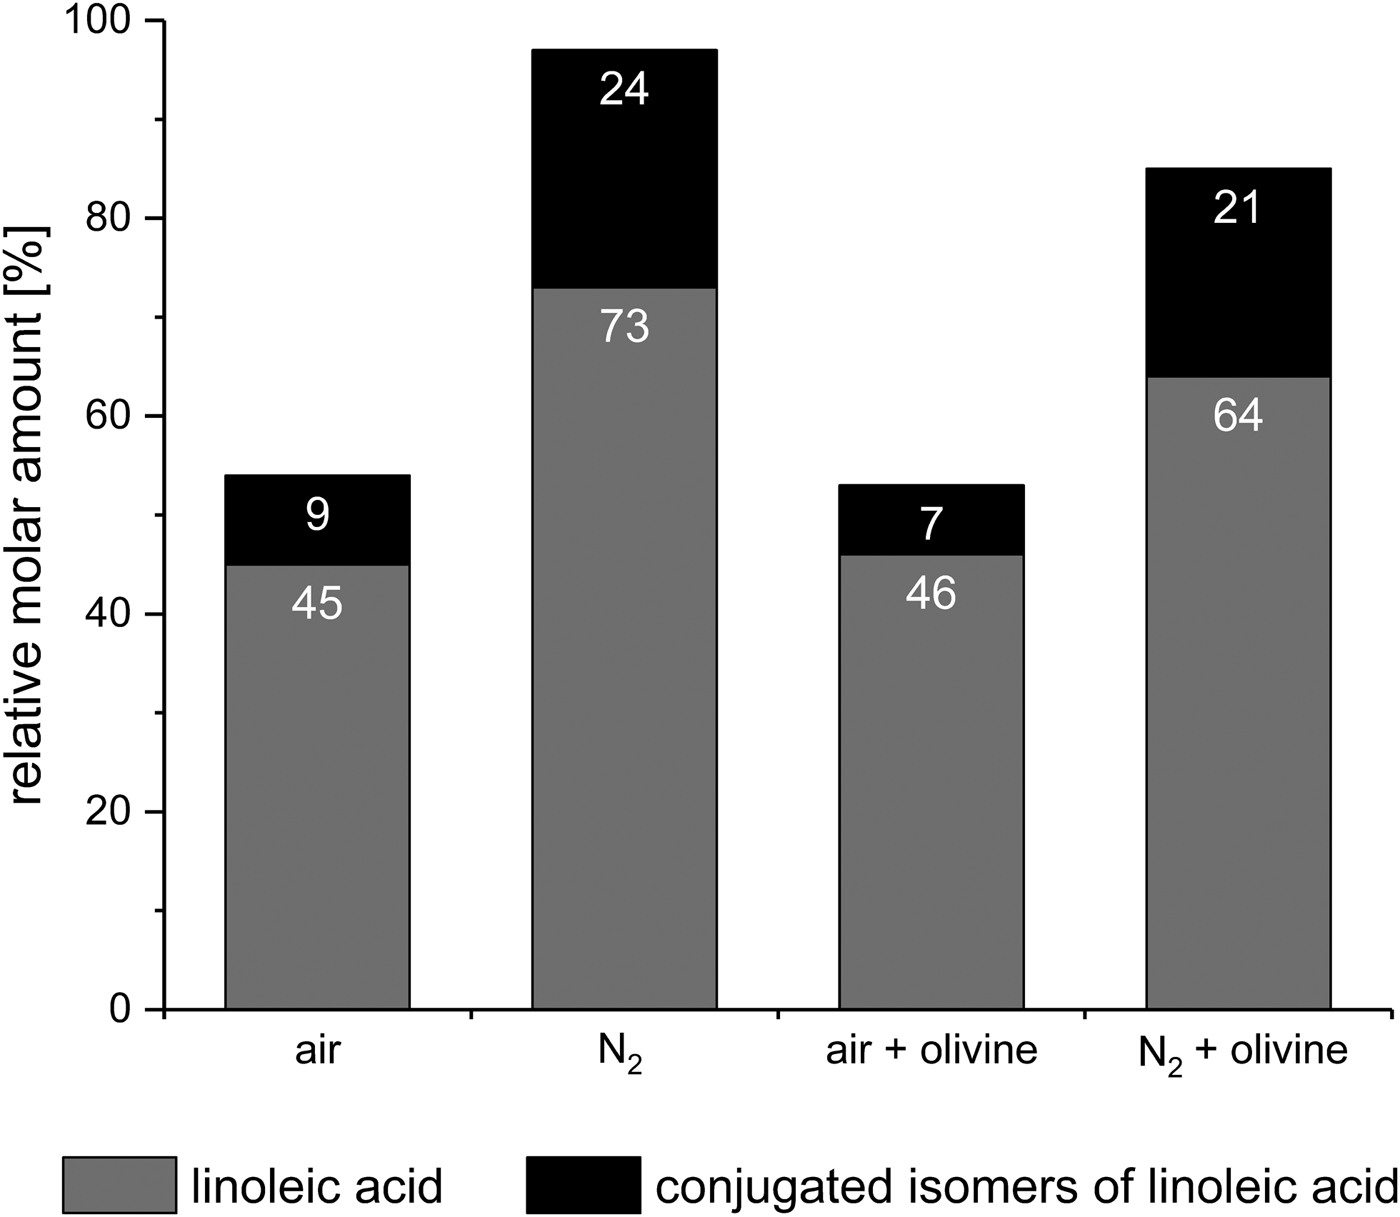
When linoleic acid, a colourless liquid, was subjected to eight consecutive wet–dry cycles in air, a brown residue resulted. Analysis of this residue showed that only 45% of the initial amount of linoleic acid had survived (Fig. 9). This is not surprising since linoleic acid is known to react with atmospheric oxygen and to subsequently decompose even without wet–dry cycling (Frankel Reference Frankel1991; Porter et al. Reference Porter, Caldwell and Mills1995). Furthermore, 9% of the initial linoleic acid formed the conjugated linoleic acid isomers 9,11- and 10,12-octadecadienoic acid. This thermal isomerization of linoleic acid is also a known phenomenon (Destaillats & Angers Reference Destaillats and Angers2005).
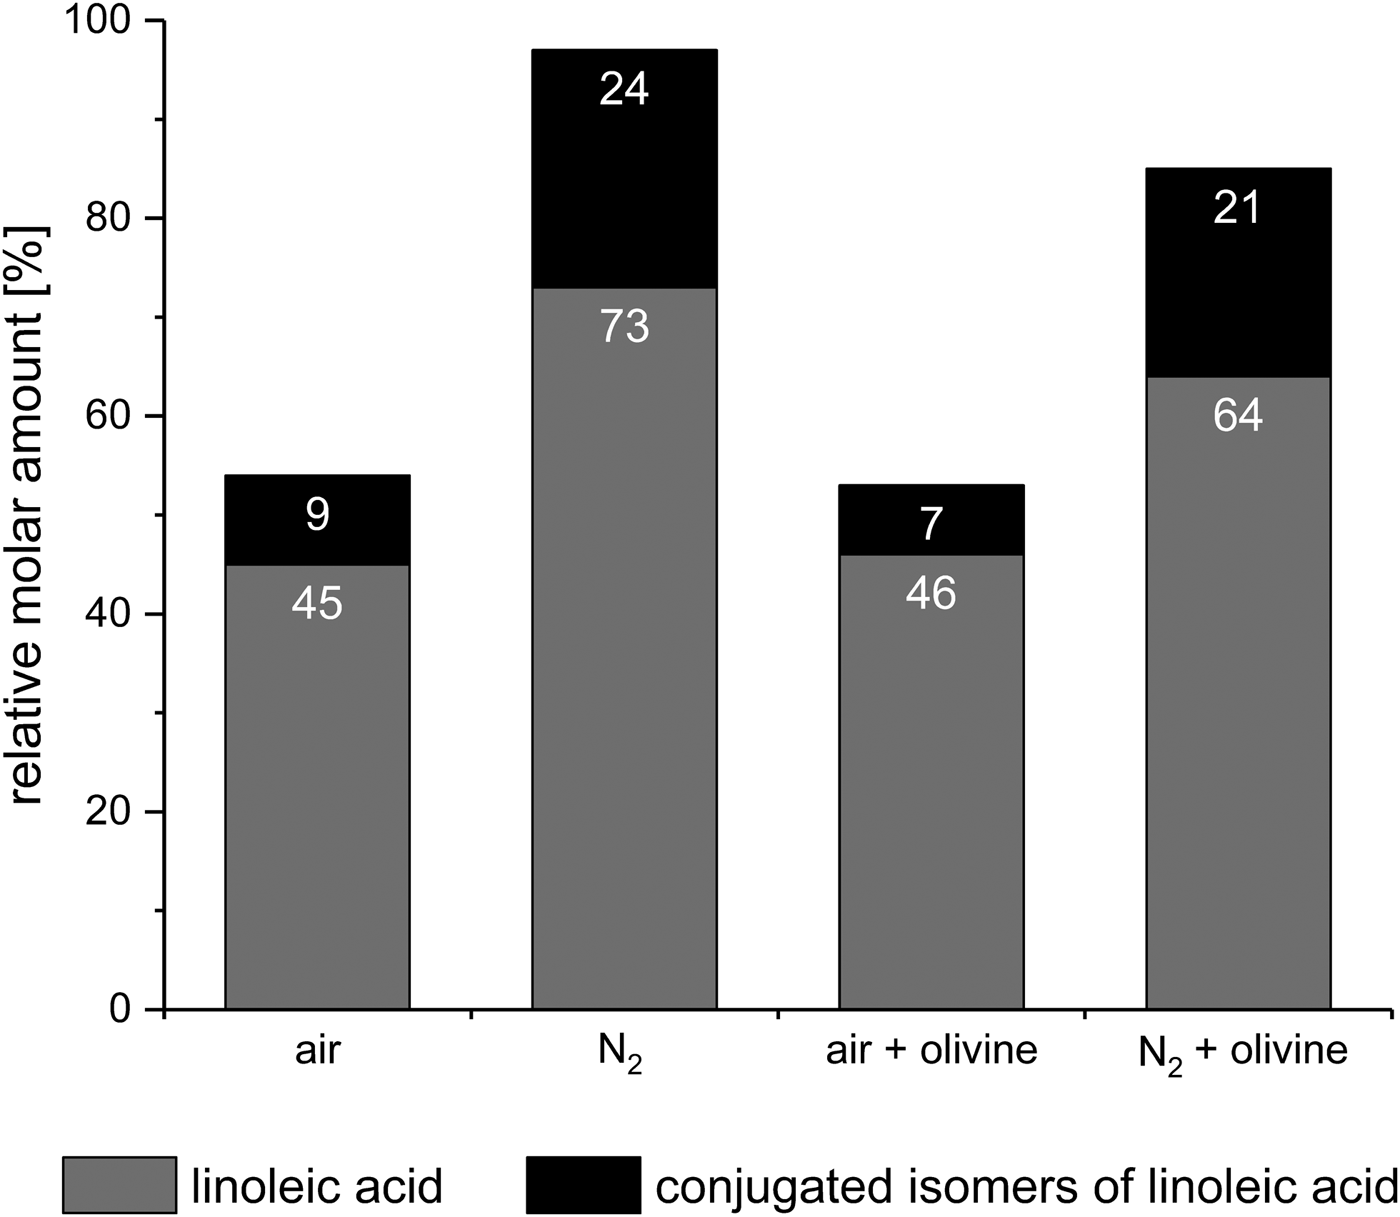
Fig. 9. Stability of linoleic acid [(9Z,12Z)-9,12-octadecadienoic acid] after eight wet‒dry cycles under various conditions. The amounts of survived linoleic acid and formed conjugated isomers (9,11- and 10,12-octadecadienoic acid) are given relative to the initial amount of linoleic acid.
Next, we tried to repeat the above experiment under anaerobic conditions using a stream of nitrogen as in the glycine experiments. However, the gas stream caused the linoleic acid to spread in the whole apparatus, making a quantitative extraction virtually impossible. Therefore, the WDA had to be modified with a pressure relief valve to enable the use of a static nitrogen atmosphere (see the section Materials and methods). With this modification, spreading of the linoleic acid no longer occurred. After eight wet–dry cycles under a static nitrogen atmosphere, the residue was still colourless, even though only 73% of the initial amount of linoleic acid were left (Fig. 9). This can be explained by the fact that the amount of conjugated isomers formed was much higher than in the previous experiment (24% versus 9%). Considering both linoleic acid and its conjugated isomers, only a total of 3% of the starting material were decomposed – compared with 46% in the experiment in the air. This result shows that in the absence of oxygen linoleic acid is quite stable against decomposition, but not against isomerization, under wet–dry cycling conditions. The experimental data also suggest that the oxidative decomposition may be faster than the isomerization.
In further experiments, the effects of olivine on the stability of linoleic acid were investigated. After eight wet–dry cycles in air, a linoleic acid‒olivine mixture left a brown residue whose GC-MS analysis showed that 46% of the linoleic acid had survived and 7% had formed the conjugated isomers (Fig. 9). These values were not significantly different from those obtained in the experiment in the air without olivine (45% and 9%, respectively). Consequently, one might not expect olivine to have an effect in a nitrogen atmosphere either. However, a slightly brown residue was obtained with olivine after eight wet–dry cycles under nitrogen atmosphere – in contrast to the experiment without olivine, where the residue was colourless. Overall, 85% of the starting material had survived unaltered (64%) or been transformed into the conjugated isomers (21%, Fig. 9). This is 12% less than in the experiment without olivine. Thus, against expectation, olivine affected the decomposition.
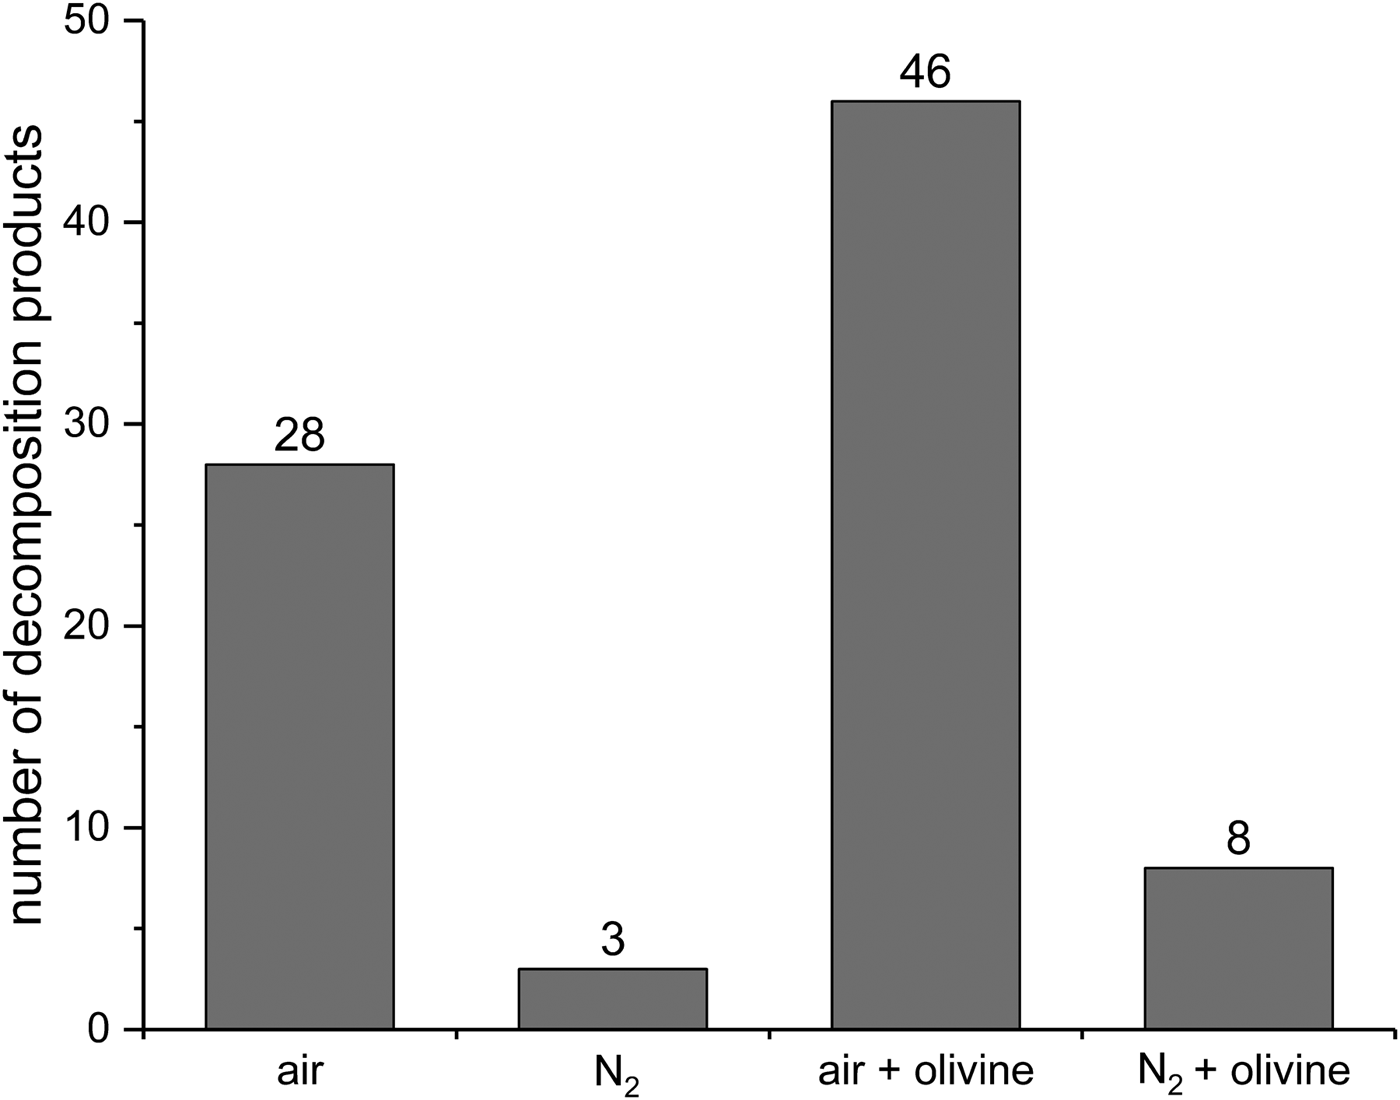
To obtain a better understanding of the effect of olivine we analyzed by GC-MS the volatile products from all four experiments (air, N2, air + olivine and N2 + olivine). As an overview, first, the number of decomposition products was determined (Fig. 10). In the air, many more products were formed than under nitrogen atmosphere (28 versus 3). This is in accordance with the substantially higher decomposition rate observed in air. Under nitrogen, the presence of olivine increased the number of decomposition products from three to eight, again in accordance with the decomposition rates. This effect of olivine was much more pronounced in the air. Here, the addition of the mineral strongly increased the number of decomposition products from 28 to 46. This influence is not reflected in the decomposition rates in the air, which were virtually the same with and without olivine (see above). These observations show that olivine intervenes in the decomposition mechanism. One may assume that interactions with the mineral surface open additional reaction paths for radicals, which are known to be involved in the decomposition of linoleic acid. We did not pursue this idea further because the main focus of this work is the WDA and its possible applications.
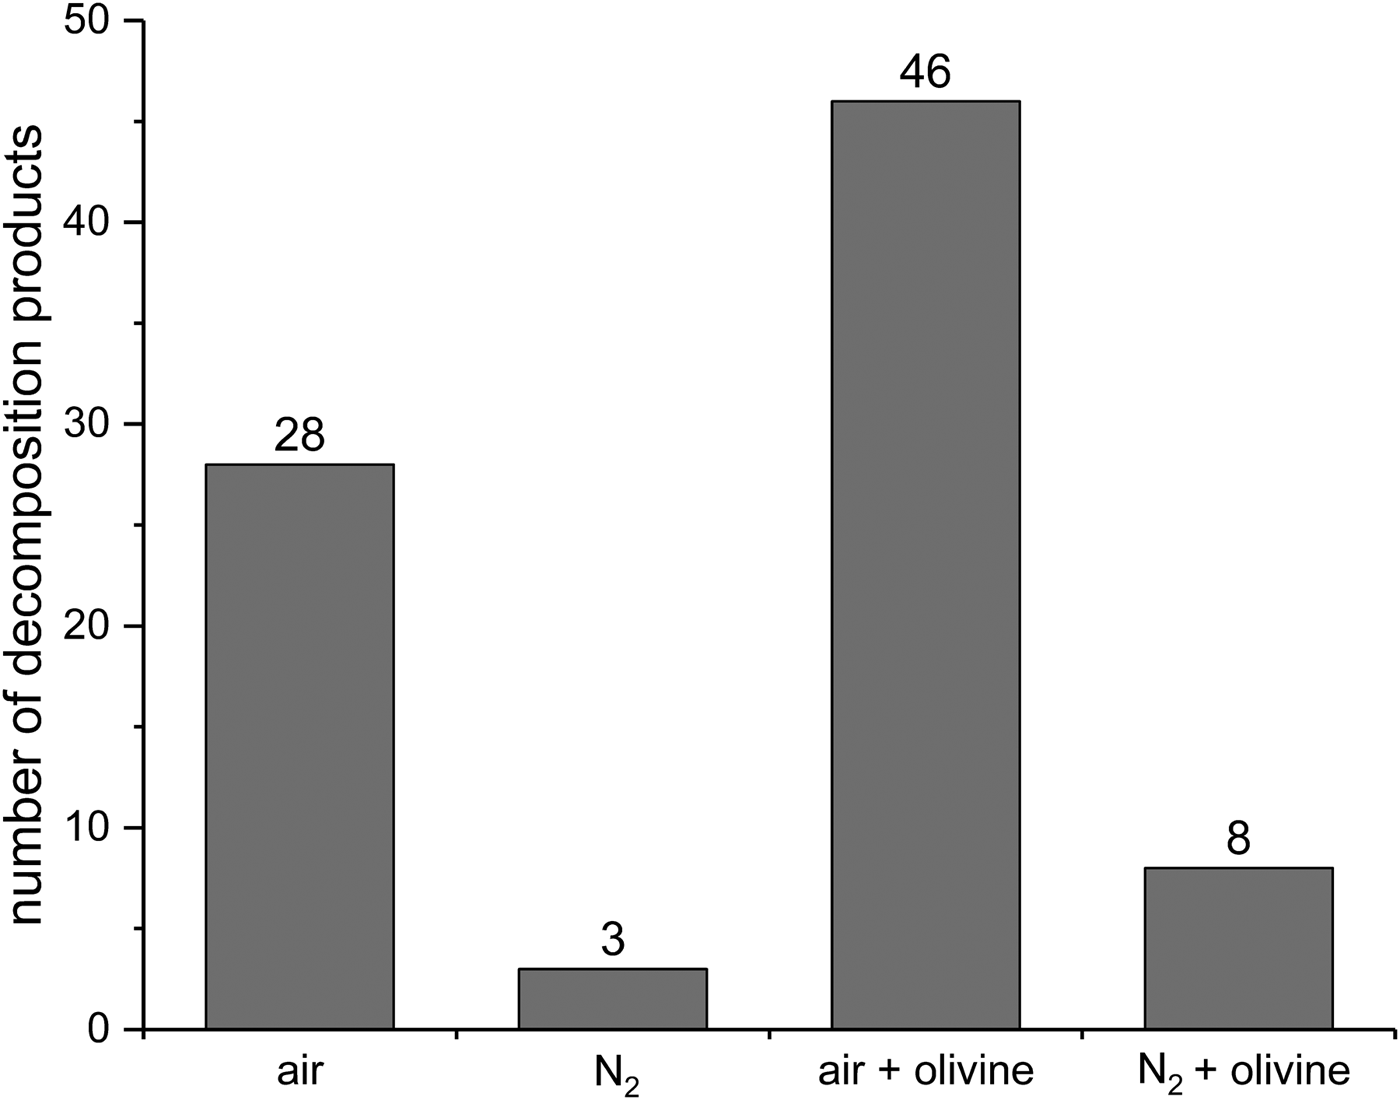
Fig. 10. Number of decomposition products formed from linoleic acid in eight wet‒dry cycles under various conditions. Only products with a GC peak area >0.5% of the total area were taken into account. Individual products that could be identified are listed in Table 2.
Up to ten individual volatile decomposition products could be identified (Table 2). For an overview of typical volatile oxidation products from linoleic acid and the mechanisms of their formation, see, for example, Frankel (Reference Frankel1982). These compounds are secondary products that usually form from the initially formed hydroperoxides. Hexanal, 2,4-decadienal and 9-oxononanoic acid were present in all samples. Indeed, they belong to the most abundant oxidation products mentioned by Frankel (Reference Frankel1982). Octanoic acid occurred in three of the four experiments; it could not be detected only in the residue obtained after wet–dry cycling under nitrogen without olivine. Nonanedioic acid was the only compound identified that was not listed by Frankel (Reference Frankel1982). This product occurred only in the experiment with olivine in the air. Obviously, the mineral was responsible for its formation, possibly by promoting the oxidation of 9-oxononanoic acid. Even in the experiment under nitrogen without olivine, three typical oxidation products were found, namely hexanal, 2,4-decadienal and 9-oxononanoic acid. This, together with a slight decomposition (3%, see above), indicates that minor oxidation has occurred. The residual oxygen (3 ppm) present in the nitrogen gas or atmospheric oxygen that diffused into the WDA (and, as a result of the static nitrogen atmosphere, was not removed) may have caused the oxidation in this case. Furthermore, the 3% decomposition may, at least in part, be attributed to the derivatization process for linoleic acid and its isomers which was carried out in the air. The same considerations apply to the experiment under nitrogen with olivine. In this case, however, olivine clearly exerted an additional influence reflected in a more complex mixture of decomposition products (Fig. 10).
In the absence of olivine, the potential prebiotic amphiphile linoleic acid proved relatively resistant to wet–dry cycling in an oxygen-free atmosphere, except that it formed larger amounts of two of its conjugated isomers. The virtual absence of oxygen in early Earth's atmosphere and the potential influence of minerals should always be considered in experiments simulating the conditions in prebiotic rock pools. If, for example, the above experiments had only been conducted in air, one would have concluded that olivine had no effect, because the survival rate of linoleic acid was independent of the presence of olivine (46% and 45% with and without olivine, respectively; Fig. 9). The experiments under nitrogen, however, revealed that olivine significantly affected the decomposition, as already discussed.
Rocks, minerals and other solids and, as demonstrated in the linoleic acid experiments, with slight technical modifications also liquid organics can be used in the WDA. These features make the apparatus suitable for studying mixtures that closely simulate the probable contents of primordial rock pools. The 99.999% N2 used in the test applications I and II should be sufficiently oxygen-free for most applications of the WDA. However, in the experiment with linoleic acid under nitrogen, minor oxidation was observed (see above). Hence, more sensitive compounds may require an atmosphere with less residual oxygen. In the following, we describe how virtually complete exclusion of oxygen can be achieved by a simple means.
Test application III. Alkaline pyrogallol solution
In order to assess the importance of residual oxygen in the aqueous phase, we monitored the dissolved oxygen concentration in pure water during wet–dry cycling using an oxygen meter. Prior to deaeration, the water contained 4.15 mg O2 l–1. After deaeration, the oxygen concentration was below 0.01 mg l–1 (0.3 µmol O2 l–1), which was the detection limit of the instrument. With this deaerated water four wet–dry cycles with a total duration of 24 h were performed in the WDA in a stream of 99.999% N2 (3.6 l h–1). At the start of the wet phase immediately following the end of the fourth cycle, the oxygen concentration was still below 0.01 mg l–1. To check the measurement process, 1 ml of air (corresponding to 0.01 mmol of O2) was injected against a countercurrent of nitrogen next to the oxygen sensor. This increased the dissolved oxygen concentration up to 0.15 mg l–1 for a short time. Then the concentration decreased again since the nitrogen stream removed the oxygen from the WDA.
In addition to the physical measurement of the residual oxygen, we used alkaline pyrogallol solution as a highly sensitive O2 colour indicator. This solution reacts quantitatively with O2 – therefore it can be used for the purification of gases and removal of oxygen – and changes colour from colourless to red-brown or dark brown in the presence of O2 (Shriver & Drezdzon Reference Shriver and Drezdzon1986). Pyrogallol reacts with oxygen to form a complex mixture of products, among them the dark coloured purpurogallin (Fig. 11, Abrash et al. Reference Abrash, Shih, Elias and Malekmehr1989). Therefore pyrogallol allows the detection of traces of oxygen with the naked eye. O2 amounts as low as 0.35 µmol (8 µl) have been determined using a photometer (Duncan et al. Reference Duncan, Harriman and Porter1979).

Fig. 11. Reaction scheme for the formation of purpurogallin (2,3,4,6-tetrahydroxybenzocyclohepten-5-one) by air oxidation of an alkaline solution of pyrogallol (Abrash et al. Reference Abrash, Shih, Elias and Malekmehr1989).
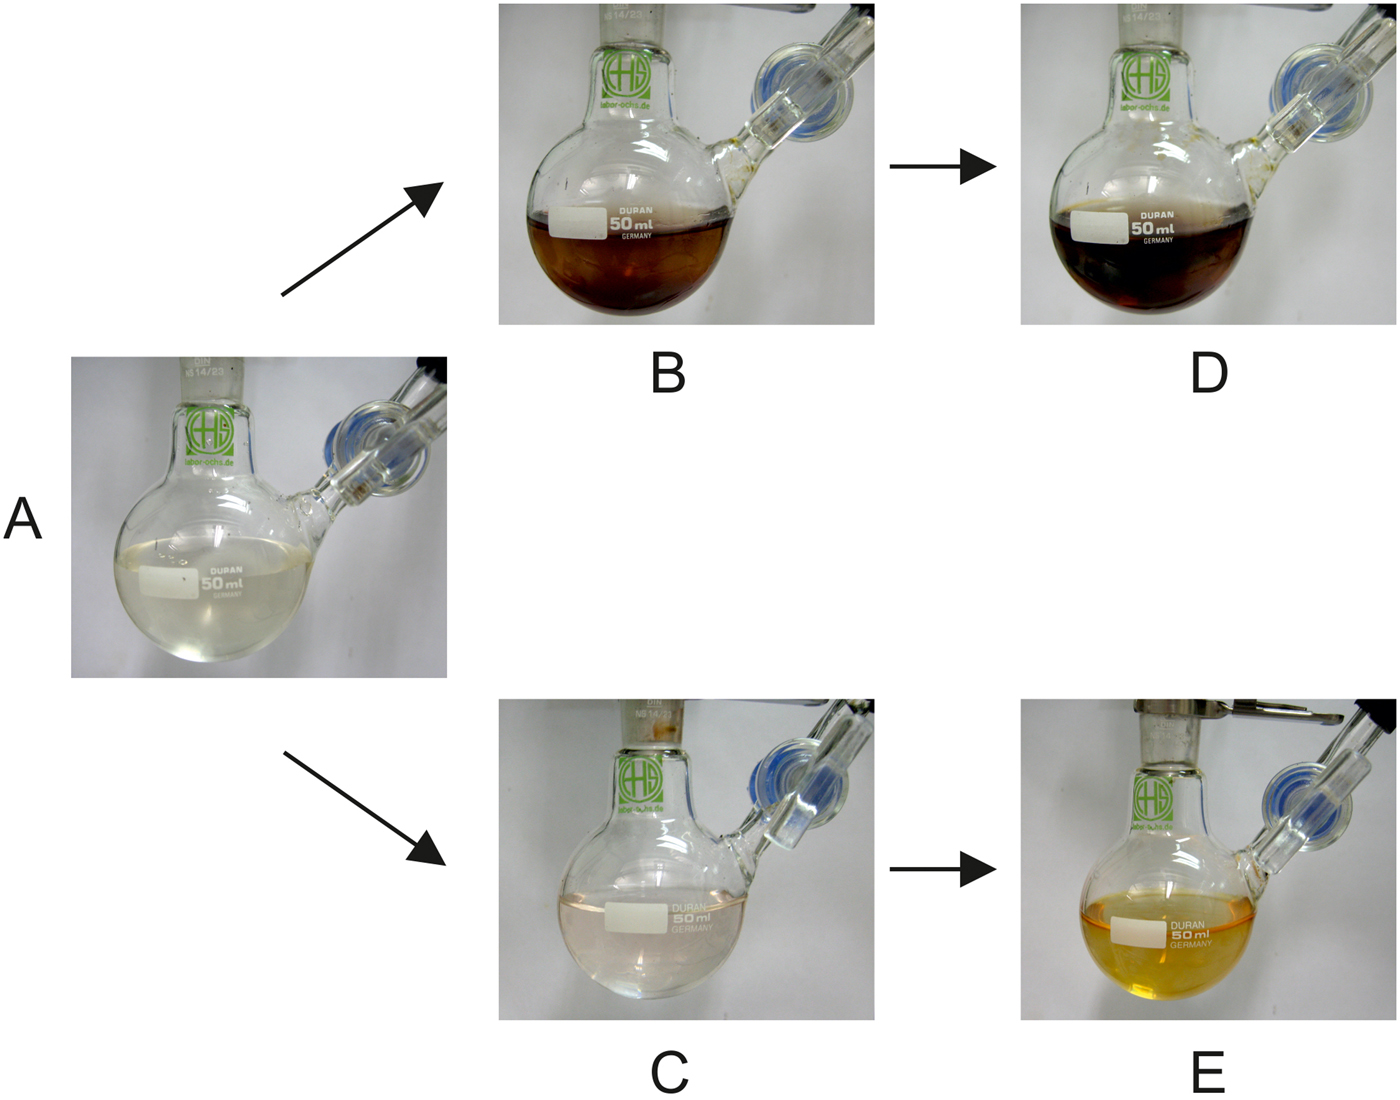
We performed an experiment in which alkaline pyrogallol solution was exposed to four wet–dry cycles in a stream of 99.999% N2 (ca. 72 l h–1; for further experimental details, see Materials and methods). Photographs of the solution were taken before the cycles were started, after four cycles at the beginning of the fifth wet phase and after injection of 1 ml of air (Fig. 12(A, B and D), respectively). After four cycles, the initially colourless solution had turned brown (Fig. 12(B)), indicating a reaction with oxygen. The subsequent injection of 1 ml of air (corresponding to 0.01 mmol of O2) caused only a slight colour intensification (Fig. 12(D)). This result was surprising because the WDA had been carefully checked for tightness before starting the experiment. In addition, the high nitrogen flow rate prevented any negative pressure. However, it was precisely this high flow rate that caused the oxidation! According to the manufacturer, the nitrogen used contained 3 vol ppm oxygen (Westfalen AG Reference Westfalen2017). This means that ca. 5 ml (0.2 mmol) of O2 entered the apparatus during the 24-h duration of the experiment, enough to cause the brown colour.

Fig. 12. (A) Pyrogallol starting solution. (B) After four cycles for 24 h under 99.999% N2. (C) After four cycles for 24 h under 99.999% N2 that had been passed through two pyrogallol solutions before entering the WDA. (D, E) After insertion of 1 ml of air into the solutions shown in B and C, respectively.
The previous experiment was repeated, but now the nitrogen was passed through two gas washing bottles in series, each containing strongly alkaline pyrogallol solution to remove the residual oxygen. The resulting oxygen-free nitrogen was used in the experiment. Again, photographs of the flask were taken before the cycles were started, after four cycles at the beginning of the fifth wet phase and after injection of 1 ml of air (Fig. 12(A, C and E), respectively). After four cycles, the solution was still almost colourless (Fig. 12(C)), indicating that during the experiment the O2 concentration in the WDA was negligible. Only when 1 ml of air (0.01 mmol of O2) was injected directly into the solution, a colour change to light brown/dark yellow was observed (Fig. 12(E)). This experiment proved that when the nitrogen used is thoroughly freed of O2, even extremely oxygen-sensitive compounds can be wet–dry cycled in the WDA.
Concluding remarks
In summary, we have shown that our novel apparatus is well suited for the automated performance of prebiotic wet‒dry experiments. The parameters that are characteristic of fluctuating environments in primordial rock pools – for example, the duration of the wet–dry cycles, the temperature and the organic and mineral content – can be adjusted over a fairly wide range. Another key feature is that the experiments can be conducted in a strictly oxygen-free atmosphere. We tested the apparatus on three chemical systems, namely (i) the amino acid glycine with and without clay minerals, (ii) the oxygen-sensitive amphiphile linoleic acid in air and under nitrogen and with and without olivine, and (iii) an extremely oxygen-sensitive alkaline solution of pyrogallol. In addition, the apparatus has been used in a study on the prebiotic formation of iron porphyrins (Pleyer et al. manuscript in preparation).
Currently, eight identical WDAs are operated in our laboratory. They are embedded in an infrastructure of analytical tools, for example (chiral) GC-MS, HPLC-DAD/ELSD/CD, X-ray powder diffractometry and infrared and UV/Vis spectroscopy. Also available is an argon-filled glove box (<1 ppm O2) in which oxygen-sensitive starting materials can be placed into the flask of the WDA and the reaction products can be isolated and prepared for analyses. This facility can be made available to researchers from other institutions who are interested in performing wet‒dry experiments.
Supplementary material
The supplementary material for this article can be found at https://doi.org/10.1017/S1473550418000010.
Acknowledgements
We are grateful to Sonja Ringer for technical assistance. HLP thanks the State of Baden-Württemberg for an LGFG doctoral fellowship.


