1. Introduction
Defant & Drummond (Reference Defant and Drummond1990) first used the term adakite for a group of rocks with high Sr/Y (> 20) and La/Yb (> 20) ratios; high SiO2 (≥ 56 wt%) and Al2O3 (≥ 15 wt%) contents; low MgO (≤ 6 wt%), Y (≤ 18 ppm) and Yb (≤ 1.8 ppm) contents; and low 87Sr/86Sr ratios (< 0.7040) without remarkable negative Eu anomaly. Adakitic rocks are widely distributed across the Sanandaj–Sirjan zone (SaSZ) and the Urumieh–Dokhtar Magmatic Arc (UDMA) (Fig. 1). A growing body of research has shown that most adakitic magmas in Iran formed by direct melting of the subducted oceanic slab (Fig. 1), such as post-collisional late Miocene adakitic dacites to rhyodacites in north Tabriz, NW Iran (Jahangiri, Reference Jahangiri2007); late Miocene and Quaternary adakitic andesites at Salafchegan and Anar area, central UDMA (Omrani et al. Reference Omrani, Agard, Witechurch, Benoit, Prouteau and Jolivet2008); Eocene adakitic andesites at Tafresh area (Ghorbani & Bezenjani, Reference Ghorbani and Bezenjani2011); the Paleocene Bibi–Maryam adakitic pluton at Sistan, 40 km NE of Nehbandan (Delavari et al. Reference Delavari, Amini, Schmitt, McKeegan and Harrison2014); Cretaceous–Eocene plutonic and volcanic adakitic rocks in the Sabzevar zone (Fig. 1), NE Iran (Omrani, Reference Omrani2018); late Paleocene adakitic felsic intrusions of the Sabzevar zone (Rossetti et al. Reference Rossetti, Nasrabady, Theye, Gerdes, Monié, Lucci and Vignaroli2014); Eocene intermediate to felsic intrusive and volcanic adakitic rocks at the Sabzevar zone (Shafaii Moghadam et al. Reference Shafaii Moghadam, Rossetti, Lucci, Chiaradia, Gerdes, Lopez Martinez, Ghorbani and Nasrabady2016); and Eocene adakitic rhyolites to andesites of the Sabzevar zone (Jamshidi et al. Reference Jamshidi, Ghasemi, Laicheng and Sadeghian2018).

Fig. 1. Simplified geological and tectonic zones of Iran (modified after Richads et al. 2012). Location of the Hamedan–Tabriz volcanic belt (HTV) in NW Iran (after Azizi & Moinvaziri, Reference Azizi and Moinevaziri2009). Location of the Sari Gunay epithermal gold deposit and Moho profile from Mehran to Lahijan (A–B section). Locations with adakitic rocks in Iran mentioned in the text are as follows: Salafchegan (Qom) and Anar (Omrani et al. Reference Omrani, Agard, Witechurch, Benoit, Prouteau and Jolivet2008), Tafresh (Ghorbani & Bezenjani, Reference Ghorbani and Bezenjani2011), Ghroveh–Bijar (Azizi et al. Reference Azizi, Asahara, Motohiro, Takemura and Razyani2014 a; Torkian et al. Reference Torkian, Furman, Salehi and Veloski2019), Saqqez–Takab (Azizi et al. Reference Azizi, Hadad, Stern and Asahara2019 a), Tabriz (Jahangiri, Reference Jahangiri2007), Arasbaran (Jamali et al. Reference Jamali, Dilek, Daliran, Yaghubpur and Mehrabi2010; Jamali & Mehrabi Reference Jamali and Mehrabi2015), Bibi–Maryam (Nehbandan area) (Delavari et al. Reference Delavari, Amini, Schmitt, McKeegan and Harrison2014), Sabzevar area (Rossetti et al. Reference Rossetti, Nasrabady, Theye, Gerdes, Monié, Lucci and Vignaroli2014; Shafaii Moghadam et al. Reference Shafaii Moghadam, Rossetti, Lucci, Chiaradia, Gerdes, Lopez Martinez, Ghorbani and Nasrabady2016) and Meiduk (Alirezaei et al. Reference Alirezaei, Arvin and Dargahi2017).
A few adakitic rocks in Iran were regarded as products of different magmatic processes. For example, the middle Miocene adakitic quartz diorite, granodiorite and diorite stocks of the Meiduk and Parkam porphyry copper deposits (NE of Shahr-e-Babak) are considered to be derived from melting of thickened continental crust and lithospheric mantle (Alirezaei et al. Reference Alirezaei, Arvin and Dargahi2017) (Fig. 1). In addition, Miocene intermediate to acidic volcanic adakitic rocks of the Sheyda Volcano in the Ghorveh area (SaSZ and NW Iran) originated from melting of metasomatized continental lithosphere (Torkian et al. Reference Torkian, Furman, Salehi and Veloski2019) (Fig. 1). Cenozoic calc-alkaline adakite-like magmas of the Arasbaran belt (Fig. 1) originated from partial melting of peridotites, while Neogene magmas of this belt were generated by partial melting of garnet-bearing hydrous amphibolite at the lower crust (Jamali & Mehrabi, Reference Jamali and Mehrabi2015). Furthermore, the adakites in the northern SaSZ originated from melting of the metasomatic mantle wedge above the oceanic slab, accompanied by minor assimilation of lower mafic calc alkaline continental crust (Azizi et al. Reference Azizi, Asahara, Motohiro, Takemura and Razyani2014 a, Reference Azizi, Zanjefili-Beiranvand and Asahara2015).
Numerous researchers have postulated a genetic relation between adakitic melts and the generation of porphyry Cu-Au deposits (Sajona & Maury, Reference Sajona and Maury1998; Castillo, Reference Castillo2012; Richards et al. Reference Richards, Spell, Rameh, Razique and Fletcher2012; Lohmeier et al. Reference Lohmeier, Schneider, Belyatsky and Lehmann2019). A genetic relationship between adakitic melts and porphyry Cu-Au deposits is well recognized in Iran (Jamali et al. Reference Jamali, Dilek, Daliran, Yaghubpur and Mehrabi2010; Aghazadeh et al. Reference Aghazadeh, Castro, Badrzadeh and Vogt2011; Asadi et al. Reference Asadi, Kianpouryan, Lu and McCuaig2014; Jamali & Mehrabi, Reference Jamali and Mehrabi2015; Alirezaei et al. Reference Alirezaei, Arvin and Dargahi2017). Furthermore, a genetic relation seems to exist between the adakitic volcanic rocks and the Au deposit in the Sari Gunay area, which is the subject of the present study. Here we employ laser ablation inductively coupled plasma mass spectrometry (LA-ICP-MS) zircon U–Pb dating and whole-rock chemical analyses of adakitic rocks from Sari Gunay epithermal gold deposit in the northwestern part of the SaSZ. Based on our new results and previously published studies, we suggest a new geodynamic model for the genesis of the adakitic host rocks and their relation to the Sari Gunay epithermal gold deposit.
2. Geological setting
The Zagros orogen is composed of three parallel NW–SE-trending tectonic zones (Alavi, Reference Alavi1994; Mohajjel et al. Reference Mohajjel, Fergusson and Sahandi2003), namely the Zagros Fold and Thrust Belt, the SaSZ and the Tertiary–Quaternary UDMA (Fig. 1). The orogen formed as a result of Neotethys Ocean closure and the collision between the Arabian and the central Iranian microplates (Dewey et al. Reference Dewey, Pitman, Ryan and Bonnin1973; Berberian & King, Reference Berberian and King1981; Alavi, Reference Alavi1994; Hassanzadeh & Wernicke, Reference Hassanzadeh and Wernicke2016; Barber et al. Reference Barber, Stockli, Horton and Koshnaw2018; Tavakoli et al. Reference Tavakoli, Davoudian, Shabanian, Azizi, Neubauer, Asahara and Bernroider2020). The opening of the Neotethys Ocean resulted from rifting of the Cimmerian block (ancient continent including the SaSZ and Central Iran) away from the northern margin of Gondwana. The Neotethys oceanic crust started to be subducted beneath Eurasian during Early Jurassic or Late Triassic time (Stampfli & Borel, Reference Stampfli and Borel2002; Hassanzadeh & Wernicke, Reference Hassanzadeh and Wernicke2016). The final closure of the Neotethys and the collision of the Arabian and Eurasia plates occurred during late Oligocene – early Miocene (Berberian et al. Reference Berberian, Muir, Pankhurst and Berberian1982; Mouthereau et al. Reference Mouthereau, Lacombe and Vergés2012) and/or early Miocene (Allen et al. Reference Allen, Jackson and Walker2004), early–middle Eocene (Ghasemi & Talbot, Reference Ghasemi and Talbot2005), or Late Cretaceous – Oligocene (Mohajjel & Fergusson, Reference Mohajjel and Fergusson2014) time.
In the study area, the SaSZ basement is composed of Neoproterozoic – early Cambrian biotite–hornblende granodiorite (Hassanzadeh et al. Reference Hassanzadeh, Stockli, Horton, Axen, Stockli and Grove2008). The basement of the SaSZ is also present as crustal xenoliths in the Qezeljeh Kand Plio-Quaternary volcanic cones (Veysi et al. Reference Veysi, Asiabanha, Shahbazi and Nasrabadi2015) 20 km NW of the Sari Gunay area. Carboniferous – early Permian A-type granitoids, such as the Hasanrobat, Ghushchi and Hasansalaran granites in the Golpaygan area, are associated with the early-stage Neotethys opening (Alirezaei & Hassanzadeh, Reference Alirezaei and Hassanzadeh2012; Shafaii Moghadam et al. Reference Shafaii Moghadam, Li, Ling, Stern, Santos, Meinhold, Ghorbani and Shahabi2015; Azizi et al. Reference Azizi, Kazemi and Asahara2017), whereas Middle Jurassic – Early Cretaceous gabbroic to granitoid plutonic rocks are related to the subduction of Neotethys Ocean (Shahbazi et al. Reference Shahbazi, Siebel, Pourmoafee, Ghorbani, Sepahi, Shang and Vousoughi Abedini2010, Reference Shahbazi, Siebel, Ghorbani, Pourmoafee, Sepahi, Vousoughi Abedini and Shang2015; Azizi et al. Reference Azizi, Asahara, Mehrabi and Chung2011, Reference Azizi, Hadad, Stern and Asahara2019 a, b). Based on regional geological maps (Khan Nazar et al. Reference Khan Nazar, Jalali, Saidi, Helmi, Mohtat, Bahreh, Zohrab, Ghaemi and Haddadan2015), Triassic Alisadr Limestone and the Jurassic Hamedan Phyllite are the oldest rocks in the study area (Fig. 2).

Fig. 2. Geological map of the Sari Gunay epithermal gold deposit area Sanandaj–Sirjan zone (SaSZ), NW Iran, and sampling locality, redrawn from Geological Map of Iran 1:100 000 Series Sheet No. 5660 (Kohin) Geological Survey and Mineral Exploration of Iran (Khan Nazar et al. Reference Khan Nazar, Jalali, Saidi, Helmi, Mohtat, Bahreh, Zohrab, Ghaemi and Haddadan2015).
The Hamedan–Tabriz Volcanic belt (HTV belt) occupies the NW part of the SaSZ (Fig. 1) and contains extrusive rocks made of ash flows, lava flows, lahars and pyroclastic rocks with massive to flow banding structure. Some Miocene volcanic rocks in the HTV belt have adakitic features (Jahangiri, Reference Jahangiri2007; Azizi et al. Reference Azizi, Asahara, Motohiro, Takemura and Razyani2014 a, b; Lechmann et al. Reference Lechmann, Burg, Ulmer, Guillong and Faridi2018; Torkian et al. Reference Torkian, Furman, Salehi and Veloski2019). The southern HTV belt (Ghorveh and Bijar area; see Fig. 1) includes two different groups of volcanic rocks. The first group consists of Miocene intermediate to felsic rocks while the second group includes high-Nb Quaternary basaltic rocks (Boccaletti et al. Reference Boccaletti, Innoncenti, Manetti, Mazzuoli, Motamed, Paquare, Radicati de Brozolo and Amin Sobhani1976; Azizi & Moinevaziri, Reference Azizi and Moinevaziri2009; Azizi et al. Reference Azizi, Asahara, Motohiro, Takemura and Razyani2014 a, b). There are no Eocene volcanic rocks in the HTV belt, while middle Miocene – Plio-Quaternary volcanic rocks are well developed (Azizi & Moinevaziri, Reference Azizi and Moinevaziri2009).
The Sari Gunay epithermal gold deposit has been investigated in previous studies. Biotite and hornblende 40Ar/39Ar dating (Richards et al. Reference Richards, Wilkinson and Ullrich2006) has shown that the host rock of the Sari Gunay deposit formed as a collision-related alkalic-type epithermal system during middle–late Miocene time (Tortonian) at 11.2 Ma (Table 1). Sericite 40Ar/39Ar dating (Richards et al. Reference Richards, Wilkinson and Ullrich2006) indicates that sericitic alteration, silicification and Au mineralization happened during a late hydrothermal stage at 10.5 Ma (Table 1). As shown in Table 1, the late Miocene (Tortonian) adakitic rocks at the Sari Gunay gold deposit formed contemporaneously with adakites in the Ghorveh–Bijar area, such as the Akhikamal volcanic dome with an age of 10.4 Ma, 45 km NW of the Sari Gunay area (Boccaletti et al. Reference Boccaletti, Innoncenti, Manetti, Mazzuoli, Motamed, Paquare, Radicati de Brozolo and Amin Sobhani1976; Azizi et al. Reference Azizi, Asahara, Motohiro, Takemura and Razyani2014 a). Initial 87Sr/86Sr ratios of the adakites in the Ghorveh–Bijar area are relatively high (0.7070–0.7079) and they depict low ϵ(t)Nd values between −4 and −2 (Azizi et al. Reference Azizi, Asahara, Motohiro, Takemura and Razyani2014 a). Such isotope features indicate that the rocks were derived from partial melting of lower continental crust and/or a metasomatized lithospheric mantle.
Table 1. Summary of K–Ar, 40Ar–39Ar and zircon U–Pb age data of the Miocene volcanic rocks from the Sari Gunay gold deposit and the Ghorveh-Bijar area, Sanandaj–Sirjan zone, NW Iran

3. Field relations and petrography
3.a. Field relations
In the study area, Miocene volcanic rocks are exposed as part of a composite volcano in the form of small domes consisting of andesite, latite, trachyte, dacite and rhyolite (Fig. 3a–c). The Sari Gunay volcanic complex contains extrusive rocks including ash and lava flows, lahars and pyroclastic rocks with massive to flow banding structure (Fig. 2). The Sari Gunay epithermal gold deposit occurs at a NNE–SSW-trending volcanic hillside, about 1.2 km long and 450 m wide, and extends vertically down at least 300 m (Fig. 4a–c). The deposit consists of a central high-grade mineralized zone, about 75 m wide with a maximum width of 150 m, and two smaller high-grade zones (Wilkinson, Reference Wilkinson2005). These are in turn surrounded by a low-grade mineralized halo (Fig. 4a–d). Average gold grade is about 2–2.5 g t–1 Au in the high-grade mineralized zones and 0.7–0.8 g t–1 Au in the lower-grade halo zone. Based on core logging observations in the Sari Gunay gold deposit, the high-grade zones, represented by tourmaline-quartz breccia units, have formed during hydrothermal alteration associated with silicification. Sericite is also developed in this zone but it has either little or no gold. A weak hypogene copper mineralization is located beneath the main epithermal mineralization and starts about 300 m below the surface. Average grade in this zone is 0.1–0.2% Cu and 0.3–0.6 g t–1 Au.

Fig. 3. Field view of the Sari Gunay epithermal gold deposit. (a, b) Field photographs from the hillside of the Sari Gunay epithermal gold deposit. (c) Locations of samples DKAR11 (rhyolite) and DKAR21 (dacite) chosen for U–Pb dating.

Fig. 4. (a) Plan view of the Sari Gunay gold mine deposit. NW–SE-trending high-grade gold bodies are shown in pink and beige; low-grade gold halo zone shown in light blue and drill-holes lines (blue). (b) 3D view of the high-grade gold ore body (red) Cu-Au, porphyry body (aqua colour), and drill holes lines (blue). (c) Oblique 3D view of Sari Gunay mine with topographic features looking NW. (d) Block model of the central high-grade gold bodies showing gold grade distribution (after Wilkinson, Reference Wilkinson2005).
Based on a recent study by Graniana et al. (Reference Graniana, Tabatabaei, Asadi and Carranza2014), the Sari Gunay epithermal gold deposit shows strong vertical and lateral zonation. It is strongly enriched in Au, Sb and Hg in its central part and in As, Pb, Zn and Cu at its margin. Graniana et al. (Reference Graniana, Tabatabaei, Asadi and Carranza2014) argue that the gold mineralization occurred during two stages: during the first stage, referred to as the sericite alteration phase, gold formed as micro-sized inclusions within pyrite; and during the second stage, the silicification-phase gold formed as a solid solution (invisible gold) within arsenian pyrite.
3.b. Petrography
The volcanic host rocks of the Sari Gunay epithermal gold deposit show some variation ranging from latite, quartz latite to dacite and rhyolite with porphyritic, vitrophyric, trachytic and seriate textures prevailing (Fig. 5). The latites contain plagioclase and K-feldspar phenocrysts in a fine-grained matrix (Fig. 5b, c). Plagioclase phenocrysts are euhedral, show sieve structure in some grains (Fig. 5b) and are 1–2 mm in length (Fig. 5b, c). K-feldspar phenocrysts are present as euhedral to subhedral sanidine, often showing Carlsbad twinning, and are 0.5–1 mm in grain size (Fig. 5c). The quartz latites with porphyritic and vitrophyric textures mainly comprise plagioclase, volcanic glass, K-feldspar, hornblende, biotite and quartz in some rock varieties (Fig. 5d, e). Phenocryst abundances vary from 30 to 40 vol.% in these rocks. Plagioclase phenocrysts show oscillatory zoning in some grains and are 1–1.5 mm in length. Hornblendes are euhedral to subhedral with oxidized rims, rhomboid in shape, 0.5–2 mm in length and with pleochroism ranging in colour from green to brown (Fig. 5d, e). Biotite occurs as phenocryst, 0.5–1.5 mm in size (Fig. 5d). The dacites have glomeroporphyritic and vitrophyric textures (Fig. 5f–h). Dacites frequently show oscillatory zoning of plagioclase and K-feldspar as euhedral sanidine with Carlsbad twinning, 1–2 mm in grain size; accessory minerals are zircon grains and muscovite (Fig. 5f–h). Hydrothermal alterations, such as sericitization of plagioclase, sanidine and matrix are developed in some dacite varieties (Fig. 5f–h). The rhyolites contain quartz and volcanic glass (Fig. 5i–l). Quartz shows rounded forms and sizes ranging from 0.5 to 2 mm with reaction rims (Fig. 5i). The rock matrix consists of glassy, fine-grained minerals containing quartz, opaque minerals and muscovite. Some pronounced hydrothermal alterations such as silicification (Fig. 5j–l) and tourmalinization with formation of radiated aggregates or small single prisms of tourmaline usually associated with quartz (Fig. 5j, k) can be observed in the rhyolitic host rocks of Sari Gunay gold deposit.

Fig. 5. Field photographs and photomicrographs of adakitic rocks from Sari Gunay: (a) sanidine phenocryst in a dacite; (b) sieve texture of plagioclase phenocryst in latite sample; (c) seriate textures in latite; (d) porphyritic texture, plagioclase, biotite and hornblende phenocrysts set in a quartz latite fine-grained matrix; (e) vitrophyric texture and zoning of plagioclase and hornblende phenocrysts in quartz latite; (f) glomeroporphyritic texture and oscillatory zoning of plagioclase in dacite; (g) sericitized K-feldspar phenocrysts (sanidine) with euhedral shape and Carlsbad twins in a dacite; (h) zircon grain and sericitization and devitrified glass in dacite matrix; (i) quartz phenocrysts in a rhyolite; (j, k) radial euhedral tourmaline aggregates in rhyolites; and (l) silicification relationships in a rhyolite sample. Pl – plagioclase; Hbl – hornblende; Kfs – K-feldspar; Qz – quartz; Ms – muscovite; Tur – tourmaline; Cal – calcite; Zn – zircon (Whitney & Evans, Reference Whitney and Evans2010).
4. Analytical methods
4.a. Whole-rock analytical procedures
Base on petrographic observation, low- to non-altered samples were collected from different types of the host rock (latite, quartz latite, dacite, rhyolite) of the gold deposit (mineralized zone). Three other samples (quartz latite DKAR02 and dacite EN6, EN8) were selected outside the gold mineralized zone for whole-rock geochemical analyses. The sampling locations are shown in Figures 2 and 3c; rock types and the latitude/longitude of the sample localities are listed in Table 2. Before crushing the samples by a jaw crusher, all their oxidized and altered parts were removed. After powdering in an agate mill, the samples were heated in a high-temperature muffle furnace at 1000°C with lithium borate flux. The fused sample was then cooled and dissolved in dilute nitric acid. Major elements were measured by ICP optical emission spectroscopy (ICP-OES) using a Thermo Scientific/iCAP 6000, while trace elements including the rare earth elements were measured by ICP-MS using Perkin Elmer/NexION 300D. STD OREAS 24b, STD OREAS 45e and STD SY-4 were used as standard samples during the measurement. The detection limits were: 0.01% for major oxides; 0.1 ppm for Ta and Ce; 0.01 ppm for Tb, Tm and Cs; 0.05 ppm for Th and Dy; 0.03 ppm for Er and Yb; 0.5 ppm for Ba; 0.1 ppm for Co and Sc; 0.2 ppm for Ni; and 10 ppm for Cr.
Table 2. Major- and trace-element concentrations of the Sari Gunay epithermal gold deposit host rocks

4.b. Zircon preparation and U–Pb analytical techniques
Two samples (rhyolite DKAR11 and dacite DKAR21) were selected from the host rocks of Sari Gunay gold deposit for U–Pb LA-ICP-MS dating. Zircons separation for U–Pb LA-ICP-MS dating was performed at the Department of Geology in Bu-Ali Sina University Hamedan (Iran) using conventional mineral separation techniques, and were mounted on epoxy resin and polished. The polished zircon grains were studied by cathodoluminescence (CL) using a scanning electron microscope (Hitachi S- 3400N) and backscatter imaging at Nagoya University (Japan). A total of 40 spots from 32 zircons of the sample DKAR11 (rhyolite) and 40 spots from 31 zircons of the sample DKAR21 (dacite) were analysed by LA-ICP-MS (Agilent 7700×) connected to laser ablation (NWR213 Electro Scientific Industries) at Nagoya University, Japan. ISOPLOT version 4.15 software (Ludwig, Reference Ludwig2012) was used for U–Pb data evaluation. International reference zircons 91500 of age 1057 ± 14 Ma (Wiedenbeck et al. Reference Wiedenbeck, Hanchar, Peck, Sylvester, Valley, Whitehouse, Kronz, Morishita, Nasdala, Fiebig and Franchi2004) and OD-3 of age 32.8 ± 1.6 Ma (Iwano et al. Reference Iwano, Orihashi, Hirata, Ogasawara, Danhara, Horie, Hasebe, Sueoka, Tamura, Hayasaka and Katsube2013) were used as standard samples during analyses.
5. Results
5.a. Zircon U–Pb analyses
Cathodoluminescence (CL) (Fig. 6a, b) and microscopic images (Fig. 5h) show that the zircon grains have short to medium prismatic euhedral to subhedral shape and magmatic oscillatory textures.

Fig. 6. (a) Cathodoluminescence (CL) images of zircons from sample DKAR11 (rhyolite). (b) CL images from zircons of sample DKAR21 (dacite) with positions of ablation.
5.a.1. Sample DKAR11 (rhyolite)
The Th/U ratios in the zircon grains from sample DKAR11 vary between 0.22 and 0.63 (Table 3), consistent with a magmatic origin. The spot analyses yielded a cluster concordia age of 10.20 ± 0.15 Ma (2σ error; mean squared weighted deviation, MSWD = 0.67) (Fig. 7a) with a weighted mean 206Pb/238U age of 10.10 ± 0.01 Ma (2σ error; MSWD = 1.12) (Fig. 7b). The cores and rims of the zoned zircon grains yield identical ages.
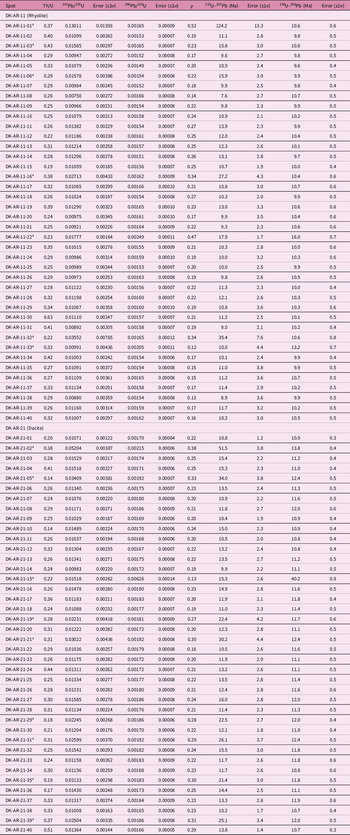
Table 3. U–Pb isotopic data for zircon crystal determined by LA-ICP-MS in volcanic host rocks of the Sari Gunay epithermal gold deposit

aExcluded from Concordia diagram because of the high error.

Fig. 7. Zircon U–Pb concordia diagrams weighted mean ages and 2σ errors for samples (a, b) DKAR11 and (c, d) DKAR21.
5.a.2. Sample DKAR21 (dacite)
LA-ICP-MS U–Pb zircon analyses from dacite sample DKAR21 are listed in Table 3. The data define a cluster concordia age of 11.15 ± 0.19 Ma (2σ error; MSWD = 3.0) (Fig. 7c) and a weighted mean 206Pb/238U age of 11.18 ± 0.14 Ma (2σ error; MSWD = 2.9) (Fig. 7d) showing that these rocks were emplaced during middle–late Miocene time (Tortonian).
5.b. Whole-rock geochemistry
The geochemical data of the Sari Gunay volcanic rocks are listed in Table 2. The rocks are intermediate to felsic in composition with SiO2 ranging from 57.78 to 71.21 wt%. Loss on ignition (LOI) values in the range 1.61–4.62 wt% indicate that the samples were affected by hydrothermal alteration or weathering. The Sari Gunay volcanic rocks are characterized by high ratios of Sr/Y (> 20; average 37.3) and La/Yb (> 20; average, 42.3); high SiO2 (≥ 56 wt%; average, 64.9 wt%) and Sr (≥ 400 ppm; average, 645 ppm); low MgO (≤ 6 wt%; average, 1.11 wt%), Y (≤ 18 ppm; average, 16.5 ppm) and Yb (≤ 1.9 ppm; average, 1.53 ppm); and weak negative Eu anomalies Eu*/ Eu (c. 0.81). As shown in Harker variation diagrams (Fig. 8), they display a decrease in Fe2O3, MgO, CaO, TiO2, P2O5, Ni, Cr, V, Sr, Zr, Eu, Dy, Yb and Y as well as an increase in K2O and Rb concentrations with increasing silica.

Fig. 8. Selected Harker variation diagrams for Sari Gunay adakitic rocks. Open circles are Sari Gunay volcanic samples analysed by Richards et al. (Reference Richards, Wilkinson and Ullrich2006); closed circles are samples analysed in this study.
The Sari Gunay rocks shows enrichment in light rare earth elements (REEs) with respect to the heavy REEs, a flat heavy REEs pattern and a weak negative Eu anomaly Eu*/Eu (c. 0.81) (Fig. 9a). REE patterns of all samples are strongly fractionated (LaN/YbN c. 28). Moreover, a downward concavity of the middle REEs is shown by the pattern (Fig. 9a). In the primitive mantle-normalized multi-element diagram (Fig. 9b), the rocks display relative depletion of high-field-strength elements (HFSE) (i.e. Ti, Nb, Ta, Y, Zr, P).

Fig. 9. (a) Chondrite-normalized REE and (b) primitive-mantle-normalized trace-element patterns for Sari Gunay adakitic rocks and their comparison with post-collisional Miocene ore-bearing adakites (Li et al. Reference Li, Qin, Li, Xiao, Chen and Zhao2011). Normalized values for REE are from Boynton (Reference Boynton and Henderson1984) and normalizing values of the trace elements are from Sun & McDonough (Reference Sun, McDonough, Saunders and Norry1989). Open circles are Sari Gunay volcanic samples analysed by Richards et al. (Reference Richards, Wilkinson and Ullrich2006).
In the AFM (Na2O + K2O; FeO + Fe2O3; MgO) triangular diagram (Fig. 10a), the Sari Gunay adakitic volcanic rocks show a calc-alkaline nature. In the Th versus Co diagram after Hastie et al. (Reference Hastie, Kerr, Pearce and Mitchell2007), the samples show high-K calc-alkaline nature and plot in the andesite dacite and rhyolite fields (Fig. 10b).

Fig. 10. (a) AFM diagram: A (Na2O + K2O), F (FeO + Fe2O3), M (MgO) (Irvine & Baragar, Reference Irvine and Baragar1971); (b) Th versus Co diagram after Hastie et al. (Reference Hastie, Kerr, Pearce and Mitchell2007); (c) R1–R2 diagram after De la Roche et al. (Reference De la Roche, Leterrier, Grandclaude and Marchal1980) for classification of the Sari Gunay adakitic rocks; and (d) Zr/TiO2 versus Nb/Y diagram (after Winchester & Floyd, Reference Winchester and Floyd1977). Open circles are Sari Gunay volcanic samples analysed by Richards et al. (Reference Richards, Wilkinson and Ullrich2006). B – basalt; BA/A – basaltic andesite and andesite; D/R* – dacite and rhyolite (* indicates that latites and trachytes also fall in the D/R fields).
The Sari Gunay adakitic volcanic rocks contain normative orthoclase, quartz, albite, anorthite, hematite, biotite and rare ilmenite and calcite (Table 4). In the R1 (4Si – 11(Na+K) – 2(Fe+Ti)) – R2 (6Ca+2Mg+Al) diagram (De La Roche et al. Reference De la Roche, Leterrier, Grandclaude and Marchal1980), the Sari Gunay volcanic rocks plot in the latite, quartz latite, dacite and rhyolite fields (Fig. 10c). Based on the Nb/Y versus Zr/TiO2 diagram (Winchester & Floyd Reference Winchester and Floyd1977), all except one sample from Sari Gunay plot in the trachyandesite field (Fig. 10d).
Table 4. CIPW normative mineralogy of the Sari Gunay gold deposit volcanic host rocks, Sanandaj–Sirjan zone, NW Iran. All DK-, K- and IR- Sari Gunay volcanic samples were analysed by Richards et al. (Reference Richards, Wilkinson and Ullrich2006).

6. Discussion
6.a. Tectonic discrimination
The Sari Gunay volcanic rocks show some clear similarities to adakites (e.g. high Sr/Y and La/Yb ratios) when plotted on diagrams used for adakitic rocks. Based on the (La)N/(Yb)N versus (Yb)N diagram of Martin (Reference Martin1986) and the La/Yb versus Yb diagram of Castillo et al. (Reference Castillo, Janney and Solidum1999), the rocks plot in the adakite field (Fig. 11a, b). In the Th/Yb versus Th/Sm diagram (Zhu et al. Reference Zhu, Zhao, Pan, Lee, Kang, Liao, Wang, Li, Dong and Liu2009), the Sari Gunay volcanic rocks plot in the field of post-collisional adakites (Fig. 11c). In the Ta versus Yb tectonic discrimination diagram (Pearce et al. Reference Pearce, Harris and Tindle1984), the samples plot in the volcanic arc (VA) and syn-collision (syn-COL) granitoid fields (Fig. 11d). Chondrite-normalized REEs and primitive-mantle-normalized trace-element patterns of the Sari Gunay rocks are comparable with patterns of post-collisional Miocene ore-bearing adakites in Tibet which are associated with ore-deposits (Li et al. Reference Li, Qin, Li, Xiao, Chen and Zhao2011) (Fig. 9a, b).

Fig. 11. Tectonic discrimination diagrams for Sari Gunay adakitic rocks. (a) (La)N/(Yb)N versus (Yb)N diagram after Martin (Reference Martin1986); (b) La/Yb versus Yb diagram after Castillo et al. (Reference Castillo, Janney and Solidum1999); (c) Th/Yb versus Th/Sm diagram (Zhu et al. Reference Zhu, Zhao, Pan, Lee, Kang, Liao, Wang, Li, Dong and Liu2009); and (d) Ta versus Yb tectonic discrimination diagram (Pearce et al. Reference Pearce, Harris and Tindle1984). Open circles are Sari Gunay volcanic samples analysed by Richards et al. (Reference Richards, Wilkinson and Ullrich2006). VAG – volcanic-arc granites; WPG – within-plate granites; ORG – ocean ridge granites; syn-COLG – syn-collision granites.
6.b. Petrogenesis and geodynamic setting
Based on major- and trace-element characteristics, adakites can be classified into four groups with respect to their sources: (1) those derived from melting of a young and hot subducted oceanic slab consisting of metamorphosed basalt (amphibolite or eclogite) (Defant & Drummond, Reference Defant and Drummond1990; Castillo et al. Reference Castillo, Janney and Solidum1999; Martin, Reference Martin1999; Castillo, Reference Castillo2012; Rossetti et al. Reference Rossetti, Nasrabady, Theye, Gerdes, Monié, Lucci and Vignaroli2014; Omrani, Reference Omrani2018); (2) those derived by melting of a delaminated or thickened lower mafic crust in the stability field of clinopyroxene, amphibole, ± garnet and in a post-collision setting (Wang et al. Reference Wang, Xu, Jian, Bao, Zhao, Li, Xiong and Ma2006; Liu et al. Reference Liu, Hu, Feng, Zhou, Li, Chi, Peng, Zhong, Qi, Qi and Wang2008; Chiaradia, Reference Chiaradia2009; Karsli et al. Reference Karsli, Dokuz, Uysal, Aydin, Kandemir and Wijbrans2010; Li et al. Reference Li, Xiong and Liu2017); (3) those derived from melting of the metasomatized mantle wedge (Castillo et al. Reference Castillo, Janney and Solidum1999; MacPherson et al. Reference MacPherson, Dreher and Thirlwall2006; Richards & Kerrich Reference Richards and Kerrich2007; Chiaradia, Reference Chiaradia2009; Azizi et al. Reference Azizi, Hadad, Stern and Asahara2019 a); and (4) those derived by magma mixing (Guo et al. Reference Guo, Wilson and Liu2007; Qin et al. Reference Qin, Lai, Diwu, Ju and Li2010).
Considering the LaN/YbN versus YbN diagram (Fig. 12a) and the Cr (ppm), P2O5 (wt%) and Th/Ce versus SiO2 (wt%) diagrams (Fig. 12b, c, d) (Wang et al. Reference Wang, Xu, Jian, Bao, Zhao, Li, Xiong and Ma2006), the Sari Gunay samples plot close to the field defined by delaminated lower-crust-derived adakitic rocks (e.g. relatively low Yb contents, high La/Yb ratios and high Cr). Further, the Sari Gunay rocks have relatively negative Ti–Nb anomalies and low Ta contents similar to adakites (Fig. 9b; Table 2). The negative Ti–Nb anomalies and low Ti–Nb–Ta contents in adakites are related to equilibration of melts with residual hornblende and/or Fe–Ti oxides such as rutile, titanite and ilmenite (Rapp et al. Reference Rapp, Watson and Miller1991; Wolf & Wyllie, Reference Wolf and Wyllie1994; Rapp & Watson, Reference Rapp and Watson1995). Negative Eu anomalies may indicate a plagioclase free source (Hou et al. Reference Hou, Gao, Qu, Rui and Mo2004). A flat heavy REE pattern associated with low heavy REE concentrations and high light over heavy REEs ratios (LaN/YbN >10) indicates that the garnet was a stable residual phase during melting (Rapp et al. Reference Rapp, Watson and Miller1991; Wolf & Wyllie, Reference Wolf and Wyllie1994; Rapp & Watson, Reference Rapp and Watson1995). Medium REE patterns with weak concavities imply the presence of residual amphibole in the source (Gromet & Silver, Reference Gromet and Silver1987).

Fig. 12. Genetic classification diagrams for adakitic rocks: (a) LaN/NbN versus YbN; (b) Cr (ppm) versus SiO2; (c) P2O5 (wt%) versus SiO2; and (d) Th/Ce versus SiO2 (wt%) diagrams (Wang et al. Reference Wang, Xu, Jian, Bao, Zhao, Li, Xiong and Ma2006). Sari Gunay samples plot in the field of delaminated lower-crust-derived adakites. Open circles are Sari Gunay volcanic samples analysed by Richards et al. (Reference Richards, Wilkinson and Ullrich2006).
Samples from Sari Gunay are further characterized by MgO (0.37–2.06 wt%), TiO2 (0.38–0.55 wt%), CaO+Na2O (0.28–9.36 wt%), Sr (c. 645 ppm) and K/Rb (< 280). High-SiO2 adakites (HSA) compared to low-SiO2 adakites (LSA) have lower MgO (0.5–4 wt%), lower TiO2 (< 0.9 wt%), CaO+Na2O (< 11 wt%), Sr (< 1100 ppm), Cr/Ni (0.5–4.5) and K/Rb (< 1000). The Cr/Ni ratio in HSA ranges from 0.5 to 4.5 while in LSA this ratio ranges from 1 to 2.5. Pyroxene phenocrysts are absent from the HSA while they may be present in LSA (Martin et al. Reference Martin, Smithies, Rapp, Moyen and Champion2005). In the MgO versus SiO2 and Cr/Ni versus TiO2 diagrams (Martin et al. Reference Martin, Smithies, Rapp, Moyen and Champion2005), almost all Sari Gunay samples plot within the HSA field (Figs 13a, b). The Sari Gunay samples have Cr/Ni ratios between 2.1 and 5 and no pyroxene phenocrysts. Experimental results show that HSA can be generated by melting of basaltic materials such as eclogite or garnet amphibolite. The trace-element contents of these melts are similar to melts in equilibrium with a garnet-bearing residue (Rapp et al. Reference Rapp, Watson and Miller1991; Wolf & Wyllie, Reference Wolf and Wyllie1994; Rapp & Watson, Reference Rapp and Watson1995). In turn, LSA have been obtained by partial melting of a mantle peridotite (Sajona et al. Reference Sajona, Maury, Bellon, Cotten and Defant1996; Stern & Kilian, Reference Stern and Kilian1996; Martin et al. Reference Martin, Smithies, Rapp, Moyen and Champion2005). Most Sari Gunay samples plot within the field of liquids obtained by experimental melting of basalts or amphibolites (Fig. 13a). The MgO content of the Sari Gunay samples is generally higher than that defined by the HSA field (Fig. 13a). It is argued that slightly higher MgO, Ni and Cr contents of the HSA (compared with experimental melts) is due to the interaction of the melt with mantle peridotite (Stern & Kilian, Reference Stern and Kilian1996; Rapp et al. Reference Rapp, Shimizu, Norman and Applegate1999; Smithies, Reference Smithies2000; Prouteau et al. Reference Prouteau, Scaillet, Pichavant and Maury2001).

Fig. 13. (a, b) Diagrams for discriminating high-silica (HSA) and low-silica (LSA) adakite types: (a) MgO (wt%) versus SiO2 (wt%) and (b) Cr/Ni versus TiO2 (Martin et al. Reference Martin, Smithies, Rapp, Moyen and Champion2005). (c) Dy/Yb versus SiO2 diagram showing that amphibole rather than garnet as a residual phase played an important role in the generation of the Sari Gunay adakitic rocks (Davidson et al. Reference Davidson, Turner and Plank2013). (d) La/Yb versus La (ppm) diagram (Gao et al. Reference Gao, Hou, Kamber, Wei, Meng and Zhao2007) showing the role of partial melting during the generation of the Sari Gunay adakites. Open circles are Sari Gunay volcanic samples analysed by Richards et al. (Reference Richards, Wilkinson and Ullrich2006); closed circles are samples analysed in this study.
Garnet and amphibole are essential residual phases during the generation of HSA. The negative correlation between Dy/Yb ratios and silica indicates that residual amphibole played a more important role than garnet in generating HSA melts (Davidson et al. Reference Davidson, Turner and Plank2013). Amphibole has important control on the medium REE contents during partial melting or during magma fractionation. Amphibole decreases the Dy/Yb ratio by increasing SiO2, whereas garnet increases this ratio. The Sari Gunay samples display a strong negative correlation between Dy/Yb and silica (Fig. 13c). This indicates that amphibole was a major residual phase during melting. Based on experimental results (Kay et al. Reference Kay, Mpodozis, Coira and Skinner1999), amphibole breaks down at depths of 40–50 km. Furthermore, ratios of different REEs such as La/Yb, La/Sm and Sm/Yb supply important information about the generation of adakitic melts residual mineralogy and relative crustal thicknesses. The La/Yb versus La diagram (Gao et al. Reference Gao, Hou, Kamber, Wei, Meng and Zhao2007) suggests that partial melting was more important than fractional crystallization during the generation of the Sari Gunay rocks (Fig. 13d). The geochemical variation (Fig. 8) can be ascribed to fractionation of plagioclase, biotite, titanite, apatite, Fe oxides and zircon during crystallization. Sr and Y are compatible in plagioclase and titanite. Consequently, their concentration has been decreased by fractionation of these mineral phases in the Sari Gunay adakitic rocks.
Low ratios of La/Yb (< 20), La/Sm (< 4) and Sm/Yb (< 3) generally indicate residual clinopyroxene, whereas higher ratios of such elements indicate that heavy REEs (such as Yb) were kept by garnet and amphibole in the residue (Kay et al. Reference Kay, Mpodozis, Ramos, Munizaga, Harmon and Rapela1991; Haschke et al. Reference Haschke, Siebel, Günther and Scheuber2002; Haschke & Günther, Reference Haschke and Günther2003; Karsli et al. Reference Karsli, Dokuz, Kandemir, Aydin, Schmitt, Ersoy and Alyildiz2019). The Sari Gunay rocks contain high ratios of La/Yb (c. 42.3) and LaN/YbN (c. 28.5), and moderately high La/Sm (c. 11.1) and Sm/Yb (c. 3.8) ratios. Schiano et al. (Reference Schiano, Clochiatti, Shimizu, Maury, Jochum and Hofman1995) reported that adakitic glassy inclusions in olivine crystals from ultramafic mantle xenoliths with very high LaN/YbN ratios (c. 48) could be evidence for interaction between slab melts and mantle peridotite. Similar signatures of the Sari Gunay adakitic rocks may reflect the interaction between lower-crustal garnet amphibolite and mantle peridotite. Based on the LaN/YbN versus YbN diagram (Martin, Reference Martin1986), the Sari Gunay volcanic rocks were generated by partial melting of a garnet-amphibolite and metasomatized mantle peridotite source (Fig. 14).

Fig. 14. LaN/YbN versus YbN diagram (Martin, Reference Martin1986). Sari Gunay samples can be generated by partial melting of a 10% garnet-amphibolite source associated with 10% garnet-metasomatized mantle peridotite. The field of delaminated lower-crust-derived adakites is from Wang et al. (Reference Wang, Xu, Jian, Bao, Zhao, Li, Xiong and Ma2006). Mid-ocean-ridge basalt (MORB) source and normalizing values of the trace elements from Sun & McDonough (Reference Sun, McDonough, Saunders and Norry1989). Open circles are Sari Gunay volcanic samples analysed by Richards et al. (Reference Richards, Wilkinson and Ullrich2006).
The role of the metasomatized lithospheric mantle in the genesis of adakites in the northeastern SaSZ was emphasized by isotope data (see Azizi et al. Reference Azizi, Asahara, Motohiro, Takemura and Razyani2014 a). Late Miocene formation of the Sari Gunay composite volcano occurred contemporaneously with adakitic magmatism in the the Ghorveh–Bijar area, such as the Akhikamal volcanic dome with an age of 10.4 Ma (Azizi et al. Reference Azizi, Asahara, Motohiro, Takemura and Razyani2014 a). Based on the results of the study by Azizi et al. (Reference Azizi, Asahara, Motohiro, Takemura and Razyani2014 a), the Sr–Nd isotope ratios indicate that late Miocene adakitic magmatic rocks in the Ghorveh–Bijar area were derived by partial melting of lower continental crust and a metasomatized lithospheric mantle. The Moho depths of 45–47 km in the Sari Gunay area (Dehghani & Makris, Reference Dehghani and Makris1983) emphasize the likelihood of partial melting of the lower continental crust and the mantle lithosphere beneath it (Fig. 15). As described earlier in this section, previous experimental results (Kay et al. Reference Kay, Mpodozis, Coira and Skinner1999) show that amphibole breaks down at depths of 40–50 km.

Fig. 15. Schematic geodynamic model for the generation of adakitic rocks of the Sari Gunay gold deposit. (a) The crustal thickness or Moho depth in NW Iran before delamination (Moho profile from Mehran to Lahijan, line A–B shown in Fig. 1); and (b) adakite formation by lithospheric delamination (delamination includes part of the lower crust and the metasomatized lithosphere mantle) and interaction with melts coming from the upwelling asthenospheric mantle. Crustal thickness (i.e. depth of Moho) is from Dehghani & Makris (Reference Dehghani and Makris1983).
MASH (melting, assimilation, storage and homogenization) zones are thought to form beneath near the Moho due to density contrasts (Hildreth & Moorbath, Reference Hildreth and Moorbath1988). In such zones, hybrid intermediate magmas with cumulate residues containing amphibole, olivine, pyroxene, plagioclase and garnet will form (De Bari & Coleman, Reference De Bari and Coleman1989; Jagoutz et al. Reference Jagoutz, Muntener, Ulmer, Pettke, Burg, Dawood and Hussain2007; Richards, Reference Richards2009). Amphibole-rich cumulates can act as a sponge storing up to 20% water in the original magma flux (Davidson et al. Reference Davidson, Turner, Handley, Macpherson and Dosseto2007). Magmas produced in lower crustal MASH zones can have high Sr/Y and La/Yb ratios due to preferential partitioning of Y, Yb, medium REEs and heavy REEs into residual amphibole and garnet (Green & Pearson, Reference Green and Pearson1985; Richards, Reference Richards2009). It seems likely that MASH zones also played a role in generating the Sari Gunay adakitic host rock. Hornblende differentiation or residual hornblende, as well as partial melting of calc-alkaline mafic bodies in the lower crust, were proposed for the formation of Miocene adakites in the northeastern SaSZ (Azizi et al. Reference Azizi, Asahara, Mehrabi and Chung2011; Azizi et al. Reference Azizi, Hadad, Stern and Asahara2019 a; Rabiee et al. Reference Rabiee, Rossetti, Asahara, Azizi, Lucci, Lustrino, Nozaem, Lucci, Lustrino and Nozaem2020). However, a post-collision extension environment can be an alternative explanation for the occurrence of these rocks. The generation of mafic alkaline (shoshonitic or hawaiitic) magmas commonly occurs by upwelling of the subduction-metasomatized asthenosphere and attenuated lithosphere (Luhr, Reference Luhr1997; Paquette et al. Reference Paquette, Ménot, Pin and Orsini2003).
The concept of continental lithospheric mantle delamination, which was introduced by Bird (Reference Bird1978, Reference Bird1979), includes the detachment and sinking of dense lithospheric mantle with or without portions of lower crust into the underlying asthenosphere. In addition, delamination is the result of thinned or absent mantle lithosphere under thickened crust. Rocks with adakitic geochemical features derived from the delaminated lower crust were reported from the Alpine–Himalayan collisional belt such as the late Oligocene adakites in the southern Tibet (Chung et al. Reference Chung, Liu, Ji, Chu, Lee, Wen, Lo, Lee, Qian and Zhang2003) and Early Cretaceous adakitic lavas in the Songliao basin NE China (Ji et al. Reference Ji, Meng, Wan, Ge, Yang, Zhang, Dong and Jin2019). However, the evidence indicates that in our study area the melts with adakitic signatures were generated in a post-collision extension tectonic regime due to the upwelling and heating of hot asthenosphere associated with delamination of a thickened crust and lithosphere. It is suggested that melt formation within the delaminated segment, including lower crustal amphibolites and mantle lithosphere, followed by MASH zone processes led to the generation of the Sari Gunay adakitic volcanic host rocks (Fig. 15).
7. Conclusions
The Sari Gunay gold deposit is located within a composite volcanic complex consisting of massive to flow-banded lava flows, lahars and pyroclastic rocks. Based on whole-rock major- and trace-element analyses, the lava flows of Sari Gunay deposit consist of latite, quartz latite, dacite and rhyolite. The rhyolites and latites belong to the shoshonite series, whereas dacites and quartz latites belong to the high-K calc-alkaline series. Almost all Sari Gunay volcanic rocks plot within the high-SiO2 adakitic field. U–Pb zircon dating shows that the volcanic rocks formed at 11.18 ± 0.14 Ma and 10.10 ± 0.01 Ma. Their generation is related to asthenospheric upwelling, followed by the melting of delaminated crust consisting of amphibolite and mantle peridotite, as well as MASH zone processes in the lower crust.
Acknowledgements
This work was part of Y. Taheri Maghami’s M.Sc. thesis. We thank Professor Simon Wallis and Professor Koshi Yamamoto from the Nagoya University for their support with BSE-CL imaging and LA-ICP-MS analyses, as well as Professor Lorence G. Collins from California State University Northridge for manuscript editing. We also thank Kathryn Goodenough, Federico Lucci and an anonymous reviewer for their critical comments and valuable suggestions on an earlier version of the manuscript.