1. Introduction
Clastic sediments are natural samples and ideal materials for studying the formation, evolution and chemical composition of the continental crust (Jahn, Gallet & Han, Reference Jahn, Gallet and Han2001; McLennan, Reference McLennan2001; Rudnick & Gao, Reference Rudnick, Gao and Rudnick2003). The ideal aim of detrital zircon geochronology is to trace the transportation of clastic materials from their source area to the sedimentary basin. In situ U–Pb and Lu–Hf isotopic data from detrital zircons in clastic sediments and sedimentary rocks are used to identify provenance in sedimentary basins and reveal major magmatic events that occurred in the source region (Fedo, Sircombe & Rainbird, Reference Fedo, Sircombe and Rainbird2003; Andersen, Reference Andersen2005; Zhang et al. Reference Zhang, Zheng, Wu, Zhao, Gao and Wu2006a; Liu, X. M. et al. Reference Liu, Gao, Diwu and Ling2008; Belousova et al. Reference Belousova, Kostitsyn, Griffin, Begg, O'Reilly and Pearson2012; Gehrels, Reference Gehrels, Busby and Azor2012; Andersen, Kristoffersen & Elburg, Reference Andersen, Kristoffersen and Elburg2016; Linol et al. Reference Linol, De Wit, Barton, De Wit and Guillocheau2016; Chen et al. Reference Chen, Sun, Long, Zhao, Wang, Yu and Yuan2016, Reference Chen, Sun, Long, Zhao, Wang, Yu and Yuan2018; Wang et al. Reference Wang, Cawood, Zhou, Pandit and Chen2017). Integrated analyses of detrital zircon U–Pb and Hf isotopes have thus become a powerful tool for deciphering provenance variation in a sedimentary basin during sedimentation and the denudation history of source regions (e.g. Myrow et al. Reference Myrow, Hughes, Goodge, Fanning, Williams, Peng, Bhargava, Parcha and Pogue2010; Zhang et al. Reference Zhang, Yin, Liu, Wu, Lin and Grove2012; Wang, W. et al. Reference Wang, Zhou, Yan, Li and John2013).
The assembly and break-up of Rodinia is an important geological event in geological history. The break-up of Rodinia (870–560 Ma) had a significant influence on the evolution history of South China (Li et al. Reference Li, Bogdanova, Collins, Davidson, De Waele, Ernst, Fitzsimons, Funk, Gladkochub, Jacobs, Karlstrom, Lu, Natapov, Pease, Pisarevsky, Thrane and Vernikovsky2008). Nevertheless, magmatic events recording the break-up of Rodinia in the Yangtze Domain (YGD) have been observed only up to 750 Ma (Xia et al. Reference Xia, Xu, Niu and Liu2018 and references therein). Few tuff records from the Cryogenian period have been observed in the YGD. Although necessary reports about magmatic rocks are lacking (Zhao et al. Reference Zhao, Zhou, Yan, Zheng and Li2011 and references therein; Dong & Santosh, Reference Dong and Santosh2016 and references therein), a large number of detrital zircons from this period have been recorded in the clastic rocks of the YGD (Yin et al. Reference Yin, Wang, Tang, Wan, Wang, Gao, Xing and Liu2006; Liu, X. M et al. Reference Liu, Gao, Diwu and Ling2008; Zhang, Jiang & Han, Reference Zhang, Jiang and Han2008; Ling et al. Reference Ling, Duan, Liu, Cheng, Mao, Peng, Liu, Yang and Ren2010; Wang et al. Reference Wang, Griffin, Yu and O'Reilly2010, Reference Wang, Chen, Hu, Chu and Yang2012a,b; Wang, W. et al. Reference Wang, Zhou, Yan, Li and John2013; Lan et al. Reference Lan, Li, Zhu, Zhang and Li2015; Liu et al. Reference Liu, Li, Chen, Lan, Yang, Shang and Yin2015; Yu et al. Reference Yu, Du, Zhou, Wang, Yuan, Xu, Pan, Xie, Qi and Jiao2016). Nevertheless, the source of the YGD sediments deposited during late Neoproterozoic time remains uncertain. Furthermore, the transportation of the upper Neoproterozoic detritus within the YGD has not been clearly constrained. Therefore, this study attempted to identify the source areas and migration processes and to reconstruct the Cryogenian palaeogeography of the YGD through detailed investigation of detrital zircons in the study area.
This study focused on U–Pb ages and Lu–Hf isotopic signatures of detrital zircons from sandstones in the southeastern part of the YGD deposited during the Cryogenian period (Fig. 1). Our objective was to study the provenance and transport of the clastic material through zircon U–Pb–Lu–Hf isotopic analysis of the Nanhua strata, and to reconstruct the Cryogenian palaeogeography of the YGD.

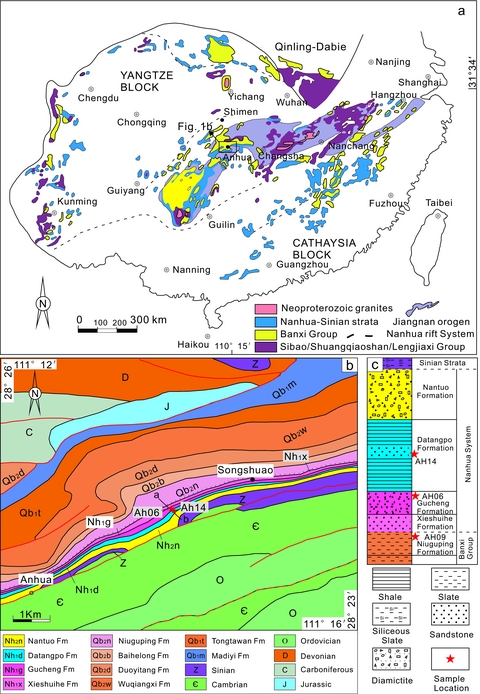
Figure 1. (a) Outcrops of Neoproterozoic igneous and sedimentary rocks and rift basins in the South China Block (modified from Du et al. Reference Du, Wang, Wang, Qiu, Jiang, Deng and Yang2013). (b) Simplified geological map of the study area showing the measured section. (c) Stratigraphic column in the Anhua area, with positions of sedimentary sampling marked.
2. Geological setting and sampling
2.a. Geological setting
The northern margin of the YGD is separated by the Mianlue–Bashan–Xiangguang Mesozoic overthrust fault (MBXF) from the South Qinling Block (SQB), which consists mainly of Middle to Upper Proterozoic volcano-sedimentary successions and Neoproterozoic intrusions overlain by sedimentary rocks (Dong et al. Reference Dong, Zhang, Neubauer, Liu, Genser and Hauzenberger2011). Precambrian basement rocks are exposed in the Yudongzi Group, Foping area, Douling Group, Wuguan Group, Yaolinghe Group and Wudangshan Group in the SQB (Zhang et al. Reference Zhang, Zhang, Yuan and Xiao2001; Shi, Yu & Santosh, Reference Shi, Yu and Santosh2013). Of these, the Wudangshan Group is the most widely exposed basement strata in the SQB (Wang, R. R. et al. Reference Wang, Xu, Santosh, Yao, Gao and Liu2016) and its formation has been dated at 830–726 Ma using U–Pb ages of zircons from volcanic interlayers and sedimentary rocks (Ling et al. Reference Ling, Ren, Duan, Liu, Mao, Peng, Liu, Cheng and Yang2008, Reference Ling, Duan, Liu, Cheng, Mao, Peng, Liu, Yang and Ren2010; Wang, W. et al. Reference Wang, Zhou, Yan, Li and John2013), although some studies reported an age of 783–675 Ma (Xia et al. Reference Xia, Xia, Li, Ma and Xu2008; Zhang et al. Reference Zhang, Zhang, Li and Lu2013), which is evidenced by the 632–688 Ma intruding plutons (Cai et al. Reference Cai, Xiong, Luo, Wu, Sun, Rao and Wang2007; Ling et al. Reference Ling, Ren, Duan, Liu, Mao, Peng, Liu, Cheng and Yang2008; Wang, W. et al. Reference Wang, Zhou, Yan, Li and John2013; Zhu et al. Reference Zhu, Chen, Liu and Zhang2015).
Several Neoproterozoic plutons occur in the SQB including the Fenghuangshan and Douling plutons. These plutons mainly comprise granitic and dioritic intrusions (Zhang et al. Reference Zhang, Li, Wang, Yuan and Yan2004; Yang et al. Reference Yang, Liu, Li, Wang, Wang and Bai2012; Dong & Santosh, Reference Dong and Santosh2016). They have been dated at c. 802–685 Ma, and show arc-related geochemical features (Zhang et al. Reference Zhang, Li, Wang, Yuan and Yan2004; Y. Y. Geng, unpub. M.Sc. thesis, China University of Geosciences, 2010; Liu et al. Reference Liu, Niu, He and Ren2011; Li et al. Reference Li, Li and He2012; Yang et al. Reference Yang, Liu, Li, Wang, Wang and Bai2012). In addition, the Xiaomoling Complex and some other small intrusions dated at c. 956–621 Ma also occur along the Shanyang fault (Niu et al. Reference Niu, He, Ren, Wang and Deng2006; Liu et al. Reference Liu, Niu, He and Ren2011, Reference Liu, Wu, Gao, Lei, Qin and Li2014; Wu, F. F. et al. Reference Wu, Wang, Wang, Yan and Chen2012; Guo et al. Reference Guo, Yan, Wang, Fu and Chen2014; Yan et al. Reference Yan, Liu, Li, Yang, Wang, Guo, Bai and Deng2014; Zhang et al. Reference Zhang, Santosh, Zhu, Chen and Huang2015; Hu, F. Y. et al. Reference Hu, Liu, Santosh, Deng, Wang, Zhang and Yan2016; Wang, R. R. et al. Reference Wang, Xu, Santosh, Yao, Gao and Liu2016).
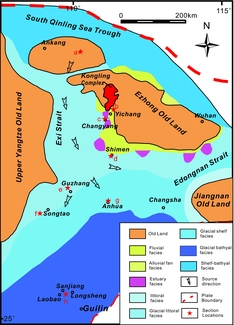
During the period of deposition of the Nanhua System, the YGD was composed of the Upper Yangtze Old Land (UYZOL), Ezhong Old Land (EZOL) and Jiangnan Old Land (JNOL) (Liu & Xu, Reference Liu and Xu1994). The area on the southeast margin of the YGD is called the Nanhua rift basin, and the area on north margin of the YGD is called the South Qinling Sea Trough (Liu & Xu, Reference Liu and Xu1994). The Nanhua rift basin on the southeast margin of the YGD was connected to the South Qinling Sea Trough through a channel called the Exi Strait (Fig. 2; Liu & Xu, Reference Liu and Xu1994). The study area is located on the southeast margin of the YGD, where the western margin of the Jiangnan orogeny (JNO) lies (Fig. 1a, b). The main sedimentary formations of the Nanhua System include the Changan, Liangjiehe (Xieshuihe), Tiesiao (Gucheng), Datangpo and Nantuo formations. Two glaciation events probably occurred in the Changan and Gucheng formations in South China during the Sturtian glaciation (Lan et al. Reference Lan, Li, Zhu, Zhang and Li2015). The Liangjiehe Formation belongs to an interglacial period, and the Nantuo Formation coincides with the Marinoan glaciation (Barfod et al. Reference Barfod, Albarède, Knoll, Xiao, Télouk, Frei and Baker2002; Chen et al. Reference Chen, Dong, Zhu and Chen2004). Chronological research has shown that the Marinoan glaciation ended at 635 Ma (Condon et al. Reference Condon, Zhu, Bowring, Wang, Yang and Jin2005; Chu et al. Reference Chu, Todt, Zhang, Chen and Huang2005; Yin et al. Reference Yin, Tang, Liu, Gao, Liu, Xing, Yang, Wan and Wang2005a,b; Zhang et al. Reference Zhang, Jiang, Zhang, Song, Kennedy and Christie-Blick2005), and the Sturtian glaciation possibly ended at 670 Ma (Fanning & Link, Reference Fanning and Link2004; Xiao et al. Reference Xiao, Tucker, Peng and Zhou2004; Yin et al. Reference Yin, Wang, Tang, Wan, Wang, Gao, Xing and Liu2006; Yu et al. Reference Yu, Du, Zhou, Wang, Yuan, Xu, Pan, Xie, Qi and Jiao2016). In the study area, the Nanhua System sedimentary strata are separated into the Gucheng, Datangpo and Nantuo formations, and it lacks the Changan formation. The Gucheng Formation has a direct unconformable contact with the Niuguping Formation at the top of the Banxi Group.

Figure 2. The 800–680 Ma palaeogeographic map of South China (revised after Liu & Xu, Reference Liu and Xu1994; Wang & Li, Reference Wang and Li2003; Shu, Reference Shu2006, Reference Shu2012; Dong & Santosh, Reference Dong and Santosh2016).
2.b. Sample collection
In our study, sedimentary rock samples were collected from a geological section located in Anhua, Dabu County, Hunan Province (Fig. 1b, c). These samples were used for geochronological (AH06, AH09 and AH14) and Hf isotopic analyses (AH06 and AH14). Furthermore, data on seven sections were obtained from previous studies. The lithology of the geological section is uniform, comprising mainly sandstone, tillite and sandy slate. AH09 is a slate sample from the top of the Niuguping Formation, AH06 is a tillite sample from the upper part of the Gucheng Formation (Fig. 1c) and AH14 is a sandstone sample from the middle part of the Datangpo Formation. Details on the regional stratigraphy and sampling lithology of the other sections are available in published literature (Fig. 2).
3. Analytical methods
Zircons were separated from crushed rock using a combination of conventional heavy liquid and magnetic separation techniques. Zircon grains were hand-picked under a binocular microscope and cast in epoxy mounts together with zircon U–Pb standards 91500 and Plešovice, followed by polishing to section the crystals in half. All zircon grains were imaged in transmitted and reflected light as well as by cathodoluminescence (CL) to better reveal their internal structures.
The U–Pb isotopic compositions of the zircons were analysed at the State Key Laboratory of Geological Processes and Mineral Resources, China University of Geosciences, Wuhan. Laser sampling was performed using a GeoLas 2005 ArF excimer laser ablation system. An Agilent 7500a inductively coupled plasma mass spectrometry (ICP-MS) instrument was used to acquire ion-signal intensities. A ‘wire’ signal smoothing device is included in this laser ablation system, by which smooth signals are produced even at very low laser repetition rates down to 1 Hz (Hu et al. Reference Hu, Liu, Gao, Xiao, Zhao, Günther, Li, Zhang and Zong2012b). Helium was used as the carrier gas to transport the ablated material from the laser ablation cell to the ICP-MS. The diameter of the laser ablation crater was 32 μm. Standard zircon 91500 was used as an external standard for U–Pb dating, and was analysed twice every five analyses. NIST610 glass was used as an external standard to normalize the U, Th and Pb concentrations of the unknowns. The detailed analytical procedures followed Liu et al. Reference Liu, Hu, Zong, Gao, Gao, Xu and Chen(2010b). Off-line selection and integration of background and analysis signals, and time-drift correction and quantitative calibration for U–Pb dating, were performed by ICPMSDataCal (Liu, Y. S. et al. Reference Liu, Hu, Gao, Günther, Xu, Gao and Chen2008, Reference Liu, Gao, Hu, Gao, Zong and Wang2010a). Calculation of concordia diagrams and weighted mean ages was done using Isoplot, with uncertainties quoted at the 1σ and 90% confidence levels (Ludwig, Reference Ludwig2003). The analytical data are presented in online Supplementary Material Table S1 available at http://journals.cambridge.org/geo.
The Lu–Hf isotope analysis was carried out in situ using a Neptune Plus multicollector-ICP-MS (Thermo Fisher Scientific, Germany) in combination with a Geolas 2005 excimer ArF laser ablation system (Lambda Physik, Göttingen, Germany) that was hosted at the State Key Laboratory of Biogeology and Environmental Geology, China University of Geosciences in Wuhan. All data were acquired on zircons in single spot ablation mode at a spot size of 44 μm in this study. Each measurement consisted of 20 s of acquisition of the background signal followed by 50 s of ablation signal acquisition. Detailed operating conditions for the laser ablation system and the MC-ICP-MS instrument and analytical method are the same as described by Hu et al. Reference Hu, Liu, Gao, Liu, Yang, Zhang, Tong, Lin, Zong, Li, Chen and Zhou(2012a). The major limitation to accurate in situ zircon Hf isotope determination by laser ablation MC-ICP-MS is the very large isobaric interference from 176Yb and, to a much lesser extent 176Lu on 176Hf (Woodhead et al. Reference Woodhead, Hergt, Shelley, Eggins and Kemp2004). The 179Hf/177Hf and 173Yb/171Yb ratios were used to calculate the mass bias of Hf (βHf) and Yb (βYb), which were normalized to 179Hf/177Hf = 0.7325 and 173Yb/171Yb = 1.1248 (Blichert-Toft, Chauvel & Albarède, Reference Blichert-Toft, Chauvel and Albarède1997) using an exponential correction for mass bias. Interference of 176Yb on 176Hf was corrected by measuring the interference-free 173Yb isotope and using 176Yb/173Yb = 0.7876 (McCulloch, Rosman & De Laeter, Reference McCulloch, Rosman and De Laeter1977) to calculate 176Yb/177Hf. Similarly, the relatively minor interference of 176Lu on 176Hf was corrected by measuring the intensity of the interference-free 175Lu isotope and using the recommended 176Lu/175Lu = 0.02656 (Blichert-Toft, Chauvel & Albarède, Reference Blichert-Toft, Chauvel and Albarède1997) to calculate 176Lu/177Hf. Off-line selection and integration of analysis signals and mass bias calibrations were performed using ICPMSDataCal (Liu et al. Reference Liu, Gao, Hu, Gao, Zong and Wang2010a). The analytical data are presented in online Supplementary Material Table S2 available at http://journals.cambridge.org/geo.
4. Results
4.a. CL images and Th/U ratios
Zircon grains from the three sedimentary rock samples collected in this study are light yellow to colourless and transparent to translucent. The grains exhibit a wide range of sizes and morphology. Representative CL images for the zircons from each sample are shown in Figure 3. The grains range in size from 50 to 200 μm, and mostly show a euhedral to subhedral morphology with clear oscillatory zoning. Most zircon grains from both the older and younger groups have Th/U ratios greater than 0.4, implying that a majority of them are of magmatic origin (Belousova et al. Reference Belousova, Kostitsyn, Griffin, Begg, O'Reilly and Pearson2012). Two zircons (AH06-20, AH06-70) exhibited low Th/U ratios (< 0.1) (online Supplementary Material Table S1 available at http://journals.cambridge.org/geo) and one of them (AH06-20) showed a prominent metamorphic edge, indicating metamorphism (Fig. 3).
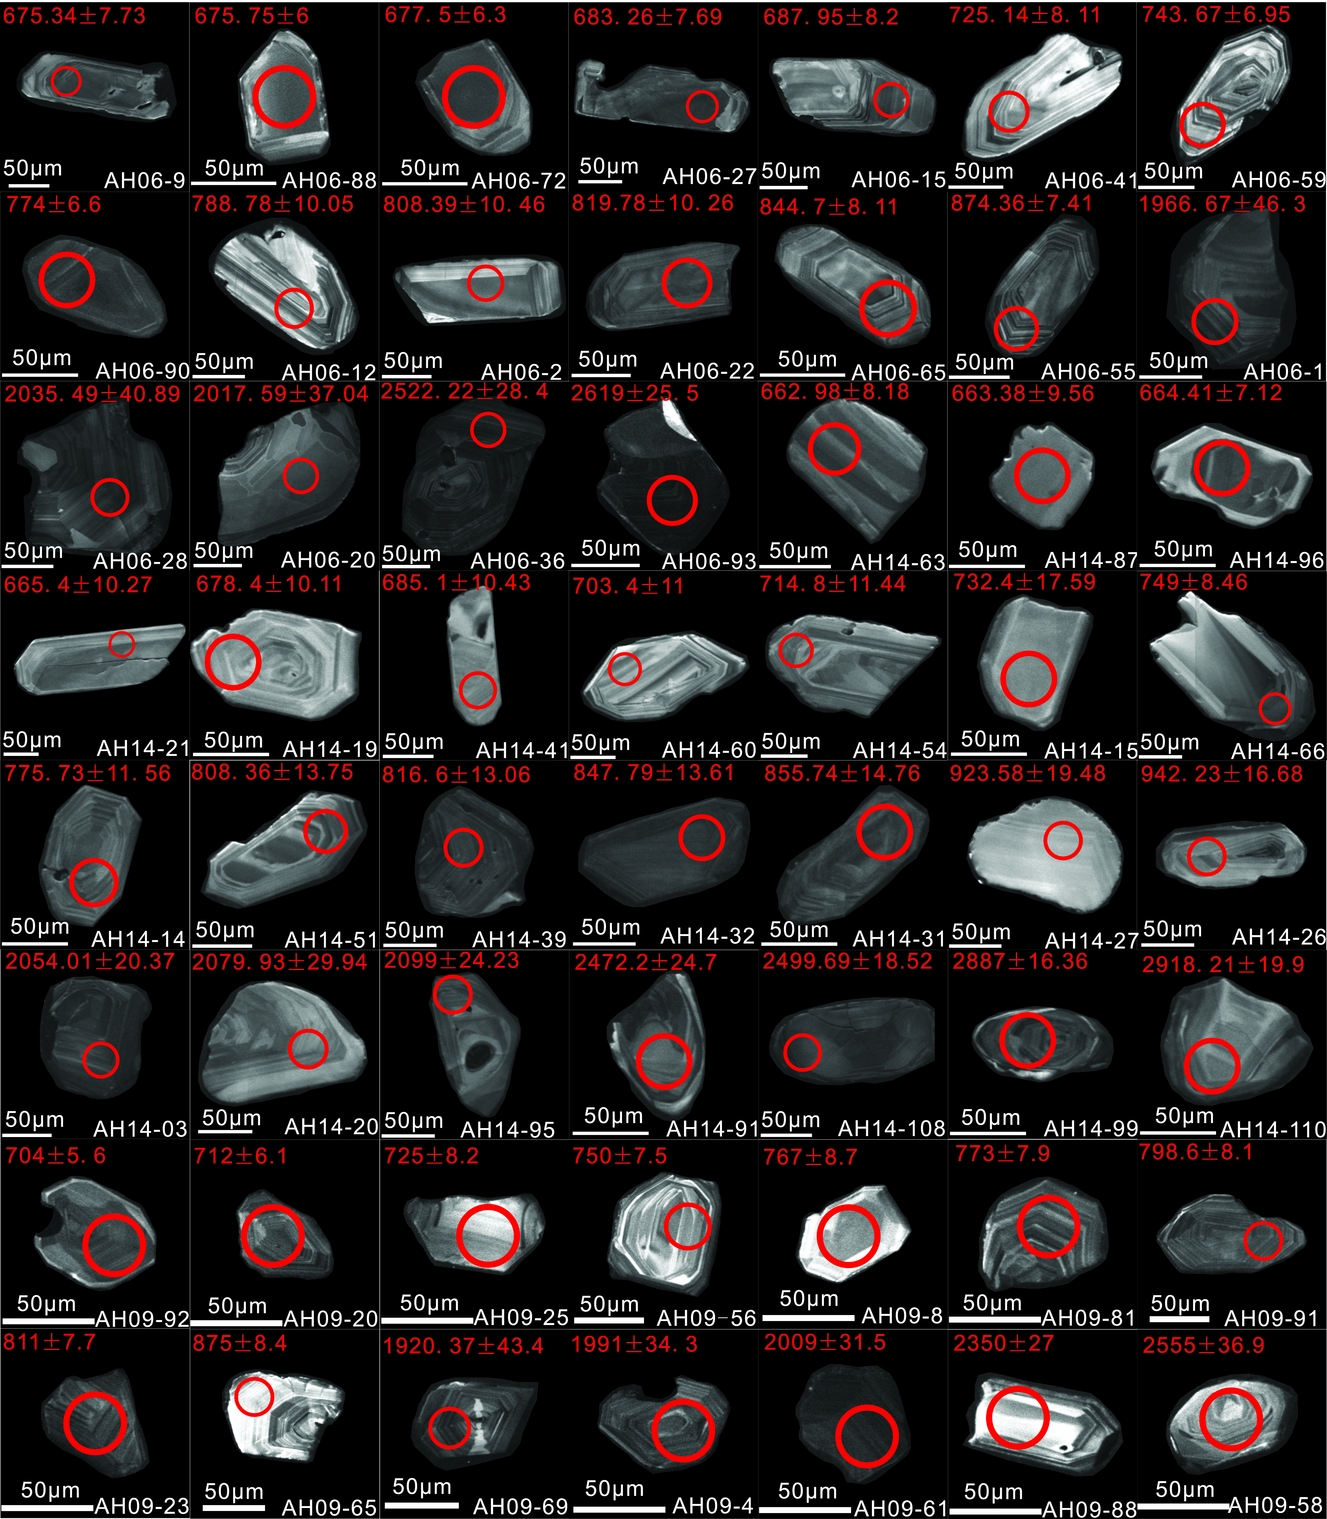
Figure 3. Typical cathodoluminescence (CL) images of zircon grains from samples AH06, AH14 and AH09. The circles show LA-ICP-MS dating spots. The zircon U–Pb ages with 1 σ uncertainties are listed next to the circles.
4.b. Zircon U–Pb geochronology
A total of 327 U–Pb analyses were acquired from the detrital zircon grains, and most analyses were located in the oscillatory core part of grains owing to the narrow width of the rim or mantle. Uncertainties on individual analyses in the data table and concordia plots are presented at 1σ. The U–Pb data are plotted in concordia diagrams in Figure 4 and the age histograms are also shown in Figure 4. In the following discussion, 206Pb–238U ages are used for zircon grains with ages less than 1000 Ma, whereas 207Pb–206Pb ages are used for zircons older than 1000 Ma, and the mean ages for pooled 206Pb–238U and 207Pb–206Pb results are quoted at the 90% confidence level.

Figure 4. Diagrams of U–Pb ages, concordia plots of zircons and weighted mean ages from the samples in Anhua, Hunan.
4.b.1. The Gucheng Formation (AH06)
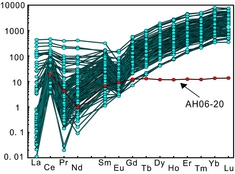
Detrital zircon U–Pb ages were determined on 100 zircon grains from the tillite sample, AH06. All analyses on separated zircon grains are within 10% of concordance and have Th/U ratios of 0.03–2.13, yielding ages ranging from 675 Ma to 2727 Ma (online Supplementary Material Table S1 available at http://journals.cambridge.org/geo). The Th/U ratios of AH06-20 and AH06-70 are 0.06 and 0.03, respectively. From the zircon isotope (Fig. 5, online Supplementary Material Table S3 available at http://journals.cambridge.org/geo) and CL image (Fig. 3) analyses, AH06-20 was determined to be a metamorphic zircon. Crystallization ages of the magmatic zircons are mainly grouped into two major age ranges: 675–687 Ma (n = 5) with an age peak at c. 683 Ma; and 721–899 Ma (n = 52) with two age peaks of c. 776 Ma and c. 816 Ma. These groups account for c. 5% and 52% of the total analyses. Two subordinate groups were observed in older age populations belonging to the Palaeoproterozoic (1939–2118 Ma, n = 24) and late Neoarchaean to early Palaeoproterozoic (2381–2619 Ma, n = 7) periods, with age peaks at c. 2033 Ma and c. 2497 Ma, respectively (Fig. 4). In addition, three Archaean zircons were identified in the sample with an age of c. 2727 Ma. The youngest group was defined using the weighted average age of 679.2±6.2 Ma (MSWD = 0.52, n = 5), which served to constrain the maximum depositional age for the upper part of the Gucheng Formation in the Anhua region.

Figure 5. Chondrite-normalized rare earth element patterns of zircons in sample AH06 (online Supplementary Material Table S3 available at http://journals.cambridge.org/geo).
4.b.2. The Datangpo Formation (AH14)
A total of 111 analyses were conducted on the magmatic zones of zircon grains from the Datangpo sandstone (AH14). These zircons are mainly light yellow to colourless and translucent with Th/U ratios of 0.11–2.02. All of the analyses are concordant, yielding ages from 662 Ma to 2918 Ma. Age spectra can be classified into six groups: 662–685 Ma (n = 8), 701–799 Ma (n = 27), 805–879 Ma (n = 39), 923–944 Ma (n = 7), 1936– 2099 Ma (n = 15) and 2205–2637 Ma (n = 12), with six main age peaks at c. 663 Ma, c. 769 Ma, c. 847 Ma, c. 938 Ma, c. 2018 Ma and c. 2491 Ma, respectively (online Supplementary Material Table S1 available at http://journals.cambridge.org/geo). The corresponding proportions of these six main age clusters to the total analyses are 7.2%, 24.3%, 35.2%, 6.3%, 13.5% and 10.8%. In addition, three Archaean zircons of c. 2887 Ma, 2889 Ma and 2918 Ma could be identified in the sample (Fig. 4). Considering the weighted average age, the youngest group has a 206Pb–238U age of 665.1±7.4 Ma (MSWD = 0.082, n = 6), which implies an upper age limit for the deposition of the bottom of the Datangpo Formation.
4.b.3. The Niuguping Formation (AH09)
Detrital zircon U–Pb ages were determined for 116 zircon grains from sample AH09. All analyses on separated zircon grains are within 10% of concordance and have Th/U ratios of 0.29–2.22, yielding ages ranging from 704 Ma to 3318 Ma (online Supplementary Material Table S1 available at http://journals.cambridge.org/geo). Crystallization ages of the magmatic zircons are mainly grouped into two major age ranges: 704–725 Ma (n = 3) with an age peak at c. 712 Ma; and 731–925 Ma (n = 78) with two age peaks of c. 770 Ma and c. 871 Ma, accounting for c. 3% and 67% of the total analyses. Two subordinate groups are in older age populations of the Palaeoproterozoic (1816–2076 Ma, n = 19) and late Neoarchaean to early Palaeoproterozoic (2345–2655 Ma, n = 13) (Fig. 4). In addition, two Mesoproterozoic zircons with ages of c. 1342 Ma and c. 1387 Ma were identified in the sample along with one Archaean zircon (c. 3318 Ma). From the weighted average age, the youngest group was defined to be 712±24 Ma (MSWD = 2.3, n = 3), constraining the maximum depositional age for the upper part of the Niuguping Formation in the Anhua region.
4.c. In situ Hf isotope composition
A total of 85 zircon grains showing concordant U–Pb ages were selected for in situ Hf isotopic analyses from two sedimentary rocks. The results are given in online Supplementary Material Table S2 (available at http://journals.cambridge.org/geo).
AH06 showed age patterns similar to those of the four main U–Pb age groups of 675–687 Ma, 721–899 Ma, 1939–2118 Ma and 2381–2619 Ma. Neoproterozoic grains have variable ɛHf(t) values (−41.4 to 16.6) and TDM2 ages (727–3807 Ma), indicating mixing between a Neoproterozoic juvenile component and crustal material. In addition, the youngest group of Neoproterozoic grains have variable ɛHf(t) values (−0.36 to 2.61) and TDM2 ages (1349–1053 Ma), but only one zircon ɛHf(t) value was negative. Palaeoproterozoic zircon grains also showed a wide range of ɛHf(t) values from −24.5 to 12.1 and Hf model ages (TDM2) from 1850 Ma to 3859 Ma, and all of them showed negative ɛHf(t) values, except for one. The late Archaean zircon grains have variable ɛHf(t) values (−11.98 to 3.12) and TDM2 ages (2771–3563 Ma). In addition, one zircon (2727 Ma) displayed an ɛHf(t) value of −2.5 and TDM2 of 3253 Ma.
AH14 also showed a similar age pattern with the five main U–Pb age groups of 662–685 Ma, 701–799 Ma, 805–879 Ma, 923–944 Ma, 1936–2099 Ma and 2205–2637 Ma. Neoproterozoic grains have variable ɛHf(t) values (−16.2 to 13.55) and TDM2 ages (933–2481 Ma), indicating mixing between a Neoproterozoic juvenile component and crustal material. The youngest group of Neoproterozoic grains have variable ɛHf(t) values (−1.32 to 7.02) and TDM2 ages (933–1546 Ma), but only one zircon ɛHf(t) value is negative. Palaeoproterozoic zircon grains also showed a wide range of ɛHf (t) values from −11.6 to −4.1 and Hf model ages (TDM2) from 2805 Ma to 3527 Ma; all of them showed negative ɛHf(t) values, except for one. The two Archaean zircon grains have ɛHf(t) values of −1.2 and −3.9, as well as TDM2 ages of 3113 Ma and 3451 Ma.
5. Discussion
5.a. Provenance analysis of samples
This study analysed one sample from the Banxi Group and two others from the Nanhua strata. As shown in Figure 4, the detrital zircon age patterns of the sedimentary rocks straddling the unconformity between the Banxi Group and the Nanhua strata are similar to each other. Both of the age spectra have two older age peaks (c. 2.0 Ga and c. 2.5 Ga), and two younger age peaks (c. 780 Ma and c. 820 Ma). However, the younger strata has one additional age peak (c. 680 Ma) compared to the older one. The southeastern margin of the YGD has no record of 680 Ma magmatic events, indicating that it is not the original source.
The distribution of detrital zircons in samples from different sedimentary rocks can provide clues for provenance characteristics (Rainbird, Hamilton & Young, Reference Rainbird, Hamilton and Young2001; Fonneland et al. Reference Fonneland, Lien, Martinsen, Pedersen and Kosler2004). The provenance characteristics could be analysed using the detrital zircon age spectra for the two middle–upper Nanhua System sedimentary samples from western Hunan.
Six main peak ages were obtained from three sedimentary samples in Anhua, Hunan: c. 680 Ma, c. 780 Ma, c. 820 Ma, c. 940 Ma, c. 2000 Ma and c. 2500 Ma. Furthermore, some magmatic zircon ages of c. 2900 Ma and c. 3300 Ma were obtained. During Neoproterozoic time, the southeastern YGD experienced two evolutionary stages, including a 1.0–0.82 Ga period of subduction collision and a 800–635 Ma period of stretching tension (Charvet, Reference Charvet2013 and references therein). Unlike the southeast, the north YGD experienced a long-term accretionary orogeny caused by the 1.0–0.7 Ga continuous collision and accretion (Dong & Santosh, Reference Dong and Santosh2016 and references therein). In contrast to the different magmatic evolution histories in the north and southeast margin of the YGD, recent studies have revealed similar zircon age spectra for upper Neoproterozoic sequences from these two areas (Ling et al. Reference Ling, Duan, Liu, Cheng, Mao, Peng, Liu, Yang and Ren2010; Wang, W. et al. Reference Wang, Zhou, Yan, Li and John2013; Dong & Santosh, Reference Dong and Santosh2016; Yang et al. Reference Yang, Yang, Polat and Xu2018; Xia et al. Reference Xia, Xu, Niu and Liu2018).
At present, few studies on the c. 680 Ma magmatic events in South China have been carried out. Source rocks of c. 680 Ma are represented by Neoproterozoic igneous rocks mainly in South Qinling on the northern margin of the YGD; this magmatic event may be related to the break-up of Rodinia (Fig. 6; Niu et al. Reference Niu, He, Ren, Wang and Deng2006; Ling et al. Reference Ling, Ren, Duan, Liu, Mao, Peng, Liu, Cheng and Yang2008; Zhang et al. Reference Zhang, Zhang, Li and Lu2013; Hu, F. Y. et al. Reference Hu, Liu, Santosh, Deng, Wang, Zhang and Yan2016). Neoproterozoic magmatic rocks and detrital zircons, especially of 860–720 Ma age, are extensively distributed around the YGD (Zhang & Zheng, Reference Zhang and Zheng2013). The two large-scale magmatic events of the Neoproterozoic (c. 750 Ma and c. 820 Ma) recorded the evolution of the Earth's crust during Neoproterozoic time, which is an important characteristic of South China (Wang et al. Reference Wang, Zhou, Qiu, Liu and Zhang2006; Zhang et al. Reference Zhang, Zheng, Wu, Zhao, Gao and Wu2006a; Zheng & Zhang, Reference Zheng and Zhang2007). These activities may be related to the splitting of the Rodinia supercontinent. The peak detrital zircon ages obtained in this study (c. 776 Ma and c. 820 Ma; Fig. 4) confirm that the source of the study area rocks was the YGD and its provenance was related to the evolution of the Rodinia supercontinent during middle–late Neoproterozoic time. At present, a few igneous rocks of c. 924 Ma age exist in the YGD. Nevertheless, the Yanbian and Bikou groups (Fig. 6c), located in the western margin of the YGD and South Qinling, respectively, have a prominent age peak at c. 920 Ma. In this study, the Datangpo Formation (AH14) was found to have a zircon age peak of c. 938 Ma, which does not appear in the Gucheng Formation (AH06) (Fig. 4), indicating the likelihood of an event that led to the addition of material from new sources. Magmatic activities of Palaeoproterozoic age (c. 2.0 Ga) are distributed in the northern areas of the YGD, such as the areas of Kongling, Jinshan, Liantuo and South Qinling (Zhang et al. Reference Zhang, Zheng, Wu, Zhao, Gao and Wu2006c; Sun et al. Reference Sun, Chen, Zhao, Wilde, Ye, Guo, Chen and Yuan2008; Wu, Y. B. et al. Reference Wu, Gao, Zhang, Zheng, Liu, Wang, Gong, Zhou and Yuan2012; Yin et al. Reference Yin, Lin, Davis, Zhao, Xiao, Li and He2013; Nie et al. Reference Nie, Yao, Wan, Zhu, Wolfgang and Chen2016; Wang, W. et al. Reference Wang, Cawood, Zhou and Zhao2016), which records the tectonic heating events of the Kongling Complex and the crustal reconstruction event in the north of the YGD (Zheng & Zhang, Reference Zheng and Zhang2007 and references therein). Archaean zircons (c. 2500 Ma) are from the Yichang Kongling trondhjemitic gneiss and migmatite (Wu et al. Reference Wu, Zhou, Gao, Liu, Qin, Wang, Yang and Yang2014), and the Hu Yang Po Group and intrusion of potassium granite in Zhongxiang (Wang, L. J. et al. Reference Wang, Griffin, Yu and O'Reilly2013). Furthermore, a current study reported large magmatic rocks of c. 2.5 Ga as observed in the Douling Group, South Qinling (Hu et al. Reference Hu, Liu, Chen, Qu, Li and Geng2013; Wu et al. Reference Wu, Zhou, Gao, Liu, Qin, Wang, Yang and Yang2014). The 2.5 Ga age peak is characteristic of the YGD (Wu et al. Reference Wu, Chen, Xia, Deloule and Chen2002; Li, Li & He, Reference Li, Li and He2012). Although Archaean magmatic activity has rarely been reported in the YGD at present, magmatic activity should have taken place during this period, as it is an important period of crustal growth in South China. Among the samples, the ages of the oldest populations range from 2.4 Ga to 2.6 Ga, reflecting the magmatic event. Zircons aged c. 2.9 Ga are widespread within the YGD, such as in TTG gneiss and other rocks of the Kongling Complex in the north of the YGD (Qiu et al. Reference Qiu, Gao, McNaughton, Groves and Ling2000; Zhang et al. Reference Zhang, Zheng, Wu, Zhao, Gao and Wu2006b). The existence of a small amount of zircon of c. 2.9 Ga in the study area indicates that the southeastern margin of the YGD received small quantities of input from the north YGD.

Figure 6. Comparison of probabilistic histograms of age distributions for the detrital zircons from Precambrian (meta)sedimentary rocks and the distribution of Neoproterozoic igneous rocks in various parts of the Yangtze Domain (data from Zhao et al. Reference Zhao, Zhou, Yan, Zheng and Li2011 and references therein; Yang et al. Reference Yang, Yang, Polat and Xu2018 and references therein; samples in this study; modified from Yang et al. Reference Yang, Yang, Polat and Xu2018). Geologic map of South China modified after the 1:2500000 geologic map of CAGS (2004). (Dongchuan Gp: 1.8–1.4 Ga; Dahongshan Gp: 1.8–1.4 Ga; Kunyang Gp: 1.2–1.0 Ga; Huili Gp: 1.2–1.0 Ga; Yanbian Gp: 825–738 Ma; Bikou Gp: 821–730 Ma; Shennongjia Gp: 1.4–1.0 Ga; Wudang Gp: c. 780 Ma; Nanhua System: 720–635 Ma; Suixian Gp: c. 760 Ma; Huashan Gp: c. 820 Ma.)

Figure 6. Comparison of probabilistic histograms of age distributions for the detrital zircons from Precambrian (meta)sedimentary rocks and the distribution of Neoproterozoic igneous rocks in various parts of the Yangtze Domain. (Liantuo Fm: c.780 Ma; Xiuning Fm: c. 730 Ma; Luokedong Fm: c. 767 Ma; Xikou Gp: 780–720 Ma; Banxi Gp: 820–720 Ma; Xiajiang Gp: 820–720 Ma; Xieshuihe Fm: c. 690 Ma).
In this study, a total of 6767 U–Pb ages for detrital zircons from Precambrian metasedimentary strata around the YGD were collected for comparison (Fig. 6a–q). All detrital zircons exhibited the age peak characteristics of the Precambrian basement in the YGD (Fig. 6). The Nanhua strata in the study area appears to have the features of a mix of former sequences with age peaks at c. 0.68 Ga, c. 0.8 Ga, c. 0.9 Ga, c. 2.0 Ga and c. 2.5 Ga (Fig. 6o). Compared with the detrital zircon age data in the Precambrian basement in the periphery of the YGD, the Wudang Group, Xiuning Formation, Banxi Group and Xiajing Group developed along the Exi Strait show the same age peak characteristics with age peaks at c. 0.8 Ga, c. 2.0 Ga and c. 2.5 Ga (Fig. 6e, j, l–n, p). A prominent c. 1.8 Ga age peak (Fig. 6a–c) was observed in the western and northwestern YGD, and a prominent age peak of c. 2.6 Ga was obtained in the Huangling granite, which are not found in the study area (Fig. 6f, q). It is unlikely that these two regions are sources of the study area. At present, the source composition of the study area is consistent with the eastern JNO and South Qinling, although there is a lack of c. 680 Ma sources in the eastern JNO (Fig. 6).
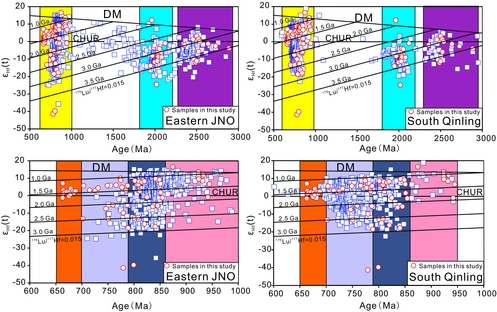
We determined the zircon ɛHf(t) values of South Qinling and the eastern JNO to distinguish the differences between the two regions. As shown in Figure 7, the two regions exhibited distinct ɛHf(t) value characteristics. In South Qinling (Fig. 7), a significant change occurred at c. 850 Ma, as marked by an increase in negative ɛHf(t) values of the <850 Ma detrital zircons relative to those at 950–850 Ma. Another change occurred at c. 700 Ma, as characterized by a reduction in negative ɛHf(t) values of the <700 Ma detrital zircons relative to those at 850–700 Ma. Furthermore, the negative and positive values were relatively uniform for the age range of 850–700 Ma. In the eastern JNO (Fig. 7), zircons show mostly positive ɛHf(t) values at >870 Ma, both negative and positive ɛHf(t) values at 870–810 Ma, and dominantly negative ɛHf(t) values at <810 Ma. In this study, the ɛHf(t) values of 13 detrital zircons from our samples of c. 680 Ma age are generally positive except for two magmatic zircons, and the characteristics are generally in line with the characteristics of c. 680 Ma age zircons in South Qinling; however, this source is lacking in the eastern JNO (Fig. 7). Another difference is that zircons show mostly negative ɛHf(t) values at 850–700 Ma in the eastern JNO and show both negative and positive ɛHf(t) values at 850–700 Ma in South Qinling. The characteristics of the values at 850–700 Ma are the same as those of South Qinling (Fig. 7). In addition, the characteristics of the values at >850 Ma in our samples show similarities to those of South Qinling.

Figure 7. Plots of ɛHf(t) values versus crystallization ages of zircons from South Qinling and the eastern JNO (data from Yang et al. Reference Yang, Yang, Polat and Xu2018 and references therein; samples in this study). DM – depleted mantle; CHUR – chondritic uniform reservoir.
A metamorphic zircon (AH06-20) aged 2017.59±37 Ma was also found (Figs 3, 5). Current research suggests that the main source of metamorphic zircons of c. 2.0 Ga age is the Kongling Complex (Zhang et al. Reference Zhang, Zheng, Wu, Zhao, Gao and Wu2006c; Wu et al. Reference Wu, Gao, Gong, Xiang, Jiao, Yang, Liu and Yuan2009; Yin et al. Reference Yin, Lin, Davis, Zhao, Xiao, Li and He2013), and metamorphic zircons of the same period are also found in the Douling Group of South Qinling (Nie et al. Reference Nie, Yao, Wan, Zhu, Wolfgang and Chen2016). As mentioned above, the source of the study area is more likely to be the South Qinling than the Kongling area.
In summary, the provenance characteristics of the end of the Sturtian ice age (c. 660 Ma) in western Hunan are reflected in the crust formed by episodic accretion, which is related to supercontinent growth and cracking in the Archaean, Palaeoproterozoic and Neoproterozoic. We believe that at the end of the Sturtian ice age as early as c. 680 Ma, South Qinling was the main source area for western Hunan.
5.b. Migration process of sedimentary provenance
As mentioned earlier, source rocks of c. 680 Ma are represented by Neoproterozoic igneous rocks mainly in the South Qinling area on the northern rim of the YGD, and the source of the study area rocks is South Qinling. The characteristic age peak of c. 680 Ma can be used to determine the transport of source materials from South Qinling to western Hunan.
In addition to the geological section investigated in this study, details of the regional stratigraphy and sampling lithology for the following other sections are available in the published literature: Wudang section, Yichang section, Changyang section, Shimen section, Guzhang section, Songtao section and Guibei section (Figs 8, 9).

Figure 8. The U–Pb age of the Nanhua System (720–635 Ma) distributed in the Yangtze Domain. (a, a′) Wudangshan section (Ling et al. Reference Ling, Duan, Liu, Cheng, Mao, Peng, Liu, Yang and Ren2010; Wang, L. J. et al. Reference Wang, Griffin, Yu and O'Reilly2013); (b, b′) Yichang section (Hofmann et al. Reference Hofmann, Linnemann, Rai, Baecker, Gärtner and Sagawe2011; Pi & Jiang, Reference Pi and Jiang2016; Hu, R. et al. Reference Hu, Li, Wang and Chen2016); (c, c′) Changyang section (Liu, X. M. et al. Reference Liu, Gao, Diwu and Ling2008; Liu et al. Reference Liu, Li, Chen, Lan, Yang, Shang and Yin2015); (d, d′) Shimen section (Lan et al. Reference Lan, Li, Zhu, Zhang and Li2015; Wang et al. Reference Wang, Chen, Hu, Chu and Yang2012a); (e, e′) Guzhang section (Zhang, Jiang & Han, Reference Zhang, Jiang and Han2008); (f, f′) Songtao section (Yin et al. Reference Yin, Wang, Tang, Wan, Wang, Gao, Xing and Liu2006; Wang et al. Reference Wang, Griffin, Yu and O'Reilly2010; Yu et al. Reference Yu, Du, Zhou, Wang, Yuan, Xu, Pan, Xie, Qi and Jiao2016); (g, g′) Anhua section (the data in this study); (h, h′) Guibei section (Gao et al. Reference Gao, Lu, Ding, Wang, Liu and Li2013; Han et al. Reference Han, Wang, Ding, Ren, Gao, Liu, Pang and Xue2016; and some unpub. data).

Figure 9. Source migration palaeogeographic map of South China during deposition of the middle–upper Nanhua System. (a – Wudang section; b – Yichang section; c – Changyang section; d – Shimen section; e – Guzhang section; f – Songtao section; g – Anhua section; h – Guibei section.)
Considering that the source of the study area rocks is South Qinling and not the EZOL, source materials may have been transported along the Exi Strait to the study area. A total of 2640 U–Pb ages for detrital zircons from eight sections along the Exi Strait were compiled (Figs 8, 9). As show in Figure 8, the main peaks of each profile are at c. 0.8 Ga, c. 2.0 Ga and c. 2.5 Ga, except for the Guzhang and Songtao sections (Fig. 8e, f: only counting tuff age). The Yichang and Changyang sections have an age peak of c. 2.6 Ga, which differs from the others, indicating that the source material from the Kongling area was transported to the Changyang area and was blocked from reaching western Hunan (Fig. 8b, c). Furthermore, the c. 680 Ma source material appeared to reach the Changyang area but not the Yichang area, which implies that the source material carrying the c. 680 Ma zircons (South Qinling) could not have been transported to the Changyang area through the EZOL, and could only have been transported along the Exi Strait (Fig. 8b′, c′). The c. 680 Ma age peak was found within the Exi Strait (Fig. 8a′, c′–g′), further indicating that the source material from South Qinling was transported through the Exi Strait, depositing material along the way. Nevertheless, the c. 680 Ma source material disappeared on the northern edge of the Jiangnan Orogenic Belt in the Guibei section (Fig. 8h′), suggesting that the JNO blocked the migration of the source material.
In summary, the transportation of material from the northern margin of the YGD to the southeast margin of the YGD occurred as early as c. 680 Ma, and the source material migrated mainly through the Exi Strait.
5.c. Reconstruction of the palaeogeography
As mentioned above, the magmatic rocks in the SQB were emplaced during c. 941 Ma to 667 Ma. The magmatic rocks recorded four major Neoproterozoic magmatic events: (1) c. 940 Ma, the formation of arc-related high-Nb titanite-bearing diorites; (2) c. 885 Ma, the formation of gabbroic to dioritic arc-related rocks; (3) 785–740 Ma, widespread magmatism with the emplacement of intermediate to felsic granitoids, showing typical arc-related characteristics; and (4) c. 667 Ma gabbroic magmatism, formed in an extensional setting (Hu, F. Y. et al. Reference Hu, Liu, Santosh, Deng, Wang, Zhang and Yan2016). Four Neoproterozoic magmatic stages were recognized in the uplift zone of the SQB, corresponding to four magmatic stages in the northern margin of the YGD (Hu, F. Y. et al. Reference Hu, Liu, Santosh, Deng, Wang, Zhang and Yan2016 and references therein). The analogous crystallization ages and petrogenesis between the Neoproterozoic blocks in the western and middle SQB and the volcanic rocks of the Wudangshan and Yaolinghe groups (Ling et al. Reference Ling, Ren, Duan, Liu, Mao, Peng, Liu, Cheng and Yang2008; Wang, L. J. et al. Reference Wang, Griffin, Yu and O'Reilly2013; Zhu et al. Reference Zhu, Chen, Nie, Siebel, Yang, Xue and Zhai2014) and the Tiewadian pluton (Yang et al. Reference Yang, Liu, Li, Wang, Wang and Bai2012), point to a genetic correlation of the Neoproterozoic rocks in the SQB. Based on the evidence presented above, a large Neoproterozoic continental block was established in the SQB. In summary, we propose that there is a Neoproterozoic uplift zone in the SQB and the Neoproterozoic uplift was part of the northern margin of the YGD during the Neoproterozoic era. This study suggests that the uplift was a source of the study area strata (Fig. 9).
During early Neoproterozoic time (1.0–0.9 Ga), the ancient South China oceanic plate subducted beneath the southern margin of the YGD, forming an active continental margin. Subsequently, the ocean was closed, forming the Jiangshan– Shaoxing–Pingxiang ophiolitic melange belt. At 850–820 Ma, the Yangtze and Cathaysia domains completed collision and formed the Jiangnan Orogenic Belt (Shu, Reference Shu2012). The southeast margin of the Jiangnan Orogenic Belt developed S-type granite with an estimated age of 820 Ma (Shu, Reference Shu2006 and references therein). The intense collisional orogeny resulted in the formation of large areas of shallow metamorphic rocks. All of these suggest that the ancient South China plate formed after the long tectonic evolution of the Precambrian.
After 820 Ma, the South China Block entered the intraplate-rifting stage, corresponding to cracking of the Rodinia supercontinent, forming the Nanhua rift and Chuandian rift basins. Corresponding rift-type magmatic activities gave rise to formations, such as the bimodal volcanic rocks (Tiechuanshan Formation (817±5 Ma), Suxiong Formation (803±12 Ma) and the Taoyuan Formation (818±12 Ma)) (Wang & Li, Reference Wang and Li2003). It also included the earlier basal magmatic activity (840–790 Ma) along the Zhenghe–Dapu fault (Shu, Reference Shu2012). The South China Block, which was composed of the Yangtze and the Cathaysia domains, cracked and formed the different terranes and rift basins (Fig. 2).
6. Conclusions
(1) The U–Pb ages of the youngest detrital zircon grains from the Niuguping, Gucheng and Datangpo formations yielded average ages of 712±24 Ma, 679.2±6.2 Ma and 665.1±7.4 Ma, respectively, which correspond closely to the depositional ages of each formation.
(2) Samples from western Hunan in the middle–upper Nanhua System have six main peak ages: c. 680 Ma, c. 780 Ma, c.820 Ma, c. 940 Ma, c. 2000 Ma and c. 2500 Ma. In addition, some magmatic zircons of c. 2900 Ma were also identified. The characteristics of the U–Pb ages and Hf isotopes indicate that there was a link between the north and southeast margins of the YGD as early as c. 680 Ma, and the provenance of the coeval sedimentary sequences of the southeast YGD was South Qinling on the northern margin of the YGD. Furthermore, the c. 2.0 Ga metamorphic zircons also indicate that the source of the study area is South Qinling.
(3) From the analysis of the c. 680 Ma provenance in the YGD, we surmise that source rock materials were transported from the north to south to the southeast edge of the YGD through the Exi Strait and disappeared on the northern edge of the Jiangnan Orogenic Belt. The Exi Strait served as the main channel for the migration of materials.
Acknowledgements
This study was supported by the National Natural Sciences Foundation of China (Grant No. 41472190 and 41172189). We sincerely thank Prof. Wei Wang for constructive suggestions that have greatly improved the manuscript. We appreciate Dr. Wenchao Yu for his comments on this paper. We also acknowledge Zhaochu Hu for his assistance in the LA-ICP-MS U–Pb zircon analysis conducted at the State Key Laboratory of Geological Processes and Mineral Resources, China University of Geosciences, Wuhan.
Supplementary material
To view supplementary material for this article, please visit https://doi.org/10.1017/S0016756818000535