


1. Introduction
The Nazca Ridge separates the Chile and Peru oceanic basins (Fig. 1a) (e.g. Kukowski et al. Reference Kukowski, Hampel, Hoth and Bialas2008), which have their shallowest closed bathymetric contour at 3600 m water depth. These basins are open at sills and trenches where bottom water flow connects to the surrounding basins (Lonsdale, Reference Lonsdale1976; Harris et al. Reference Harris, Macmillan-Lawler, Rupp and Baker2014; Harris & Macmillan-Lawler, Reference Harris, Macmillan-Lawler, Micallef, Krastel and Savini2018). The Nazca Ridge is a bathymetric high marked by numerous seamounts with an elongated and rough morphology (Harris et al. Reference Harris, Macmillan-Lawler, Rupp and Baker2014; Casalbore, Reference Casalbore, Micallef, Krastel and Savini2018). This aseismic ridge is being subducted under the South American Plate (Pilger, Reference Pilger1981) where it is interacting with the active margin by increasing tectonic erosion (von Huene et al. Reference von Huene, Pecher and Gutscher1996; Hampel, Reference Hampel2002; Clift et al. Reference Clift, Pecher, Kukowski and Hampel2003; Hampel et al. Reference Hampel, Kukowski, Bialas, Huebscher and Heinbockel2004). Its influence is felt as far inboard as the Andes (e.g. Gutscher et al. Reference Gutscher, Olivet, Aslanian, Eissen and Maury1999; Rousse et al. Reference Rousse, Gilder, Farber, McNulty, Patriat, Torres and Sempere2003) and possibly the Amazon foreland basin (Espurt et al. Reference Espurt, Baby, Brusset, Roddaz, Hermoza, Regard, Antoine, Salas-Gismondi and Bolaños2007). Two Ocean Drilling Program (ODP) sites, 1236 and 1237, have drilled this ridge, coring Oligocene to Recent sediments with pelagic to hemipelagic facies (Tiedemann & Mix, Reference Tiedemann, Mix, Tiedemann, Mix, Richter and Ruddiman2007; Fig. 1a).
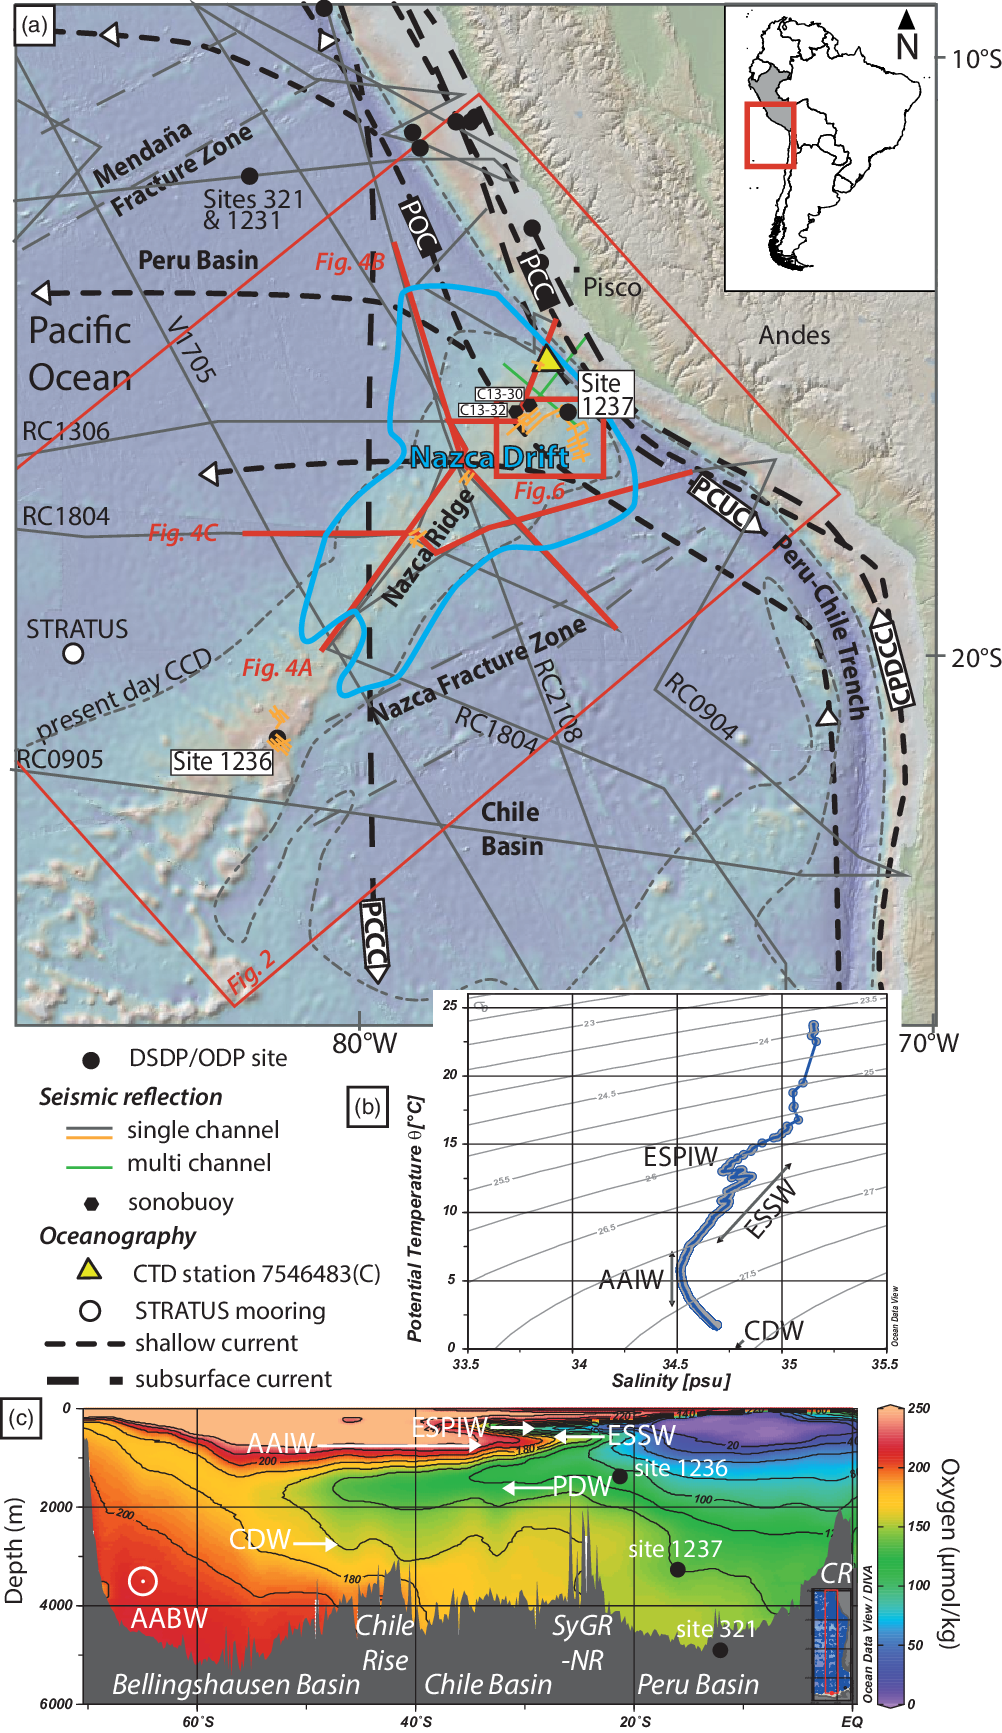
Fig. 1. (a) Bathymetry and topography of the SE Pacific locating the Nazca Drift System with a blue outline (black lines; data from: single channel seismic lines from Marine Geoscience Data System, https://www.marine-geo.org; R/V Sonne cruise SO146-GEOPECO (green lines; Hampel et al. Reference Hampel, Kukowski, Bialas, Huebscher and Heinbockel2004) and GENEO3RR (orange lines; Mix, Reference Mix1997). Sonobuoy data C13-30 and C13-32 are located near ODP Site 1237 (J. B. Diebold, unpub. data table, 1996: sediment and crustal velocities from sonobuoy solutions; accessed from http://www.geomapapp.org, 2019). Arrows indicate general flow directions of surface currents (black short dots bold line; PCC – Peru Coastal Current; POC – Peru Oceanic Current) and subsurface currents (black long dots bold line; PCCC – Peru–Chile Countercurrent; CPDCC – Chile–Peru Deep Coastal Current; PCUC – Peru–Chile Undercurrent) (e.g. Chaigneau et al. Reference Chaigneau, Dominguez, Eldin, Vasquez, Flores, Grados and Echevin2013) along the Peru–Chile margin. Drilling sites are from DSDP and ODP Legs 112, 138 and 202 (Shipboard Scientific Party, Reference Suess, von Huene, Emeis, Bourgois, del C Cruzado Casteñeda, De, Wever, Eglinton, Garrison, Greenberg, Herrera Paz, Hill, Ibaraki, Kastner, Kemp, Kvenvolden, Langridge, Lindsley-Griffin, Sanchez Fernandez, Schrader, Thornburg, Wefer and Yamano1988, Reference Mayer, Pisias, Janecek, Baldauf, Bloomer, Dadey, Emeis, Farrell, Flores, Galimov, Hagelberg, Holler, Hovan, Iwai, Kemp, Kim, Klinkhammer, Leinen, Levi, Levitan, Lyle, MacKillop, Meynadier, Mix, Moore, Raffi, Ravelo, Schneider, Shackleton, Valet and Vincent1992, Reference Mix, Tiedemann, Blum, Abrantes, Benway, Cacho-Lascorz, Chen, Delaney, Flores, Giosan, Holbourn, Irino, Iwai, Joseph, Kleiven, Lamy, Lund, Martinez, McManus, Ninnemann, Pisias, Robinson, Stoner, Sturm, Wara and Wei2003 a). STRATUS mooring is located west of the study area (https://www.pmel.noaa.gov/co2/story/Stratus). (b) Temperature–salinity diagram at CTD station 7546483(C) (yellow triangle in (a); 15.373° S; 76.751° W). (c) Hydrographic section of the SE Pacific sector, oxygen concentrations showing major water masses and boundaries. AABW – Antarctic Bottom Water; AAIW – Antarctic Intermediate Water; CDW – Circumpolar Deep Water; ESPIW – South Pacific Intermediate Water; ESSW – Equatorial Subsurface Water; PDW – Pacific Deep Water. Ridges: SyGR – Sala y Gomes Ridge; NR – Nazca Ridge; CR – Carnegie Ridge.
This region of the SE Pacific Ocean is a key location for understanding the interplay between plate tectonics and climate change, because the oceanic domain is under the influence of southern and equatorial atmospheric cells and is famous for the Humboldt Current that flows along the coast of South America (von Humboldt, Reference von Humboldt1816; Shaffer et al. Reference Shaffer, Hormazabal, Pizarro and Ramos2004; Chaigneau et al. Reference Chaigneau, Dominguez, Eldin, Vasquez, Flores, Grados and Echevin2013). In this region the moving water masses are the intermediate water of the Pacific Central Water (PCW; 1500–3000 m), which has a southward movement, and the deep waters of the Circumpolar Deep Water (CDW, also known as CPDW; >3000 m) that flows northward (Fig. 1b, c; Emery & Meincke, Reference Emery and Meincke1986; Tsuchiya & Talley, Reference Tsuchiya and Talley1998; Talley, Reference Talley2013; Emery, Reference Emery, Cochran, Bokuniewicz and Yager2019). The shallow-water currents are the Peru Coastal Current (PCC) and the Peru Oceanic Current (POC) (Fig. 1a). The active deep-water currents are the poleward Peru–Chile Undercurrent (PCUC) and Peru–Chile Counter Current (PCCC), as well as the northward flowing Chile–Peru Deep Coastal Current (CPDCC; Chaigneau et al. Reference Chaigneau, Dominguez, Eldin, Vasquez, Flores, Grados and Echevin2013). The flow of water from the Sub-Antarctic Mode Water/Antarctic Intermediate Water (SAMW/AAIW) into the Chile Basin is characterized by a total equatorward transport of c. 7 Sv (Shaffer et al. Reference Shaffer, Hormazabal, Pizarro and Ramos2004). The bottom waters within the study area are dominated by the AAIW and the CDW (Fig. 1b). Oxygen concentrations along a hydrographic section from the Southern Ocean to the equator (c. 85° W) illustrate the vertical and spatial organization of the water masses and the direction of the current flow (Fig. 1c). In the SE Pacific Ocean, the deeper water masses consist of 40–60 % Antarctic Bottom Water (AABW) and 20–30 % North Atlantic Deep Water (NADW), but it is important to note that the CDW was not included in this analysis (Johnson, Reference Johnson2008). The CDW is the bottom water now active in the SE Pacific north of the Chile Rise and is not affected by the AABW (Tsuchiya & Talley, Reference Tsuchiya and Talley1998; Talley, Reference Talley2013). The Peruvian margin is strongly eroded by the bottom currents from the shelf to the base of slope (Calvès et al. Reference Calvès, Auguy, de Lavaissière, Brusset, Calderon and Baby2017). The influence of the Andes and its uplift on oceanic currents has been modelled (Sepulchre et al. Reference Sepulchre, Sloan, Snyder and Fiechter2009) despite limited documentation of geological features (Lonsdale & Malfait, Reference Lonsdale and Malfait1974; Lonsdale, Reference Lonsdale1976) related to oceanic currents, such as the Humboldt Current. The SE Pacific is under the influence of the Antarctic Circumpolar Current (ACC), with a dated onset during Oligocene time (e.g. Barker et al. Reference Barker, Filippelli, Florindo, Martin and Scher2007; Lyle et al. Reference Lyle, Gibbs, Moore and Rea2007; Scher et al. Reference Scher, Whittaker, Williams, Latimer, Kordesch and Delaney2015). This setting of oceanic basins and bathymetric highs bathed by moving water masses is prone to erosion and transport of sediments by bottom water current action and thus the emplacement of contourite drifts (Lonsdale & Malfait, Reference Lonsdale and Malfait1974; Lonsdale, Reference Lonsdale1976; Esentia et al. Reference Esentia, Stow, Smillie, Micallef, Krastel and Savini2018; Juan et al. Reference Juan, Van Rooij and De Bruycker2018), despite low predicted velocities at the seafloor (Thran et al. Reference Thran, Dutkiewicz, Spence and Müller2018). We document the first regional compilation of surface and subsurface data to describe the Nazca Drift System in the evolution of the southern hemisphere oceanic cell. More generally we seek to understand the role that the vertical motion of water masses and seafloor bathymetry has had in shaping open ocean contourite drifts in the SE Pacific Ocean since Oligocene time.
2. Methods
Data are sourced from various vintage seafloor bathymetric surveys and seismic reflection acquisitions acquired since the 1960s (NOAA-NCEI; https://www.ngdc.noaa.gov/mgg/mggd.html). The main source of regional seismic profiles is the analogue seismic reflection profile databank at the Lamont-Doherty Earth Observatory (LDEO) and single channel seismic (SCS) profiles RC0904, RC0905, RC1306, RC1307, RC1804 and RC2108 (https://www.ngdc.noaa.gov/mgg/seismicreflection/index.html). A more recent seismic reflection site survey (GENEO3RR, 1997) was acquired to plan drilling sites for ODP Leg 202 (Fig. 1a; Tiedemann & Mix, Reference Tiedemann, Mix, Tiedemann, Mix, Richter and Ruddiman2007). The vintage SCS have a lower vertical resolution compared to the modern SCS, which have a peak frequency of 55–60 Hz. ODP Site 1237 provides ages for calibrating the seven interpreted seismic reflections from the acoustic basement to the seafloor (Tiedemann & Mix, Reference Tiedemann, Mix, Tiedemann, Mix, Richter and Ruddiman2007).
The seafloor has been mapped using multibeam bathymetric data (NOAA-NCEI multibeam bathymetry; https://www.ngdc.noaa.gov/maps/autogrid/) across the Nazca Ridge and surrounding Peru and Chile basins (Fig. 2a). The regional bathymetry is sourced from the General Bathymetric Chart of the Oceans (GEBCO) Compilation Group (2019; https://www.gebco.net/data_and_products/gridded_bathymetry_data/). The main lithologies cropping out at the seafloor are calcareous oozes and other fine-grained calcareous sediments overlying the Nazca Ridge igneous basement, and siliciclastic clay and diatom oozes in the surrounding basins (Dutkiewicz et al. Reference Dutkiewicz, Müller, O’Callaghan and Jónasson2015; https://www.earthbyte.org/webdav/ftp/papers/Dutkiewicz_etal_seafloor_lithology/). In this study we follow the seafloor geomorphologic analysis of Harris et al. (Reference Harris, Macmillan-Lawler, Rupp and Baker2014) (Fig. 2b). The seismic dataset spanning the Nazca Ridge and surrounding area covers most of the different abyssal to trench settings (or features) identified by Harris et al. (Reference Harris, Macmillan-Lawler, Rupp and Baker2014). Seafloor depths range from 1550 to 5270 m in the SE Pacific Ocean, offshore Peru (Fig. 1a). The uninterpreted seismic data are provided in the online Supplementary Material Figures S1 and S2. The seismic data displayed in this study are zero phase and have the Society of Exploration Geophysicists normal polarity, i.e. black peak indicating an increase in acoustic impedance. With a dominant frequency of 55–60 Hz and a velocity of 1800 m s−1, the seismic resolution, defined as a quarter of the dominant wavelength, would be 7–9 m. We use a constant velocity (1500 m s−1) for depth conversion of the seafloor from time to depth domain. Depth conversions of the sediments are based on a velocity of 1800 ± 200 m s−1 derived from the refraction profiles in the eastern part of the study area (Hampel et al. Reference Hampel, Kukowski, Bialas, Huebscher and Heinbockel2004) and two sonobuoy solutions (C13-30 and C13-32; Fig. 1; J. B. Diebold, unpub. data table, 1996: sediment and crustal velocities from sonobuoy solutions; accessed from http://www.geomapapp.org, 2019). No velocity measurements on sediments or wireline logs have been acquired within the study area.

Fig. 2. Seafloor bathymetry and geomorphology of the Nazca Drift System and the surrounding basins. (a) Multibeam (in colour, NOAA-NCEI; https://www.ngdc.noaa.gov/maps/autogrid/) and GEBCO (greyscale; https://www.gebco.net/data_and_products/gridded_bathymetry_data/) bathymetry of the study area. Insets: examples of three different seafloor geomorphologies: (α) faulted oceanic crust, (β) volcanic seamount, and (γ) smooth seafloor/drift (CI – contour interval). (b) Seafloor typology from interpretation of Harris et al. (Reference Harris, Macmillan-Lawler, Rupp and Baker2014).
The 2-D seismic data in this study have been interpreted using standard seismic stratigraphic techniques (Mitchum et al. Reference Mitchum, Vail, Sangree and Payton1977; Vail et al. Reference Vail, Todd, Sangree and Payton1977) based on reflection terminations and seismic facies reflection characteristics (amplitude, frequency). The seafloor reflection shows concordance (no termination) or truncation (erosional or structural) and together with the surrounding reflections is interpreted as a sequence boundary (Mitchum et al. Reference Mitchum, Vail, Sangree and Payton1977). A megasequence is defined as being between the acoustic basement and the seafloor reflection. In the focus study area near ODP Site 1237, a detailed analysis of the seismic units with age calibration is possible (Fig. 1). The seismic facies identified are summarized in Figure 3. Two classes of seismic facies are observed, the first is associated with volcanic/oceanic crust features (e.g. Calvès et al. Reference Calvès, Schwab, Huuse, Clift, Gaina, Jolley, Tabrez and Inam2011) and the second with bottom current–induced sedimentary features (e.g. Faugères et al. Reference Faugères, Stow, Imbert and Viana1999; Rebesco & Stow; Reference Rebesco and Stow2001; Hernández-Molina et al. Reference Hernández-Molina, Llave, Stow, Rebesco and Camerlenghi2008; Dubois & Mitchell, Reference Dubois and Mitchell2012; Rebesco et al. Reference Rebesco, Hernández-Molina, Van Rooij and Wåhlin2014 and references therein; Stow et al. Reference Stow, Smillie, Pan, Esentia, Cochran, Bokuniewicz and Yager2019; Bailey et al. Reference Bailey, McArthur and McCaffrey2021). A regional cross-section and isopach map of the entire megasequence allows identification of the main depocentres (Fig. 4). Oceanographic data (temperature, salinity, oxygen) are sourced from the National Oceanic and Atmospheric Administration (NOAA) World Ocean Database (WOD13) (Boyer et al. Reference Boyer, Antonov, Baranova, Coleman, Garcia, Grodsky, Johnson, Locarnini, Mishonov, O’Brien, Paver, Reagan, Seidov, Smolyar, Zweng, Levitus and Mishonov2013).

Fig. 3. Seismic facies observed in the study area between the acoustic basement (TB – top basement) and the seafloor. Two main seismic facies classes, volcanic rocks and sedimentary, are observed within the study area and interpreted based on Calvès et al. (Reference Calvès, Schwab, Huuse, Clift, Gaina, Jolley, Tabrez and Inam2011), and Dubois & Mitchell (Reference Dubois and Mitchell2012) and Rebesco et al. (Reference Rebesco, Hernández-Molina, Van Rooij and Wåhlin2014), respectively. TWT – two-way time.
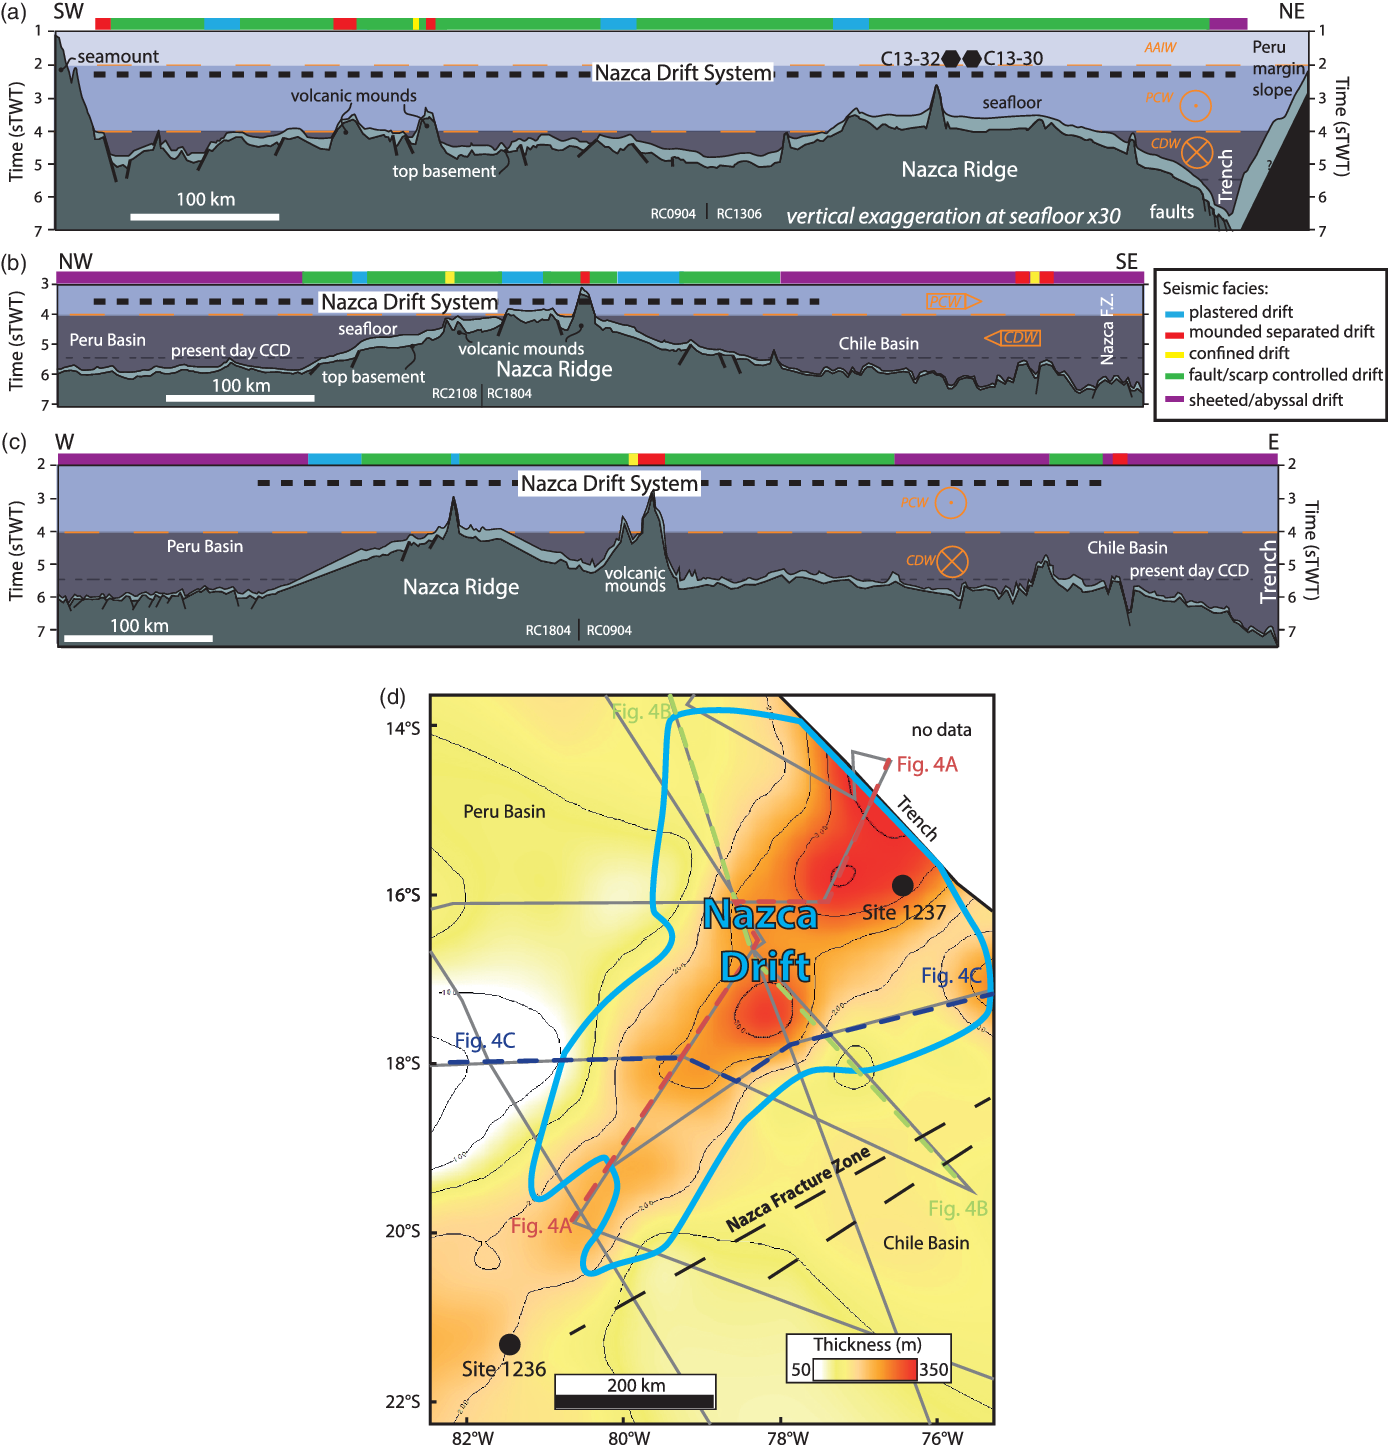
Fig. 4. Regional line drawing of seismic reflection lines (single channel seismic: SCS, LDEO) across the Nazca Ridge and the Nazca Drift System. (a) From seamount SW of Nazca Ridge to the Peru–Chile Trench (SW–NE). (b) From Peru Basin across the Nazca Ridge to the Chile Basin and the Nazca Fracture Zone (NW–SE). (c) From the Peru Basin to the Chile basin and Peru–Chile Trench (W–E). (d) Isopach map of megasequence above acoustic basement. AAIW – Antarctic Intermediate Water; CDW – Circumpolar Deep Water; PCW – Pacific Central Water; CCD – carbonate compensation depth.
3. Results
3.a. Seafloor morphology
The Nazca Ridge divides the study area along a SW–NE axis and separates the Chile and Peru basins (Fig. 2a). Within the study area we have identified, seaward of the Peru–Chile Trench, the transition of seafloor types/morphologies from faulted oceanic crust type morphology (α, Fig. 2a), volcanic mound/seamount (β, Fig. 2a), to smooth seafloor associated with hemipelagic sedimentation and contourite drifts (γ, Fig. 2a). The faulted oceanic crust seafloor type shows various sedimentary covers, with a very thin drape towards the spreading centre of the East Pacific Rise to a thicker sedimentary cover and smoother seafloor towards the trench. The oceanic crust around the Nazca Ridge is linked to fast seafloor spreading at c. 100 mm yr−1 (Wright et al. Reference Wright, Seton, Williams and Müller2016), as expressed by the numerous faults observed at the seafloor (Fig. 2a, inset α) that mark the abyssal hills and abyssal plains (Cormier & Sloan, Reference Cormier, Sloan, Micallef, Krastel and Savini2018). Near the trench, the oceanic crust and overlying sediments are affected by normal faults caused by the bending of the plate by subduction (Kukowski et al. Reference Kukowski, Hampel, Hoth and Bialas2008). This bending extends c. 150 km from the trench axis and progressively advances as the Nazca Ridge is subducted, but this only affects a rather small part of the area considered in this study and the angle of subduction and bending changes slowly over long periods of geologic time, but this is not thought to affect the interpretation of the drift presented here. The SW Nazca Ridge shows numerous volcanic mounds and seamounts (Fig. 2a, inset β; Fig. 2b). Towards the northeast, the seafloor of the Nazca Ridge shows fewer bathymetric highs related to volcanic features compared to the southwestern part (Fig. 2b; Hampel et al. Reference Hampel, Kukowski, Bialas, Huebscher and Heinbockel2004). The Nazca Ridge shows the seafloor geomorphology of an oceanic plateau (Harris et al. Reference Harris, Macmillan-Lawler, Rupp and Baker2014; Fig. 2b), is narrow in the southwest (c. 156 km) and wider towards the northeast (c. 296 km). The seafloor is smoother in the same direction reflecting the thicker sediment cover present to the northeast (Fig. 2a, inset γ; Fig. 2b). Nonetheless, the smooth seafloor is also affected by incisions that are oriented perpendicular to the Nazca Ridge axis (Fig. 2a, inset γ) and that mark abyssal erosion linked to bottom current activity (Lonsdale, Reference Lonsdale1976; Land et al. Reference Land, Paull and Spiess1999; Gomes & Viana, Reference Gomes, Viana, Stow, Pudsey, Howe, Faugères and Viana2002; Dubois & Mitchell, Reference Dubois and Mitchell2012; Mitchell & Huthnance, Reference Mitchell and Huthnance2013; Rebesco et al. Reference Rebesco, Hernández-Molina, Van Rooij and Wåhlin2014; Juan et al. Reference Juan, Van Rooij and De Bruycker2018). The relative importance of physical erosion and carbonate dissolution below the carbonate compensation depth (CCD) cannot be clearly resolved (Lonsdale, Reference Lonsdale1976).
3.b. Seismic facies
Although numerous different seismic facies schemes have been proposed in the literature, these typically share many similarities (e.g. Rebesco & Stow, Reference Rebesco and Stow2001; Stow et al. Reference Stow, Faugères, Gonthier, Cremer, Llave, Hernández-Molina, Somoza, Díaz-Del-Río, Stow, Pudsey, Howe, Faugères and Viana2002; Donda et al. Reference Donda, Brancolini, Santis and Trincardi2003; Nielsen et al. Reference Nielsen, Knutz, Kuijpers, Rebesco and Camerlenghi2008; Ryan et al. Reference Ryan, Helland-Hansen, Johannessen and Steel2009; Boyle et al. Reference Boyle, Romans, Tucholke, Norris, Swift and Sexton2017). We opt to use the scheme of Faugères et al. (Reference Faugères, Stow, Imbert and Viana1999), because it addresses all the different seismic patterns seen in this work and alternatives do not provide a significant advance in this case. Two main seismic facies classes are observed within the study area. The first class comprises reflectors interpreted as volcanic features, such as volcanic mounds, volcanic sills and the oceanic basement itself (Fig. 3). The second class is interpreted as deep-water sedimentary facies linked to the bottom currents observed to flow along the upper slopes of seamounts towards abyssal basins (Fig. 3).
The oceanic basement facies is encompassed by a single high amplitude reflection with minor to major offset related to faults (Fig. 3). This regional facies is locally affected by topographic highs that are associated with volcanic mounds (Fig. 3). The mounds have a variety of heights and slopes with steep or steepened flanks. These volcanic mounds have very low amplitude chaotic internal facies with rare high amplitude reflections. Most of these mounds are partially or completely buried under the concordant to onlapping parallel seismic facies described below. A cross-cutting high amplitude facies is present in the sedimentary cover above the acoustic basement. This high amplitude, saucer-shaped facies is interpreted to be indicative of volcanic sills (Planke et al. Reference Planke, Rasmussen, Rey, Myklebust, Doré and Vining2005; Magee et al. Reference Magee, Hunt-Stewart and Jackson2013) (Fig. 3). The other observed facies are all within the seismic sequence spanning between the acoustic basement/oceanic crust and the seafloor. The most extensive facies developed regionally above the oceanic crust is the sheeted abyssal drift (Figs 3e, 4) that is characterized by parallel-concordant low to high amplitude reflections. The drift is mainly present in the two oceanic basins of Peru and Chile and in the Peru–Chile Trench where it is cut by faults (Fig. 4a). This facies was drilled at Deep Sea Drilling Project (DSDP) Site 321/ODP Site 1231 in the northern Peru Basin (Fig. 1) where it comprises fine-grained sediments, such as hemipelagic clay rich in siliceous fossils, discrete tephra horizons and dispersed volcanic ash, as well as nannofossil ooze interbedded with iron-rich nannofossil ooze (Shipboard Scientific Party, Reference Yeats, Hart, Ade-Hall, Bass, Benson, Hart, Quilty, Sachs, Salisbury and Vallier1976, Reference D’Hondt, Jørgensen, Miller, Aiello, Belkins, Blake, Cragg, Cypionka, Dickens, Ferdelman, Ford, Gettemy, Guèrin, Hinrichs, Holm, House, Inagaki, Meister, Mitterer, Naehr, Niitsuma, Parkes, Schippers, Skilbeck, Smith, Spivack, Teske and Wiegel2003 b).
Four other seismic facies are observed in shallower layers of the SE Pacific Ocean. The first has low amplitude reflections in seismic data, with edges marked by a moat and wavy to parallel reflections. This facies is typical of a plastered drift (Fig. 3a; e.g. Faugères et al. Reference Faugères, Stow, Imbert and Viana1999) and is mainly observed on the edge of the Nazca Ridge (Fig. 4b, c). On the edge of some volcanic mounds, this facies has a mounded morphology, with low internal amplitudes that show an aggrading stack towards the flank of the topographic highs and thinning towards the external part of the mound. Parallel reflections are observed at the base of the mound and wavy reflections towards its upper surface. A small depression is observed along the contact between the mound edge and the supporting underlying structure. This mounded facies is associated with a moat (Fig. 3b). Mounded features, isolated from the main Nazca Ridge (i.e. separated), show basal terminations that are onlapping or downlapping. When the mounds lie adjacent to a bathymetric high they show a depressed upper surface (‘moat’ or contourite channel), which is aggrading and migrating upslope. Therefore, we interpret these features as a mounded separated/isolated drift following the scheme of Faugères et al. (Reference Faugères, Stow, Imbert and Viana1999). Where two topographic/basement highs are present, mounded features with low to high amplitude, parallel to wavy internal reflection are observed with moats in seismic data at their edges. These types of structures are typical of a confined drift (Fig. 3c; e.g. Faugères et al. Reference Faugères, Stow, Imbert and Viana1999; Bailey et al. Reference Bailey, McArthur and McCaffrey2021). The thickest and most extensive facies is typically a mounded-wedge of sediments with low seismic amplitude, with a moat along the edge of the mound and with parallel to subparallel internal reflections. This facies is identified as a fault/scarp-controlled drift because of its link to the steep, fault-bounded slopes of the Nazca Ridge (Fig. 3d; e.g. Rebesco & Stow, Reference Rebesco and Stow2001 and references therein). This facies is present between the Nazca Ridge top and the edge of the ridge (Fig. 4). This facies transitions away from the ridge into thinner bedded facies such as the sheeted abyssal drift (Fig. 4). In the following section the facies related to bottom currents are identified on a regional section (Fig. 4a–c) and combined with a thickness map of the sedimentary pile to define the Nazca Drift System (Fig. 4d).
3.c. Nazca Drift System
Various seismic facies are observed within the complete sedimentary column between the top of the oceanic crust and/or Nazca Ridge (top basement) and the seafloor (Figs 3, 4a–c). The Nazca Drift System extends over the whole study area, with thickness varying from c. 104 m on the SW flank of the Nazca Ridge at ∼18° N to 375 m on the top of the ridge offshore southern Peru (Fig. 4d). Within this sequence the main depocentre is located in the NE part of the Nazca Ridge (north of 18° S) and extends from SW to NE (Fig. 4a, d), reaching a maximum thickness in the Peru–Chile Trench. From the Nazca Fracture Zone to the Peru Basin, the sequence thickens above the Nazca Ridge (Fig. 4b, d). The minimum thickness of this sequence is observed in the northern part of the Peru Basin (Fig. 4c, d). Locally the sequence is very thin, especially on the slopes of seamounts and volcanic mounds (Fig. 4a–c). The oceanic crust in the study area spans an age of 45 Ma on the edge of the Peru–Chile Trench to younger than 32 Ma southwest of the Nazca Ridge (Hampel, Reference Hampel2002; Müller et al. Reference Müller, Sdrolias, Gaina and Roest2008). At ODP Site 1237 the oldest strata cored are Oligocene, with an age of c. 31 Ma (Shipboard Scientific Party, Reference Mix, Tiedemann, Blum, Abrantes, Benway, Cacho-Lascorz, Chen, Delaney, Flores, Giosan, Holbourn, Irino, Iwai, Joseph, Kleiven, Lamy, Lund, Martinez, McManus, Ninnemann, Pisias, Robinson, Stoner, Sturm, Wara and Wei2003 a; King & Wade, Reference King and Wade2017). The basement was not reached at that location.
4. Discussion
4.a. Regional stratigraphy
The Nazca Drift, which spans c. 500 km by 850 km, compares with other major drift systems worldwide. The Meiji Drift in the North Pacific is up to 1800 m thick, over 1000 km long and c. 350 km wide (Kerr et al. Reference Kerr, Scholl and Klemperer2005). The Gardar Drift of the North Atlantic extends for 1100 km, while the smaller Bjorn and Eirik drifts are 300 and 650 km long each and reach thicknesses of 720 and 1400 m, respectively (Parnell-Turner et al. Reference Parnell-Turner, White, McCave, Henstock, Murton and Jones2015). The carbonate affiliated Pourtales Drift of the Bahamas Bank–Florida margin runs for c. 400 km and is 30 km across and c. 500 m thick (Mulder et al. Reference Mulder, Ducassou, Hanquiez, Principaud, Fauquembergue, Tournadour, Chabaud, Reijmer, Recouvreur, Gillet, Borgomano, Schmitt and Moal2019); the nearby confined Sarenten Drift (200 by 60 km) is more than 1000 m thick (K. L. Bergman, unpub. Ph.D. thesis, Univ. Miami, 2005). The confined Sumba Drift in Indonesia is more than 1000 m thick but only c. 20 km wide by 120 km long (Reed et al. Reference Reed, Meyer, Silver and Prasetyo1987). Likewise, the confined Faro Drift in the Gulf of Cadiz extends for 80 km and reaches thicknesses of 600 m (Stow et al. Reference Stow, Faugères, Gonthier, Cremer, Llave, Hernández-Molina, Somoza, Díaz-Del-Río, Stow, Pudsey, Howe, Faugères and Viana2002). Intermediate sized drifts in the SW Pacific, the Chatham and Rekohu drifts, are 300 and 250 km long and are 400 and 480 m thick, respectively (Carter & McCave, Reference Carter and McCave1994, Reference Carter, McCave, Stow, Pudsey, Howe, Faugères and Viana2002; Bailey et al. Reference Bailey, McArthur and McCaffrey2021).
We interpret the Nazca Drift System based on the occurrence of seismic facies related to bottom currents, the thickness of the entire sequence and seafloor geometry. Its SW extent is presently not well defined because of the absence of regional seismic profiles in this part of the study area. Confined drift facies between and along the slopes of volcanic mounds in the southwest of the study area are observed at ODP Site 1236, but we limit the Nazca Drift System to being northwest of this area because a connection is not possible to establish at present as a result of the barrier created by the seamount southwest of the Nazca Ridge (Fig. 4a, d).
We rule out significant sedimentation in the form of carbonate platforms because of their distinctive shape on seismic, which is not observed in this case (cf. K. L. Bergman, unpub. Ph.D. thesis, Univ. Miami, 2005; Mulder et al. Reference Mulder, Ducassou, Hanquiez, Principaud, Fauquembergue, Tournadour, Chabaud, Reijmer, Recouvreur, Gillet, Borgomano, Schmitt and Moal2019), while core analysis confirms low volcanic input. Some of the material at ODP Site 1237 may have been transported by Trade Winds from the Atacama Desert, but this would be less important further south and further offshore. Evenly spread aeolian dust would not originally form the thickness variations mapped in the seismic but could be reworked by bottom currents. Mass wasting can be excluded based on the lack of seismically homogeneous intervals that characterize this type of sedimentation. The Nazca Drift System is pear-shaped in plan-view, with its widest part located at the Peru–Chile Trench (Fig. 4d). The facies mapped along the three regional cross-sections (Fig. 4a–c) show the dominant types related to extensive fault scarp-controlled drift sedimentation. In transition to the sheeted abyssal drift facies in the abyssal deepest part of the oceanic bounding basins, plastered drift facies are observed on slopes on both sides of the Nazca Ridge (Fig. 4b, c).
The Nazca Drift System presently sits in water depths of 2090–5330 m (Fig. 5a). Erosional surfaces at the seafloor marked by toplaps and erosional truncations are observed on 2D seismic profiles at water depths of c. 2200–4095 m. Figure 5b shows how the toplaps and erosional truncations are preferentially found in this water depth range, especially 2500–3000 m, implying frequent submarine erosion driven by bottom currents. This range of water depths leaves most of the upper surface of the Nazca Drift System exposed to the present-day PCW and CDW (Fig. 5c). The asymmetric thickness of the Nazca Drift System, i.e. thinner in the Chile Basin compared to the Peru Basin, could be explained by northward movement of the CDW (Lonsdale, Reference Lonsdale1976).

Fig. 5. Hypsometry of Nazca Drift System present-day drift with palaeoceanography framework and present-day water masses. (a) Scatter plot of Nazca Drift System thickness as a function of water depth; (b) Nazca Drift System erosional truncation relative frequency by water depth range; and (c) Nazca Drift System water depth relative frequency. Present-day, palaeo-carbonate compensation depth (CCD) and lysocline in the South Pacific Ocean (Rea & Leinen, Reference Rea and Leinen1985). Pacific Central Water (PCW) and Circumpolar Deep Water (CDW) (Tsuchiya & Talley, Reference Tsuchiya and Talley1998). Depths of DSDP and ODP sites are present-day water depth at each site (Shipboard Scientific Party, Reference Yeats, Hart, Ade-Hall, Bass, Benson, Hart, Quilty, Sachs, Salisbury and Vallier1976, Reference Mix, Tiedemann, Blum, Abrantes, Benway, Cacho-Lascorz, Chen, Delaney, Flores, Giosan, Holbourn, Irino, Iwai, Joseph, Kleiven, Lamy, Lund, Martinez, McManus, Ninnemann, Pisias, Robinson, Stoner, Sturm, Wara and Wei2003 a).
The Nazca Drift System covers an area of 204 500 km2. It represents the largest yet identified abyssal drift system in the Pacific Ocean. Globally it is only surpassed by the Zapiola Drift in the western South Atlantic and the Mozambique Channel contourite in the Indian Ocean (Kolla et al. Reference Kolla, Eittreim, Sullivan, Kostecki and Burckle1980; Flood & Shor, Reference Flood and Shor1988; Rebesco et al. Reference Rebesco, Hernández-Molina, Van Rooij and Wåhlin2014). The volume of this giant sedimentary body is c. 51 445 ± 5715 km3 (Fig. 4d). If the Nazca Drift System is no older than Oligocene, the average long-term accumulation rate is 0.7 ± 0.08 km3 ka−1. This is more than the c. 0.14 km3 ka−1 estimated for the Faro Drift since Miocene time (Stow et al. Reference Stow, Faugères, Gonthier, Cremer, Llave, Hernández-Molina, Somoza, Díaz-Del-Río, Stow, Pudsey, Howe, Faugères and Viana2002), but comparable with values of 0.74 to 1.31 km3 ka−1 in drifts offshore Newfoundland since Eocene time (Boyle et al. Reference Boyle, Romans, Tucholke, Norris, Swift and Sexton2017), or 0.88 km3 ka−1 in the Snorri Drift and 1.07 km3 ka−1 in the Hatton Drift (Wold, Reference Wold1994) of the NE Atlantic. It is, however, somewhat less than the 13.6 km3 ka−1 and 7.94 km3 ka−1 estimated for the Eirik and Gardar drifts of the NE Atlantic.
4.b. Chronological framework
Unconformities are observed at the seafloor and within the subsurface of the Nazca Drift System (Figs 5b, 6). The seafloor is affected by erosion, and the underlying Plio-Pleistocene strata are also marked by erosional truncation at various water depths (Figs 5b, 6). The seafloor water depth at which the transition from the southward migrating PCW and northward migrating CDW occurs is correlative of these erosional truncations (Fig. 4b). These erosive surfaces in the NE part of the Nazca Drift System have scoured geometries, with orientations suggesting they were produced by SE to NW flow (Figs 2, 6). These subsurface unconformities are localized in areas where the sedimentary section is draping fault scarps that offset the basement and have significant heave (>125 ms two-way time (TWT)). Mass wasting is not thought to be significant because it has a very distinctive seismic character, with thick, homogeneous units quite the opposite of the laminated facies seen here. Mass wasting in ocean island settings is moreover generally restricted to the time immediately after eruption and not the long time intervals seen here (e.g. Rees et al. Reference Rees, Detrick and Coakley1993; Wolfe et al. Reference Wolfe, McNutt and Detrick1994). The ages measured at ODP Site 1237 allows calibration of the duration of the oldest unconformities observed in the SE part of the drift where they are projected on seismic lines (Fig. 6a, b). The older age is estimated at the depth of the mid to upper Miocene, and the youngest sediment above this truncation is associated with the intra-upper Miocene. The top of the unconformity is bracketed at a depth of 149–170 m below seafloor, based on P wave velocity ranging from 1600 to 1800 m s−1. The youngest calibrated age for the unconformity from the shipboard age model of ODP Site 1237 is from c. 7.7 to 9.4 Ma (Shipboard Scientific Party, Reference Mix, Tiedemann, Blum, Abrantes, Benway, Cacho-Lascorz, Chen, Delaney, Flores, Giosan, Holbourn, Irino, Iwai, Joseph, Kleiven, Lamy, Lund, Martinez, McManus, Ninnemann, Pisias, Robinson, Stoner, Sturm, Wara and Wei2003 a).

Fig. 6. Eastern Nazca Drift System seismic framework. (a) WSW–ENE seismic profile across ODP Site 1237 with stratigraphy (Shipboard Scientific Party, Reference Mix, Tiedemann, Blum, Abrantes, Benway, Cacho-Lascorz, Chen, Delaney, Flores, Giosan, Holbourn, Irino, Iwai, Joseph, Kleiven, Lamy, Lund, Martinez, McManus, Ninnemann, Pisias, Robinson, Stoner, Sturm, Wara and Wei2003 a); (b) NW–SSE seismic profile from the Nazca Ridge to the Chile Basin; and (c) SW–NE seismic profile along the long axis of the Nazca Ridge with volcanic mounds and varying thickness of the Nazca Drift System. Note the volcanic sill intruding the Nazca Drift System. Location of the profiles is in the bathymetry inset map, where the blue line shows the extent of the seismic surface used to calibrate the age of the buried unconformities related to the erosional truncations. Water masses and current directions are layered above the acoustic seafloor. Pacific Central Water (PCW) and Circumpolar Deep Water (CDW) (Tsuchiya & Talley, Reference Tsuchiya and Talley1998).
The unconformities do not seem to be associated with mass wasting because there is no scarp up-dip or chaotic/transparent seismic facies diagnostic of mass transport deposits identified down slope of the unconformity regions. The high carbonate content of sediment described at ODP Site 1237 excludes strong dissolution as a cause of the unconformities driven by sedimentation below the CCD (Berger, Reference Berger1978; Berger et al. Reference Berger, Bonneau and Parker1982), thus making the erosional truncations likely to have been caused by remobilization of the exposed parts of the Nazca Drift System caused by intense bottom current scouring, potentially active over long periods of time (Heezen & Hollister, Reference Heezen and Hollister1964; Southard et al. Reference Southard, Young and Hollister1971; Bornhold & Summerhayes, Reference Bornhold and Summerhayes1977; Marani et al. Reference Marani, Argnani, Roveri and Trincardi1993). No bottom current velocity has been measured at the Nazca Ridge, but instead further north at the Carnegie Ridge (Lonsdale & Malfait, Reference Lonsdale and Malfait1974) and south of it in the Chile Basin (Shaffer et al. Reference Shaffer, Salinas, Pizarro, Vega and Hormazabal1995, Reference Shaffer, Hormazabal, Pizarro and Ramos2004), where bottom water is flowing at mean speeds of from 3 to 7.8 cm s−1. Lonsdale (Reference Lonsdale1976) suggested the presence of rather slow currents east and west of the Nazca Ridge, in the sill and trench where water moving from the Chile to the Peru Basin is flowing at depths deeper than the adiabatic bottom layer. Furthermore, the measured tidal currents (15–20 cm s−1) at the Carnegie Ridge are superimposed with slow speed drift (3 cm s−1). This abyssal tidal current is effective at driving erosion of fine particles (Lonsdale & Malfait, Reference Lonsdale and Malfait1974). By analogy with the Carnegie Ridge, the study area would be prone to being influenced by the same processes, tidal forcing and strong bottom currents, causing erosion at the seafloor surface. Current-driven erosion of the seafloor at depths of ∼2 km is also known immediately north of the Nazca Ridge in the Lima Basin (Clift et al. Reference Clift, Pecher, Kukowski and Hampel2003). Experimental erosion of calcareous ooze by currents showed that the critical speed for erosion to start is c. 7–10 cm s−1 (Southard et al. Reference Southard, Young and Hollister1971), corresponding to the observed values of near bottom currents in the SE Pacific.
4.c. Initiation of the Nazca Drift System in the regional oceanic gateways framework
The Nazca Drift System extends from the southwest of the Nazca Ridge to the Peru–Chile Trench (Fig. 4). The eastward motion of the Nazca Plate since the emplacement of the drift is well constrained (e.g. Hampel, Reference Hampel2002). Before the Nazca Ridge reached the trench, normal, low-relief oceanic crust had been subducting. The trench-slope of South America and the oceanic barrier formed by the Nazca Ridge against bottom waters moving from the Southern Ocean to the equatorial domain results in a funnel for sediment transport. The oldest sediments cored at ODP Site 1237 (c. 31 Ma; King & Wade, Reference King and Wade2017) indicate carbonate sedimentation until 15 Ma (Fig. 7a). The basement was not reached by drilling at ODP Site 1237, but the sediment column between the total drilled depth and the acoustic basement is thin (0.016 s TWT c. 15 m; Fig. 6), implying a maximum age of c. 36.8 Ma at the base (sedimentation rate of 2.55 m Ma−1; King & Wade, Reference King and Wade2017), which is younger than the initiation of the opening of the Drake Passage (41 Ma; Scher & Martin, Reference Scher and Martin2006). The initiation of the Nazca Drift System could be related to the opening of the Drake Passage and the northward branch bifurcation of the ACC along the Pacific margin of South America (Lawver & Gahagan, Reference Lawver, Gahagan, Crowley and Burke1998; Hodel et al. Reference Hodel, Grespan, de Rafélis, Dera, Lezin, Nardin, Rouby, Aretz, Steinnman, Buatier, Lacan, Jeandel and Chavagnac2021).
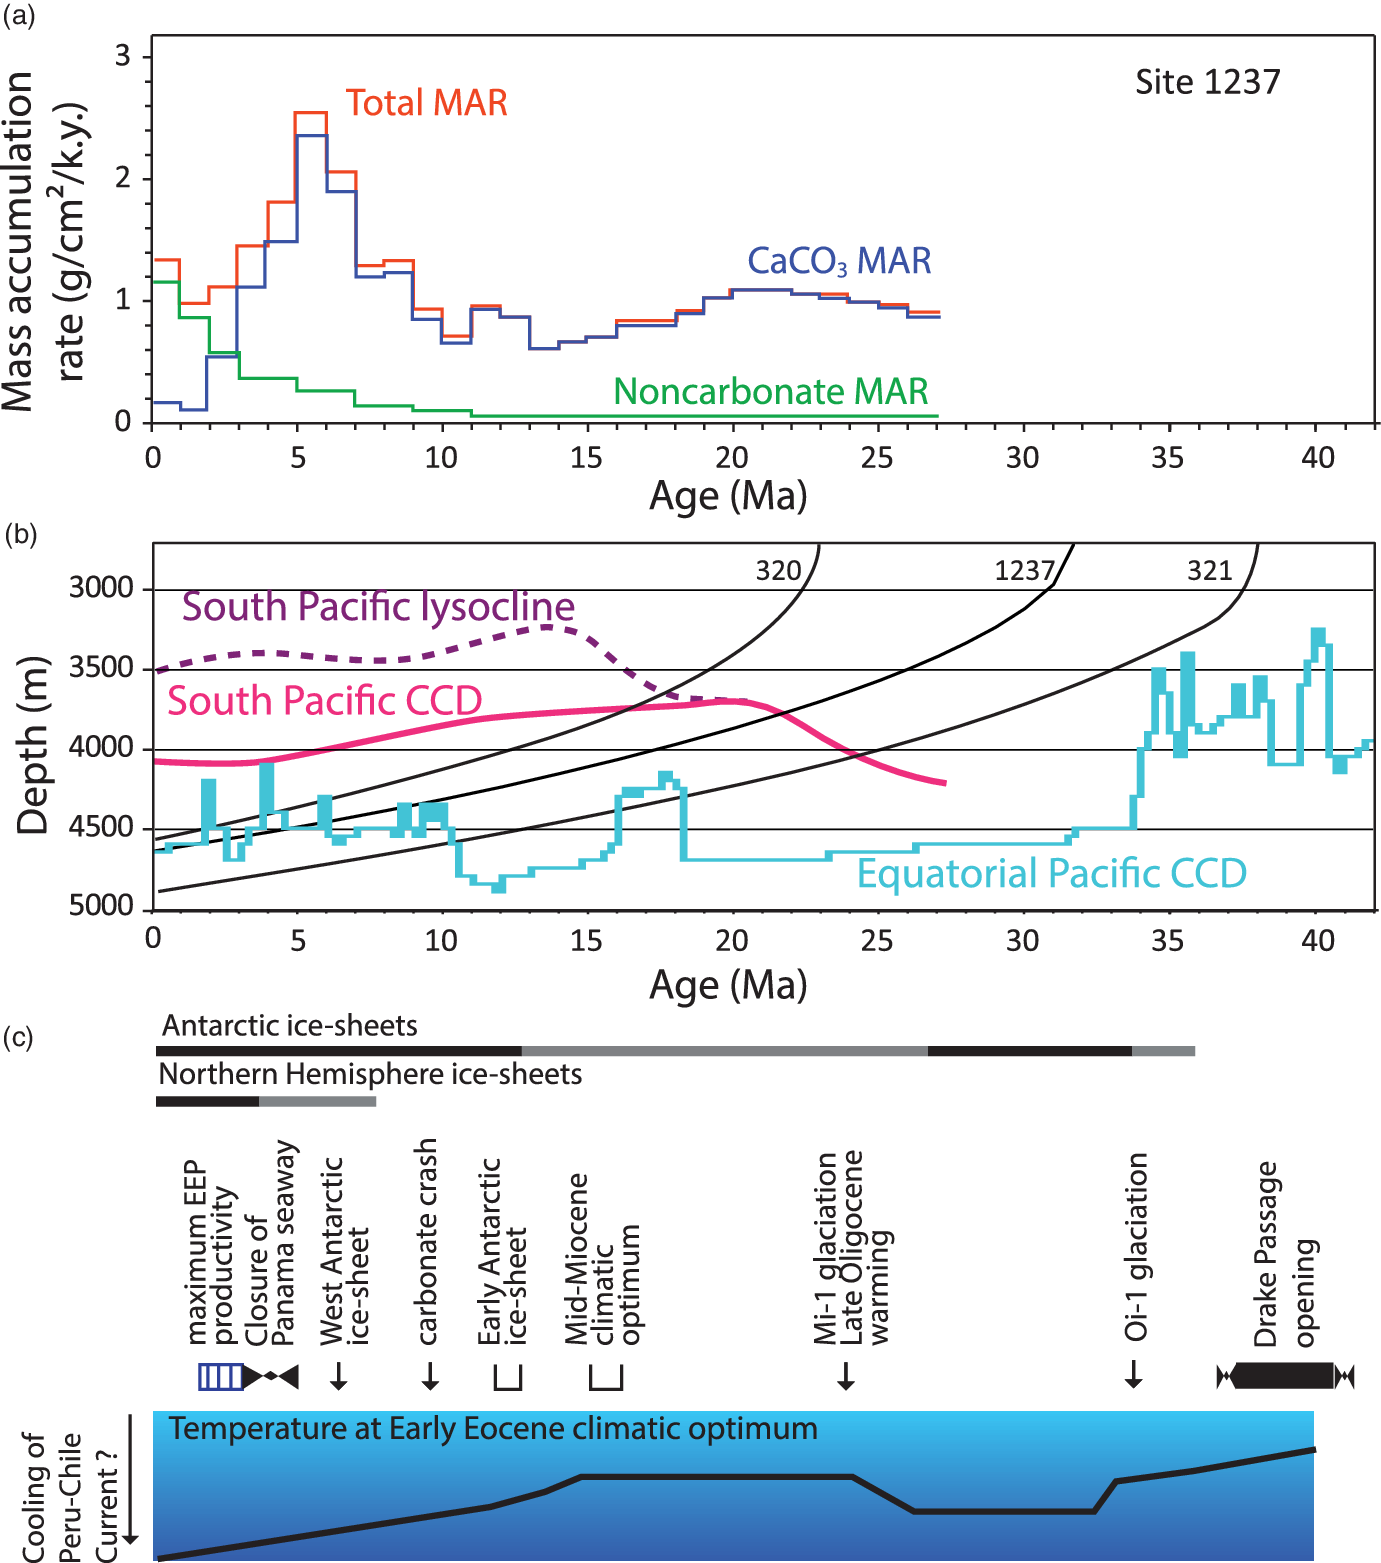
Fig. 7. (a) Sedimentation rate at ODP Site 1237 (Shipboard Scientific Party, Reference Mix, Tiedemann, Blum, Abrantes, Benway, Cacho-Lascorz, Chen, Delaney, Flores, Giosan, Holbourn, Irino, Iwai, Joseph, Kleiven, Lamy, Lund, Martinez, McManus, Ninnemann, Pisias, Robinson, Stoner, Sturm, Wara and Wei2003 a) and (b) subsidence at three DSDP and ODP sites with carbonate compensation depth (CCD) and lysocline depths over the last 40 million years in two domains of the Pacific Ocean (Rea & Leinen, Reference Rea and Leinen1985; Pälike et al. Reference Pälike, Lyle, Nishi, Raffi, Ridgwell, Gamage, Klaus, Acton, Anderson, Backman, Baldauf, Beltran, Bohaty, Bown, Busch, Channell, Chun, Delaney, Dewangan, Dunkley Jones, Edgar, Evans, Fitch, Foster, Gussone, Hasegawa, Hathorne, Hayashi, Herrle, Holbourn, Hovan, Hyeong, Iijima, Ito, Kamikuri, Kimoto, Kuroda, Leon-Rodriguez, Malinverno, Moore, Murphy, Murphy, Nakamura, Ogane, Ohneiser, Richter, Sluijs, Takata, Tian, Tsujimoto, Wade, Westerhold, Wilkens, Williams, Wilson, Yamamoto, Yamamoto, Yamazaki and Zeebe2012). (c) Palaeoceanography, geodynamic and climatic context sourced from Zachos et al. (Reference Zachos, Pagani, Sloan, Thomas and Billups2001), Lamb & Davies (Reference Lamb and Davis2003) and Scher & Martin (Reference Scher and Martin2006).
Supply of the main fraction of the sediments composing the Nazca Drift System is related to the evolution of water masses and currents. As a result, the sedimentation rate must partly reflect the signal of the current intensity, as well as sediment supply rate. The clastic input is a reflection of the proximity of the ridge to terrestrial sources, mainly dust (aeolian siliciclastic), while migrating towards South America (Tiedemann & Mix, Reference Tiedemann, Mix, Tiedemann, Mix, Richter and Ruddiman2007). The averaged sedimentation rate over 1 million-year intervals at ODP Site 1237 (Fig. 7a) in the eastern portion of the Nazca Drift System increased during the period when the discontinuity is recorded at 9.4–7.0 Ma on the seismic profile. Sediment was eroded where the discontinuity is seen and transported and deposited in the region of ODP Site 1237. The thickness of the drift is higher to the north of where the intra-Miocene unconformity is developed on the side of the ridge (Fig. 6) because the bottom current related to the CDW sweeps sediments towards ODP Site 1237. About 70 % of the Nazca Drift System is above the CCD at the present day (Figs 4, 5c). Reconstructions based on a typical rate of oceanic subsidence (Stein & Stein, Reference Stein and Stein1992) indicate that ODP Site 1237 on the Nazca Ridge would have been above the regional CCD until 21.7 Ma (Fig. 7; Rea & Leinen, Reference Rea and Leinen1985; Pälike et al. Reference Pälike, Lyle, Nishi, Raffi, Ridgwell, Gamage, Klaus, Acton, Anderson, Backman, Baldauf, Beltran, Bohaty, Bown, Busch, Channell, Chun, Delaney, Dewangan, Dunkley Jones, Edgar, Evans, Fitch, Foster, Gussone, Hasegawa, Hathorne, Hayashi, Herrle, Holbourn, Hovan, Hyeong, Iijima, Ito, Kamikuri, Kimoto, Kuroda, Leon-Rodriguez, Malinverno, Moore, Murphy, Murphy, Nakamura, Ogane, Ohneiser, Richter, Sluijs, Takata, Tian, Tsujimoto, Wade, Westerhold, Wilkens, Williams, Wilson, Yamamoto, Yamamoto, Yamazaki and Zeebe2012). DSDP Site 321 in the abyssal Peru Basin north of the study area descended below the CCD after 24 Ma (Fig. 7b; Rea & Leinen, Reference Rea and Leinen1985). ODP Site 1237 is shallower and crossed the CCD during early Miocene time. The CaCO3 mass accumulation rates had been stable for over c. 2 million years before decreasing after 20 Ma and increased again towards the end of middle Miocene time at c. 12 Ma (Fig. 7a, b). This framework excludes a major role for carbonate dissolution in the generation of unconformities within or above the Nazca Drift System. The CCD could have been locally depressed by high deposition rates, as observed at the equator (Pälike et al. Reference Pälike, Lyle, Nishi, Raffi, Ridgwell, Gamage, Klaus, Acton, Anderson, Backman, Baldauf, Beltran, Bohaty, Bown, Busch, Channell, Chun, Delaney, Dewangan, Dunkley Jones, Edgar, Evans, Fitch, Foster, Gussone, Hasegawa, Hathorne, Hayashi, Herrle, Holbourn, Hovan, Hyeong, Iijima, Ito, Kamikuri, Kimoto, Kuroda, Leon-Rodriguez, Malinverno, Moore, Murphy, Murphy, Nakamura, Ogane, Ohneiser, Richter, Sluijs, Takata, Tian, Tsujimoto, Wade, Westerhold, Wilkens, Williams, Wilson, Yamamoto, Yamamoto, Yamazaki and Zeebe2012).
4.d. Intensity of bottom water flow and building the Nazca Drift System
The thickness variation and identification of internal and superficial unconformities within the Nazca Drift System shows that bottom water currents have played a key role in the evolution of the sedimentary record in this part of the Pacific Ocean.
Framed within the last 30 Ma, the study area has been under the influence of Southern Ocean evolution, as well as solid earth and hydrosphere interaction (e.g. Scher et al. Reference Scher, Whittaker, Williams, Latimer, Kordesch and Delaney2015; Wright et al. Reference Wright, Seton, Williams and Müller2016) (Fig. 7c). Similar to the Eastern New Zealand Oceanic Sedimentary System, which is made of abyssal drift deposits (Carter et al. Reference Carter, Carter, McCave and Gamble1996; Carter & McCave, Reference Carter and McCave1994, Reference Carter, McCave, Stow, Pudsey, Howe, Faugères and Viana2002; Bailey et al. Reference Bailey, McArthur and McCaffrey2021), the Nazca Drift System has been emplaced in an abyssal domain since Oligocene time under the influence of the ACC and the associated CDW. The oldest Oligocene sequences drilled at ODP Site 1237 record alternating fine-scale variations and changes in sedimentation rates that started with the lowest rate operating over periods of c. 3.6 million years (before 29.8 and 28.2–24 Ma) and higher rates during shorter periods of 1.6 million years (29.8–28.2 Ma and 24–21.5 Ma) (King & Wade, Reference King and Wade2017). These changing rates could reflect the intensity of sediment supply to the ocean and/or variation in the intensity of bottom currents.
A widespread erosional event associated with the establishment of the ACC and the Deep Western Boundary Current has been identified in the record of the Bounty Trough – SW Pacific Ocean (Horn & Uenzelmann-Neben, Reference Horn and Uenzelmann-Neben2015). A major c. 5 million-year hiatus separates the middle Miocene, c. 10.4 Ma, from the lower Pliocene at ODP Site 1122 (Shipboard Scientific Party, Reference Carter, McCave, Richter, Carter, Aita, Buret, Di Stefano, Fenner, Fothergill, Gradstein, Hall, Handwerger, Harris, Hayward, Hu, Joseph, Khim, Lee, Millwood, Rinna, Smith, Suzuki, Weedon, Wei, Wilson and Winkler1999; Carter et al. Reference Carter, McCave, Richter, Carter, Aita, Buret, Di Stefano, Fenner, Fothergill, Gradstein, Hall, Handwerger, Harris, Hayward, Hu, Joseph, Khim, Lee, Millwood, Rinna, Smith, Suzuki, Weedon, Wei, Wilson and Winkler1999). This erosional event correlates with the intensification caused by a more vigorous ACC, synchronous with the build-up of the West Antarctic Ice Sheet (Carter et al. Reference Carter, Carter and McCave2004). In the Drake Passage, the identified South Falkland Slope Drift also contains unconformities of the same age, c. 9 Ma (Koenitz et al. Reference Koenitz, White, McCave and Hobbs2008). The thickness of the drift is a function of the evolution of sediment supply and current intensity. High sedimentation rates in early Miocene time were followed by a decreasing rate during mid–late Miocene time, followed by a late Miocene peak and further decline from the late Miocene to the Pleistocene period. The identified unconformity within the Nazca Drift System is dated within this middle Miocene period of intensified bottom currents, c. 7.7–9.4 Ma. We therefore attribute this unconformity to the same process. Geochemical analyses at ODP Site 1237 show a change in nutrient burial preservation from oxygenated to more reduced conditions at c. 162 m composite depth (8.8 Ma; Chun & Delaney, Reference Chun, Delaney, Tiedemann, Mix, Richter and Ruddiman2006). This change corresponds to the depth at which the late Miocene unconformity was identified on seismic reflection profiles and could be attributed to bottom water chemistry and variations in current activity in this part of the SE Pacific Ocean. The ACC strength has been documented further south, with initiation dated to have occurred during late Oligocene to late Miocene times (Lyle et al. Reference Lyle, Gibbs, Moore and Rea2007).
4.e. Tectonic and contourite drift in the subduction channel
A significant part of the Nazca Ridge has been subducted since at least the end of middle Miocene time, c. 11.2 Ma (Hampel, Reference Hampel2002). Because ridge construction and the sedimentary drift accumulation are older than the initiation of Nazca Ridge subduction, a potentially large volume of deep-sea sediments and polymetallic accumulations could have contributed to orogenesis and mineralization in the Andes.
Water is widely recognized to be a key ingredient in the generation of magmas in subduction zones, making these zones efficient areas of carbon burial (Grove et al. Reference Grove, Till and Krawczynski2012; Clift, Reference Clift2017; Plank & Manning, Reference Plank and Manning2019). Geodynamic reconstructions indicate that metallogenesis has followed the southward movement of the Nazca Ridge along the coast of South America (Rosenbaum et al. Reference Rosenbaum, Giles, Saxon, Betts, Weinberg and Duboz2005). This migration is associated with an increase in emplacement of Cu, Au and Zn deposits from 8 to 6 Ma (Rosenbaum et al. Reference Rosenbaum, Giles, Saxon, Betts, Weinberg and Duboz2005). The area of the Nazca Ridge that has subducted since 11.2 Ma is estimated to represent an area of c. 420 × 103 km2. This subducted part of the plate was covered by sediments, similar to the remaining western part of the Nazca Ridge. We estimate, based on the present-day thickness of Oligocene–middle Miocene strata (Fig. 6a; 0.225 s TWT) that the maximum subducted sediment thickness was 180–200 m. This results in a figure of 80 ± 5 × 10³ km3 of sediments that may have contributed to Andean mineral evolution. The porosity of this sedimentary sequence can be high at 60–90 % (Velde, Reference Velde1996; D’Hondt et al. Reference D’Hondt, Jørgensen, Miller, Aiello, Bekins, Blake, Cragg, Cypionka, Dickens, Ferdelman, Ford, Gettemy, Guèrin, Hinrichs, Holm, House, Inagaki, Meister, Mitterer, Naehr, Niitsuma, Parkes, Schippers, Skilbeck, Smith, Spivack, Teske and Wiegel2003; Yu et al. Reference Yu, Stow, Smillie, Esentia, Brackenridge, Xie, Bankole, Ducassou and Llave2020), leading to a higher than normal amount of water entering the subduction channel (Bray & Karig, Reference Bray and Karig1985), especially considering that subduction of the Nazca Ridge increased subduction erosion along the Andean margin, adding even more sediment and water from any pre-existing accretionary prism (Clift et al. Reference Clift, Pecher, Kukowski and Hampel2003; Kukowski & Oncken, Reference Kukowski, Oncken, Oncken, Chong, Franz, Giese, Götze, Ramos, Strecker and Wigger2006). This higher volume of water at the Nazca Ridge could have increased the amount of melting.
5. Conclusions
Based on seafloor bathymetry, seismic reflection data and scientific drilling sites, we conclude that the Nazca Drift System has been identified in the SE Pacific Ocean. The Nazca Drift System spans from the Chile Basin, across the Nazca Ridge into the Peru Basin. This major palaeoceanographic sedimentary feature in the SE Pacific Ocean has accumulated on top of the Nazca Ridge since Oligocene time. The Nazca Drift System represents the largest identified abyssal drift system yet known in the Pacific Ocean, and formed because of the primary present-day bottom currents winnowing the seafloor sediments of the Nazca Drift System. These currents are related to the PCW and CDW. Initiation of the Nazca Drift System may have been related to the opening of the Drake Passage and the northward branch bifurcation of the ACC along the Pacific margin of South America.
The currents that have sculpted this giant sedimentary body experienced fluctuating intensities, as recorded by internal unconformities identified by acoustic discontinuities. The calibrated age of the oldest unconformity in the SE part of the Nazca Drift System is late Miocene (Tortonian) and can be correlated to the change of bottom water conditions recorded at ODP Site 1237 from oxygenated to more reduced conditions. Evidence of younger discontinuities shows that the bottom currents have been varying in response to southern hemisphere climatic change and the eastward motion of the Nazca Plate. A significant part of the Nazca Drift System that has already subducted has contributed material to the subduction channel. This is further spatially related onshore to subduction magmatism and mineralization, as well as the Andean orogenic cycle since late Miocene time (c. 11.2 Ma).
Further analyses such as grain size and geochemistry should be able to constrain the palaeo-bottom current intensity, variations and the detailed emplacement of this sedimentary drift. Future studies comparing these findings to drift systems developed along other deep-water active margins will lead to recognition of an increasing number of new drift system provinces.
Supplementary material
To view supplementary material for this article, please visit https://doi.org/10.1017/S0016756821000960
Acknowledgements
This research used data provided by the International Ocean Discovery Program (IODP). GENEO3RR subsurface data were accessed by the Site Survey Data Bank (SSDB, https://ssdb.iodp.org/index.php). Cecily Pälike (MARUM) and Peggy Delaney (UCSC) are thanked for discussion regarding the geochemistry of sediments at Site 1237. Andrea Hampel (Leibniz Universität Hannover) is thanked for access to the velocity data from the SO146-GEOPECO cruise. Paul Henkart is thanked for help with the single channel data. NOAA-NCEI is thanked for the Multibeam Bathymetry database (https://www.ngdc.noaa.gov/maps/autogrid/). IHS-Kingdom is thanked for their Software University Grants that have allowed this work to take place. Thanks to Neil Mitchell (University of Manchester) and an anonymous reviewer for commenting on an earlier version of our manuscript. Reviews from the editor Stephen Hubbard, and reviews from W. Bailey, M. Cason, F. J. Hernández-Molina and an anonymous reviewer greatly helped to clarify our work.
Conflict of Interest
The authors declare that they have no conflict of interest.


