


1. Introduction
Faults and opening-mode fractures can influence oil/gas migration (Bredehoeft & Norton, Reference Bredehoeft and Norton1990, pp. 27–41; Cumella & Scheevel, Reference Cumella, Scheevel, Cumella, Shanley and Camp2008, pp. 137–55), groundwater transport (Gudmundsson, Reference Gudmundsson2000), magma migration (Gudmundsson, Reference Gudmundsson2011, pp. 525–52) and heat transfer (Pruess, Reference Pruess1983; Ghassemi & Kumar, Reference Ghassemi and Kumar2007; Shaik et al. Reference Shaik, Rahman, Tran and Tran2011), and engineering operations such as outcomes of hydraulic fracture treatments (Gale et al. Reference Gale, Elliott and Laubach2018) and effective waste disposal (SD Ware et al. unpub. data, 1996; Figueiredo et al. Reference Figueiredo, Tsang, Niemi and Lindgren2016).
For tight sandstone reservoirs (matrix permeability less than 0.1 × 10⁻³ μm2; e.g. Dutton et al. Reference Dutton, Clift, Hamilton, Hamlin, Hentz, Howard, Akhter and Laubach1993, p. 221), accurate characterization and prediction of fractures could be used to optimize well drilling and completion (Almansour et al. Reference Almansour, Laubach, Bickel and Schultz2019) and potentially minimize the environmental footprint of oil/gas production. However, a key question is, what geological factors govern producibility from these rocks? Natural fractures have long been recognized as widespread features in tight sandstones (e.g. Laubach, Reference Laubach2003; Solano et al. Reference Solano, Zambrano and Aguilera2011, and references therein). Studies show that fractures are present in tight sandstones in China (Zeng & Li, Reference Zeng and Li2009; Lyu et al. Reference Lyu, Zeng, Zhang, Miao, Lyu and Dong2017; Gong et al. Reference Gong, Su, Gao, Fu, Jabbari, Wang, Liu, Yue, Wang and Gao2019). Among the circumstances favouring fracture in these rocks are brittleness (Zeng & Li, Reference Zeng and Li2009) and processes promoting fracture, such as tectonism and hydrocarbon generation and migration (e.g. Fall et al. Reference Fall, Eichhubl, Bodnar, Laubach and Davis2015). It has also long been recognized that fractures, including those in tight sandstones, can form as a result of many different processes (loading paths) (e.g. Engelder, Reference Engelder1985; Pollard & Aydin, Reference Pollard and Aydin1988; Laubach et al. Reference Laubach, Lander, Criscenti, Anovitz, Urai, Pollyea, Hooker, Narr, Evans, Kerisit, Olson, Dewers, Fisher, Bodnar, Evans, Dove, Bonnell, Marder and Pyrak-Nolte2019). Some of these processes produce fracture arrays having a wide range of sizes (e.g. Hooker et al. Reference Hooker, Laubach and Marrett2014) although some result in arrays with narrow size ranges (Laubach et al. Reference Laubach, Fall, Copley, Marrett and Wilkins2016). Large-sized macrofractures can be observed by unaided eyes and small-sized microfractures are characterized fully using optical and electron microscopy techniques.
In this study, we aim to take the Lower Cretaceous Kuqa Depression tight sandstones as an example to depict natural fractures in macro- and microscopic views and further understand their distribution patterns in tight sandstones at depths more than 6500 m. The studied formation was classified as typical tight sandstones with matrix permeability varying between 0.01 mD and 0.1 mD (Zhang et al. Reference Zhang, Yang, Wang, Shou, Zeng and Liu2014), and natural fractures have dominated flow of natural gas within the formation (Zhang et al. Reference Zhang, Wang, Li, Niu and Qin2011; Yang et al. Reference Yang, Zhu, Wang, Qu, Zhang and Niu2013; Qu et al. Reference Qu, Zhang, Wang, Yang, Liu, Ba and Wang2016; Liu et al. Reference Liu, Zhang, Zhang, Wang, Mo, Wang and Zhou2017). Previously, considerable studies have concentrated on macrofracture observation in outcrops and cores and suggested that these fractures were formed during the strata bending, and outcrop surveys reveal that at least one pair of conjugate shear fractures with high dip-angles could be the main fracture pattern in the tight sandstones (Zhang et al. Reference Zhang, Zhang, Yang, Yao and Ma2012; JP Wang et al. Reference Wang, Zhang, Zhao, Wang, Wang, Zeng and Liu2014; Sun et al. Reference Sun, Hou, Yu, Wei, Mo, Zhou, Xie and Luo2015; Liu et al. Reference Liu, Zhang, Zhang and Wang2016; ZY Wang et al. Reference Wang, Liu, Zhang, Qu, Yang and Liu2016); microfractures were barely mentioned except they have been noticed recently with the help of microscopic techniques (Liu et al. Reference Liu, Zhang, Zhang, Wang, Mo, Wang and Zhou2017).
Here, using cores, borehole images, thin-sections and an analogous outcrop selected in the Suohan area of the Kuqa Depression, we show that thrust faults, two types of macrofractures and two types of microfractures have been identified in the deep-seated tight sandstones. They are interpreted as tectonic, diagenetic or natural hydraulic fractures on the basis of spatial distribution patterns, fracture morphology, orientations and mechanical properties. Their contributions to fluid flow are obviously different imprinted by in situ stresses or diagenetic processes which have modified flow capability of the fracture network. In combination with gas charge history in the tight sandstones, the main contributory fractures for the formation of the giant gas fields in the depression are also determined.
2. Geological setting
The Kuqa Depression in the Tarim Basin is adjacent to the Tianshan Mountains (Fig. 1) and is characterized by numerous thrust faults and fault-related anticlines with approximately west–east trends (Fig. 2). The thrust activity is related to the India–Asia plate collision during the Cenozoic (Guo et al. Reference Guo, Shi, Lu, QB, Dai, Liu and Li1992, pp. 1–8; Lu et al. Reference Lu, Jia, Chen, Liu, Wang and Jia1999; Liu et al. Reference Liu, Lu, Li, Jia, Lei, Chen, Wang and Fan2000). Crustal shortening derived from the plate collision propagated northwards in the Miocene, reactivating the older continental suture of the Tarim–Yili plate (Liu et al. Reference Liu, Lu, Li, Jia, Lei, Chen, Wang and Fan2000). This thrust movement in the Kuqa Depression is ongoing from the onset of the intracontinental collision to the present (Liu et al. Reference Liu, Lu, Li, Jia, Lei, Chen, Wang and Fan2000; Wang et al. Reference Wang, Jia, Yang, Aurelia and John2002). Two deformation modes during the movement have been proposed: one in which deformation is intermittent with a long-term dormancy between episodes of shortening (Wang et al. Reference Wang, Jia, Yang, Aurelia and John2002); another involving one continuous contractional movement marked by a successive southward propagation (Liu et al. Reference Liu, Lu, Li, Jia, Lei, Chen, Wang and Fan2000; Zhang et al. Reference Zhang, Lin and Wang2003). Current tectonic activity in the area is great, marked for example by earthquakes Ms ≥ 5 that have occurred 62 times during the last ten years.
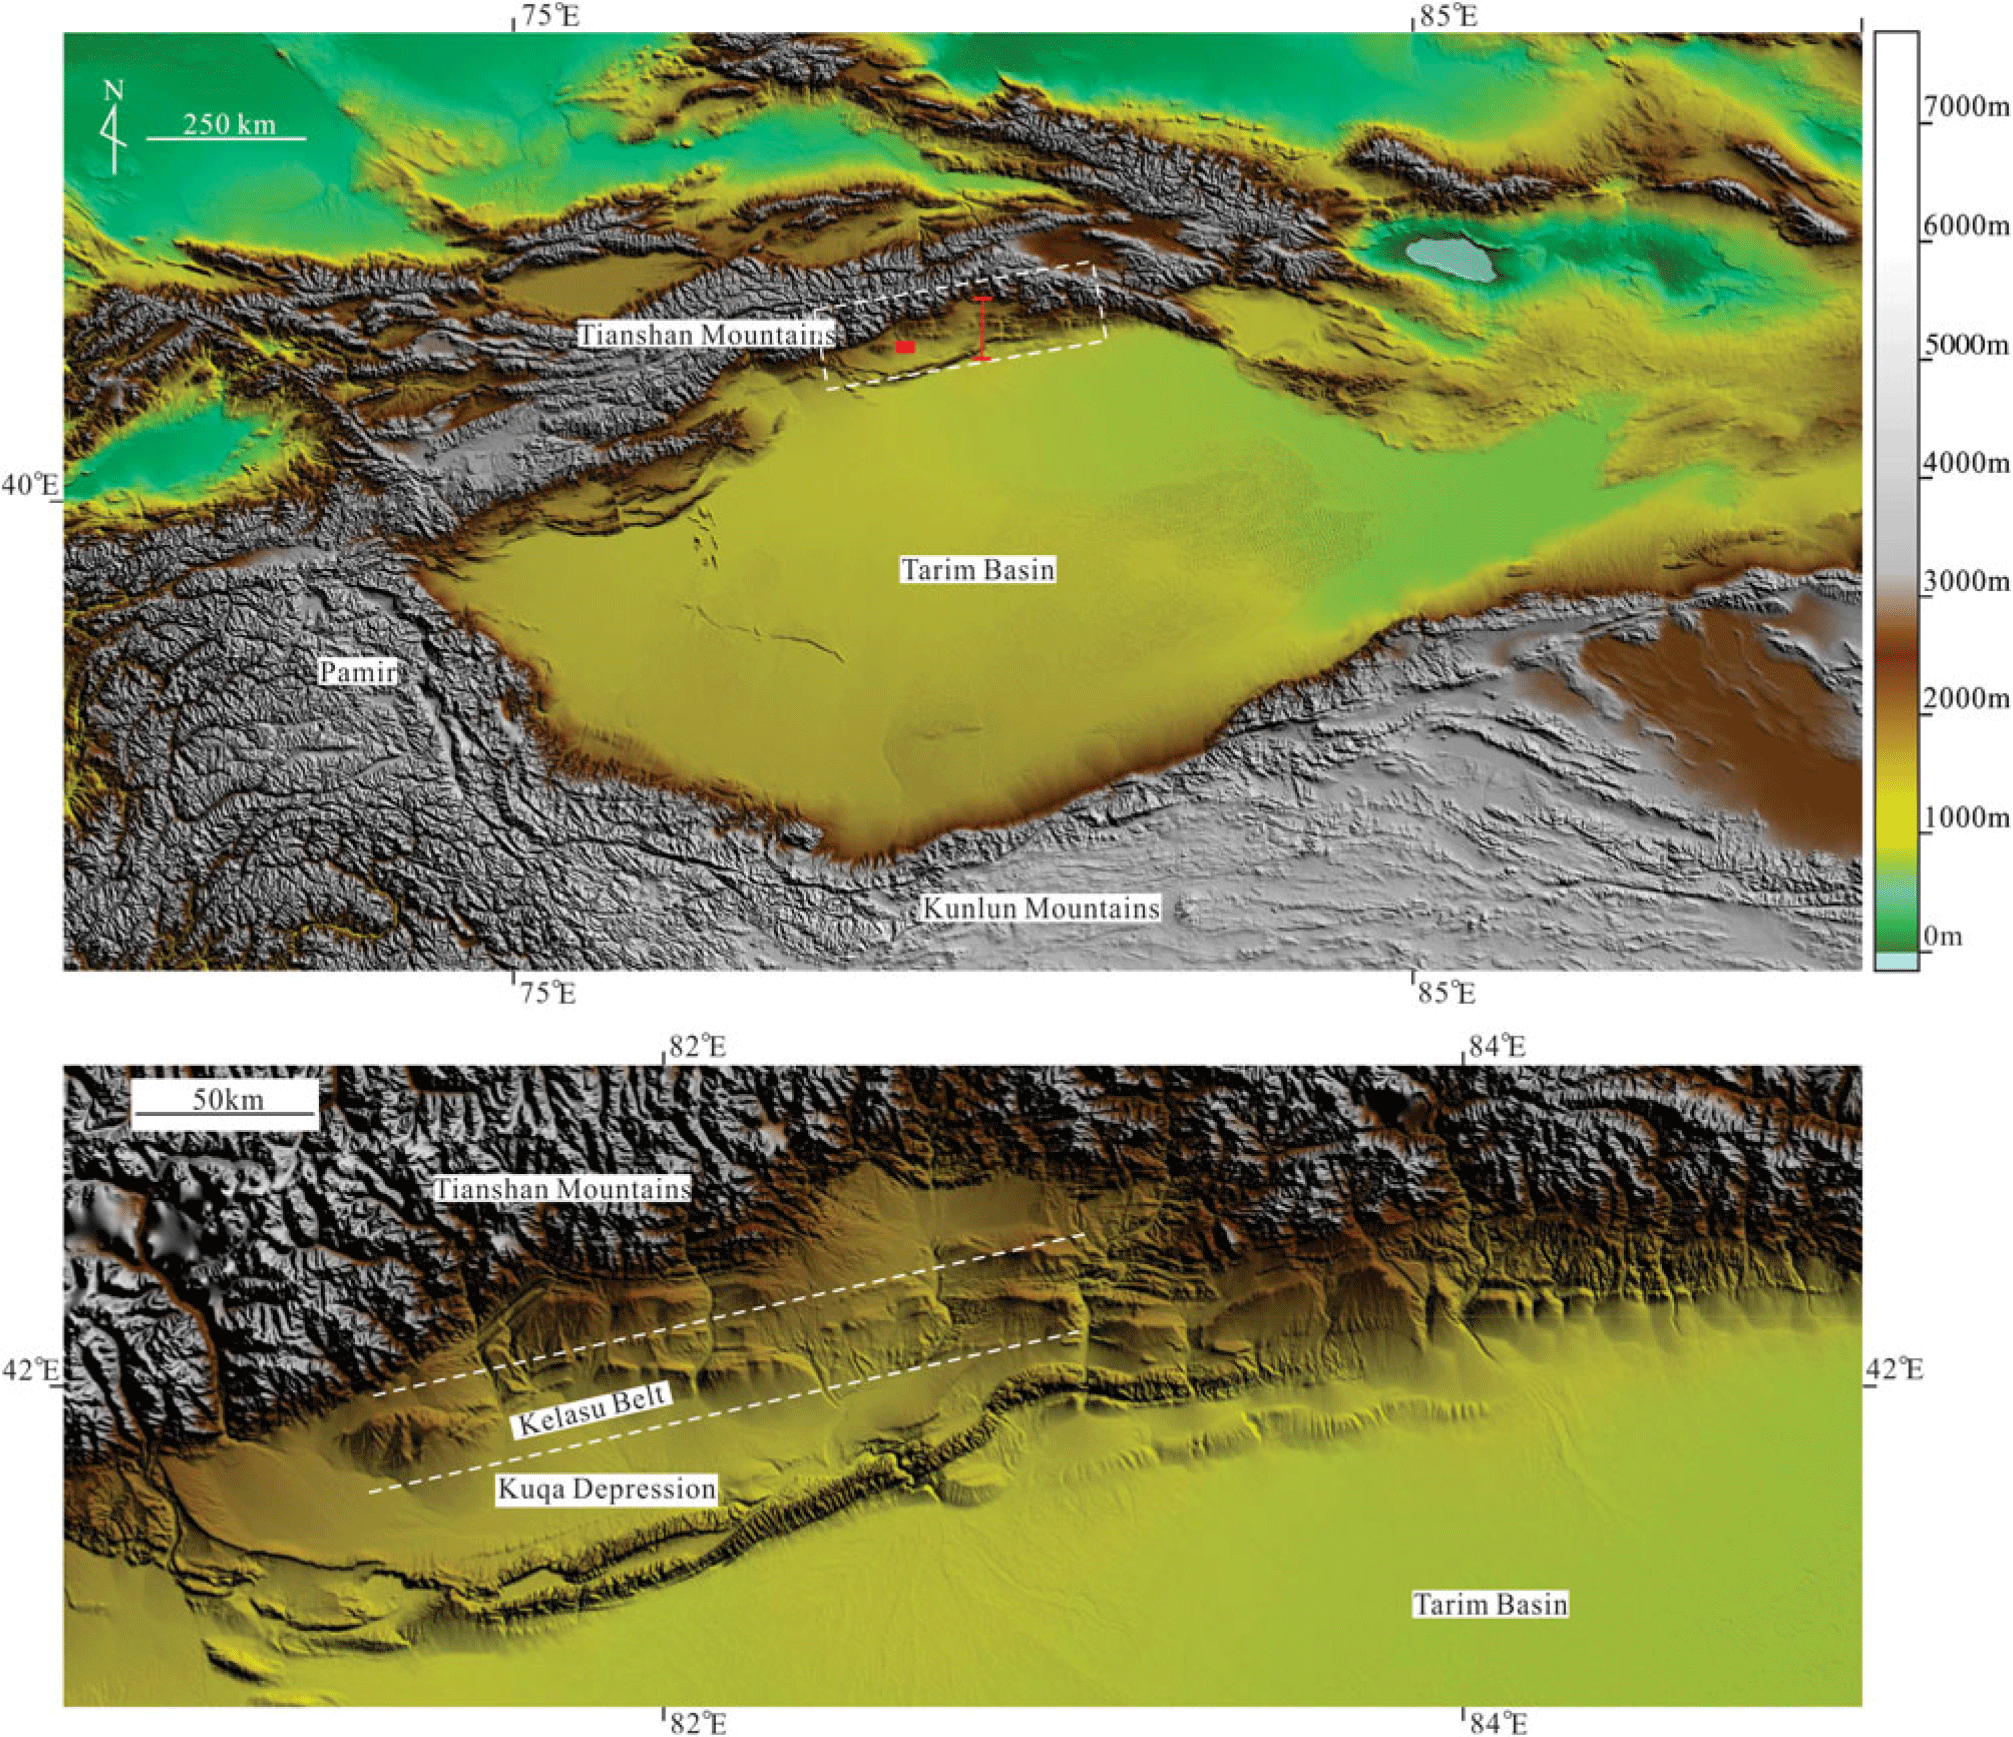
Fig. 1. Location of the Kuqa Depression in the Tarim Basin, NW China (the dotted box). The red box and line represent location of the studied outcrop and the seismic line, respectively.

Fig. 2. The structural style across the central Kuqa Depression based on seismic interpretation (Neng et al. Reference Neng, Xie, Sun, Lei and Xu2013). The seismic line is indicated in Figure 1. The letter “K” means the target Cretaceous sandstones; the characters “E1-2km” represent the overlying Palaeogene halite and gypsum associations.
Mesozoic and Cenozoic stratigraphy in the Kuqa Depression is listed in Figure 3. The target Lower Cretaceous sandstones are surrounded by the overlying Palaeogene halite and underlying Cretaceous and Jurassic coal beds. During deposition of the sandstones, an arid climate prevailed (Jiang et al. Reference Jiang, Wang and Wei2008). Controlled by three depositional provenances including Northern Tianshan, Southeast Kuluketage and Southwest Wensu uplift (Chen et al. Reference Chen, Huang, Zhang, Zhang and Yan2012), the target area successively developed fan deltas and braided-river deltas (Jia, Reference Jia2000; Zhu et al. Reference Zhu, Guo, Shao, Song, Fu and Li2000). Drilling indicates that most of the petroleum wells encounter the braided-river deltas, in which siltstone and fine sandstone interbedded with thin mudrock are dominant rock types (Jia, Reference Jia2000; Zhu et al. Reference Zhu, Guo, Shao, Song, Fu and Li2000; Gu et al. Reference Gu, Fang and Jia2001). The high-frequency lateral migration of the braided-river deltas resulted in extensive sandstone deposits with sand/total ratios generally more than 95 % (Zhu et al. Reference Zhu, Guo, Shao, Song, Fu and Li2000).

Fig. 3. Stratigraphic column of the Mesozoic and Cenozoic in the Kuqa area (modified from Zhao et al. Reference Zhao, Wang, Shan, Wang, Zhao and Wang2005).
Additionally, the sandstones have undergone complex diagenetic processes (Zhang et al. Reference Zhang, Zhang, Ma, Shen, Li and Zhang2008, Reference Zhang, Yang, Wang, Shou, Zeng and Liu2014). Early compaction and cementation mainly occurred at shallow depths (syngenetic to eogenetic stage) (Zhang et al. Reference Zhang, Yang, Wang, Shou, Zeng and Liu2014). Porosity loss and formation tightness is a consequence of subsequent compaction derived from the burial of the formation to 6500 m depth and cementation mainly with calcite (Zhang et al. Reference Zhang, Zhang, Ma, Shen, Li and Zhang2008, Reference Zhang, Yang, Wang, Shou, Zeng and Liu2014). Moreover, compressive stresses generated from the Tarim–Yili plate collision may have increased the formation tightness to some extent (Shou et al. Reference Shou, Zhu and Zhang2003; Li et al. Reference Li, Zhang, Shou, Han, Shen and Zhang2009; Han et al. Reference Han, Zhao, Li and Li2015). Petrophysical experiments at overburden conditions based on full-diameter cores and core plugs show that there is a good correlation between matrix porosity and permeability (Fig. 4). The target formation shows a low matrix porosity and permeability. The matrix porosity present varies between 0.76 % and 10.43 %, averaging 3.86 %, and the permeability ranges between 0.00007 mD and 0.49 mD, with 0.013 mD on average. Mercury injection tests indicate that the pore throats vary between 0.006 μm and 6.5 μm and the average value is 0.044 μm (Fig. 5).

Fig. 4. Relationship between the matrix permeability and porosity in the tight sandstones.

Fig. 5. Histogram showing the pore throat characteristics in the target formation.
3. Observation methods
3.a. Data collection
The seismic interpretation was conducted by researchers from the Tarim Oilfield Company, PetroChina. An outcrop was selected for survey in the west part of the Kuqa Depression (Fig. 1). The outcrop has a well exposed area of more than 5 km2. The outcrop meets criteria set by Ukar et al. (Reference Ukar, Laubach and Hooker2019) as a suitable analogue for the subsurface fractures. The total lengths of the cores are 150.2 m (492.8 ft) obtained at depths between 6500.0 m and 8035.0 m from seven vertical wells. Altogether, 336 stained thin-sections, 117 cathodoluminescence (CL) samples, 46 scanning electron microscope (FESEM/SEM) samples and laser scanning confocal microscope (LSCM) samples were collected from these cores and analysed. In addition, 47 wells have measured borehole image log data with a total length of 13452.3 m, and the data were processed by standard procedure (Schlumberger, 2015).
3.b. Cores and image logs
The cores and the processed borehole images were used to depict macrofracture attributes including fracture morphology, orientations and distribution patterns. Fracture morphology further includes fracture surface textures, filling characteristics, terminations and cross-cutting relationships. Orientations refer to fracture dip angle and dip direction to horizontal planes or to the stratigraphy. Distribution pattern means fracture grouping and the spatial distribution of different fracture sets. The surface textures and filling characteristics were described using the cores. Other properties except fracture azimuth were obtained by the combination of cores and borehole images. The cores were calibrated to the borehole images (core shift) to determine the azimuths of the opening-mode unfilled or partially filled fractures in cores; and our observations indicate that fully calcite-filled fractures were rarely identified by image logs, hence the azimuths of the fully filled fractures can be deduced according to the spatial arrangement between the fractures and their adjacent unfilled or partially filled fractures or the corresponding bedding. The spatial distribution pattern in the subsurface is determined on the basis of outcrop analogues (Zhang et al. Reference Zhang, Zhang, Yang, Yao and Ma2012; JP Wang et al. Reference Wang, Zhang, Zhao, Wang, Wang, Zeng and Liu2014; Sun et al. Reference Sun, Hou, Yu, Wei, Mo, Zhou, Xie and Luo2015; Liu et al. Reference Liu, Zhang, Zhang and Wang2016; ZY Wang et al. Reference Wang, Liu, Zhang, Qu, Yang and Liu2016; this article), and core-image integration. Fracture morphology also provides key mechanical information to analyse their mechanical causes.
3.c. Thin-sections
Thin-sections were used to describe microfracture morphology, orientations and distribution patterns. The attributes described match those recorded for the macrofractures. Most of the thin-sections were sampled in a specific direction parallel, perpendicular or oblique to depositional lamina. The sampling intervals gradually decreased close to one macrofracture. Stained thin-sections were impregnated with red epoxy resin. Additionally, seven thin-sections sampled from Type 2 macrofractures were also prepared and used for fluid inclusion observation, and the homogenization temperatures were further measured on the basis of a standard workflow (Fall & Bodnar, Reference Fall and Bodnar2018, and references therein).
4. Results
4.a. Thrust faults
A population of reverse faults in the subsurface, having middle to high dip angles, is identified in the seismic profile and shows imbricate characteristics (Fig. 2). Their vertical offsets range from 100 m to 500 m, with almost N–S-directed shortening. The thrust faults terminate downward within the underlying Jurassic coal or Triassic lacustrine mudrocks or intersect the basement downwards or thick salt deposits upwards (Fig. 2). Based on fault sizes, these thrust faults can be divided into two groups that develop at the tectonic unit boundaries, or within the sandstones (Fig. 6). The large-scale faults have restrained the dimensions of the gas pools and simultaneously act as gas pathways for migration from the source rock to the sandstones.

Fig. 6. (a) Comprehensive stratigraphic column in one of the studied wells; the stratigraphic and fracture attitude are shown, respectively. (b) Typical borehole electrical images with normal fracture density; the image depth is marked with number 1 (the red box). (c, d, e) Successive images in the faulted zone. The depth of the images is marked with number 2 (the red box). Note that the bedding attitudes and lithology associations show minor variations from the top to the bottom imaged interval, while a distinctive boundary appears at 6950 m depth, below which fracture density increases abruptly along with thrust faults obliquely cutting through the wellbore. We speculate that two sets of the fractures with either west- or east-dip direction are related to local faulting activities. Another set of fractures with dip angles less than 10° has been documented from the vicinity of the potential fault zone, which corresponds to extension fractures.
4.b. Macrofractures
The target sandstones contain two types of opening-mode macrofractures. The first type of fracture is open and superficially appears barren (no mineral fillings). For some of these, close inspection shows that some of the fractures are lined by small, faceted mineral crystals (e.g. calcite). Most of the second type of fracture are fully filled typically by calcite, but sometimes in wide fractures they can also show trace porosity if the larger fracture space is not completely filled.
4.b.1. Type 1: barren or mineral-lined opening-mode fractures
Barren or slightly mineral-lined fractures are developed within the sandstones, with high dip angles that vary between 52° and 86°. A total of 36 fractures were observed in the cores, and most have straight, sharp traces and relatively smooth surfaces (Fig. 7a). Microscopic observations show that the frequent offset grains on the opposite fracture walls impart a micrometre rugosity, suggesting they are opening-mode fractures. Core observation shows that the fractures are unbounded as in outcrops (Hooker et al. Reference Hooker, Laubach and Marrett2013) and can propagate across thin mudrock layers with a thickness generally within 30 cm. The outcrop surveys show that their lengths are normally more than 5 m (Wang et al. Reference Wang, Zhang, Zhao, Wang, Wang, Zeng and Liu2014; this study), so the fractures always cut through core pieces and extend into the surrounding rocks.

Fig. 7. Core photographs in the tight sandstones.
The fracture widths are extremely small and are difficult to measure precisely. Image logs of the 887 fractures indicate that the average fracture widths range from 0.01 mm to 0.18 mm, and show a skewed distribution (Fig. 8). The fractures are porous, with the fracture porosity ranging between 0.01 % and 0.05 %, but locally lined with scattered mineral particles such as calcite (Fig. 7b), quartz or gypsum. Where the fracture space occurred with this mineral cement, mineral particles generally tend to form isolated deposits that bridge fracture walls. The fracture porosity was calculated using the Monte Carlo method, which is associated with fracture widths and lengths and numbers of fractures present in samples (Howard & Nolen-Hoeksema, Reference Howard and Nolen-Hoeksema1990).

Fig. 8. The width distribution of Type 1 macrofractures in the sandstones; data are obtained from image logs and are highly skewed to the small end.
In terms of the fracture distribution patterns, four sets of fractures are generally observed in the cores and borehole images (Fig. 9), whereas one set of fractures is poorly developed in the outcrops (Fig. 10). Two sets of the fractures commonly show conjugate features (Figs. 10, 11). Although no diagenetic evidence was found in the fractured cores, the cross-cutting relationships indicate the two sets of fractures should have formed at the same time. Combined with the fracture morphology, this poorly cemented opening-mode fracture could be formed as shear origins. The other two sets of fractures may be formed due to the minor variation of remote stress orientations. The orientations of the subsurface fracture sets are varied along with the structural positions, and show a potential distribution pattern (Fig. 9). Each set of fractures has a relatively consistent strike and a narrow strike range (Figs. 9, 10).

Fig. 9. Type 1 fracture distribution patterns identified in the Keshen faulted anticline; the fracture and fault data are derived from borehole imaging and seismic interpretation, respectively. Along with variation of the stratum attitude, the fracture dip-directions show a slight rotation.

Fig. 10. (a) The field survey locations and the corresponding fracture set dip-directions. The field survey was conducted by the Tarim Oilfield Company, PetroChina. The outcrop sandstones are comparable to the subsurface because they have similar fold shapes and tectonic evolution history. (b) One pair of typical conjugate fractures in the tight sandstones; the fractures have a maximum length up to 5 m. The GPS is 172 mm length. (c) Histogram showing distribution of the fracture dip angles, mostly ranging between 45° and 90° in the outcrops.

Fig. 11. Conjugate fracture pairs in the borehole image and cores. (a) The processed electrical image having two sets of fractures with the opposite dip-directions. (b) Core pieces with conjugate fracture pairs, calibrated to the corresponding borehole image; the core shift process can be seen in Nian et al. (Reference Nian, Wang, Xiao, Zhou, Sun and Song2016). (c) Two sets of conjugate fractures in the core; the white staining along the fracture traces suggests that fractures are serving as conduits to fluid flow.
4.b.2. Type 2: fully filled opening-mode fractures
Another population of opening-mode fractures are entirely filled, mostly with calcite (Fig. 7c), e.g. they are veins. Minor wider, larger-sized fractures can contain trace to moderate residual pore space marked by euhedral calcite crystals, and the amount of pore space decreases towards fracture tips. A total of 96 fractures were observed in the cores, with dip angles mainly varying between 50° and 89° to horizontal planes, and most tabular-shaped fractures are perpendicular to bedding. In core cross-section, Type 2 fracture profiles are either tabular or elliptical with sharply tapering tips. Most fractures in the cores terminate at some bedding-parallel surfaces, such as lithology boundaries between mudrock and sandstone, or fabric boundaries between different sedimentary structures, or scoured surfaces, which means they are bed-bounded as in outcrops (Hooker et al. Reference Hooker, Laubach and Marrett2013).
The widths (opening displacements) of Type 2 filled fractures can be accurately measured, and these fractures have maximum widths varying between 0.2 mm and 5 mm, typically less than 2.5 mm. Maximum width means the maximum distance between two fracture walls along fracture trace. This value could show a good linear relation with the fracture height in the majority of Type 2 fractures; however, some of the fractures also exhibit nonlinear features in which a smaller width can correspond to a larger fracture height. In combination with fracture shapes, the former is formed as tension or extension fractures corresponding to elliptical shape (Vermilye & Scholz, Reference Vermilye and Scholz1995), and the latter may be originally formed under shear stress and lately filled or they may be hybrid fractures corresponding to tabular appearance. The height-to-maximum-width ratios of the elliptical fractures are 40–270, whereas they are 400–1100 in tabular fractures.
The sediments were in an alkaline diagenetic setting, and calcite is the main diagenetic cement (Zhang et al. Reference Zhang, Yang, Wang, Shou, Zeng and Liu2014). The fractures having enough space are filled mostly with calcite (Fig. 12), which shows obvious chemical reaction with hydrochloric acid. Some tabular-shaped fractures can also be filled with calcite and/or carbon showing multilayer fabrics where calcite is closely adjacent to fracture walls and carbon is filled adjacent to the early calcite; the late calcite precipitate is filled at the fracture centre (Fig. 13a).
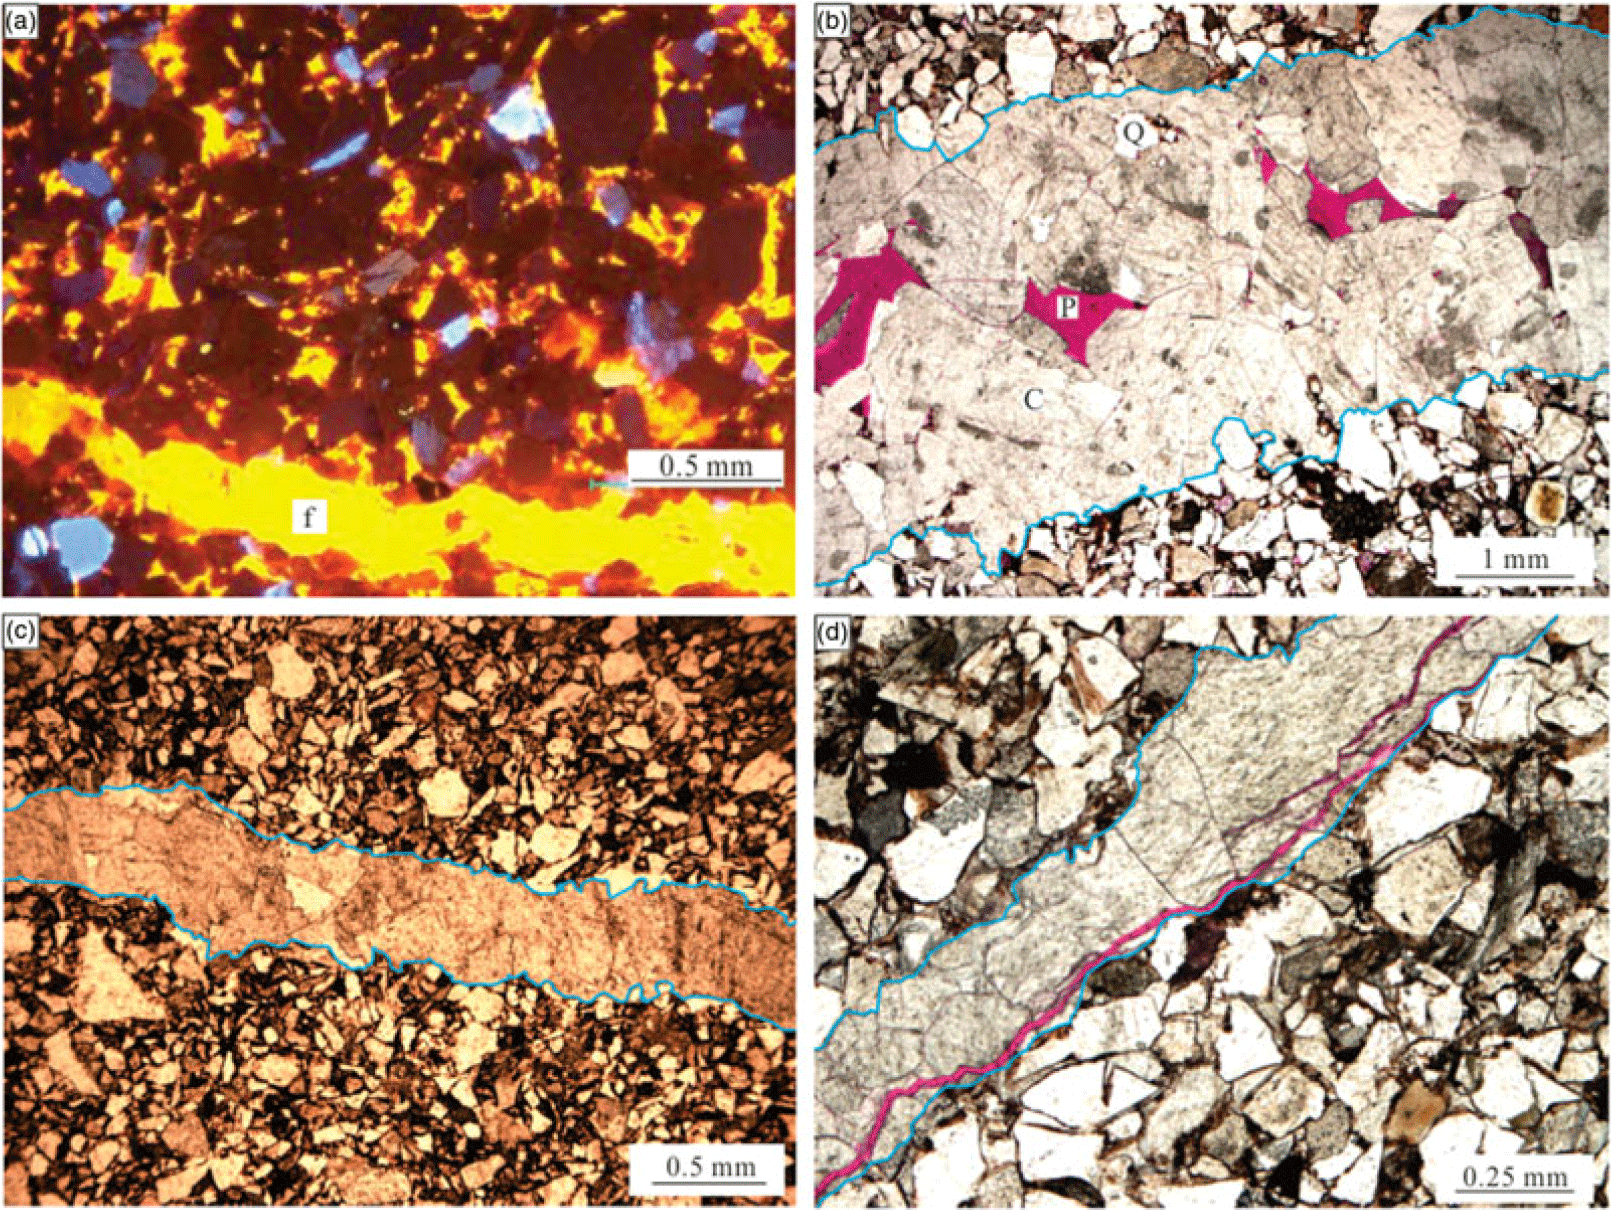
Fig. 12. (a) CL image sampled from 6766 m core, showing a section of a macrofracture filled by calcite. Brown, blue, orange and yellow colour represent quartz, feldspar, dolomite and calcite, respectively. (b) A 3 mm wide macrofracture filled by calcite (C); multiple xenomorphic calcite grains can be identified through their cleavages with different strikes. Quartz grains (Q) from hosting rocks are captured and distributed in the vicinity of fracture walls (between the two blue lines). Fracture pore space (P) is filled by stains, stained thin-section, 6618.1 m. (c) A 0.5 mm wide macrofracture, 6987.0 m. (d) A 0.25 mm wide macrofracture filled by calcite; two open microfractures are later developed along and adjacent to the macrofracture wall, respectively, 6567.7 m.

Fig. 13. Macrofracture fabrics filled by calcite and carbon. (a) Calcite precipitated after carbonization. (b) Calcite precipitated before carbonization.
The elliptical-shaped fractures have a relatively consistent N–S strike, with dispersion within 20°. They are basically perpendicular to horizontal planes (relative to wellbore axis direction), and lack any obvious geometrical relationships with the hosting beds. Lack of the cross-cutting and abutting relations suggests that their sets generally could not be determined by tectonic analysis. Core observation also shows that these fractures are principally concentrated at the top of the anticlines. Additionally, a population of mineral-filled microfractures develops parallel to the fractures, which resemble the macrofractures in shape and distribution patterns. The tabular fractures are approximately perpendicular to hosting bedding and dip steeply. Their orientations are commonly consistent with one set of fractures in Type 1.
4.c. Microfractures
4.c.1. Transgranular fractures
Transgranular fractures are microfractures with fracture widths less than 0.1 mm and having lengths of millimetres or less (Anders et al. Reference Anders, Laubach and Scholz2014); or they have aspect-ratios commonly varying between 102 and 105 (Simmon & Richter, Reference Simmon, Richter and Strens1976, pp. 105–37; Kranz, Reference Kranz1983). Transgranular microfractures in the sandstones are displayed via different type of thin-sections, and refer to fractures cutting across multiple grains and intergranular cement (Fig. 14), indicating that the rock has been cemented and indurated when the fractures grew. A total of 462 transgranular microfractures were observed with lens-shaped appearance. The microfracture trace is generally straight with no severe deviation along fracture trajectory, although locally deflecting at boundaries of grains such as feldspar, quartz and debris. The fractures generally have dip angles varying between 50° and 90°.

Fig. 14. Transgranular microfractures in the tight sandstones, revealed by stained thin-sections sampled in the vicinity of the macrofractures in Figure 7c. The formation dips nearly (342°) to the north, and the microfractures are almost perpendicular to the bedding. A relatively wider transgranular microfracture cuts across grains, and is primarily calcite-filled but locally contains trace porosity (the red stain). Several smaller transgranular fractures with similar orientations are also developed.
Owing to their elliptical appearance, the width of a single transgranular fracture is a variable and continually varied along its fracture trace, thus decreaseing to zero at fracture tips. The apparent maximum fracture width was measured via thin-sections. Although the true fracture width should be measured in thin-sections perpendicular to fracture profile, most thin-sections are commonly oblique to fracture profile to some extent. Thus, the measured apparent microfracture widths tend to be larger and need to be corrected by the angle between hosting thin-section and the fracture profile. The calculation shows that the maximum widths of the transgranular microfracture are varied between 0.01 mm and 0.1 mm, and exhibit a good linear relation with the corresponding fracture heights, indicating that the transgranular fractures could be Mode I fractures. The fractures have height-width ratio of 65–300.
Not all the transgranular fractures are fully or partly filled by diagenetic minerals, and if the precipitation occurred, most of the filling minerals are calcite (Fig. 15); the fractures can also be filled with quartz and feldspar. Crack-texture is not common within the fracture space. The early-filled fractures can be partly dissolved with residual pore space, indicating that they have a certain connectivity degree. The total fracture porosity changes between 0.1 % and 0.6 %, and could be increased by more than 0.3 % when abundant transgranular fractures are aggregated.

Fig. 15. CL image of the transgranular fractures and the corresponding image interpretation. (a) CL image showing development of quartz, feldspar, dolomite and calcite. The fracture space has a crack-seal texture and is mostly filled with calcite, though with quartz and feldspar precipitates. (b) Interpretation of (a).
Most unfilled transgranular microfractures are preferentially aligned and show approximately the same fracture sets as Type 1 macrofractures in the same bed, although with a relatively wide direction range (Fig. 16a, b). These microfractures show strikes that match one of their nearby macrofractures. The microfractures could have a distance to their nearest-neighbour macrofractures, which suggests that they are not all in close proximity to the neighbour macrofractures. Microscopic observation further indicates that late-formed microfractures are more easily induced within macrofractures and their fracture walls (Fig. 12d).

Fig. 16. Rose diagrams of fracture dip-directions in one of the cored wells (core length 17.9 m). (a) Type 1 macrofractures; the data were calculated from 220 m imaging log; (b) their adjacent transgranular microfractures; the data were obtained from stain thin-section and the CL technique; and (c) their adjacent intragranular microfractures; the data were measured using the FESEM/SEM and the LSCM technique.
Some transgranular fractures are frequently observed at the lithologic boundaries between mudrock and sandstone, or within mudrock layers (Fig. 17). As long as mudrock deposits are present, one can see this type of microfracture always occurred. These fractures are barely filled with minerals and generally show a relatively fresh fracture morphology, which suggests they were newly formed. The fracture width varies between 0.01 mm and 0.04 mm. The porosity varies between 0.05% and 0.2%. These microfractures develop closely along beddings (thus parallel to the beddings), where layers bend, end, pinch or branch (Zeng, Reference Zeng2010; this study).

Fig. 17. Diagenetic fractures along the mudrock layers in stained thin-sections. (a) Calcite partially precipitated in the fracture space (dotted circles), indicating the fractures are naturally formed. (b) The fractures are bending and directionally extending coincident with the adjacent bedding plane (the lower bedding).
4.c.2. Intragranular fractures
The vast majority of microfractures sampled within the tight sandstones are intragranular, signifying that their fracture tips lie within or coincident with detrital grains. In reality, they are small in contrast to the transgranular fractures and widely distributed in the sandstones, and can be observed in almost every thin-section with sufficient resolution. The LSCM observation shows that the fracture profiles are elliptical with sharply tapering tips when two fracture tips terminate within mineral grains; otherwise they are straight and have distinct or indistinct boundaries probably in case of the fluid inclusions. The fractures also occasionally appear as triangular-shaped if one fracture tip taper closes at grain contacts and the other terminates at the opposite grain edge, and tend to exhibit maximum width.
The widths of intragranular fractures are obtained on the basis of the CL, LSCM and FESEM/SEM section. Each fracture’s width is extremely small and we estimate the maximum width of the intragranular fractures should be at a 10 μm order of magnitude. The minimum width range is likely near several nm. The height-width aspect ratios are various. The elliptical-shaped are between 50 and 350, consistent with Type 2 macrofractures and transgranular fractures, whereas the straight-shaped are 300–800. The fracture porosity ranges between 0.01 % and 0.4 %.
Intragranular fractures may seal rapidly. Most intragranular microfractures are filled with calcite, feldspar or quartz (Fig. 18a), suggesting that they poorly conduct natural fluids. The microfracturing and cementation may be concurrent events, though insufficient evidence is provided here. Overall, the fractures display a wide range in direction (Fig. 16c) probably owing to the multiple fracturing origins occurring before, during and after deposition. Thus, the distribution patterns of intragranular fractures are also various and related to the fracture origins (discussed below). However, they generally initiate at point and line contacts between portions of grain boundaries. According to their spatial arrangement with mineral grains, these fractures are identified within quartz, feldspar and other grains in the sandstones, and they commonly appear as fracture swarms.

Fig. 18. (a) Filled intragranular fractures in the CL image (line or latticed feature), 7011.4 m. (b) A rich array of inherited intragranular fractures are developed in the quartz (Q) and feldspar (F) grains, and filled by minerals,stained thin-section, 6357.4 m. The intragranular fractures show radial patterns indicating that they initiated at grain contacts, but the contacts feature and corresponding initiation point (IP) no longer exist.
5. Discussion
5.a. Fracture genesis
Natural fractures are formed with tectonic loading (e.g. Stearns, Reference Stearns and Rieker1968, pp. 97–118; Stearns & Friedman, Reference Stearns, Friedman and King1972, pp. 82–106; Engelder Reference Engelder1985; Cooper et al. Reference Cooper, Goodwin and Lorenz2006; Lacombe et al. Reference Lacombe, Bellahsen and Mouthereau2011), overpressure (Handin et al. Reference Handin, Hager, Friedman and Feather1963; Secor, Reference Secor1965, Reference Secor, Baer and Norris1969, pp. 3–47; Fall et al. Reference Fall, Eichhubl, Bodnar, Laubach and Davis2015) or diagenetic compaction (Zeng & Li, Reference Zeng and Li2009; Zeng, Reference Zeng2010). Fracture genesis is notoriously difficult to pin down. This is because sedimentary basins generally have experienced complex tectonic evolution, and diverse subsidence, thermal and fluid-flow histories, spanning tens to hundreds of millions of years, and every process could be responsible for fracturing (Laubach and Ward, Reference Laubach and Ward2006). Moreover, paths of fracturing derived from these various origins may coincide over geological time.
In combination with tectonic loading, formation pressure evolution, and burial history in the studied sandstones, these macro- and microfracture origins are interpreted based on their morphology, orientations, mechanical properties and spatial distribution patterns.
5.a.1. Tectonic fractures
Tectonic fractures are those whose origin can be attributed to regional or local tectonic events. The thrust faults are formed during the regional N–S-directed shortening (Neng et al. Reference Neng, Xie, Sun, Lei and Xu2013). Several clues are integrated to verify that Type 1 macrofractures together with tabular-shaped Type 2 fractures are the most certain to have formed owing to bed folding or faulting. In terms of spatial arrangements, fractures formed during fold growth have a specific geometric relationship with the folds (Stearns, Reference Stearns and Rieker1968, pp. 97–118). Type 1 macrofractures are barren and not influenced by cementation, which implies they are formed during late syn-folding. According to the adjacent outcrop surveys in the same sandstone formations, a similar fracture distribution pattern compared to the subsurface was observed. The cross-cutting and abutting relations indicate that these fractures are two conjugate fracture pairs and their formation could be controlled by two stages of regional compression with horizontal maximum stress orientation changed from early NNW–SSE to late N–S (Zeng et al. Reference Zeng, Tan and Zhang2004; Wang et al. Reference Wang, Zhang, Zhao, Wang, Wang, Zeng and Liu2014), with a deflection angle c. 25°. Accordingly, the stresses were characterized with a vertical intermediate stress and a greatest compressive stress parallel to the dip direction of bedding. Moreover, syn-folding fracture sets can be specifically related to bedding, and their attitudes could change spatially, for instance, at the nose of an anticline, where the direction of greatest curvature changes (Bergbauer & Pollard, Reference Bergbauer and Pollard2004); thus it interprets why the fracture attitudes seem to vary along with the structural position and bedding. Some recent significant studies further argued that occurrence of pre-folding fractures or pre-folding deformation structures can change the common view of fold-fracture relations (Bergbauer & Pollard, Reference Bergbauer and Pollard2004; Ahmadhadi et al. Reference Ahmadhadi, Lacombe, Daniel, Lacombe, Lavé, Vergès and Roure2007, Reference Ahmadhadi, Daniel, Azzizadeh and Lacombe2008; Amrouch et al. Reference Amrouch, Lacombe, Bellahsen, Daniel and Callot2010; Lacombe et al. Reference Lacombe, Bellahsen and Mouthereau2011; Beaudoin et al. Reference Beaudoin, Leprêtre, Bellahsen, Lacombe, Amrouch, Callot, Emmanuel and Daniel2012; Tavani et al. Reference Tavani, Storti, Lacombe, Corradetti, Muñoz and Mazzoli2015). Considering the orientations of the thrust movement were not obviously varied during the Cenozoic and the orientations of tabular-shaped Type 2 fractures are basically consistent with one set of fractures in Type 1, we speculate that these fractures could be formed during early syn-folding and subjected to cementation later.
For tabular-shaped Type 2 fractures filled by calcite and/or carbon, one interpretation is that open fractures first filled with calcite in the early stage. However, before the fractures were fully filled by calcite, oil migrated into the sandstone formation (23–12 Ma; Liang et al. Reference Liang, Zhang, Zhao and Wang2002; Zhao et al. Reference Zhao, Lu and Li2002; Lu et al. Reference Lu, Liu and Zhuo2012). During the subsequent subsidence accompanied by the lateral compressive stress related to the Southern Tianshan Orogen (12–5.5 Ma; Zhang et al. Reference Zhang, Zhang, Ma, Shen, Li and Zhang2008, Reference Zhang, Yang, Wang, Shou, Zeng and Liu2014), oil in the fractures began to carbonize, thus occurring with sliding friction. This event is manifested by the striations along the carbon-layer surfaces (Fig. 13b). Eventually, the fractures reopened under the local stress field and were filled by late calcite cement (c. 5.5 Ma; Zhang et al. Reference Zhang, Zhang, Ma, Shen, Li and Zhang2008, Reference Zhang, Yang, Wang, Shou, Zeng and Liu2014).
Fault planes accommodate shear displacement and there are three sets of potential fracture swarms, with one set of shear fractures parallel to the fault plane, one set of shear fractures conjugate to the fault plane and one set of extension fractures bisecting the acute angle of these two sets of shear fractures (Nelson, Reference Nelson2001, p. 13). The majority of tectonic fractures in the studied formation were produced in association with the folding process, and their fracture density, the number of fractures per metre of vertical core or wellbore, is generally less than 0.8 fractures per metre. However, fractures are extremely dense in local concentrations and variably oriented. Three other sets of fractures are generally developed and interpreted as tectonic fault-related fractures on the basis of their distribution patterns (Fig. 6). These fault-related fractures are important for the in situ stress analysis, fault prediction and fluid flow. Additionally, the majority of transgranular fractures have a similar orientation and dip angle distribution to Type 1 macrofractures or tabular-shaped Type 2 fractures, and are interpreted as smaller members of the same fracture set (Laubach & Ward, Reference Laubach and Ward2006; Hooker et al. Reference Hooker, Gale, Gomez, Laubach, Marrett and Reed2009). As in the discussion above, Type 1 and tabular-shaped Type 2 macrofractures are identified as tectonic fractures, therefore most transgranular fractures are of tectonic origin.
Although the origin of most intragranular fractures is difficult to determine in deformed tight sandstones, some must have formed during tectonic movement based on their fracture spatial patterns which are related to a certain regional or local tectonic stress (Fig. 19). Other properties, such as fracture morphology and filling characteristics, are generally difficult to use to determine the fracture origin. In reality, the origins of intragranular fractures could be more easily determined in undeformed strata; if a stratum has ever been subjected to tectonic deformations and original orientations of intragranular fractures have been rotated, their genesis is generally difficult to deduce. For instance, formation of the intragranular fractures with a radial pattern in the sandstones is related to intense crushing and grain-scale stress concentrations at grain-contact points (Laubach & Ward, Reference Laubach and Ward2006). The compressive stress can be gravity or tectonic stresses. Generally, it is difficult to judge the fracture origin unless the stratum can be recovered to its undeformed state. In an idealized case, if the fracturing propagation path is nearly vertical, intragranular fractures could be deduced formed by diagenetic compaction to some extent; otherwise they may be tectonic microfractures.

Fig. 19. Stained thin-section containing the tectonic microfractures (a) and the corresponding image interpretation (b). The section is cut along horizontal bedding. The intragranular fractures formed first, or at least simultaneously with the two transgranular fractures (partially filled), and most show a sub-parallel feature with the transgranular fractures.
5.a.2. Diagenetic fractures
Diagenetic fractures in tight sandstones mainly result from physical diagenesis (Zeng, Reference Zeng2010), such as compaction, and most are intragranular fractures specifically attributable to grain crushing (Laubach, Reference Laubach1997; Milliken and Laubach, Reference Milliken, Laubach, Pagel, Barbin, Blanc and Ohnenstetter2000, pp. 225–43). These microfractures are identified as being of diagenetic and not tectonic origin, integrating their distribution patterns, shapes and fracture timings. The most intense fracturing induced by diagenetic compaction in the sandstones should have occurred during the Neogene (Zhang et al. Reference Zhang, Zhang, Ma, Shen, Li and Zhang2008, Reference Zhang, Yang, Wang, Shou, Zeng and Liu2014), when the formation was buried from 2400 m to 6500 m during c. 20 Ma (Fig. 20). The vertical stress derived from the overburden weight already changes between 150 MPa and 160 MPa at present. The CL observation shows that almost all the intragranular fractures were sealed with authigenic minerals. Lander & Laubach (Reference Lander and Laubach2015) propose that this occurs because minerals like quartz may preferentially precipitate on low-energy surfaces of microfractures due to their smooth and planar features. Here, homogenization temperatures could provide a good estimate for true trapping temperatures; we have analysed the homogenization temperature of fluid inclusions in some selected intragranular fracture fillings and they formed coincident with the period of rapid subsidence (Fig. 20).

Fig. 20. Burial history, geotemperature history, palaeo-tectonic stress and oil/gas charging history, and fluid-inclusion homogenization temperature of quartz deposit in the intragranular (within quartz grains) fractures. The burial history was recovered using compaction correction and back-stripping technique (Zhang et al. Reference Zhang, Yang, Wang, Shou, Zeng and Liu2014). Geotemperature history was obtained by simulation using vitrinite reflectance data. Palaeo-tectonic stress is obtained using rock acoustic emission from Zeng et al. (Reference Zeng, Tan and Zhang2004). The charging history is referred from Liang et al. (Reference Liang, Zhang, Zhao and Wang2002). The absolute stratigraphic age is determined by Jia (Reference Jia2004). A total number of 117 homogenization temperature data is collected from Yuan et al. (Reference Yuan, Yang, Yuan, Cheng, Zhu, Li and Dong2015) and Mao et al. (Reference Mao, Zhong, Neng, Zhang, Liu, Wang and Hu2015).
A large portion of intragranular microfractures should be inherited and transported from a sediment source area on the basis of shapes and patterns. The microfractures do not show an intact elliptical, tabular or wedge shape, but show a sharp line feature within grains, and the fractures are truncated at grain boundaries. These inherited fractures end at grain edges and do not cross into intergranular cement (Fig. 18b). The fractures can have orientations and patterns, but these could not be used to identify their origins.
5.a.3. Natural hydraulic fractures
Natural hydraulic fractures (NHFs) are induced by elevated pore pressure, which reduces effective normal stress (Handin et al. Reference Handin, Hager, Friedman and Feather1963; Secor, Reference Secor1965; Reference Secor, Baer and Norris1969, pp. 3–47). The occurrence of an overpressured environment and natural hydraulic fractures in the tight sandstones studied here is based on several preconditions, although researchers still held different ideas on the main controlling factors of abnormally high pressure (Zeng & Liu, Reference Zeng and Liu2006). First, multiple salt layers, with a total thickness generally more than 400’m, were deposited above the tight sandstones during the Palaeogene (Fig. 2; Pi et al. Reference Pi, Xie, Zhang, Tian and Zou2002; Zeng & Liu, Reference Zeng and Liu2006; Wang, Reference Wang2014; Wang et al. Reference Wang, Li, Lv, Wang, Zhou, Zhuo and Shang2015). These impermeable layers can provide a good capping condition for the subsequent fluid accumulation. Second, the studied sandstone formation has been subjected to long-term tectonic compression during the Neogene and Quaternary period (Pi et al. Reference Pi, Xie, Zhang, Tian and Zou2002; Zeng & Liu, Reference Zeng and Liu2006). The overburden pressure experiment, simulating the tight sandstone core samples subjected to tectonic stresses similar to the subsurface environment, indicates that c. 76 % of the crustal stress would be reduced by pore fluid pressure when the maximum horizontal principal stress (SHmax) exceeds 34 MPa (Zeng & Liu, Reference Zeng and Liu2006), which also suggests that strong tectonic compression could contribute to the formation of overpressure. Third, the formation pressure difference between the Jurassic source rock and the tight sandstones was commonly more than 70 MPa (Wang et al. Reference Wang, Li, Lv, Wang, Zhou, Zhuo and Shang2015), and forced the fluid continuously charging from the source rock to the sandstone reservoirs. Overall, the thrust movement, combined with overlying salt layers and high-pressure fluids injected from the underlying source rocks, has resulted in an overpressured environment in the sandstones.
In the mentioned fracture types, elliptical-shaped Type 2 fractures and their genetic-related transgranular fractures are interpreted as natural hydraulic fractures. They are developed at the top of the anticlines, and the tensile shape indicates they are veins of the products of tension stress. In the cores, they extend parallel to the borehole axis, and well correlation suggests these fractures lack a geometrical relationship with depositional beds. The macrofractures are perpendicular or sub-perpendicular to the minimum principal stress; thus they are NHFs probably formed as oil migrated into the sandstone formation, and a positive opening corresponds to a negative effective stress (Zeng, Reference Zeng2010; Anders et al. Reference Anders, Laubach and Scholz2014).
5.b. Fracture timing
Determination of fracture timing in naturally fractured formations is difficult due to complex fracture swarm containing multiple origins of fractures which formed during a long geological history. At the early stage, relative fracturing timing is determined mainly on the basis of cross-cutting and abutting relationships. Use of cement deposits in fracture space and their fluid inclusions further allows a relatively accurate determination of fracture timing (Fall et al. Reference Fall, Eichhubl, Cumella, Bodnar, Laubach and Becker2012, Reference Fall, Eichhubl, Bodnar, Laubach and Davis2015). Moreover, utility of U–Pb dating on calcite cements of natural fractures can more accurately constrain the formation time of these fractures and reveal complex stress evolution and deformation sequences (Beaudoin et al. Reference Beaudoin, Lacombe, Roberts and Koehn2018).
The thrust faults have orientations and displacement patterns that are kinematically consistent with compressional deformation of Southern Tianshan orogen. Tectonic analysis based on outcrop survey and seismic interpretation indicates that they have formed since the Miocene (Liu et al. Reference Liu, Lu, Li, Jia, Lei, Chen, Wang and Fan2000). Type 1 macrofractures are newly formed because the fracture surface is barren and moderately or weakly influenced by diagenesis, which suggests they are younger than Type 2 fractures within the same bedding. Our estimated homogenization temperatures of fluid inclusions contained within infills of Type 2 elliptical macrofractures indicate that this type of fracture began to form in the Early Neogene, with fluid-inclusion homogenization temperatures c. 80°C to 90°C, while the palaeogeotherm derived from oxygen isotopes of the tabular macrofractures changes between 85°C and 130°C (JP Wang et al. Reference Wang, Zhang, Zhao, Wang, Wang, Zeng and Liu2014; Wang, unpub. data, 2015). Therefore, according to the burial and geotemperature curves (Fig. 20), Type 2 fractures were mainly formed during the Early to Middle Neogene (from 25.0 Ma to 11.0 Ma).
Although lacking fluid inclusion data, a few relations can be investigated to determine relative fracture timing in the microfractures. Most of the transgranular fractures, as we discussed, are tectonic fractures formed related to Type 1 macrofractures ortabular-shaped Type 2 macrofractures. Macrofractures are generally the result of the coalescence of microfractures (Mogi, Reference Mogi1962; Tham et al. Reference Tham, Liu, Tang, Lee and Tsui2005). Therefore, the transgranular fractures with barren surfaces could be formed prior to Type 1 macrofractures and the filled transgranular microfractures were probably formed prior to tabular-shaped Type 2 macrofractures. The cross-cutting and abutting relationships between the transgranular microfractures and other types of fracture are absent. Homogenization temperatures of the fluid inclusions or oxygen isotopes in the inherited fractures have not been specially measured, but they formed before occurrence of the deposition. Some early diagenetic fractures were formed along with the early subsidence corresponding to the palaeogeotemperature less than 80°C (Yuan et al. Reference Yuan, Yang, Yuan, Cheng, Zhu, Li and Dong2015), and other intragranular fractures were mainly formed from 25.0 Ma to 5.5’Ma (Fig. 20).
5.c. Implications for gas migration
The multiple-origin natural fractures developed within the tight sandstones have played specific roles during oil/gas flow from the source layers to the sandstone reservoirs, or between the adjacent sandstone layers. However, they can not only increase formation permeability, but also decrease formation permeability when natural fractures are diagenetically filled.
As discussed above, the imbricate faulted fractures have linked the Jurassic coal-bearing source rocks and the target sandstone reservoirs. In combination with the petroleum charging characteristics (He et al. Reference He, Zhou, Yang, Lei and Ma2009; Wang, Reference Wang2014; Fig. 20), they are significant channels during the primary gas migration since c. 2.48 Ma (Fig. 20; Wang, Reference Wang2014). Driven by the abnormally high pressure generated within the source rock, natural gas can migrate in the vertical and lateral directions along these faults (He et al. Reference He, Lu and Li2004; Li & Liu, Reference Li and Liu2009; Wang, Reference Wang2014), and finally formed the well-known gas pools in China, such as the Kela2 and Keshen. The vertical migration distance commonly varies between 2 km and 5 km.
When the oil and gas fluid migrated out of the source rock and into the tight sandstones, the secondary migration started. The described fracture properties would to some extent influence fluid flow during this period. Given that the pre-existing parallel-plate model calculating fracture permeability indicates that the value is significantly related to fracture width (Huitt, Reference Huitt1955), it can be assumed that a single unfilled Type 2 macrofracture should be more hydraulically conductive than a Type 1 macrofracture. In reality, the presence of oil inclusions within the fracture infillings indicates Type 2 macrofractures always act as good migration channels for oil. The calculation also indicates that the transgranular microfractures are generally wider than intragranular fractures, suggesting that fluid would preferentially migrate via the transgranular microfractures. The widths of Type 1 fractures are sensitive to overburden pressure due to the fresh fracture surface which is not sealed or bridged by mineral particles. The values obtained from the imaging log indicate that their geometrical fracture widths would be less and probably near the order of magnitude of 10 μm considering the principle of width calculation based on image logs (Luthi & Souhaite, Reference Luthi and Souhaite1990). Therefore, Type 1 macrofractures may have a similar width range to the maximum widths of transgranular microfractures. In the deep subsurface formation, these two types of fracture should have similar influence to fluid flow considering the parameter of fracture width.
Type 2 macrofractures in these faulted anticlines are independent of the present stress direction, while the current dominant sets of open fractures are Type 1 fold-related fractures. As described above, they have moderate to high dip angle, indicating that the vertical stress may show a relatively weak effect on the fracture width and permeability. In situ maximum horizontal stress can control fracture permeability via its relationship with fracture strikes (Barton et al. Reference Barton, Zoback and Moos1995; Zeng & Li, Reference Zeng and Li2009). The four sets of Type 1 fractures have different angles of intersection to the current SHmax orientation. The fractures striking approximately E–W are basically perpendicular to the direction of the SHmax (Zeng et al. Reference Zeng, Tan and Zhang2004), and have a poor hydraulic conductivity, with an average permeability less than 1.3 mD (T. Nian, unpub. Ph.D. thesis, China Univ. of Petroleum, 2017), while Type 1 fractures with strikes parallel to or within 35° of the horizontal maximum principal stress often exhibit the most efficient passage for the largest volumes of gas flow according to the production test, and their average permeability varies between 2.2 mD and 10.1 mD (T.’Nian, unpub. Ph.D. thesis, China Univ. of Petroleum, 2017). Thus, a permeability anisotropy is commonly expected with maximum permeability orientations intersecting with corresponding SHmax orientation less than 35°. Additionally, the maximum permeability orientations are rotated in the hinge zones owing to the local variation of Type 1 fracture attitude. Moreover, the fault-related fractures could obviously enhance local formation permeability.
Diagenetic evolution indicates that the sandstone formation was subjected to two main cementation events, respectively corresponding to the syngenetic (before 66 Ma) and mesogenetic (from 16.9 Ma to 5.5 Ma) periods (Zhang et al. Reference Zhang, Yang, Wang, Shou, Zeng and Liu2014). Hence, the fractures formed prior to the cementation show poor hydraulic conductivity; some of the filled Type 2 macrofractures and microfractures were dissolved in the late diagenetic history, but overall they show a low dissolution degree. Although these fractures with tectonic, overpressure and diagenetic origins have established a complicated fracture system which links different types of pore space, fractures developed after 5.5 Ma could be more conductive and provide the main channels for fluid flow in the sandstone formations present. Natural gas in the sandstones began to accumulate after the Pliocene (Zhao et al. Reference Zhao, Lu and Li2002; Wang & Long, Reference Wang and Long2010; Lu et al. Reference Lu, Liu and Zhuo2012). Therefore, Type 1 macrofractures and their related microfractures, which appear as multi-scale fracture swarms contributing to the formation permeability, are main gas migration channels within the sandstones. The open microfractures connect the intergranular- and intragranular pores, and Type 1 macrofractures link the sandstone layers, thus resulting in the widely distributed gas pools in the Kuqa Depression.
6. Conclusions
In this study, thrust faults, two types of macrofractures and two types of microfractures have been identified in the Lower Cretaceous Kuqa Depression tight sandstones. The thrust faults formed during the Cenozoic shortening and act as the primary migration channels linking the underlying Jurassic coal-bearing source rocks and the sandstone reservoirs. Type 1 macrofractures appear as fresh or locally mineral-lined and have a kinematic width probably near the order of magnitude of 10 μm in the deep subsurface, and the fracture porosity varies between 0.01 % and 0.05 %, suggesting they merely play the role of migration channels and do not significantly increase the total porosity. Type 2 macrofractures are fully mineral-filled fractures showing elliptical or tabular shape with sharply tapering tips. Their maximum fracture widths show a good linear relation to the elliptical-shaped fractures, with corresponding fracture heights which suggest they are formed under tension stress. The transgranular microfractures, with maximum widths varying between 0.01 mm and 0.1 mm, are open or filled mostly by calcite. Although the intragranular microfractures are the most developed, they are filled by calcite, feldspar or quartz and make no contribution to reservoir producibility. The macrofractures and transgranular microfractures are regularly distributed considering they were formed corresponding to folding/faulting processes, diagenetic compaction and naturally hydraulic fracturing, respectively. Most of the intragranular microfractures are inherited with an irregular distribution. In combination with spatial arrangements, orientations, morphology and mechanical properties, these fractures can be divided into tectonic fractures (Type 1 macrofractures, tabular-shaped Type 2 macrofractures and related transgranular and intragranular fractures), diagenetic intragranular fractures, and natural hydraulic fractures (elliptical-shaped Type 2 macrofractures and related transgranular fractures). Their relative formation times are further determined based on tectonic and diagenetic analysis and fluid inclusion data. Analysis of diagenetic cementation and orientation relations with in situ stress field indicates that Type 1 macrofractures and their related microfractures have controlled the present flow system of the tight sandstones.
Acknowledgements
This study was funded by China Postdoctoral Science Foundation (Grant No. 2019M650783), the National Natural Science Foundation of China (Grant Nos. 41772090 and 41872133) and the National Science and Technology Major Project of China (Grant No. 2017ZX05009-002). We thank Chengwen Xiao and Lei Zhou (in the Tarim Oilfield Company, PetroChina) for data preparation, and the Tarim oilfield for allowing data to be shared for this research. Dr Qiucheng Xu and Min Li are also thanked for their help during the revision. We thank two anonymous reviewers, Dr John Hooker and Prof. Olivier Lacombe for their constructive suggestions to improve the paper.
Declaration of Interest
None.


