


1. Introduction
The Jurassic–Cretaceous boundary interval was characterized by significant fluctuations in Earth system processes (Hallam, Reference Hallam1986; Ogg & Lowrie, Reference Ogg and Lowrie1986; Sager et al. Reference Sager, Zhang, Korenaga, Sano, Koppers, Widdowson and Mahoney2013; Price et al. Reference Price, Főzy and Pálfy2016) that resulted in the extinction of many marine invertebrates (Hallam, Reference Hallam1986; Alroy, Reference Alroy2010; Tennant et al. Reference Tennant, Mannion, Upchurch, Sutton and Price2017). Despite its importance in Earth history, the precise radiometric age and correlations of the Jurassic–Cretaceous boundary interval are poorly understood compared with those of other Phanerozoic environmental crises. This is partly because of the previous lack of a robust, global chronostratigraphic framework for the boundary (Zakharov et al. Reference Zakharov, Bown, Rawson, Rawson, Dhondt, Hancock and Kennedy1996; Wimbledon et al. Reference Wimbledon, Casellato, Reháková, Bulot, Erba, Gardin, Verreussel, Munsterman and Hunt2011). After long debate, the Berriasian Working Group of the International Subcommission on Cretaceous Stratigraphy has voted to adopt the base of the Calpionella alpina Subzone as the primary marker for the base of the Berriasian Stage in the Tethyan faunal realm (Wimbledon, Reference Wimbledon2017). At this time, a stratotype section has not been formally designated. This potential Global Boundary Stratotype Section and Point (GSSP) level cannot be traced biostratigraphically into Arctic areas (e.g. Wimbledon, Reference Wimbledon2017, fig. 1). Palaeomagnetic reversal data may provide direct Boreal–Tethyan correlation for the Tithonian–Berriasian boundary eventually, but data from the Boreal Nordvik section (Houša et al. Reference Houša, Pruner, Zakharov, Košťák, Chadima, Rogov, Šlechta and Mazuch2007; Bragin et al. Reference Bragin, Dzyuba, Kazansky and Shurygin2013; Schnabl et al. Reference Schnabl, Pruner and Wimbledon2015) remain to be confirmed in other Arctic sections. Alternative options for the placement of the Jurassic–Cretaceous boundary continue to find support.
Although the international chronostratigraphic terminology for the Jurassic–Cretaceous boundary interval (Tithonian and Berriasian stages) is increasingly being used in Canadian Arctic studies, interpretations of the correlations of the substages and fossil zones entailed in these Tethys-based stages into the Arctic vary among global workers. Particularly contentious and significant is how much of the upper Volgian Stage is time-equivalent with the lower Berriasian Stage. Our usage in this report of the roughly equivalent Boreal (Volgian, Ryazanian) and Tethyan nomenclature follows that of the relevant original literature cited. Our data do not contribute to, or require, discussion of their detailed correlations or about the common but potentially misleading use of the term Boreal for some NW European Sub-boreal sequences.
The numerical age of the Jurassic–Cretaceous boundary is also under debate. The International Commission of Stratigraphy (Cohen et al. Reference Cohen, Finney, Gibbard and Fan2013, updated 2018/08) places the Jurassic–Cretaceous boundary at c. 145 Ma following Mahoney et al. (Reference Mahoney, Duncan, Tejada, Sager and Bralower2005), who suggest a minimum age for the boundary based on mean 40Ar–39Ar ages of 144.6 ± 0.8 Ma, although recent U–Pb studies by Aguirre-Urreta et al. (Reference Aguirre-Urreta, Naipauer, Lescano, López-Martinez, Pujana, Vennari, Lena, Concheyro and Ramos2019) and Lena et al. (Reference Lena, López-Martínez, Lescano, Aguire-Urreta, Concheyro, Vennari, Naipauer, Samankassou, Pimentel, Ramos and Schaltegger2019) provide new U–Pb ages that suggest that the numerical age of the boundary is more likely as young as 140–141 Ma.
A small change to lower δ13C values occurs within Magnetozones M18–M17, and within the B/C Calpionellid Zone (Weissert & Channell, Reference Weissert and Channell1989), that contrast with more positive values obtained from the Valanginian Stage (Lini et al. Reference Lini, Weissert and Erba1992; Price et al. Reference Price, Főzy and Pálfy2016). Such variation suggests that carbon isotope anomalies may be useful to characterize the Jurassic–Cretaceous boundary interval (e.g. Michalík et al. Reference Michalík, Reháková, Halásová and Lintnerová2009; Dzyuba et al. Reference Dzyuba, Izokh and Shurygin2013). A recent global stack compiled by Price et al. (Reference Price, Főzy and Pálfy2016) that included data from many sites spanning a range of mainly southerly latitudes, and was therefore considered representative of the global carbon isotopic signal, showed that the composite δ13Ccarb curve from the base of the Kimmeridgian stage to the base of the Valanginian stage has no major perturbations. However, there is a paucity of published δ13C data from Arctic regions and, in those that do exist, there is notably greater variation in high-northern-latitude δ13Corg (e.g. Hammer et al. Reference Hammer, Collignon and Nakrem2012) than in better-studied middle- to low-latitude carbonate records (δ13Ccarb) (Price et al. Reference Price, Főzy and Pálfy2016) or in δ13Ccarb records from belemnites in Arctic successions (Žák et al. Reference Žák, Košťák, Man, Zakharov, Rogov, Pruner, Dzyuba, Rohovec and Mazuch2011).
Hammer et al. (Reference Hammer, Collignon and Nakrem2012) present δ13Corg data for the Upper Jurassic – lowermost Cretaceous systems of central Spitsbergen. This record shows a middle Volgian excursion of c. 5‰ that they term the Volgian Isotopic Carbon Excursion (VOICE). Koevoets et al. (Reference Koevoets, Abay, Hammer and Olaussen2016) documented a middle Volgian negative excursion in δ13Corg of c. 3‰ in the Agardhfjellet Formation of central Spitsbergen. Records from northern Siberia also document a δ13Corg excursion to isotopically lighter values in the upper middle Volgian (Exoticus Zone; Zakharov et al. Reference Zakharov, Rogov, Dzyuba, Žák, Košt’ák, Pruner, Skupien, Chadima, Mazuch and Nikitenko2014), but with no parallel trend in δ13Ccarb measured in belemnite rostra from the same section (Žák et al. Reference Žák, Košťák, Man, Zakharov, Rogov, Pruner, Dzyuba, Rohovec and Mazuch2011); this is possibly because carbon isotopes preserved in belemnite rostra may not be in equilibrium with ambient seawater (Wierzbowski & Joachimski, Reference Wierzbowski and Joachimski2009). Turner et al. (Reference Turner, Batenburg, Gale and Gradstein2019) report a δ13Corg curve from the 6406/12-2 drill core from the Norwegian Sea that spans the interval from the base of the Pallasioides Zone to the top of the Rotunda Zone. A negative isotopic excursion occurs in the Pallasioides Zone that the authors relate to VOICE. Further south, Morgans-Bell et al. (Reference Morgans-Bell, Coe, Hesselbo, Jenkyns, Weedon, Marshall, Tyson and Williams2001) examined the carbon isotope stratigraphy of organic matter preserved in the Wessex Basin. Their record extends into the Upper Jurassic System but does not continue through to the lowest Berriasian Stage. This curve shows a trend of declining δ13Corg of much greater magnitude than the time-equivalent carbonate curve.
Alternative correlation tools, such as geochemical anomalies in marine strata, may therefore aid with future correlations of Jurassic–Cretaceous strata, particularly in high northern latitudes. A new δ13Corg record from Upper Jurassic – Lower Cretaceous argillaceous strata from two stratigraphic sections in the Sverdrup Basin, Arctic Canada, is presented here. Geochemical trends are compared with data from other high-latitude successions as well as with Tethyan sections to evaluate their palaeoceanographic and palaeoclimatic importance and potential for stratigraphic correlation. In the absence of any obvious definitive cause for VOICE, several possible contributing factors, both regional and distant, are considered and discussed.
2. Study area
The Sverdrup Basin is a 1300 × 350 km palaeo-depocentre in the Canadian Arctic Archipelago that contains up to 13 km of nearly continuous Carboniferous–Palaeogene strata (Figs 1, 2; Balkwill, Reference Balkwill1978; Embry & Beauchamp, Reference Embry, Beauchamp and Miall2019).
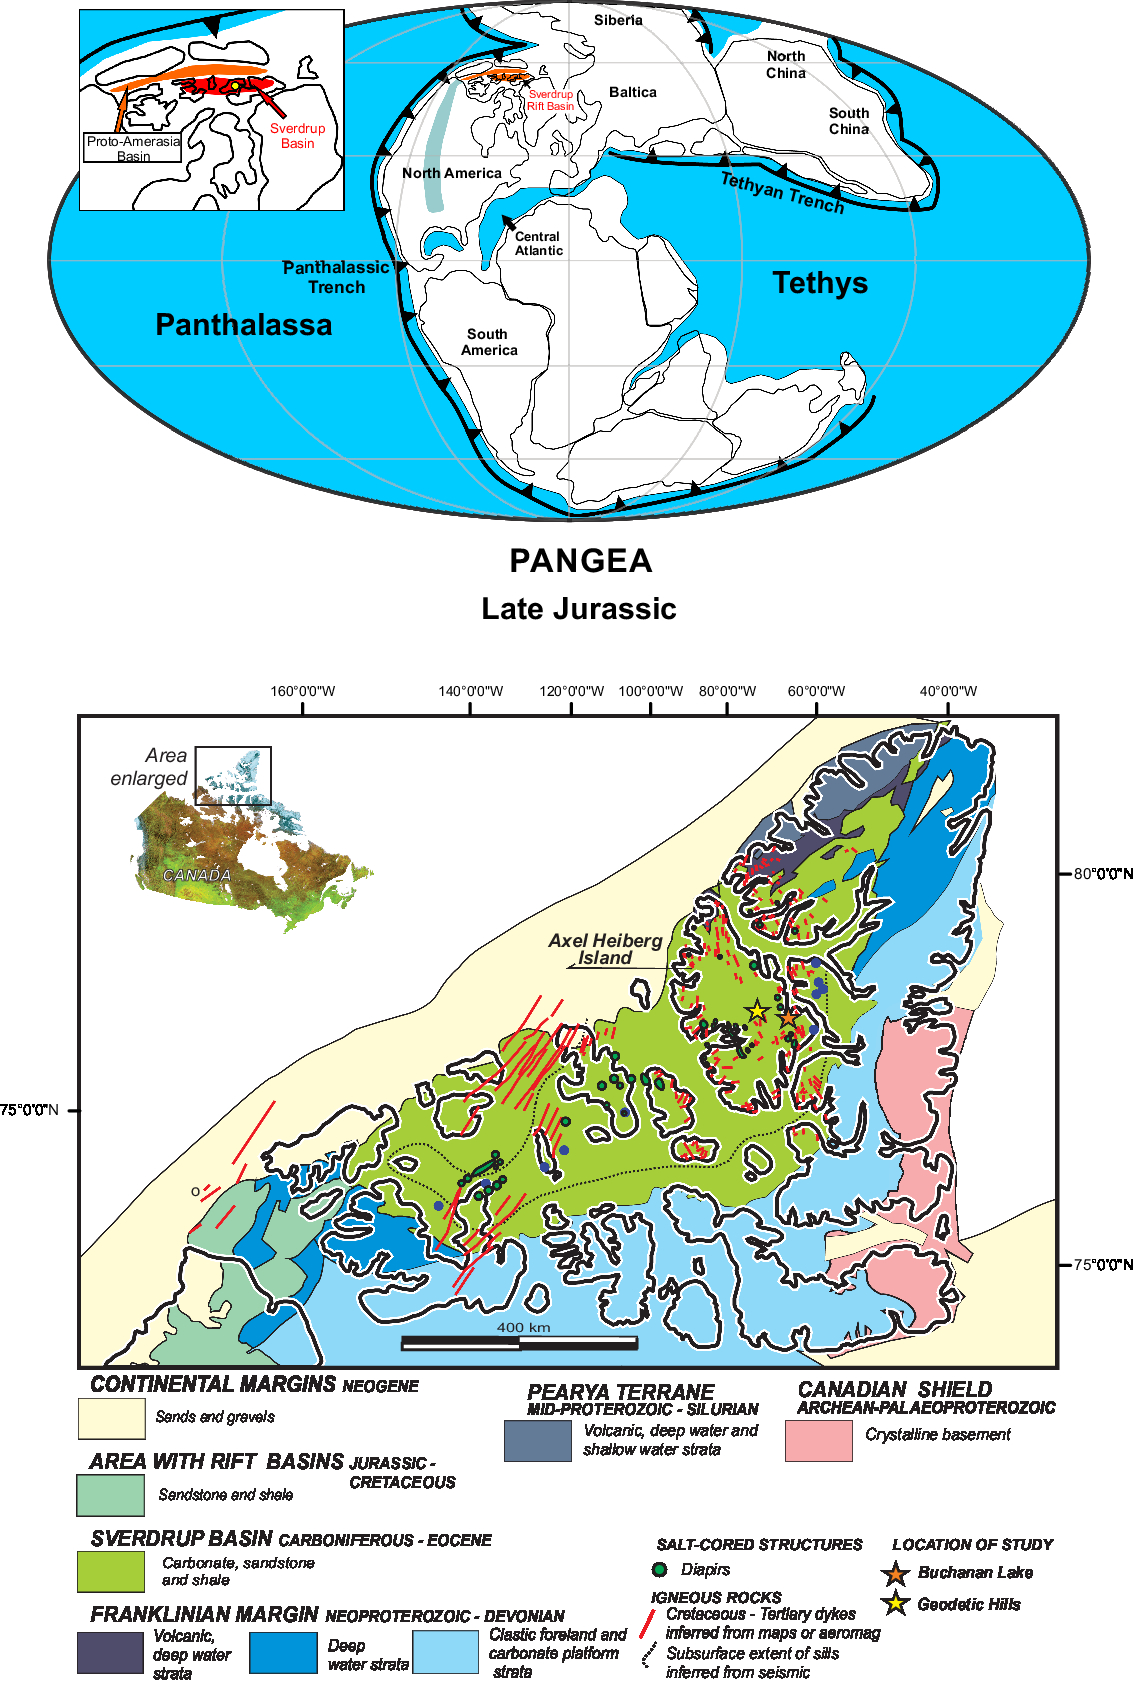
Fig. 1. Upper: palaeogeographic map of Pangea at c. 150 Ma (Tithonian; modified from Scotese, Reference Scotese2014), with modifications from Amato et al. (Reference Amato, Toro, Akinin, Hampton, Salnikov and Tuchkova2015), Midwinter et al. (Reference Midwinter, Hadlari, Davis, Dewing and Arnott2016) and Hadlari et al. (Reference Hadlari, Midwinter, Galloway and Durbano2016, Reference Hadlari, Midwinter, Poulton and Matthews2017, Reference Hadlari, Dewing, Matthews, Alsonso-Torres and Midwinter2018). Arc and microcontinental terranes that had not yet docked with the North American and Siberian accretionary margins are not illustrated in the palaeo-Pacific Ocean (Panthalassa). Lower: map of the Sverdrup Basin showing location of stratigraphic sections studied at Geodetic Hills and Buchanan Lake, Axel Heiberg Island, Nunavut. After Dewing et al. (Reference Dewing, Turner, Harrison and Goodfellow2007).
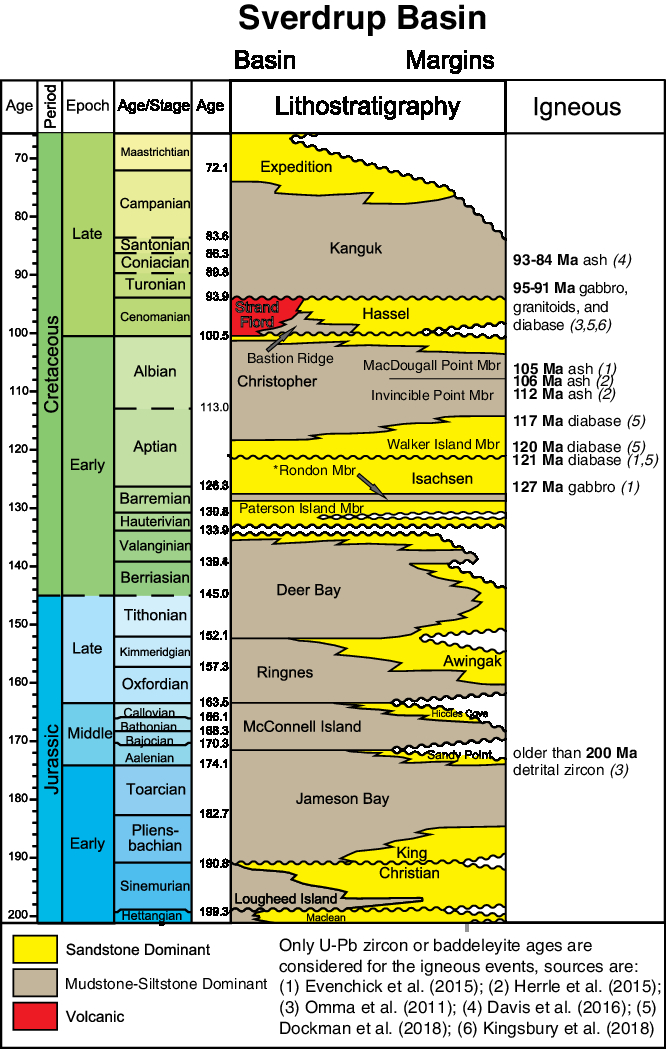
Fig. 2. Mesozoic lithostratigraphy of Sverdrup Basin (after Hadlari et al. Reference Hadlari, Midwinter, Galloway and Durbano2016). The International Chronostratigraphic Chart (ICS) v 2018/08 (Cohen et al. Reference Cohen, Finney, Gibbard and Fan2013; updated) is used for absolute ages. Note that intrusive ages should be younger than the intruded strata, and that detrital zircon ages can be older.
Basin subsidence began following rift collapse of the Ellesmerian Orogenic Belt during early Carboniferous time (Embry & Beauchamp, Reference Embry, Beauchamp and Miall2019). Rifting of the Sverdrup Basin continued during the late Carboniferous Period and led to widespread flooding of the rift basin and increasingly open-marine connections with Panthalassa and North Greenland and the Barents Sea (Embry & Beauchamp, Reference Embry, Beauchamp and Miall2019). After the first rift phase, marine deposition persisted through the Permian and Triassic periods. A second phase of rifting began in the Early Jurassic, continued through the Late Jurassic – earliest Cretaceous interval, and then ceased in the Sverdrup Basin when seafloor spreading began in the adjacent proto-Amerasia Basin to form the Arctic Ocean (Hadlari et al. Reference Hadlari, Midwinter, Galloway and Durbano2016). Deposition in the Sverdrup Basin ended in the Palaeogene Period due to regional compression and widespread uplift associated with the Eurekan Orogeny (Embry & Beauchamp, Reference Embry, Beauchamp and Miall2019).
In the Late Jurassic, the Sverdrup Basin was one of many rift basins that formed during the break-up of Pangea and affected palaeoceanographic connections between the western Tethys and Panthalassa in northern latitudes. Deposition of the Deer Bay Formation during latest Jurassic – earliest Cretaceous time marked a rift climax in the Sverdrup Basin prior to the break-up of the adjacent proto-Amerasia Basin, manifested as a sub-Hauterivian break-up unconformity in the Sverdrup Basin (Galloway et al. Reference Galloway, Sweet, Sanei, Dewing, Hadlari, Embry and Swindles2013; Hadlari et al. Reference Hadlari, Midwinter, Galloway and Durbano2016; Fig. 2). The Deer Bay Formation is therefore a lithostratigraphic unit of interest from both a tectonostratigraphic and palaeoceanographic perspective; its study may provide insight into both regional and global changes at this dynamic time in Earth’s history.
The Deer Bay Formation is a succession of mudstone with interbeds of siltstone and very-fine-grained sandstone deposited in pro-delta to offshore shelf environments across the Sverdrup Basin during the Volgian to Valanginian ages (Heywood, Reference Heywood1957; Balkwill, Reference Balkwill1983; Embry, Reference Embry1985). The Deer Bay Formation reaches a maximum thickness of 1375 m on eastern Ellef Ringnes Island and 920 m on Axel Heiberg Island (Balkwill, Reference Balkwill1983). Offshore shelf mudstones of the Deer Bay Formation conformably overlie either the shallow-shelf sandstones of the Awingak Formation or the Ringnes Formation, its offshore-shelf mudstone equivalent (Fig. 2). Deer Bay mudstones grade conformably into delta-front and fluvial-deltaic sands of the overlying Isachsen Formation along the axis of Sverdrup Basin (Fig. 2; Balkwill, Reference Balkwill1983; Embry, Reference Embry1985), but these formational contacts are disconformable on basin margins (Hadlari et al. Reference Hadlari, Midwinter, Galloway and Durbano2016; Embry & Beauchamp, Reference Embry, Beauchamp and Miall2019). The Deer Bay Formation is undivided except for the designation of the c. 40 m sandstone-dominated Glacier Fiord Member in its upper part on southern Axel Heiberg Island, south of the study area (Embry, Reference Embry1985). In other localities, this member is absent from shale facies or because of truncation below an intra- or sub-Isachsen unconformity (Embry, Reference Embry1985). Concretions of various compositions, size and shape occur throughout the Deer Bay Formation, with large (up to 5 m long) calcitic and sideritic mudstone concretions common in its lower portion. Glendonites occur in multiple horizons that range in thickness from 2 to 20 m throughout the Deer Bay Formation and are most common in its upper Valanginian portion (Kemper, Reference Kemper1975, Reference Kemper1983, Reference Kemper1987; Kemper & Jeletzky, Reference Kemper and Jeletzky1979; Selmeier & Grosser, Reference Selmeier and Grosser2011; Grasby et al. Reference Grasby, McCune, Beauchamp and Galloway2017). This upper interval is further characterized by finely laminated siltstones and fissile shales that host rare thin rusty-weathering calcareous layers and irregularly distributed intervals of calcareous concretions (Heywood, Reference Heywood1957; Kemper, Reference Kemper1975; Balkwill, Reference Balkwill1983). The biostratigraphic framework of the glendonite-bearing Valanginian succession was described by Kemper (Reference Kemper1975, Reference Kemper1977, Reference Kemper1987) based on ammonites in successions exposed on Amund Ringnes (lower Valanginian) and Ellef Ringnes (upper Valanginian) islands. These strata also contain age-diagnostic marine bivalves, including Buchia keyserlingi (Lahusen) and belemnites (Jeletzky, Reference Jeletzky1973; Kemper, Reference Kemper1977).
3. Materials and methods
A total of 154 samples were collected every c. 1.5–2 m throughout a 255 m exposure of the Deer Bay Formation at Buchanan Lake (79° 22′ 0.47″ N, 87° 46′ 9.03″ W), and 92 samples were collected every c. 3–4 m from a 388 m exposure of the Deer Bay Formation at Geodetics Hills (79° 48′ 57.20″ N, 89° 48′ 20.41″ W), Axel Heiberg Island (Fig. 1). Bivalves, belemnites and ammonites were collected from the Buchanan Lake section; macrofossils were not observed at the Geodetic Hills section. All samples are stored in permanent collections of the Geological Survey of Canada.
Mudstone samples were pre-treated with 10% HCl to remove carbonates, and then δ13C analysis of organic carbon was performed using a Elemental VarioEL Cube Elemental Analyser followed by a trap-and-purge separation and online analysis by continuous flow with a DeltaPlus Advantage isotope ratio mass spectrometer coupled with a ConFlo III interface at the GG Hatch Stable Isotope Laboratory, University of Ottawa. Results are reported as ‰ relative to Vienna Peedee belemnite (V-PDB) and normalized to internal standards calibrated to the international standards IAEA-CH-6 (–10.4‰), NBS-22 (−29.91‰), USGS-40 (−26.24‰) and USGS-41 (37.76‰). Long-term analytical precision is based on blind analysis of the internal standard C-55 (glutamine; −28.53‰) not used for calibration, and is routinely better than 0.2‰. For the Buchanan Lake dataset (n = 154), 14 quality control duplicate analyses were run (representing 9% of the samples). For the Geodetic Hills dataset (n = 92), 12 quality control duplicate analyses were run (12%) (online Supplementary Material available at http://journals.cambridge.org/geo). Average relative percent difference (RPD) was 0.13 ± 0.10‰ SD (n = 14) for the Buchanan Lake samples and 0.55 ± 0.42‰ SD (n = 12) for the Geodetic Hills material. The blind standard C-55 was run in triplicate for each of the three batches to assess accuracy. The average RPD between the measured and expected value of the standard was 0.18 ± 0.13‰ SD (n = 9).
Organic carbon isotopic composition can be influenced by the type and maturity of organic matter; Rock-Eval pyrolysis was therefore conducted on all samples. Total organic carbon (TOC, wt%) was determined by Rock-Eval 6 (Vinci Technologies, France) pyrolysis as the sum of organic matter during pyrolysis (pyrolysable carbon, 100–650°C) and oxidation (residual carbon, 400–850°C) on all samples. Analyses of standard reference materials (IFP 160000, Institut Français du Pétrole; internal 9107 shale standard, Geological Survey of Canada, Calgary; Ardakani et al. Reference Ardakani, Sanei, Snowdon, Outridge, Obermajer, Stewart, Vandenberg and Boyce2016) was run every fifth sample demonstrating a < 1% relative standard deviation (RSD) for TOC, < 3% RSD for S1 and S2, and 11% RSD for S3. The lower accuracy for S3 in bulk samples was expected due to poor peak integration and distinction between S3 organic matter and S3 carbonates that may occur because of the presence of siderite in standards (Ardakani et al. Reference Ardakani, Sanei, Snowdon, Outridge, Obermajer, Stewart, Vandenberg and Boyce2016). Duplicate analyses were conducted for assessment of analytical precision. In the Buchanan Lake dataset 22 duplicate samples were run, and in the Geodetic Hills dataset two duplicate samples were run (online Supplementary Material available at http://journals.cambridge.org/geo). Samples from both sections comprised the analytical batch from which quality control duplicate samples were randomly selected. Average RPD for TOC (wt%) was 16.75 ± 26.93, S1 is 13.21 ± 15.34, S2 is 9.56 ± 13.67 and S3 is 11.02 ± 14.30 (n = 24).
4. Results
4.a. Macrofossils and age of strata
Macrofossils were found during this study in the middle and upper parts of the Deer Bay Formation in the Buchanan Lake section and were not seen in the Geodetic Hills section. The Buchanan Lake macrofossils are, from top of the section to the base: (1) small impressions of Buchia sp., 76 m below the base of the Isachsen Formation (GSC loc. C-626162); age, undeterminable within the late Oxfordian – Valanginian interval; (2) several fragments of ammonite Nikitinoceras kemperi (Jeletzky) (Fig. 3a, b), bivalve Buchia sp. cf. inflata (Toula) (Fig. 3c) and belemnites Acroteuthis? and Cylindroteuthis? (C-626163) occur 75.5 m below the base of the Isachsen Formation; age, early Valanginian; (3) numerous impressions of Buchia okensis (Pavlow) or B. sp. aff. okensis (sensu Jeletzky Reference Jeletzky1964, Reference Jeletzky and Westernamm1984) occur 77 m below the base of the Isachsen Formation (C-626165; Fig. 3d); age, early Ryazanian (i.e. Berriasian, but probably not earliest Berriasian equivalent); (4) fragments of bivalves 125 m below the base of the Isachsen Formation including Buchia sp. aff. okensis, Mclearnia?, Oxytoma? and Meleagrinella?, with unidentified gastropods and the belemnite Acroteuthis (C-626172); of probable early Ryazanian age; and (5) several fragments of relatively large Borealites (Pseudocraspedites) (Fig. 3e-g) and of Borealites s.l. (Fig. 3h, i) occur 143 m below the Isachsen Formation (C-626176) and are of early Ryazanian age. Poorly preserved, unidentifiable fossil fragments occur in still lower beds and above the carbon isotope anomaly. Mikhail Rogov (pers. comm., 2019) has assisted us with our identification of the specimens we have assigned to Nikitinoceras and Borealites.
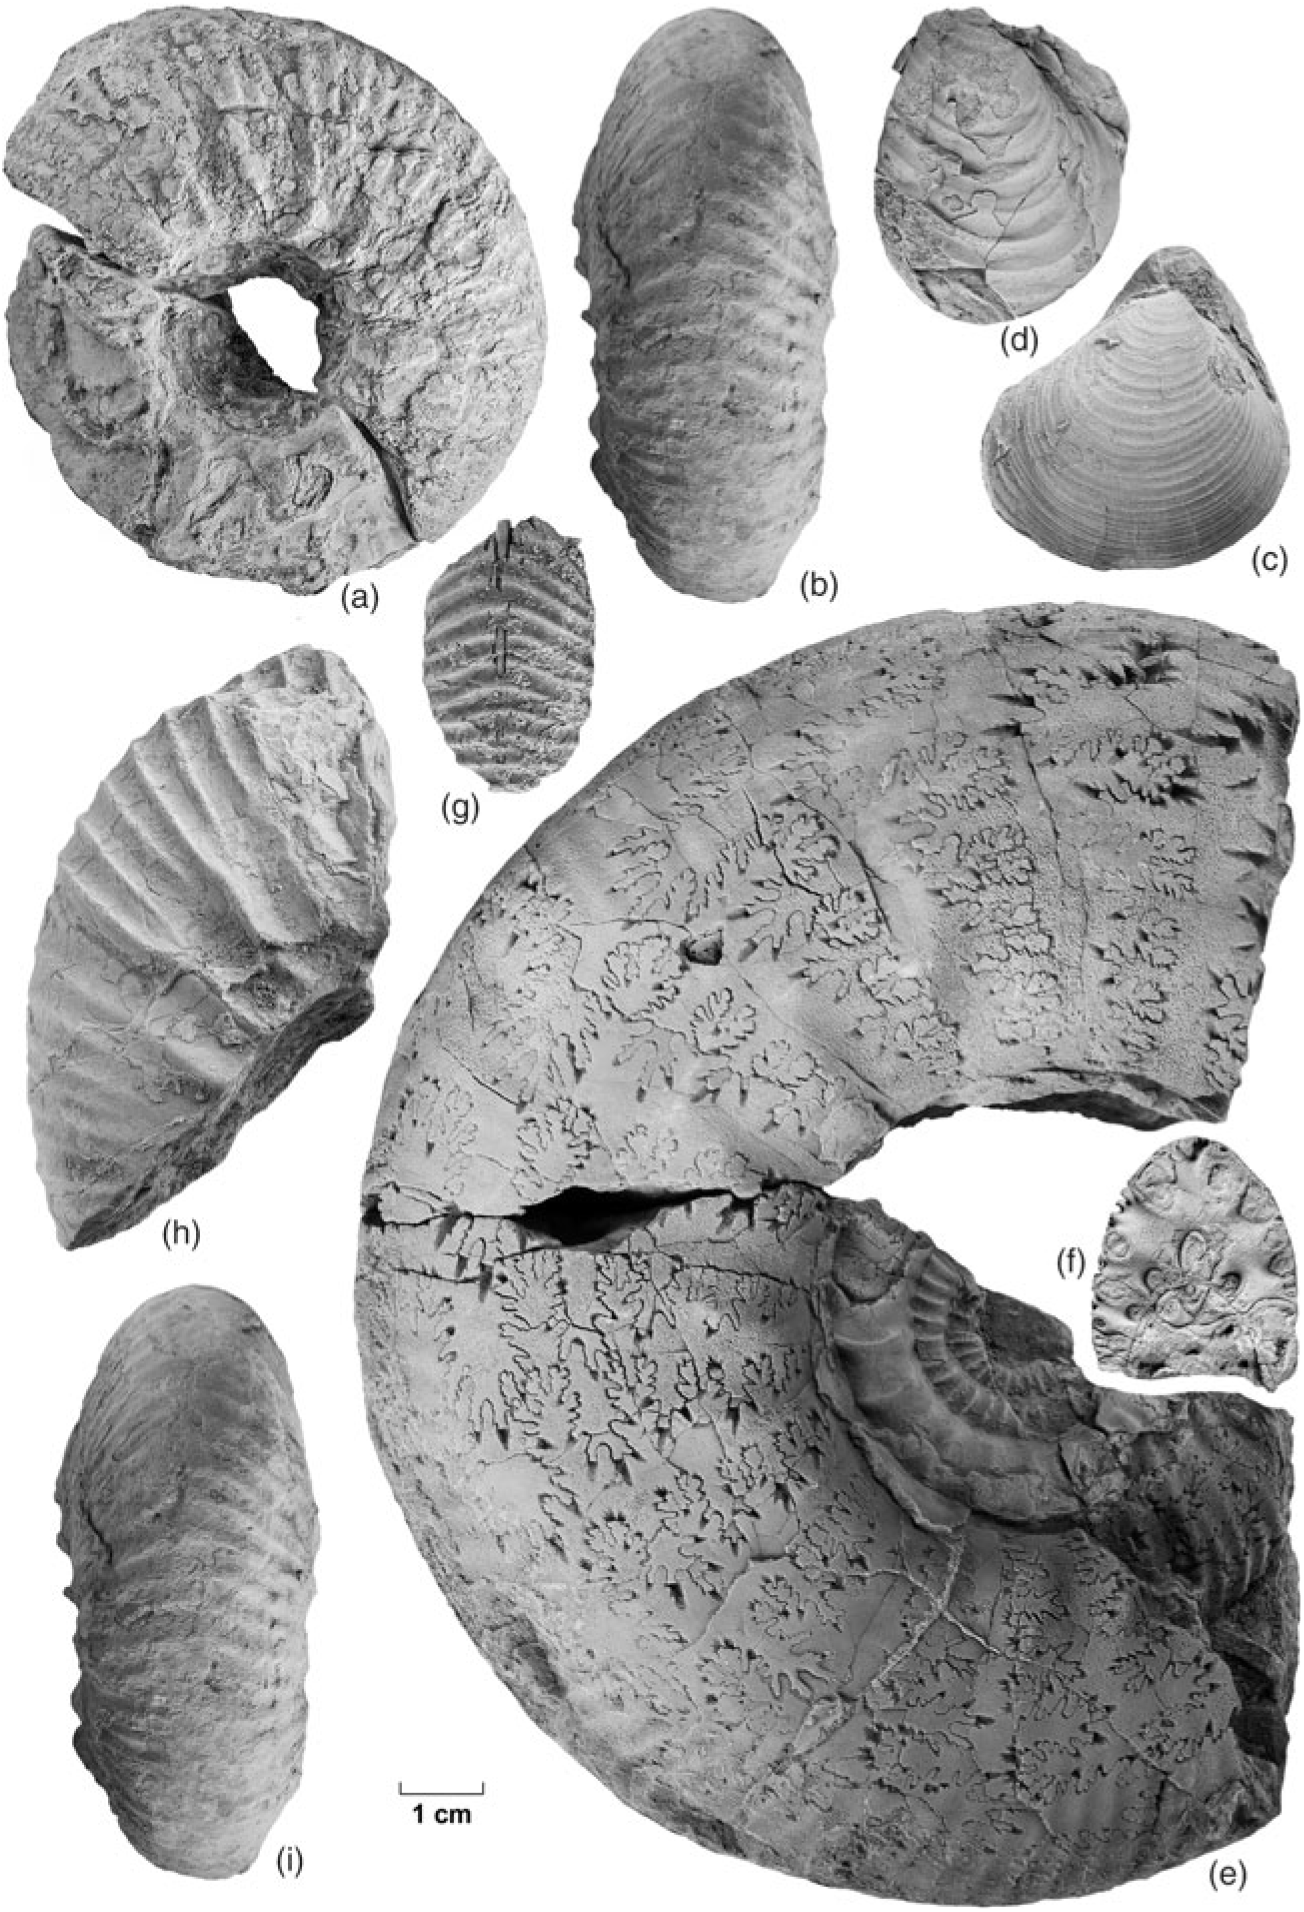
Fig. 3. All fossils are stored in the National Type Invertebrate Collection of the Geological Survey of Canada. The size of all figures can be judged by the 1 cm scale bar, except (f) which is half the scale of the others and of the scale bar. (a, b) Nikitinoceras kemperi (Jeletzky). GSC 140515 (figured specimen number) from GSC locality C-626163 (GSC curation number), lateral and ventral views. (c) Buchia sp. cf. inflata (Toula). GSC 140516 from GSC locality C-626163. (d) Buchia okensis (Pavlow). GSC 140517 from GSC locality C-626165. (e–g) Borealites (Pseudocraspedites) sp. (e, f) GSC 140518 from GSC localityC-626176, macroconch phragmocone fragment, lateral view and cross-section (at adoral preserved end; size reduced ×1/2) views of septate inner cast; and (g) ventral view of part of inner whorl. Another larger phragmocone fragment, with outer shell surface, is septate to a whorl height of at least 7 cm. (h, i) Borealites sp. GSC 140519 from GSC locality C-626176, lateral and ventral views, outer shell surface.
The Borealites specimens are the lowest in our collections and provide a youngest age limit for the lower negative δ13C anomaly at Buchanan Lake. A previous fossil collection from perhaps the same level as our Borealites fauna and in a similarly prolific horizon (GSC loc. 26171, 316 feet = 96.3 m above the base of the Deer Bay Formation according to Souther, Reference Souther1963, p. 438) contains ammonites closely similar to ours. They were initially reported as Valanginian (Frebold, in Souther, Reference Souther1963) but were figured, together with associated Buchia okensis, as lower Berriasian Tollia (Subcraspedites) aff. suprasubditus (Bogoslovsky) by Jeletzky (Reference Jeletzky1964, plate I–III), as Craspedites (Subcraspedites) by Jeletzky (Reference Jeletzky1973, plate 6, from “136.6—140 metres above base” of the formation, which we take to be mistaken) and as Tollia (Subcraspedites) aff. suprasubditus by Jeletzky (Reference Jeletzky and Westernamm1984, p. 223, at the “95 m level”). Jeletzky (Reference Jeletzky1973, Reference Jeletzky and Westernamm1984) also reported similar faunas at higher levels, but acknowledged confusion about their stratigraphic levels and noted re-assignment of the ammonites to Praetollia (Pseudocraspedites) and P. (Praetollia), now included in Borealites (Wright et al. Reference Wright, Callomon, Howarth and Kaesler1996), and thought Craspedites (Taimyroceras?) canadensis Jeletzky to occur below them.
We did not find fossils to control the older age limit for the negative δ13C anomaly in the sections studied. However, Jeletzky (Reference Jeletzky and Westernamm1984, p. 221, GSC loc. 26156) reported generically indeterminate dorsoplanitid ammonites and large Buchia fischeriana (d’Orbigny) from “an 8 m bed commencing 31 m” above the base of the Deer Bay Formation along the Awingak River, that is, near or within our Buchanan Lake section. The collection has not been relocated but, if the fossils are correctly determined, they imply a middle, perhaps early middle, Volgian age for this interval, which would fall at about the maximum depletion point of the δ13C curve. Dorsoplanitid ammonites and various associated Buchia species including B. fischeriana (d’Orbigny) are widespread on nearby Ellesmere Island (Jeletzky, Reference Jeletzky and Westernamm1984; Schneider et al. Reference Schneider, Kelly, Mutterlose, Hulse, Lopez-Mir and Granier2019) and indicate a middle Volgian age for the lower Deer Bay Formation and its initial transgression event throughout eastern Sverdrup Basin. Jeletzky (Reference Jeletzky and Westernamm1984, p. 223) also reported other unidentifiable ammonites and bivalves in lower parts of the Buchanan Lake succession. Two reports of Buchia mosquensis (von Buch) from Amund Ringnes Island (Jeletzky, in Balkwill et al. Reference Balkwill, Wilson and Wall1977, p. 1136) may be early Volgian, rare indicators of this interval in the more axial portion of the basin, or they may be late Kimmeridgian in age.
Stratigraphically close juxtaposition of early Ryazanian and early Valanginian fossils supports the interpretation of a strongly condensed interval or basinal disconformity at the Buchanan Lake locality near the depocentre of the Sverdrup Basin. The apparent absence of diagnostic fossils of late Berriasian age across the Sverdrup Basin has been used previously to suggest a widespread sub-Valanginian disconformity (Jeletzky, Reference Jeletzky1973; Kemper, Reference Kemper1975; Embry, Reference Embry, Spencer, Embry, Gautier, Stoupakova and Sørenson2011).
The Valanginian strata in the northern and eastern parts of Sverdrup Basin, as across the Arctic, are replete with glendonites (Kemper & Schmitz, Reference Kemper and Schmitz1975; Grasby et al. Reference Grasby, McCune, Beauchamp and Galloway2017; Rogov et al. Reference Rogov, Ershova, Shchepetova, Zakharov, Pokrovsky and Khudoley2017), but minor occurrences of ‘stellate nodules’ or ‘carbonate crystal rosettes’ have been reported in upper Oxfordian or lower Kimmeridgian strata to Berriasian strata in the western Sverdrup Basin (Poulton, Reference Poulton, Christie and McMillan1994, p. 183), northern Yukon (Poulton, Reference Poulton and Norris1996, p. 285), and the Northwest Territories (Mountjoy & Procter, Reference Mountjoy and Procter1969). While their appearance in only the upper 104 m of the Buchanan Lake section of the Deer Bay Formation at Buchanan Lake might suggest pre-Valanginian ages for the underlying strata, the interval with glendonites overlap with strata containing Buchia okensis, or B. cf. and aff. okensis, collected in this study and reported by Jeletzky (Reference Jeletzky and Westernamm1984, p. 221, 223). They may indicate an age for the associated glendonites as old as early Ryazanian, although it is possible that they developed within the lower Ryazanian strata exposed on the sea floor during Valanginian time.
4.b. Carbon isotopes
Measured δ13Corg values fall within a range of −30.7 to −24.6‰ (V-PDB) for both sections (n = 92 Geodetic Hills section; n = 154 Buchanan Lake section; see online Supplementary Material available at http://journals.cambridge.org/geo). Two outliers (A124, A21) in the Buchanan Lake dataset were removed. Without further evidence, we disregard these values as outliers due to contamination. A negative δ13Corg excursion, with a magnitude of c. 4‰ and reaching minimum values of −29.8‰ at Buchanan Lake and −30.7‰ at Geodetic Hills, is observed within the lower Deer Bay Formation. All of the recovered macrofossils from the Buchanan Lake section occur stratigraphically above the negative carbon isotope excursion, dating the overlying strata as late Volgian or Ryazanian in age and younger in the Buchanan Lake section. This negative δ13Corg excursion is followed by a return to less negative values of c. −27‰. A small negative shift of c. 1.5‰ occurs in strata that are likely late middle Volgian or early late Volgian in age, and this is followed by an interval of generally increasing values across the interpreted Jurassic–Cretaceous boundary until the upper Valanginian part of the Deer Bay Formation. A positive carbon isotope excursion is evident in its upper part in both sections, with a magnitude of c. 1.5‰ (interpreted here as the Weissert Event; Erba et al. Reference Erba, Bartolini and Larson2004). Carbon-13 isotope ratios reach maximum values of −24.6‰ at Buchanan Lake and −24.9‰ at Geodetic Hills during this event (Fig. 4).

Fig. 4. Buchanan Lake and Geodetic Hills stratigraphy and δ13Corg. The datum for measurement of the Buchanan Lake section was the Isachsen – Deer Bay formational contact; the datum for measurement of the Geodetic Hills section was the Awingak – Deer Bay formation contact. The International Chronostratigraphic Chart (ICS) v 2018/08 (Cohen et al. Reference Cohen, Finney, Gibbard and Fan2013; updated) and Boreal Stage and Sub-stage (after Shurygin & Dzyuba et al. Reference Shurygin and Dzyuba2015) are shown.
4.c. Rock-Eval 6 pyrolysis
TOC measured by Rock-Eval 6 pyrolysis on samples of the Buchanan Lake section (median TOC 1.16 wt%; range 0.09–4.36 wt%; n = 154) and Geodetic Hills section (median TOC 1.48 wt%; range 0.48–5.87 wt%, n = 92) are typical for high-latitude Upper Jurassic and Lower Cretaceous mudrock successions (cf. Hammer et al. Reference Hammer, Nakrem, Little, Hryniewicz, Sandy, Hurum, Druckenmiller, Knutsen and Høyberget2011). The TOC range indicates poor to excellent source rock (see online Supplementary Material available at http://journals.cambridge.org/geo). Thermal alteration of material indicated by T max (the temperature corresponding to maximum S2 during pyrolysis) ranges from 427 to 499°C in samples collected from the Buchanan Lake section and from 436 to 448°C in samples collected from the Geodetic Hills section; the majority of samples from both sections are in the oil window. The S2 values (amount of hydrocarbons generated by thermal cracking of organic matter) and S3 (the amount of CO2 released during thermal breakdown of kerogen) range from 0.15 to 2.42 mg HC/g and 0.27–2.41 mg HC/g at Buchanan Lake, respectively (n = 154). S2 and S3 range from 0.22 to 6.13 mg HC/g TOC and 0.13–1.27 mg HG/g TOC, respectively, at Geodetic Hills (n = 92). The hydrogen index (HI = S2/g TOC) and oxygen index (OI = S3/g TOC) suggest that organic matter is predominantly Type III kerogen at Buchanan Lake and a mixture of Type II and III kerogen in the Geodetic Hills samples (Fig. 5). The Geodetic Hills locality was more distal and in a deeper part of the basin during latest Jurassic – earliest Cretaceous times than the Buchanan Lake locality, and this is reflected in the higher proportion of Type III kerogen at Buchanan Lake. Samples with very low TOC resulted in HI or OI values > 200 (Buchanan Lake A22, A43, A56, A65, A76, A82, A121 and A124) and are not plotted on the Van Krevelen diagram (Fig. 5) or stratigraphically (Fig. 6). Stratigraphic trends in TOC, HI and OI are shown in Figure 6. In both the Buchanan Lake and Geodetic Hills sections, TOC increases near the top of the Deer Bay Formation. Trends in HI and OI are also similar between the two sections, with marginally higher HI values near the base of the Deer Bay Formation.

Fig. 5. Van Krevelen diagram of hydrogen index v. oxygen index from the Buchanan Lake and Geodetic Hills sections.

Fig. 6. Stratigraphic trends in Rock Eval parameters TOC, HI and OI from the Buchanan Lake and Geodetic Hills sections. Events recognized in δ13Corg curves are shown in yellow. The International Chronostratigraphic Chart (ICS) v 2018/08 (Cohen et al. Reference Cohen, Finney, Gibbard and Fan2013; updated) and Boreal Stage and Sub-stage (after Shurygin & Dzyuba et al. Reference Shurygin and Dzyuba2015) are shown.
Spearman’s rank correlation was conducted to evaluate relationships between δ13Corg and organic matter source and maturity. In both sections, δ13Corg is significantly related to TOC (Buchanan Lake δ13Corg:TOC r s = 0.3, P < 0.001, n = 146 with outliers A22, A43, A56, A65, A76, A82, A121 and A124 removed; Geodetic Hills δ13Corg:TOC r s = 0.43, P <0.001, n = 92). In the Buchanan Lake samples, δ13Corg is also significantly (P < 0.001) correlated with S1 (r s = −0.34), S3 (r s = 0.33) and HI (r s = −0.3), but these relationships are insignificant in the Geodetic Hills samples. In both sections the relationships between δ13Corg, T max and S2 are insignificant (P > 0.05). While statistically significant, the relationships between δ13Corg and organic matter parameters (TOC in both sections, S1 and S3 for Buchanan Lake) are weak as shown by the low values of r s, suggesting that the influence of organic matter source, diagenesis and thermal maturation on the δ13Corg values is limited. The high thermal maturity (T max, 427–499°C Buchanan Lake and 436–448°C in Geodetic Hills) of the material could complicate interpretations of the Rock Eval pyrolysis data. Thermal degradation may disguise a change in organic matter source as heating pushes kerogen types to low HI (Hunt, Reference Hunt1996). Degraded, oxidized, residual ‘dry-gas-type’ kerogen (Type IV) falls into the same category as Type III on a van Krevelen-type plot (Tyson, Reference Tyson1995); a change in organic matter source from dominantly terrestrial (Type III) to marine (Type II) may therefore not be recognizable in an HI–OI cross-plot/van Krevelen-type diagram if the organic matter became highly thermally degraded. However, the reproduction of the carbon isotope curve in two stratigraphic sections, and consistency with curves from other Arctic areas, lends confidence to the hypothesis that the signals are not overly influenced by changes in organic matter source.
5. Discussion
The δ13Corg and TOC curves across Upper Jurassic – Lower Cretaceous strata from the Buchanan Lake and Geodetic Hills sections show similar trends, and this permits confidence in extrapolating fossil age control from the Buchanan Lake section to the Geodetic Hills section. A marked negative excursion of up to −4‰, reaching to −30‰ (Fig. 4), occurs in probable middle Volgian strata of the lower Deer Bay Formation. This is followed by a return to less negative values near −27‰, a brief negative excursion of an additional c. 1.0–1.5‰ that may be late Volgian in age, an interval of generally increasing values and then a relatively positive carbon isotope excursion in strata of Valanginian age of the upper part of the Deer Bay Formation.
5.a. VOICE
Trends in δ13Corg from the Buchanan Lake and Geodetic Hills sections of the Deer Bay Formation are consistent with other δ13Corg curves spanning the Jurassic–Cretaceous boundary interval in the High Arctic (Hammer et al. Reference Hammer, Collignon and Nakrem2012; Zakharov et al. Reference Zakharov, Rogov, Dzyuba, Žák, Košt’ák, Pruner, Skupien, Chadima, Mazuch and Nikitenko2014; Koevoets et al. Reference Koevoets, Abay, Hammer and Olaussen2016; Fig. 7). In those records, relatively positive carbon isotope values of c. −28‰ are observed in the Kimmeridgian and lowest Volgian strata and are followed by an up to 4–6‰ more negative excursion in the middle Volgian strata. This event is followed by a return to relatively more positive values during late Volgian and Ryazanian time. Hammer et al. (Reference Hammer, Collignon and Nakrem2012) term the negative excursion they document in lower middle Volgian strata of the Slottsmøya Member (Agardhfjellet Formation) the Volgian Isotopic Carbon Excursion (VOICE). Hammer et al. (Reference Hammer, Collignon and Nakrem2012) correlate the VOICE with a lower middle Volgian broad minimum in the δ13Ccarb record from belemnite rostra of Žák et al. (Reference Žák, Košťák, Man, Zakharov, Rogov, Pruner, Dzyuba, Rohovec and Mazuch2011) that spans the Oxfordian–Ryazanian interval at the Nordvik Peninsula, Siberia. Hammer et al. (Reference Hammer, Collignon and Nakrem2012) also relate the VOICE to a negative excursion in δ13Ccarb from Helmsdale, Scotland in the Sub-boreal lower middle Volgian Rotunda–Fittoni ammonite zone (Nunn & Price, Reference Nunn and Price2010) and a negative δ13Ccarb excursion in DSDP site 534A in the ?Tithonian strata (western central Atlantic; Katz et al. Reference Katz, Wright, Miller, Cramer, Fennel and Falkowski2005). Hammer et al. (Reference Hammer, Collignon and Nakrem2012) conclude that the lower middle Volgian negative excursion seen in their δ13Corg record from Spitsbergen is consistent with carbonate records from elsewhere in the Boreal and High Boreal realms, the central Atlantic and, ‘to a lesser degree’ with the western Tethys. Koevoets et al. (Reference Koevoets, Abay, Hammer and Olaussen2016) also examined the organic carbon isotope record preserved in the Upper Jurassic – Lower Cretaceous Agardhfjellet Formation of central Spitsbergen. A marked negative excursion of c. 4‰ is measured and dated as middle Volgian. Koevoets et al. (Reference Koevoets, Abay, Hammer and Olaussen2016) argue that the VOICE is also recognized in δ13Ccarb curves from the Russian Platform (Price & Rogov, Reference Price and Rogov2009). Zakharov et al. (Reference Zakharov, Rogov, Dzyuba, Žák, Košt’ák, Pruner, Skupien, Chadima, Mazuch and Nikitenko2014) document an irregular but overall decline in δ13Ccarb (as determined in belemnite rostra; Žák et al. Reference Žák, Košťák, Man, Zakharov, Rogov, Pruner, Dzyuba, Rohovec and Mazuch2011) throughout Upper Jurassic strata from the Nordvik section that they relate to a gradual increase in CO2 in the atmosphere–ocean system, and that may have led to warming based on coeval changes in a belemnite oxygen isotope record. They also present a δ13Corg record that shows a negative excursion of c. 3‰ within the Exoticus Zone and extending into the basal part of the [Craspedites] Okensis Zone (late middle Volgian – early late Volgian). Trends observed in the δ13Corg at this locality are not observed in the δ13Ccarb of belemnite rostra from the same section (Žák et al. Reference Žák, Košťák, Man, Zakharov, Rogov, Pruner, Dzyuba, Rohovec and Mazuch2011; Zakharov et al. Reference Zakharov, Rogov, Dzyuba, Žák, Košt’ák, Pruner, Skupien, Chadima, Mazuch and Nikitenko2014). Morgans-Bell et al. (Reference Morgans-Bell, Coe, Hesselbo, Jenkyns, Weedon, Marshall, Tyson and Williams2001) examined the Kimmeridgian–Berriasian interval of the Wessex Basin from Dorset, UK. A prominent middle Tithonian negative excursion of δ13Corg is not apparent in their record, although a short-lived excursion may be related to the VOICE (Turner et al. Reference Turner, Batenburg, Gale and Gradstein2019). Turner et al. (Reference Turner, Batenburg, Gale and Gradstein2019) also interpret a short-lived decline in δ13Corg values in the Pallasioides Zone in Core 6406/12-2 from the Norwegian Sea as the VOICE. The composite δ13Ccarb curve from the base of the Kimmeridgian to the base of the Valanginian sections, based mostly on Tethyan data, shows no major negative carbon isotope events (Fig. 7; Price et al. Reference Price, Főzy and Pálfy2016).
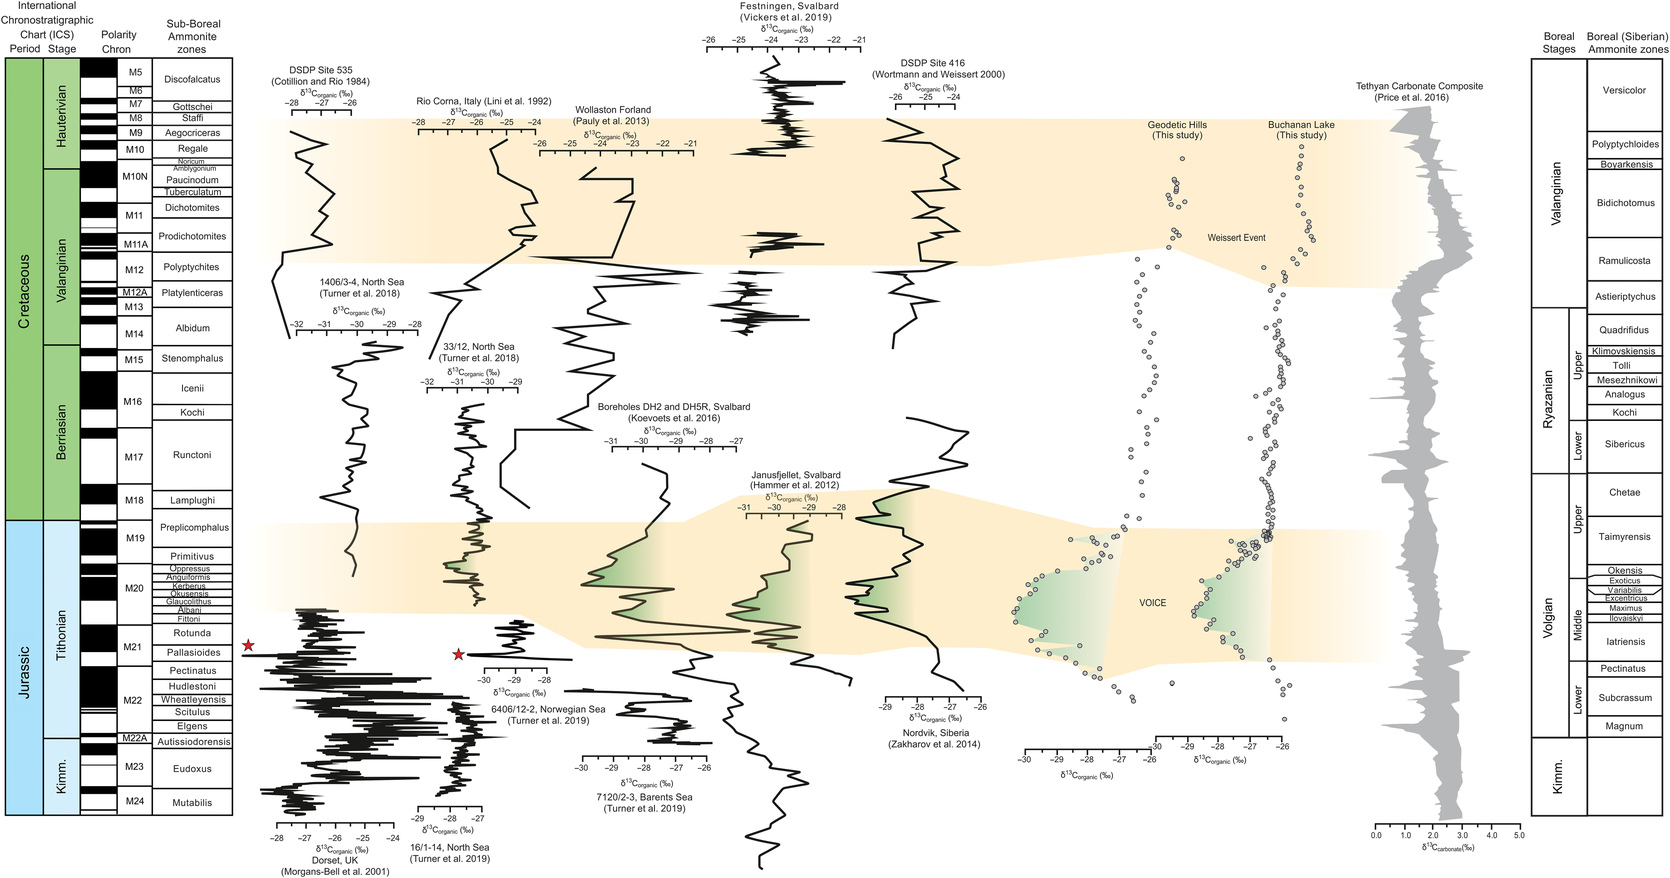
Fig. 7. Summary of published data for Late Jurassic – Early Cretaceous organic carbon isotope data from Atlantic and Tethyan sections, the global stack of Tethyan carbonate records and the new Arctic curves. Sub-boreal ammonite zones from Mutterlose et al. (Reference Mutterlose, Bodin and Fähnrich2014) and Turner et al. (Reference Turner, Batenburg, Gale and Gradstein2019). Boreal (Siberian) ammonite zones after Zakharov et al. (Reference Zakharov, Bogomolov, Il’ina, Konstantinov, Kurushin, Lebedeva, Meledina, Nikitenko, Sobolev and Shurygin1997), Baraboshkin (Reference Baraboshkin2004) and Shurygin & Dzyuba (Reference Shurygin and Dzyuba2015). The International Chronostratigraphic Chart (ICS) v. 2018/08 (Cohen et al. Reference Cohen, Finney, Gibbard and Fan2013; updated) and Boreal Stage and Sub-stage (after Shurygin & Dzyuba et al. Reference Shurygin and Dzyuba2015) are shown. Red stars indicate levels interpreted as VOICE by Turner et al. (Reference Turner, Batenburg, Gale and Gradstein2019).
Decoupling of high-latitude δ13Corg records and Tethyan records, the latter based mostly on carbonates, suggests either that pools of organic carbon and dissolved inorganic carbon were effectively decoupled during this time, or that there was latitudinal decoupling between the Arctic and Tethyan seas. Typically, covariant marine δ13Ccarb and δ13Corg are seen and interpreted as evidence that both carbonate and organic matter were originally produced in the surface waters of the ocean and retained their original δ13C composition (e.g. Kump & Arthur, Reference Kump and Arthur1999; Meyer et al. Reference Meyer, Yu, Lehrmann, van de Schootbrugge and Payne2013). Coupled terrestrial organic (e.g. derived from fossil wood or charcoal) and carbonate records suggest strong coupling of the ocean–atmosphere system (e.g. Gröcke et al. Reference Gröcke, Price, Robinson, Baraboshkin, Mutterlose and Ruffell2005; Vickers et al. Reference Vickers, Price, Jerrett and Watkinson2016), whereas decoupled δ13Ccarb and δ13Corg records have been interpreted as evidence for diagenetic alteration (Meyer et al. Reference Meyer, Yu, Lehrmann, van de Schootbrugge and Payne2013; Han et al. Reference Han, Hu, Kemp and Li2018). In these latter examples, a large negative excursion in δ13Ccarb is typically not accompanied by a large response in the δ13Corg record (e.g. Fike et al. Reference Fike, Grotzinger, Pratt and Summons2006). Alternatively, Bodin et al. (Reference Bodin, Krencker, Kothe, Hoffmann, Mattioli, Heimhofer and Kabiri2016) have recently suggested lithological control on decoupling between δ13Ccarb and δ13Corg records during Early Jurassic time, whereby δ13Ccarb signatures were affected by regional variation in carbonate composition. As the Arctic middle Volgian negative event is observed in organic carbon records from Canada (this study), Spitsbergen and Siberia (Fig. 7), it is unlikely that diagenesis or regional differences in the composition of bulk organic carbon are significant factors in explaining its absence from lower-latitude areas. Instead, the absence of the negative excursion from lower-latitude carbonate records may be explained by decoupling of high-northern-latitude regions from the global carbon pool.
The organic carbon isotope record is influenced by a number of environmental factors (Kump & Arthur, Reference Kump and Arthur1999) and, as such, can be difficult to interpret (Jenkyns et al. Reference Jenkyns, Jones, Gröcke, Hesselbo and Parkinson2002). Organic carbon isotope composition is strongly controlled by the type of organic matter (marine v. terrestrial) and, therefore, by both local and regional variables such as sea level, productivity and climate. Burial rate of organic matter enriched in 12C is also important, as more heavy carbon would remain in the global carbon pool. This process leads to a positive isotopic shift in both carbonates and organic matter. A decline in the δ13C value involves a relative increase in 12C in the oceanic carbon reservoir (Price & Gröcke, Reference Price and Gröcke2002). This could occur through a combination of mechanisms, including decreased carbon burial rate as a result of decreased preservation (e.g. deep basin ventilation), decreased sea-surface productivity (Weissert & Channell, Reference Weissert and Channell1989; Weissert & Erba, Reference Weissert and Erba2004), increased flux of 12C into surface waters by upwelling of 12C-rich bottom waters (Küspert, Reference Küspert, Einsele and Seilacher1982) or intensified weathering and riverine input of dissolved inorganic carbon (Weissert & Mohr, Reference Weissert and Mohr1996). A geological rapid release of 12C into the atmosphere associated with volcanism, methane release from dissociation of gas hydrates or combustion of organic matter associated with emplacement of large igneous bodies are other mechanisms that can cause a negative excursion in δ13C (Dickens et al. Reference Dickens, O’Neil, Rea and Owen1995; Hesselbo et al. Reference Hesselbo, Gröcke, Jenkyns, Bjerrum, Farrimond, Morgans Bell and Green2000; Padden et al. Reference Padden, Weissert and de Rafelis2001; Schröder-Adams et al. Reference Schröder-Adams, Herrle, Selby, Quesnel and Froude2019).
A geologically sudden increase in volcanism could potentially explain the large negative δ13Corg values seen in the middle Volgian Arctic records and an absence from δ13Ccarb records (Price et al. Reference Price, Főzy and Pálfy2016). As modelled by Kump & Arthur (Reference Kump and Arthur1999), an increase in volcanism sufficient to perturb atmospheric pCO2levels could drive down the carbon isotopic value in the ocean–atmosphere system. However, any trend in δ13Ccarb could be relatively quickly countered as burial of anomalously depleted organic matter may overcompensate for additional input of depleted volcanic CO2 (Kump & Arthur, Reference Kump and Arthur1999). Notwithstanding this, the Shatsky Rise, a vast shield volcano with a surface area of c. 480 000 km2, formed in the NW Pacific Ocean at about the Jurassic–Cretaceous boundary (Sager et al. Reference Sager, Zhang, Korenaga, Sano, Koppers, Widdowson and Mahoney2013). Recent 40Ar/39Ar age determinations of basaltic lava samples from Tamu Massif, the oldest and largest edifice of the submarine Shatsky Rise, provide an age of c. 144 Ma (Geldmacher et al. Reference Geldmacher, van den Borgaard, Heydolph and Hoernle2014), similar to the widely used c. 145 Ma 40Ar/39Ar minimum age for the Jurassic–Cretaceous boundary proposed by Mahoney et al. (Reference Mahoney, Duncan, Tejada, Sager and Bralower2005). However, new U–Pb ages from Argentina and Mexico suggest that the numerical age of the Jurassic–Cretaceous boundary may lie between 140.7 and 140.9 Ma; this evidence would place an age of c. 145 Ma (the current ICS age for the base of the Berriasian stage) into the middle of the Tithonian age (Lena et al. Reference Lena, López-Martínez, Lescano, Aguire-Urreta, Concheyro, Vennari, Naipauer, Samankassou, Pimentel, Ramos and Schaltegger2019), whether the base of the Tithonian is 152.1 Ma (Cohen et al. Reference Cohen, Finney, Gibbard and Fan2013; updated 2018/08) or 148 Ma (Lena et al. Reference Lena, López-Martínez, Lescano, Aguire-Urreta, Concheyro, Vennari, Naipauer, Samankassou, Pimentel, Ramos and Schaltegger2019) or somewhere between. Sub-aerial volcanism and summit weathering and/or erosion of the emergent phase of the Shatsky Rise is thought to have occurred as early as during the Valanginian age (Yasuhara et al. Reference Yasuhara, Ando and Iba2017), suggesting possible further complications in the interpretation of significance of the age of the sills associated with the Shatsky Rise. The ages of the base of the Tithonian and Berriasian stages are yet to be confirmed (e.g. Ogg & Hinnov, Reference Ogg, Hinnov, Gradstein, Ogg, Schmitz and Ogg2012; Aguirre-Urreta et al. Reference Aguirre-Urreta, Lescano, Schmitz, Tunik, Concheyro, Rawson and Ramos2015).
Hydrocarbon seeps are widely distributed in Upper Jurassic and Jurassic–Cretaceous boundary beds in Spitsbergen. Seeps characterized by authigenic carbonates in the uppermost Jurassic Slottsmøya Member of the Agardhfjellet Formation in the Sassenfjorden area of central Spitsbergen (Hammer et al. Reference Hammer, Nakrem, Little, Hryniewicz, Sandy, Hurum, Druckenmiller, Knutsen and Høyberget2011) may be related to the release of gas hydrates (Kiel, Reference Kiel2009), early thermal steepening of the geothermal gradient and/or tectonic activity associated with the initial phases of High Arctic Large Igneous Province (HALIP) activity (Maher, Reference Maher2001; Hammer et al. Reference Hammer, Nakrem, Little, Hryniewicz, Sandy, Hurum, Druckenmiller, Knutsen and Høyberget2011). HALIP, a major magmatic event, may therefore be relevant to the VOICE carbon isotope record, although the currently known ages of the HALIP intrusives are younger than those of the VOICE, ranging from 95–91 Ma to c. 127 Ma (Omma et al. Reference Omma, Pease, Scott, Spencer, Embry, Gautier, Stoupakova and Sørensen2011; Evenchick et al. Reference Evenchick, Davis, Bédard, Hayward and Friedman2015; Dockman et al. Reference Dockman, Pearson, Heaman, Gibson and Sarkar2018; Kingsbury et al. Reference Kingsbury, Kamo, Ernst, Söderlund and Cousens2018; Fig. 2). Seep carbonates are also found in the Janusfjellet section of Spitsbergen; these are of late Volgian – earliest Valanginian age (Wierzbowski et al. 2011), and are therefore younger than the carbon isotope excursion documented in Sverdrup Basin.
Eustatic sea-level fall was invoked by Nunn & Price (Reference Nunn and Price2010) to explain a general trend towards more negative δ13Ccarb values in their belemnite record from Helmsdale, Scotland, in the Tithonian Stage. A sea-level fall could result in enhanced release of 12C from weathering, erosion and oxidation of organic-rich sub-aerially exposed rock (Voigt & Hilbrecht, Reference Voigt and Hilbrecht1997; Price & Gröcke, Reference Price and Gröcke2002) as well as compositional deviation away from open-marine δ13C values in relatively isolated epeiric seas (e.g. Holmden et al. Reference Holmden, Creaser, Muehlenbachs, Leslie and Bergström1998; Immenhauser et al. Reference Immenhauser, della Porta, Kenter and Bahamonde2003). ‘Local’ depletion in 13C is caused by isotopically light CO2 input from respiration of marine organisms, as well as oxidation of terrestrial organic matter and input of isotopically light riverine dissolved inorganic carbon (Patterson & Walter, Reference Patterson and Walter1994; Holmden et al. Reference Holmden, Creaser, Muehlenbachs, Leslie and Bergström1998). Progressive oxidation of organic matter to CO2 (‘sea water aging’, Holmden et al. Reference Holmden, Creaser, Muehlenbachs, Leslie and Bergström1998), which then forms dominantly bicarbonate in sea water, is greatest during a long residence time of water masses in shallow, poorly circulated settings (Patterson & Walter, Reference Patterson and Walter1994). The uptake of this bicarbonate in carbonates or marine organic matter in isotopic equilibrium with dissolved inorganic carbon results in carbonate or organic materials with depleted δ13C values.
The Deer Bay Formation is the result of regional marine transgression that was preceded by a sea-level lowstand in Sverdrup Basin (Embry & Beauchamp, Reference Embry, Beauchamp and Miall2019), with restricted marine connections and a large number of restricted environments (e.g. Ziegler, Reference Ziegler1988; Hardenbol et al. Reference Hardenbol, Thierry, Farley, Jacquin, de Graciansky, Vail, de Graciansky, Hardenbol, Jacquin and Vail1998). The Deer Bay rift climax of the Sverdrup Basin occurred during this time and basin subsidence was associated with contemporaneous rift margin uplift (Hadlari et al. Reference Hadlari, Midwinter, Galloway and Durbano2016). Due to low global sea-level during the Tithonian Age, the only direct connection between the North Atlantic and the Sverdrup Basin was the narrow and shallow Norwegian–Greenland Seaway, which was more than 1500 km long and only 200–300 km wide (Ziegler, Reference Ziegler1988; Dore, Reference Dore1991). Connections between the western Sverdrup Basin and Panthalassa were similarly constricted prior to rift-opening of the Canada Basin in the Hauterivian Age (e.g. Embry & Beauchamp, Reference Embry, Beauchamp and Miall2019). The Sverdrup Basin and other high-latitude Boreal basins (e.g. Dypvik & Zakharov, Reference Dypvik and Zakharov2012) could have experienced compositional evolution away from global marine δ13C values during middle Volgian time, but effectively became re-coupled by Valanginian time due to global sea-level rise. The hypothesis of restriction of Sverdrup Basin water masses during Volgian time, followed by more open circulation during Valanginian time, is consistent with global sea-level fluctuations (Haq et al. Reference Haq2017), and may be supported by the greater number of known ammonite occurrences in the Valanginian part of the Deer Bay Formation, and the greater similarity of faunas between the Arctic and Europe at this time relative to the Late Jurassic. Embry (Reference Embry and Trettin1991, p. 408, 414) noted three transgressive–regressive cycles during the Kimmeridgian – late Berriasian interval in the Sverdrup Basin, a gradual decline in sediment supply and a shift of the basin axis to the west, with sandstones occupying the basin margins. Sea-level rise during Early Cretaceous time would have increased ventilation of the incipient Arctic Ocean and thus coupled the carbon dynamics of the Sverdrup Basin to the open-marine system. This interpretation would imply a similar oceanographic restriction to explain the middle Volgian negative δ13C events in Svalbard and Siberia. It might also partly explain and support the ongoing difficulties with correlating Tethyan and Boreal marine faunas, especially if exacerbated by concurrent climate-influenced biogeographic differentiation.
5.b. Weissert Event
A particularly prominent feature of Early Cretaceous global carbon isotope records is the Valanginian (Weissert) δ13C positive excursion (Lini et al. Reference Lini, Weissert and Erba1992; Price et al. Reference Price, Főzy and Pálfy2016). This isotope event is widely documented in marine carbonates, fossil shell material, terrestrial plants and marine organic matter (e.g. Lini et al. Reference Lini, Weissert and Erba1992; Gröcke et al. Reference Gröcke, Price, Robinson, Baraboshkin, Mutterlose and Ruffell2005; Aguirre-Urreta et al. Reference Aguirre-Urreta, Price, Ruffell, Lazo, Kalin, Ogle and Rawson2008; Price et al. Reference Price, Főzy and Pálfy2016). Marine organic matter (Lini et al. Reference Lini, Weissert and Erba1992; Wortmann & Weissert, Reference Wortmann and Weissert2000) typically shows a c. 2‰ excursion. Despite the noisy pattern seen in these published records, which possibly relate to changes in the composition of the bulk organic carbon, the shape of the δ13C curve is characterized by a rapid rise from the pre-excursion background, a plateau and a less steep decline to a new steady state that is slightly more positive than prior to the event. Only in the record from Greenland is the Valanginian (Weissert) δ13C positive excursion less clear, possibly due to condensation of the strata and related sample density, or a hiatus in the sedimentary record (Pauly et al. Reference Pauly, Mutterlose and Alsen2013). Given the overall pattern and magnitude of the excursions in the marine records, the positive carbon isotope excursion of up to 1.5‰ in the upper part of the Deer Bay Formation is interpreted to represent the Valanginian (Weissert) event in Arctic Canada.
6. Conclusions
Carbon isotope stratigraphy from two sections in the Canadian High Arctic that span the Jurassic–Cretaceous boundary documents a marked middle Volgian negative excursion with a magnitude of c. 4‰ followed by a return to less negative values. A positive excursion is evident with a magnitude of c. 1.5‰ in the Valanginian Stage. The Volgian isotopic trends are consistent with other high-latitude records but are decoupled from Tethyan δ13Ccarb records. The globally recognized isotopically positive Weissert Event in the Valanginian Stage is also recognized in the Canadian Arctic sections. The Sverdrup Basin and other Arctic basins may have experienced compositional evolution away from open-marine δ13C values during the middle Volgian Age in relatively isolated basins due to low global sea levels, and became effectively re-coupled by Valanginian time when global sea level rose. As well as providing another correlation tool in a time interval with challenging inter-provincial biostratigraphic correlations, C isotope excursions such as those presented here offer further insight into the causes of major global ocean–atmosphere perturbations beyond the conventional volcanic interpretation.
Acknowledgements
Financial support for field work and analyses was provided by the GeoMapping for Energy and Minerals (GEM) Program (Natural Resources Canada, Geological Survey of Canada). Collections and research on those collections were made under the Government of Nunavut Archaeology and Palaeontology Research Permit 2015-03P. Data analyses and production of this research paper were conducted at the Geological Survey of Canada and at the Aarhus Institute of Advanced Studies at Aarhus University. JMG received funding from the AIAS-COFUND II fellowship programme that is supported by the Marie Skłodowska-Curie actions under the European Union’s Horizon 2020 (grant agreement no. 754513) and the Aarhus University Research Foundation. We are grateful to Dr Keith Dewing for project management and Dr Lisa Neville (Calgary, AB) and Pilipoosie Iqaluk (Hamlet of Resolute Bay, NU) for assistance with sample collection and field logistics. We acknowledge the logistics support provided by the Polar Continental Shelf Program (NRCan) and UHL Helicopters (Pilot Lorne Pike). We are grateful for the staff of the Environment and Climate Change Canada Eureka Weather Station and, in particular, Station Manager André Beauchard. Dr Mikhail Rogov particularly, as well as Drs Aleksandr Igolnikov and Victor Zakharov, offered important advice concerning the current taxonomic assignments and ages of the ammonites and a Buchia specimen. Glen Edwards produced the photographs and the fossil plate. This publication represents NRCan Contribution Number/Numéro de contribution de RNCan 20190001. We are grateful for the comments of Dr Manuel Bringué (Geological Survey of Canada) for his internal review and to Dr Øyvind Hammer and Dr Mikhail Rogov for detailed external reviews that greatly improved this contribution. We also thank the Editor Dr Bas Van de Schootbrugge for comments and suggestions.
Supplementary material
To view supplementary material for this article, please visit https://doi.org/10.1017/S0016756819001316.


