1. Introduction
The Urumieh–Dokhtar Magmatic Arc (UDMA), as a part of the Alpine–Himalayan orogenic belt, strikes NW–SE and lies parallel to the main Zagros Folded Thrust Belt in Iran (Fig. 1a). This magmatic arc, developed during subduction of the Neo-Tethys oceanic crust beneath the Iranian plate (Ricou et al. Reference Ricou, Braud and Brunn1977; Dercourt et al. Reference Dercourt, Zonenshain, Ricou, Kazmin, Le Pichon, Knipper, Grandjacquet, Sbortshikov, Geyssant, Lepvrier and Pechersky1986; Alavi, Reference Alavi1994, Reference Alavi2004; Agard et al. Reference Agard, Omrani, Jolivet, Whitechurc, Vrielynck, Spakman, Monié, Meyer and Wortel2011), has been active from Late Jurassic time up to the present (Berberian & King, Reference Berberian and King1981; Berberian et al. Reference Berberian, Muir, Pankhurst and Berberian1982). It comprises distinct linear, voluminous magmatic complexes along the formerly active margin of the Iranian plate (Stöcklin, Reference Stöcklin1968; Berberian et al. Reference Berberian, Muir, Pankhurst and Berberian1982; Alavi, Reference Alavi2007; Rezaei-Kahkhaei et al. Reference Rezaei-Kahkhaei, Galindo, Pankhurst and Esmaeily2011; Shafaii Moghadam & Stern, Reference Shafaii Moghadam and Stern2011). The UDMA contains a large number of batholiths, discrete plutons and sub-volcanic rocks of calc-alkaline affinity, similar to those of Andean-type magmatism (Förster et al. Reference Förster, Fesefeldt and Kürsten1972; Berberian et al. Reference Berberian, Muir, Pankhurst and Berberian1982; Alavi, Reference Alavi2004). Although the relationship to subduction is clear (e.g. Berberian & King, Reference Berberian and King1981; Agard et al. Reference Agard, Omrani, Jolivet and Mouthereau2005), the tectono-magmatic processes of magma emplacement in the UDMA have not been investigated to date. In general, understanding granite emplacement and deformation is challenging, because not all granitic rocks develop mesoscopic-scale deformation fabrics (Yakeu Sandjo et al. Reference Yakeu Sandjo, Njanko, Njonfang, Errami, Rochette and Fozing2016). Of importance is the ‘space problem’, which may be resolved in situations where motion on faults and shear zones creates space for magma emplacement (see reviews by Hutton, Reference Hutton1988; De Saint-Blanquat et al. Reference De Saint-Blanquat, Law, Bouchez and Morgan2001). In the instance of the Tafresh granitoids, similar to the well-studied Papoose Flat pluton (De Saint-Blanquat et al. Reference De Saint-Blanquat, Habert, Horsman, Morgan, Tikoff, Launeau and Gleizes2006), there is no evidence for this kind of structural control. In the latter case, the anisotropy of magnetic susceptibility (AMS) technique offers a suitable means to clarify the space problem. Indeed, numerous AMS studies of mafic and felsic rocks, both intrusive and extrusive, have demonstrated that this technique efficiently describes flow, strain fabrics and emplacement mechanisms (e.g. Tarling & Hrouda, Reference Tarling and Hrouda1993; Bouchez, Reference Bouchez2000), and it is especially effective for igneous rocks whose foliation and lineation are difficult to observe and measure (e.g. the Tafresh granitoids), where no clear signs of deformation are present at the mesoscopic and field scales (Ellwood et al. Reference Ellwood, Whitney, Wenner, Mose and Amerigian1980; Guillet et al. Reference Guillet, Bouchez and Wagner1983; Bouchez et al. Reference Bouchez, Gleizes, Djouadi and Rochette1990; Tarling & Hrouda, Reference Tarling and Hrouda1993; Cruden & Launeau, Reference Cruden and Launeau1994; Aranguren, Reference Aranguren1997; Bouchez, Reference Bouchez, Bouchez, Hutton and Stephens1997; Cruden et al. Reference Cruden, Tobisch and Launeau1999; Yakeu Sandjo et al. Reference Yakeu Sandjo, Njanko, Njonfang, Errami, Rochette and Fozing2016). Through magnetic techniques, precise and reproducible measurements of foliation and lineation can be applied to any outcrop in a pluton (Bouchez, Reference Bouchez, Bouchez, Hutton and Stephens1997), from which magmatic flow directions can be reconstructed via the orientation of the magnetic ellipsoids (e.g. Ellwood, Reference Ellwood1978; Cañón-Tapia et al. Reference Cañón-Tapia, Walker and Herrero-Bervera1996, Reference Cañón-Tapia, Walker and Herrero-Bervera1997; Dragoni et al. Reference Dragoni, Lanza and Tallarico1997; Rochette et al. Reference Rochette, Aubourg and Perrin1999).
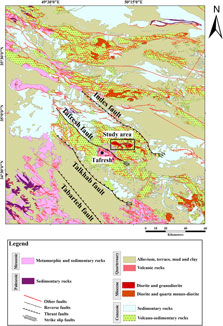
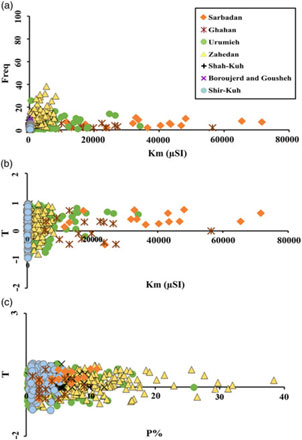
Fig. 1. (a) Simplified geological map of Iran (Aghanabati, Reference Aghanabati2004) and (b) geological map of the Tafresh area (modified after Hajian, Reference Hajian1977). The star shows the position of the plutons in Iran on which AMS was carried out. 1 – Urumieh (Ghalamghash et al. Reference Ghalamghash, Nédélec, Bellon, Vousoughi Abedini and Bouchez2009); 2 – Tafresh (this study); 3 – Boroujerd and Gousheh (Rasouli et al. Reference Rasouli, Ahadnejad and Esmaeily2012); 4 – Shir-Kuh (Sheibi et al. Reference Sheibi, Bouchez, Esmaeily and Siqueira2012); 5 – Shah-Kuh (Esmaeily et al. Reference Esmaeily, Bouchez and Siqueira2007); 6 – Zahedan (Sadeghian et al. Reference Sadeghian, Bouchez, Nédélec, Siqueira and Valizadeh2005).
In Iran, magnetic fabric studies by AMS have been in progress for more than 15 years. The first study focused on the emplacement mechanisms of the Zahedan pluton (Sadeghian et al. Reference Sadeghian, Bouchez, Nédélec, Siqueira and Valizadeh2005), followed by studies of other plutons by other researchers (Shah-Kuh pluton, Esmaeily et al. Reference Esmaeily, Bouchez and Siqueira2007; Urumieh pluton, Ghalamghash et al. Reference Ghalamghash, Nédélec, Bellon, Vousoughi Abedini and Bouchez2009; Shir-Kuh pluton, Sheibi et al. Reference Sheibi, Bouchez, Esmaeily and Siqueira2012; Boroujerd pluton, Rasouli et al. Reference Rasouli, Ahadnejad and Esmaeily2012; Gol-e-Zard pluton, Sadeghian et al. Reference Sadeghian, Sheibi and Badallo2014; Challu pluton, Sheibi & Majidi, Reference Sheibi and Majidi2015; Panj-Kuh pluton, Sheibi & Pooralizadeh Moghadam, Reference Sheibi and Pooralizadeh Moghadam2015). Most of these studies are in the Sanandaj–Sirjan Zone (SSZ), central Iran and SE Iran (Fig. 1). This paper is the first application of AMS in the UDMA. We combine AMS with structural, petrographic and geochemical observations as a basis to relate the emplacement of the Tafresh granitoids (Sarbadan and Ghahan stocks) to developing tectonic stress/strain fields in Late Miocene time. AMS is used because fabric measurements in granites are rather difficult to obtain directly in the field (Bouchez, Reference Bouchez, Bouchez, Hutton and Stephens1997). This enables us to constrain the kinematics of magmatism in the UDMA.
2. Regional geology
The Tafresh area (35.00°–34.30° N, 50.00°–50.30° E) within the central UDMA, located ∼180 km southwest of Tehran, occupies an area of ∼150 km2. It contains plutonic, volcano-sedimentary and sub-volcanic units (Fig. 1b). The Sarbadan and Ghahan stocks were intruded into an Eocene volcano-sedimentary series. In map view, these shallow-level intrusions exhibit stretching in an E–W direction (Fig. 1b). The Sarbadan and Ghahan stocks are of Late Miocene age (respectively, 19.07 ± 0.25 Ma and 20.37 ± 0.41 Ma), based on U–Pb zircon data (McFarlane, pers. comm.). Based on field evidence (Fig. 2) and petrographic observations (Fig. 4), the stocks consist of granodiorite (Sarbadan) and diorite–quartz diorite (Ghahan). Outcrops of the Sarbadan stock are blocky to massive, covering an area of 20 km2 extending in an E–W direction from northeast of Tafresh city to Ghahan village. This stock is in contact with younger pyroclastic units and a thick Eocene sequence of volcanic rocks (andesitic basalt, andesite, dacite). In these light grey host rocks, minerals visible in hand specimen are mainly hornblende, feldspar and quartz (Fig. 2a). Outcrop of the shallow-level Ghahan stock is in the form of a dome whose areal extent of ∼18 km2 displays a marked W–E elongation. Grey to light grey Ghahan rocks are characterized by porphyritic to sub-granular textures in which hornblende and feldspar are prominent (Fig. 2b). These are enclosed by Eocene pyroclastic rocks, which include tuffs and dacitic to andesitic lavas. Microdioritic enclaves, occurring mainly in the coalescence zone between the Ghahan and Sarbadan stocks, vary from 5 to 10 cm and exhibit circular to ellipsoidal shapes (Fig. 2c). Regionally, the study area was affected by reverse and dextral faulting associated with thrusting of the Eocene volcano-sedimentary series over the Oligocene Qom Formation and Pliocene conglomerates (Hajian, Reference Hajian1977). Most faults are parallel to the regional tectonic fabric of the UDMA (e.g. the Tafresh, Indes, Tabarteh and Talkhab faults). The dominant trends are NW–SE, although subordinate fault and fracture systems with E–W and SW–NE trends are also common (Fig. 3). The mean strike of a Tafresh fault varies from N130 to N150W, with an average dip of 50° to the southwest. To the north and parallel to the Tafresh fault, the Indes fault of 120 km length has a similar geometry with a ∼75° dip to the southwest. To the south, and parallel to the Tafresh and Indes faults, the Talkhab fault dips ∼75° to the northeast (Morley et al. Reference Morley, Kongwung, Julapour, Abdolghafourian, Hajian, Waples, Warren, Otterdoom, Srisuriyon and Kazemi2009). The Talkhab and Indes faults have both thrust and strike-slip movements (Rajabioun, Reference Rajabioun2000).
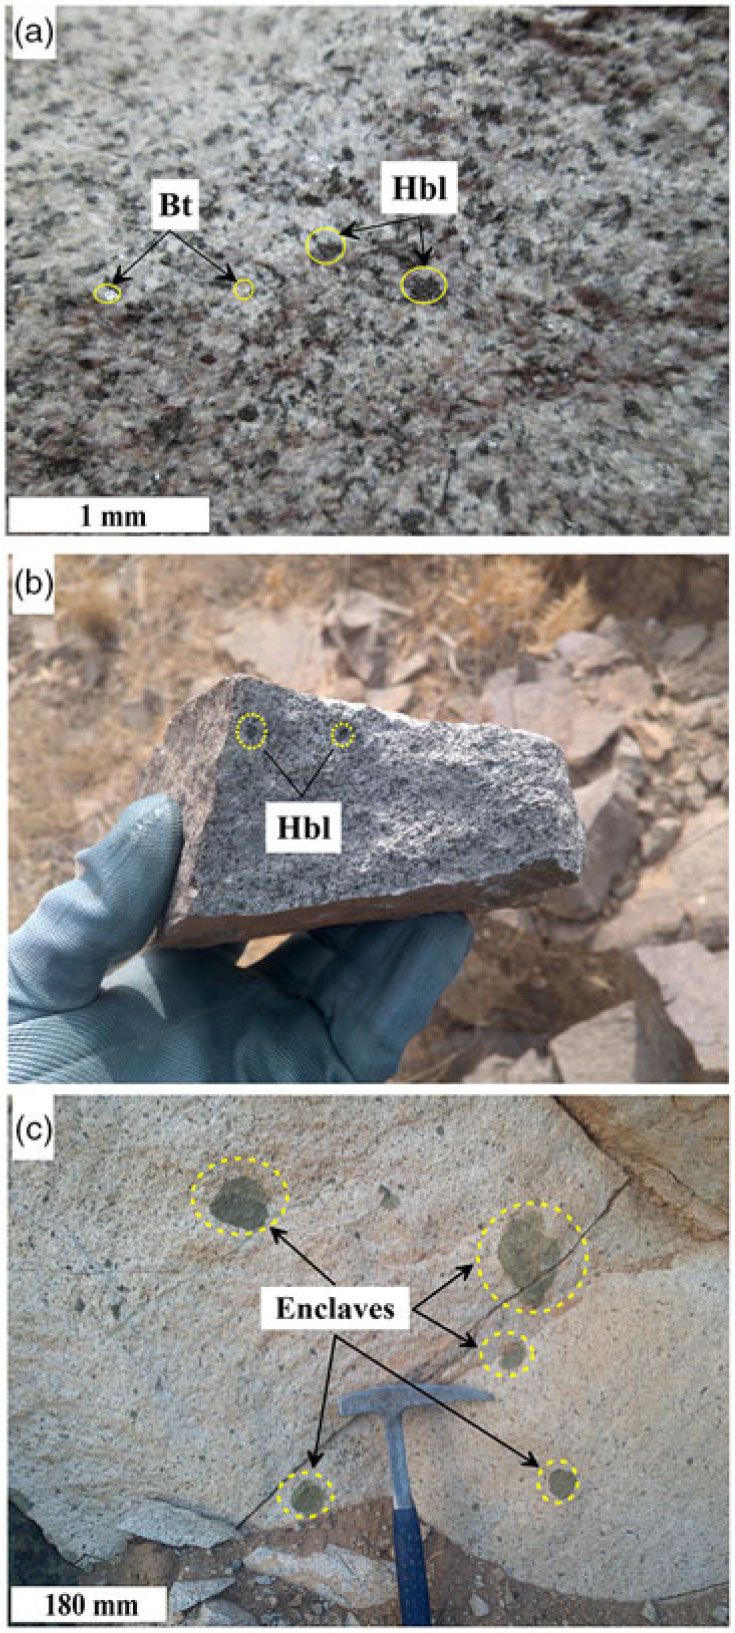
Fig. 2. Field relationships in the Tafresh granitoids. (a) Granodiorite with granular texture, Sarbadan stock. Hornblende (Hbl) and biotite (Bt) crystals are set in a matrix mainly composed of feldspar crystals. (b) Hand specimen of diorite, Ghahan. Hornblende (Hbl) in a matrix mainly composed of plagioclase crystals. (c) Fine-grained microdiorite enclaves in the diorite rock. Mineral abbreviations after Whitney & Evans (Reference Whitney and Evans2010).
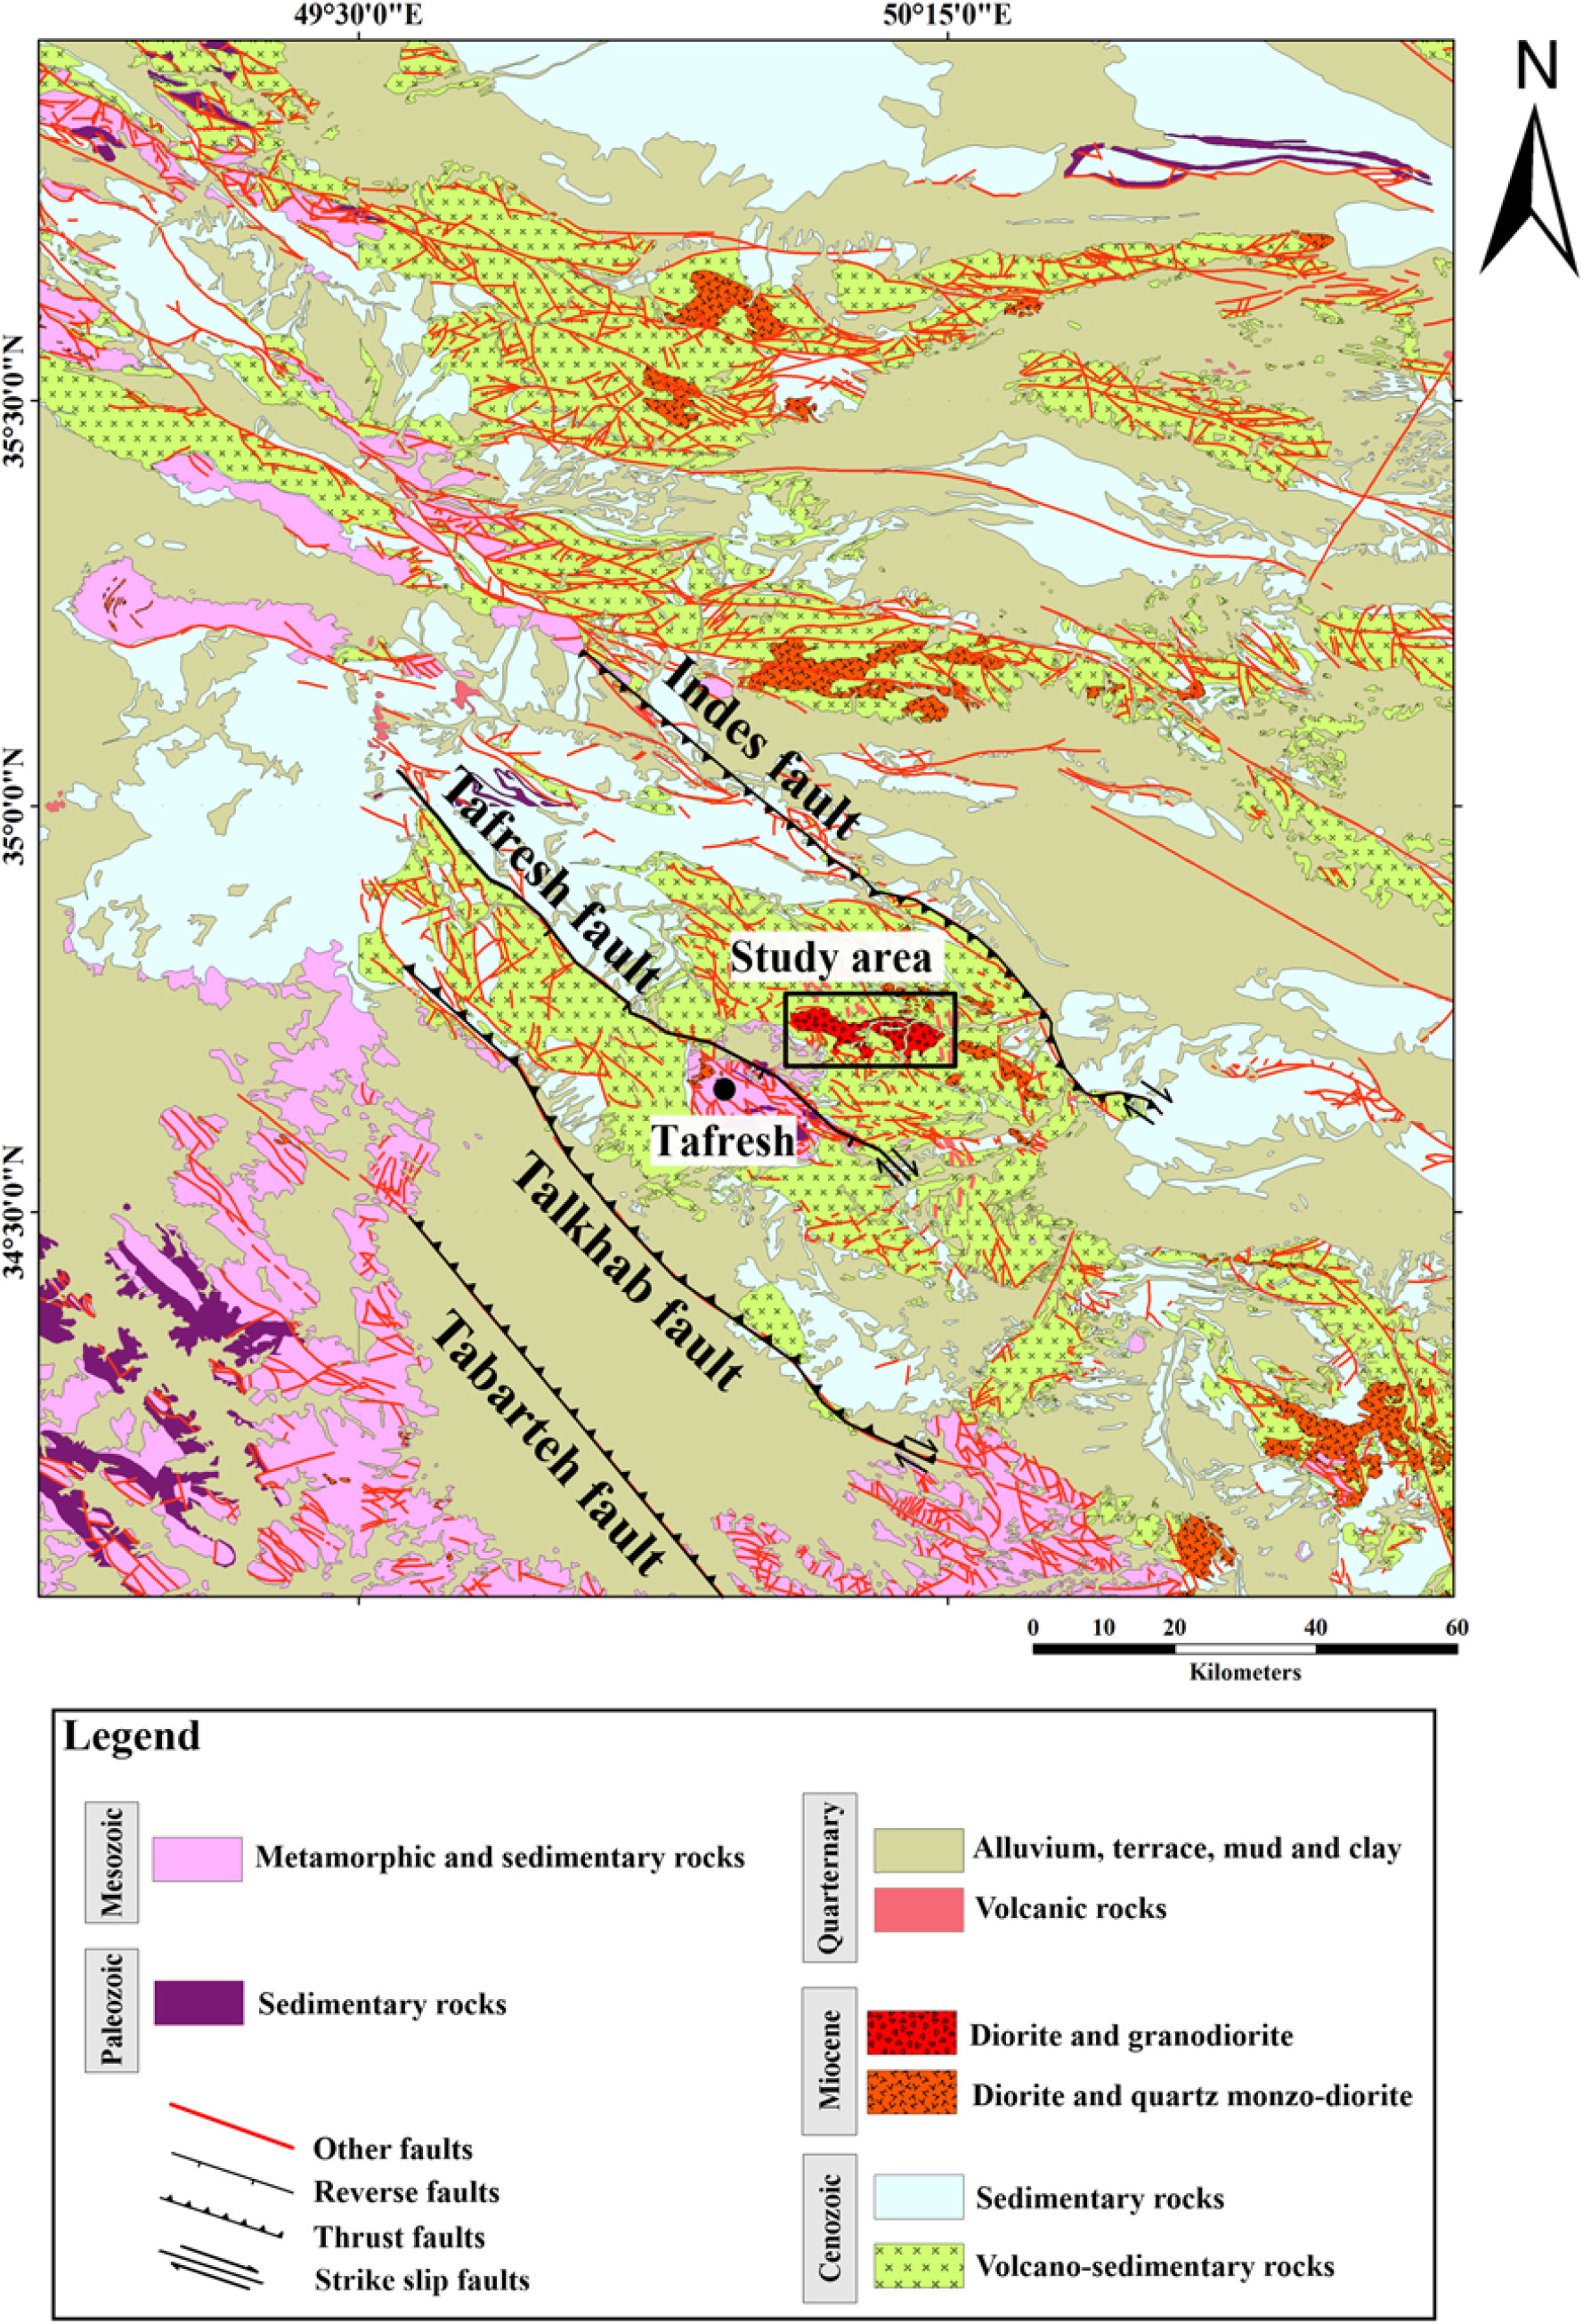
Fig. 3. Tectonic map of the Tafresh area showing the main faults. 1:250000 geological maps of Iran (www.gsi.ir).

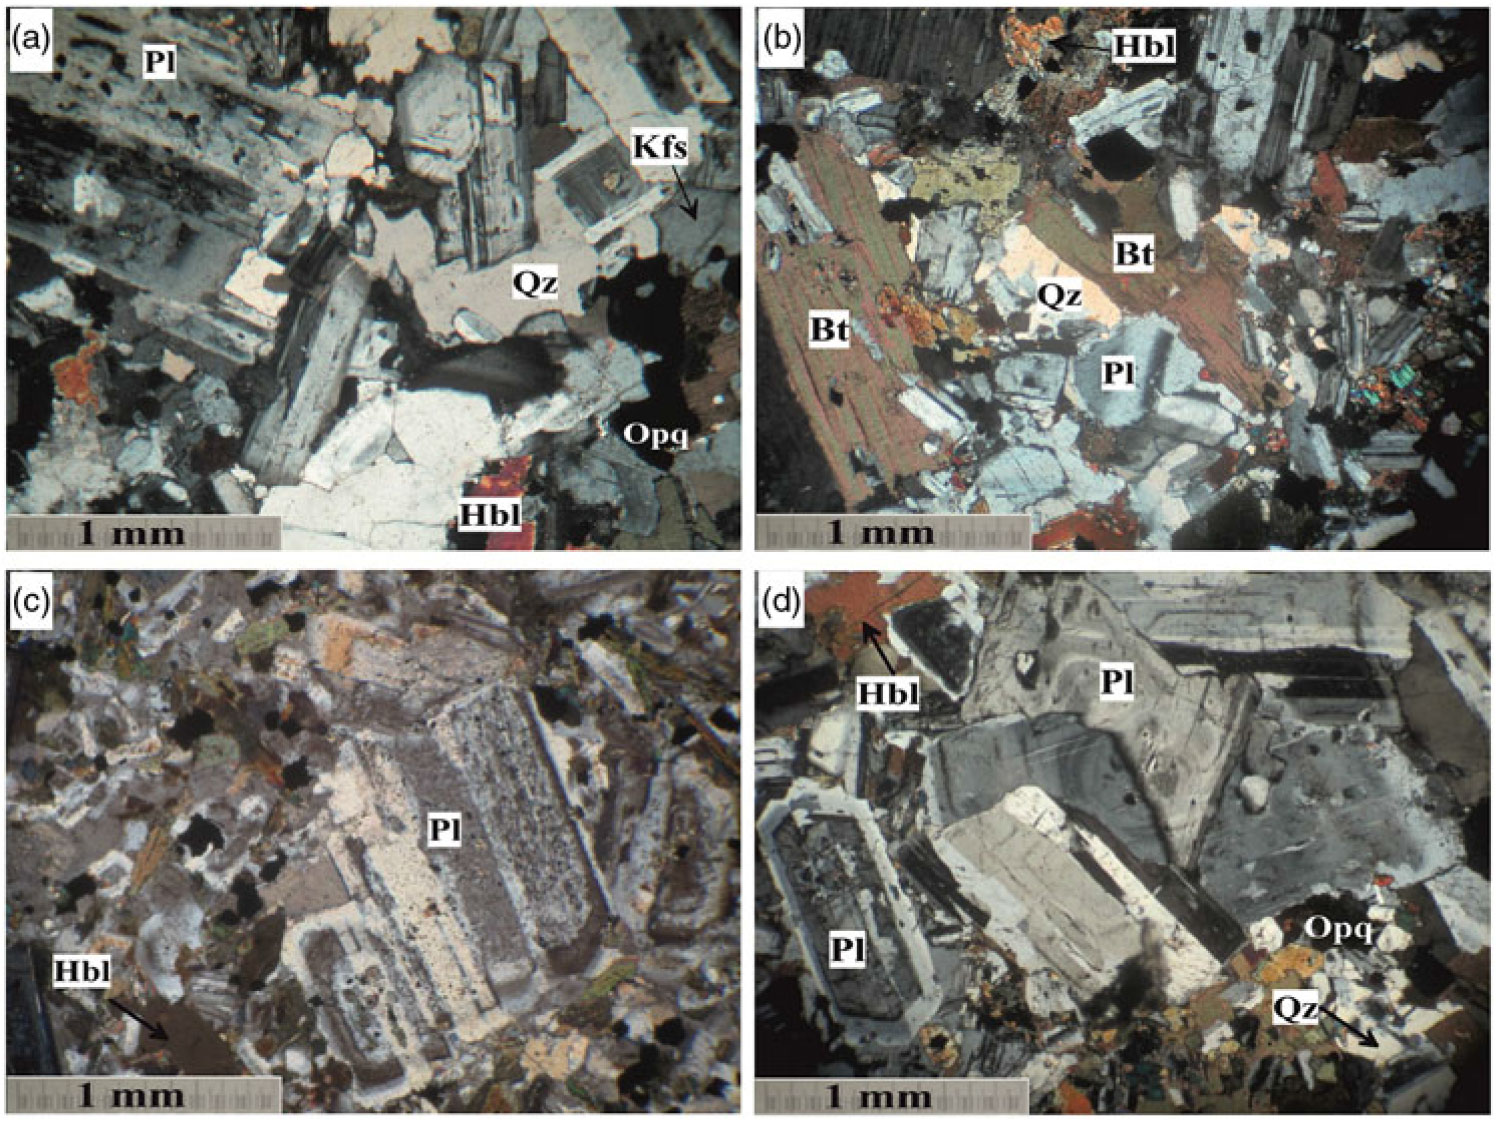
Fig. 4. Petrographic characteristics of different rocks from the Tafresh granitoids. (a, b) Granular to sub-granular granodiorite with plagioclase (Pl), quartz (Qz), K-feldspar (Kfs), biotite (Bt) and hornblende (Hbl) minerals, Sarbadan stock. (c) Sub-granular diorite containing plagioclase, hornblende and opaque minerals (Opq), Ghahan stock. (d) Euhedral plagioclase with oscillatory zoning, Ghahan stock. Mineral abbreviations after Whitney & Evans (Reference Whitney and Evans2010).
3. Methods
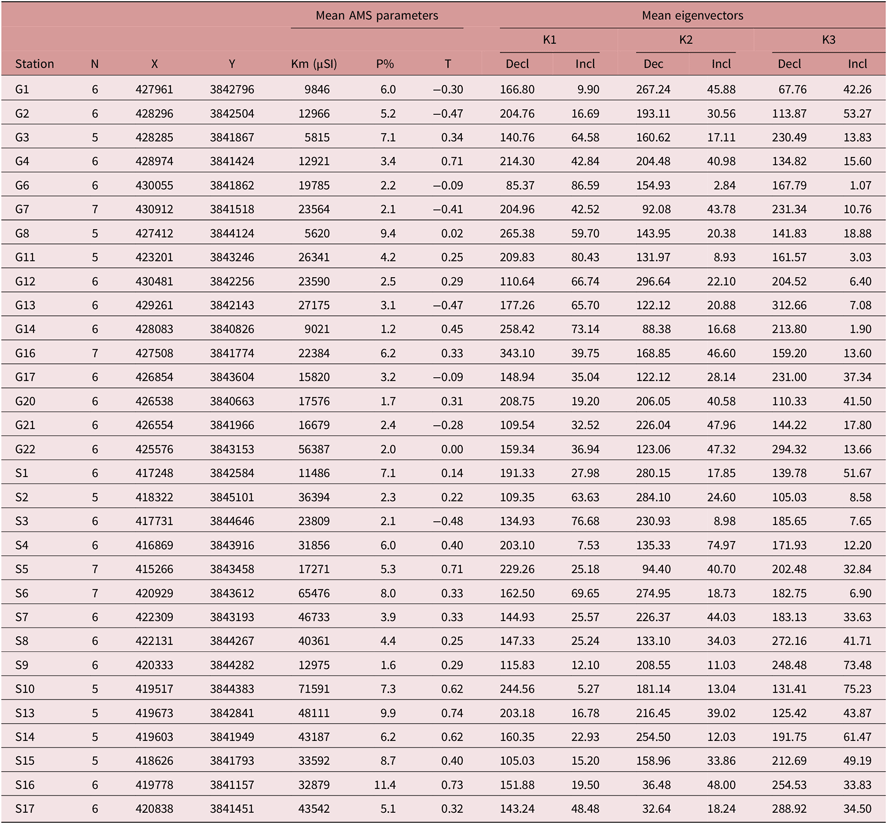
Oriented cylindrical cores were obtained from 31 sites: 15 granodiorite stations and 16 diorite–quartz diorite stations. Two or three oriented cores were collected per station, each yielding at least two samples, thus providing five (or more) samples per station. In all, 182 samples were analysed for magnetic parameters. All samples were sliced in order to obtain cylinders that fit in the sample holders of the Kappabridge instrument. Each sample was shaped to 22 mm length and 25 mm diameter: the standard size for magnetic measurements. Magnetic fabric was measured at the Geomagnetic Laboratory, Shahrood University of Technology, using an AGICO Kappabridge MFK1-FA susceptometer operating at low field (4 × 10⁻⁴ T; 920 Hz). Orientations and magnitudes of the three principal axes of the AMS ellipsoids (K1 ≥ K2 ≥ K3) were obtained for each sampling station using the rotating mode. The long axis of the ellipsoid, K1, defines the magnetic lineation; K3, the short axis, defines the pole of the magnetic foliation (the plane formed by K3 and K2 axes). The anisotropy percentage P% = 100((K1/K3) − 1) and the shape parameter T = ln(K2/(K1/K3))/ln(K1/K3) (Jelínek & Kropáček, Reference Jelínek and Kropáček1978) were calculated for each sampling station. Table 1 records magnetic data for each of the 31 stations.
Table 1. Anisotropy of magnetic susceptibility data for the Ghahan and Sarbadan stocks

Locations (X (x-coordinate) / Y (y-coordinate) in Universal Transverse Mercator (UTM) zone; Km = (K1 + K2 + K3)/3 mean magnetic susceptibility in 10−6 SI; P% = 100 × ((K1/K3) − 1) is the total anisotropy percentage; T = (2ln(K2/K3)/(ln(K1/K3) − 1) is the Jelinek’s shape parameter (Jelínek, Reference Jelínek1981). Decl – declination; Incl – inclination in degrees.
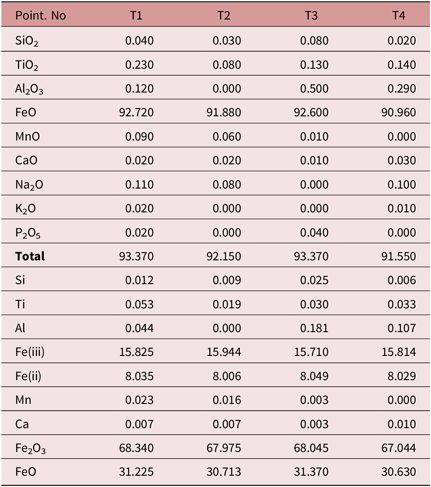
Electron microprobe analysis of magnetite grains was accomplished at the Iranian Mineral Processing Research Centre using a Cameca SX 100 electron microprobe analyser equipped with a wavelength-dispersive spectrometer. Accelerating voltage was 15 kV, with a beam current of 20 nA and a 0–2 μm focused electron beam. Table 2 provides representative magnetite analyses.
Table 2. Selected electron microprobe analyses of magnetites from the Tafresh granitoids

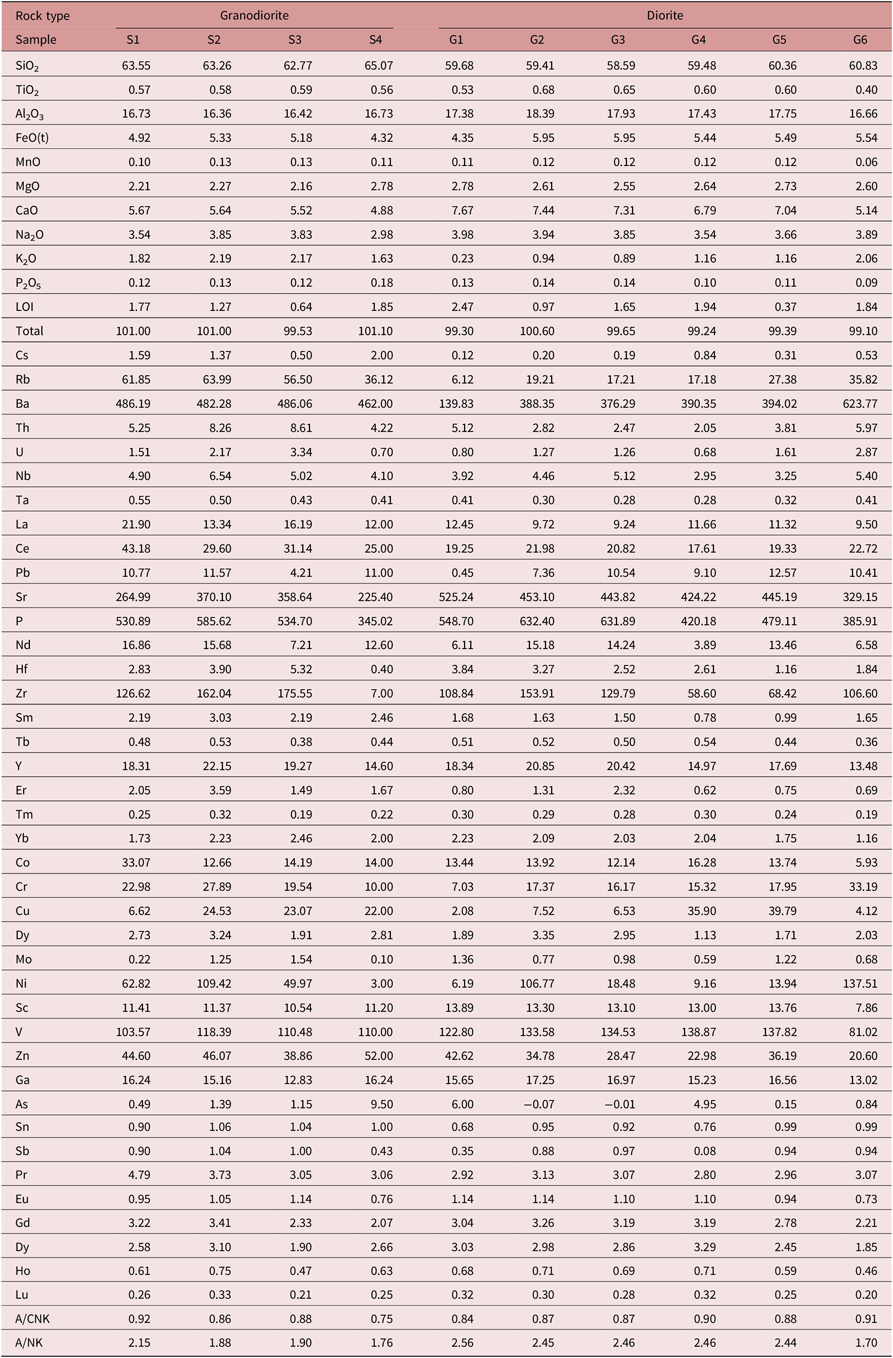
Fifty-one thin-sections were examined by optical microscopy, and ten representative fresh samples of intrusive rocks in the region were selected for whole-rock geochemical analysis. Major and trace elements were measured using inductively coupled plasma optical emission spectrometry (ICP-OES) and inductively coupled plasma mass spectrometry (ICP-MS), respectively, at the Department of Geology and Environmental Earth Sciences, Miami University, Ohio (Table 3). Two kilograms of each sample were powdered, and analyses were obtained by fusing 50 mg of sample powder with 75 mg LiBO2 and dissolving in 125 ml of 0.3N HNO3. For major elements, analytical precision is better than ± 2–5 %; for most trace elements and rare earth elements (REEs), the analytical error was less than 2 % and the precision was greater than 10 %.
Table 3. Major (wt %), trace and rare earth element (ppm) data of representative rock samples from the Tafresh granitoids
4. Petrography and geochemistry
Sarbadan granodiorite has a medium-grained granular texture (Fig. 4a, b) and consists of plagioclase, K-feldspar, quartz, biotite and hornblende. Opaque minerals, pyroxene, zircon and titanite are conspicuous accessory minerals. Plagioclase forms euhedral to subhedral and tabular crystals (2.7 to 0.2 mm) with optical zonation. Most of the quartz occurs as small interstitial grains (0.1 to 0.64 mm). Opaque minerals (mainly magnetite), as inclusions in plagioclase or as forming small grains in the groundmass, occur mainly around the hornblende and biotite (Fig. 4b).
Ghahan diorite to quartz diorite has a granular to porphyritic texture with a microgranular groundmass (Fig. 4c). Plagioclase, K-feldspar and hornblende constitute the essential rock-forming minerals, whereas quartz ± biotite and opaque minerals, zircon and titanite form the accessory minerals. Plagioclase is euhedral to subhedral and commonly shows compositional zoning (Fig. 4d).
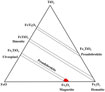
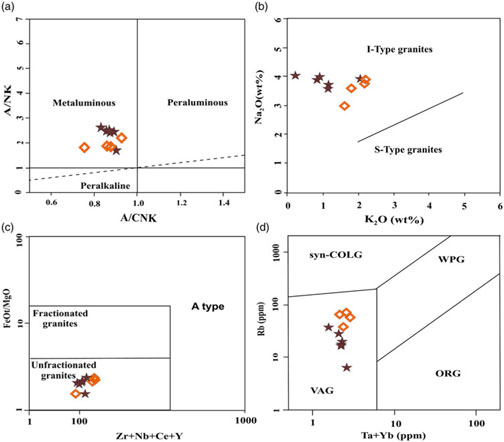
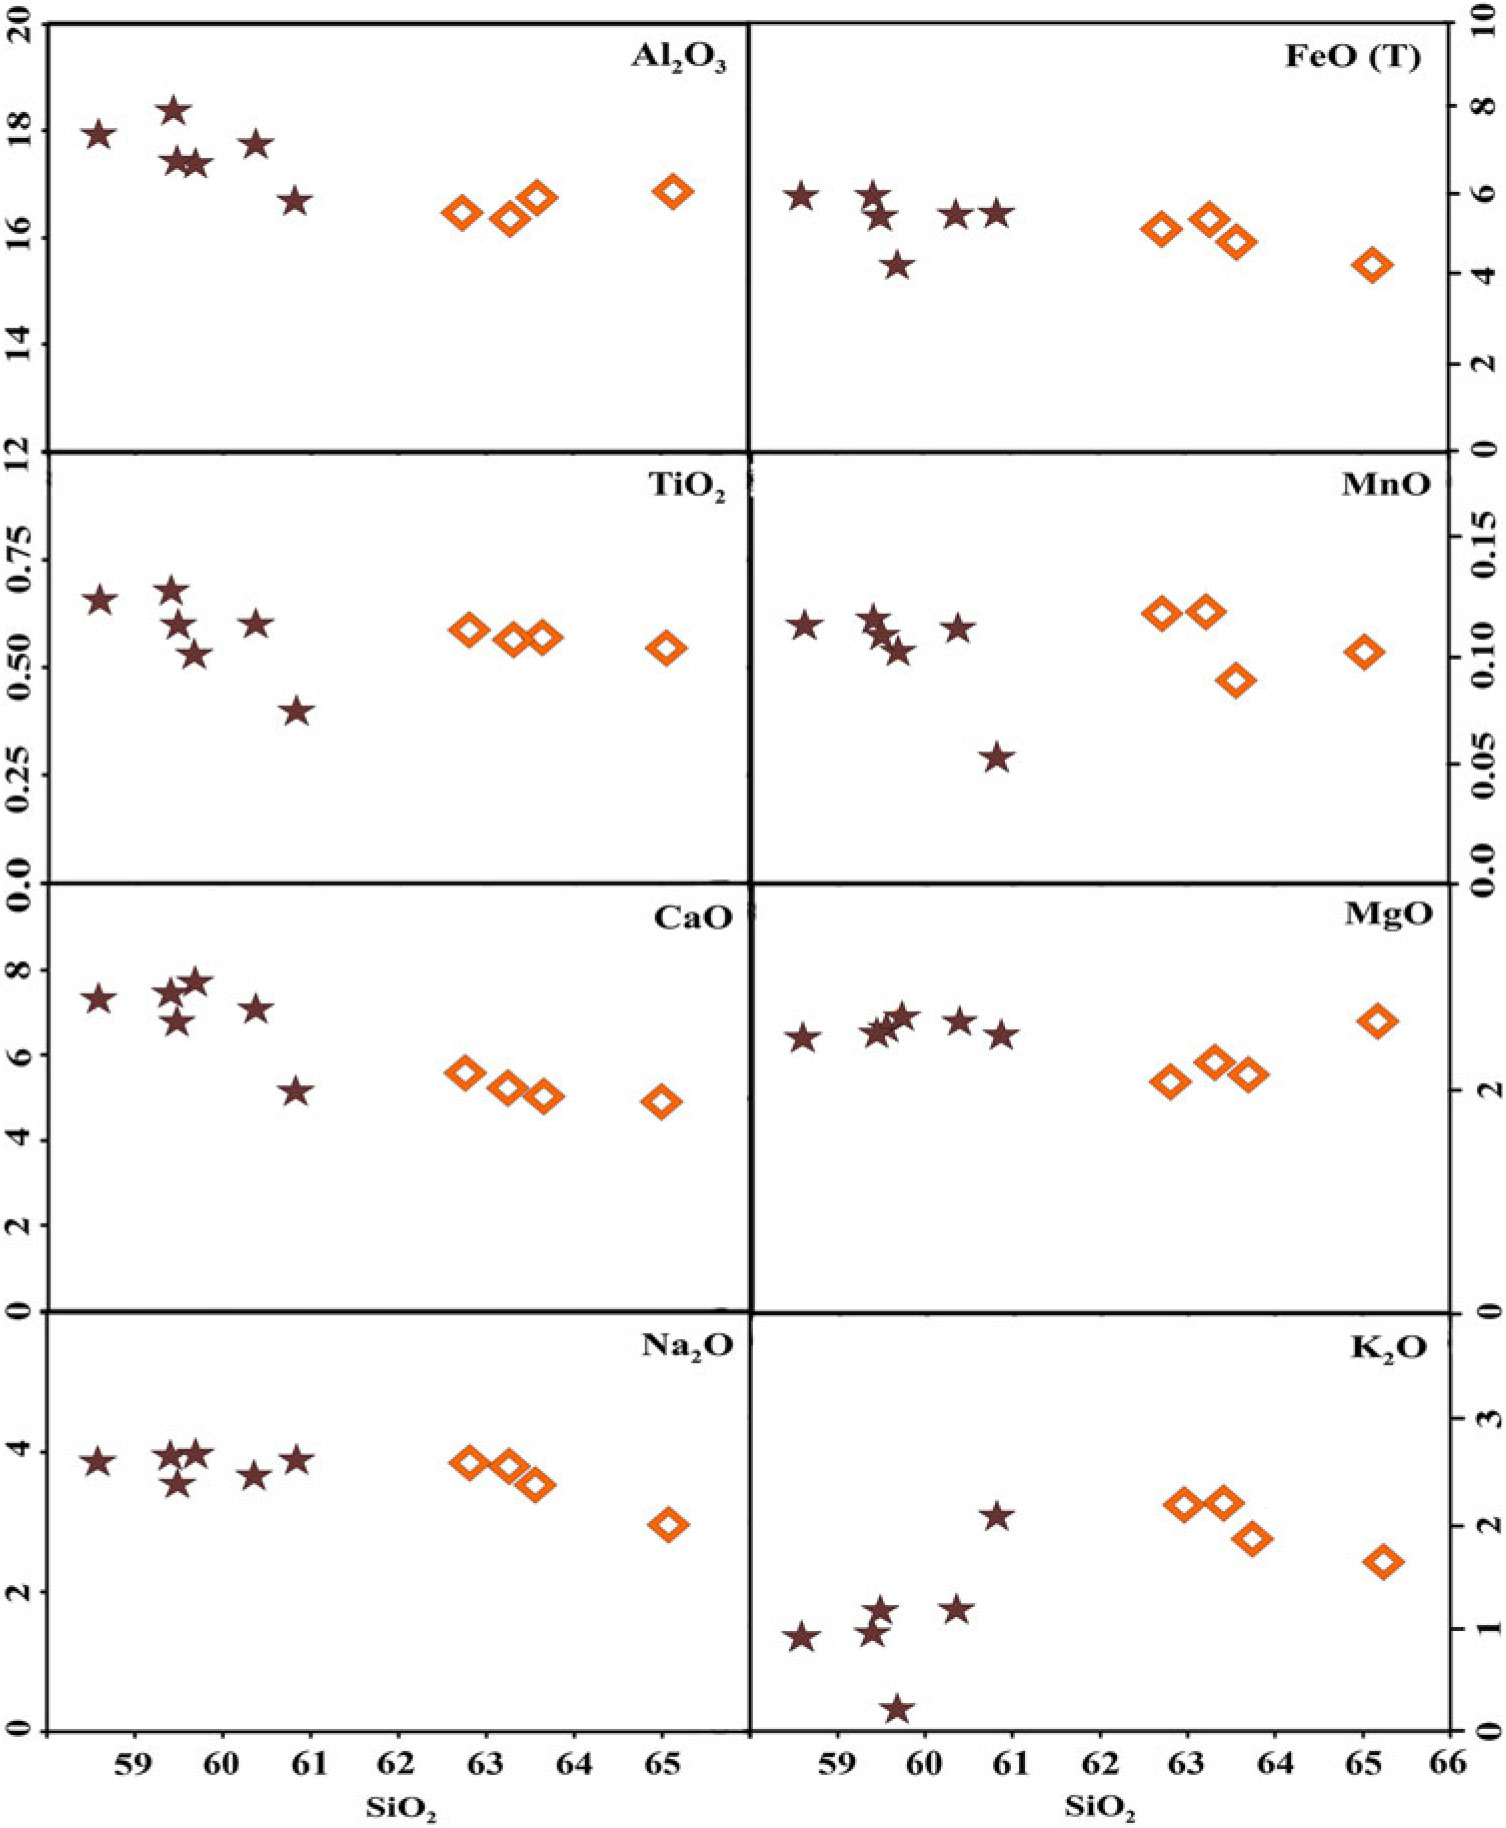
In the TiO2–Fe2O3–FeO diagram, the opaque minerals of the Ghahan and Sarbadan stocks plot within the field of magnetite (Fig. 5). SiO2 in the Ghahan stock is lower (SiO2 = 58.58–60.82 wt %) than SiO2 in the Sarbadan stock (SiO2 = 62.77–65.07 wt %). According to the K2O + Na2O versus SiO2 diagram of Middlemost (Reference Middlemost1991), the analysed samples are classified as diorite (Ghahan) and granodiorite (Sarbadan) (Fig. 6a). The data define a calc-alkaline trend on the AFM diagram (Fig. 6b). A/CNK ((Al2O3/(CaO + Na2O + K2O)) ranges between 0.75 (Ghahan) and 0.96 (Sarbadan), indicating metaluminous magma (Fig. 7a). On the Na2O versus K2O diagram, samples are classified as I-type granitoids (Fig. 7b). On the plot of FeOt/MgO versus Zr + Nb + Ce + Y (Whalen et al. Reference Whalen, Currie and Chappell1987), all data correspond to unfractionated I- and S-type granitoids (Fig. 7c). Trace-element discrimination diagrams can be employed as a means to ‘fingerprint’ the tectonic environments in which granitoids formed (Pearce et al. Reference Pearce, Harris and Tindle1984). Accordingly, in a plot of Rb versus Ta + Yb, all samples correspond to volcanic arc granitoids (Fig. 7d). A high Rb/Nb ratio, between 1.56 and 12.62, is consistent with a subduction zone setting (Pearce, Reference Pearce, Hawkesworth and Norry1983). Harker diagrams (Fig. 8) exhibit ascending linear trends for Na2O, but negative trends for TiO2, Al2O3, FeO, MnO and CaO, suggestive of fractionation of amphibole, biotite and magnetite. K2O versus SiO2 is positive, and K2O versus SiO2 does not show a clear trend.
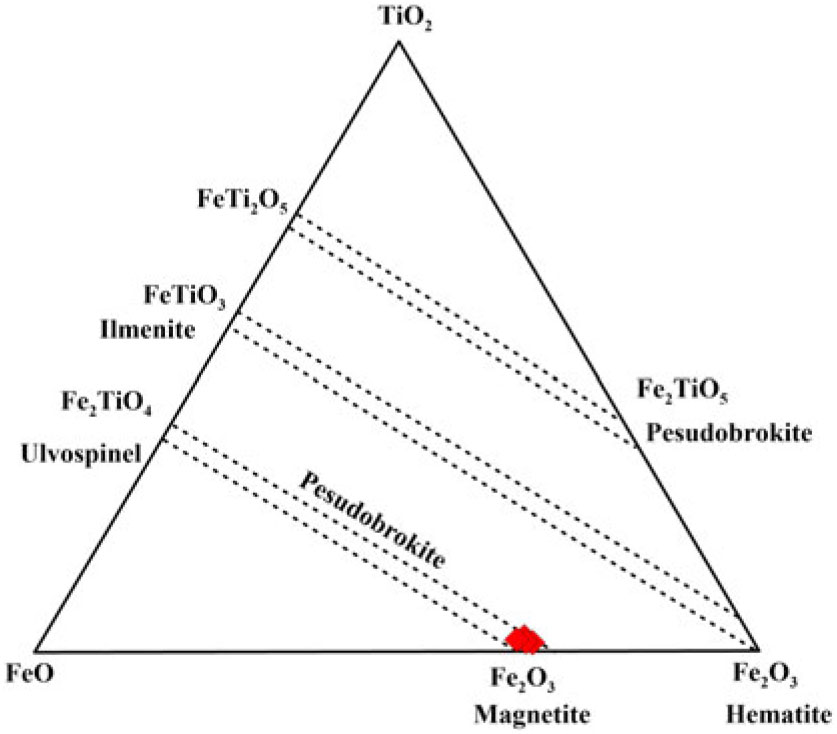
Fig. 5. Chemical composition of magnetite on TiO2–Fe2O3–FeO ternary diagram (Buddington & Lindsley, Reference Buddington and Lindsley1964).
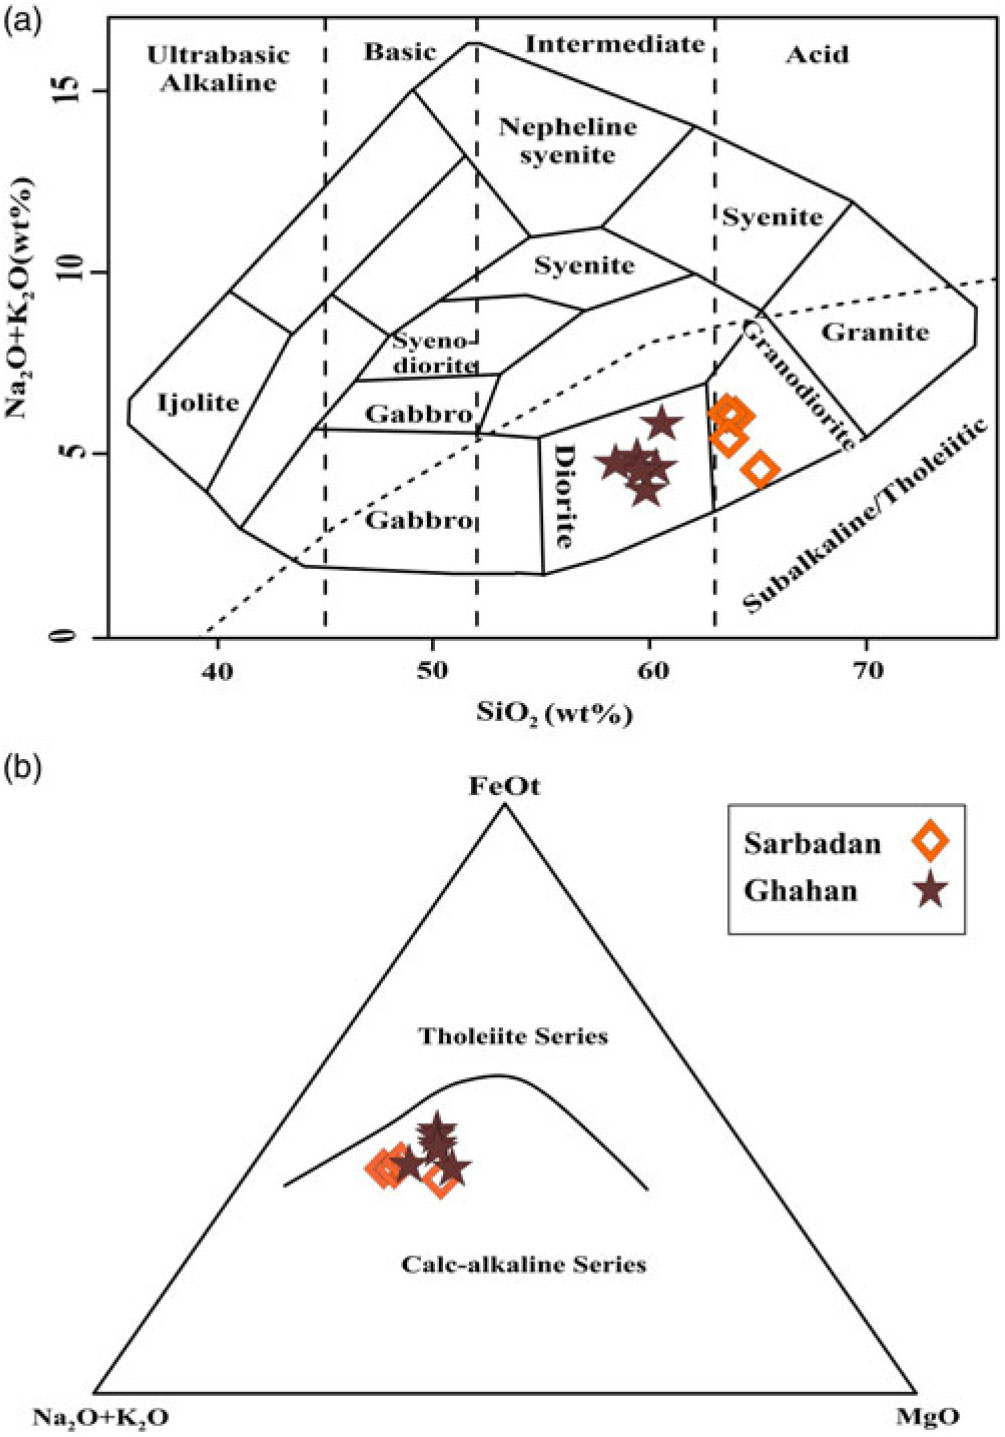
Fig. 6. Chemical classification of rocks from the Ghahan and Sarbadan stocks. (a) K2O + Na2O v. SiO2 plot (Middlemost, Reference Middlemost1991); composition of studied samples ranges from diorite (Ghahan stock) to granodiorite (Sarbadan stock). (b) AFM (A = Na2O + K2O; F = FeOt; M = MgO) diagram with differentiation lines of Irvine & Barager (Reference Irvine and Baragar1971), showing a calc-alkaline affinity for the granitoids (Irvine & Baragar, Reference Irvine and Baragar1971).

Fig. 7. (a) Classification of the Ghahan and Sarbadan stocks on A/NK v. A/CNK diagram (ANK = molar Al2O3/(Na2O + K2O) and ACNK = molar Al2O3/(CaO + Na2O + K2O)) (Shand, Reference Shand1943). (b) Na2O v. K2O classification diagram for discrimination of I- and S-type granitoids (Chappell & White, Reference Chappell and White2001); all samples fall in the field of I-type granitoids. (c) FeOt/MgO v. Zr + Nb + Ce + Y diagram. (d) Tectonic classification diagram Rb v. Ta + Yb (Pearce et al. Reference Pearce, Harris and Tindle1984). WPG – within-plate granites; VAG – volcanic arc granites; syn-COLG – syn-collision granites; ORG – oceanic ridge granites.

Fig. 8. Harker diagrams for major elements of the Tafresh granitoids.
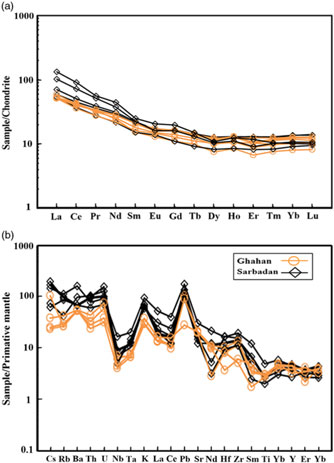
Chondrite-normalized REE patterns (Sun & McDonough, Reference Sun, McDonough, Saunders and Norry1989) show relative enrichment of light rare earth elements (LREE), and relatively flat heavy rare earth element (HREE) patterns, with an absent Eu anomaly (Fig. 9a). On a multi-element diagram normalized to primitive mantle (Sun & McDonough, Reference Sun, McDonough, Saunders and Norry1989), Nb, P and Ti show distinctly negative anomalies, whereas large-ion lithophile elements (LILEs, such as Cs, Rb, K and Pb) exhibit pronounced positive anomalies (Fig. 9b).
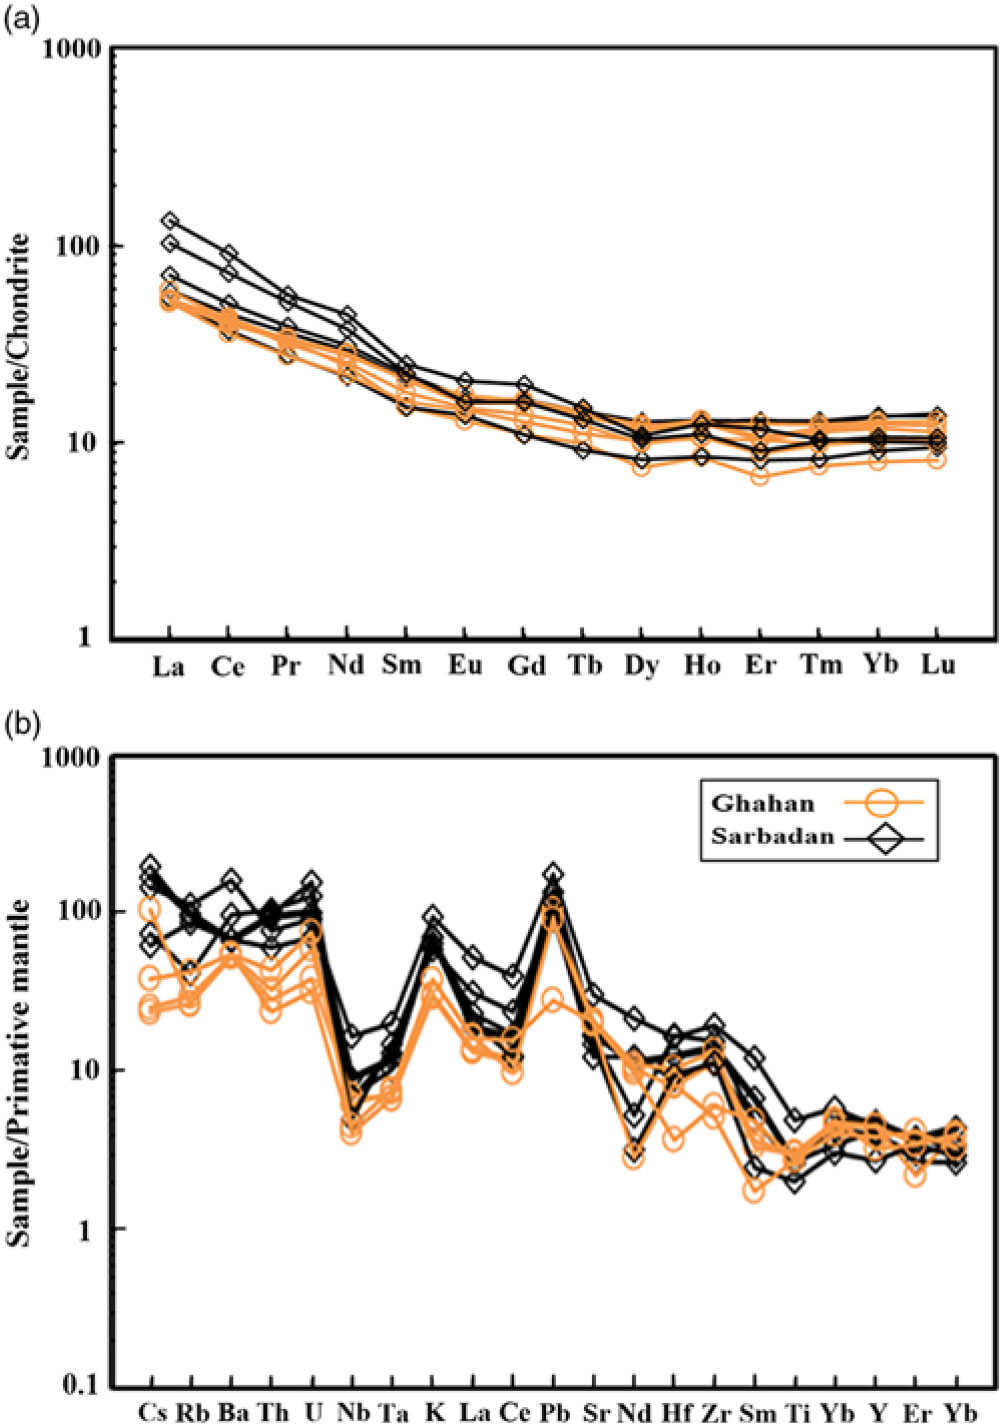
Fig. 9. (a) Chondrite-normalized REE patterns. Normalized values from Sun & McDonough (Reference Sun, McDonough, Saunders and Norry1989). (b) Primitive mantle normalized multi-element diagram. Normalizing values are after McDonough & Sun (Reference McDonough and Sun1995).
5. Magnetic fabric
The AMS technique provides a rapid quantitative description of the crystal shape fabric in magmatic rocks (e.g. Gleizes et al. Reference Gleizes, Nédélec, Bouchez, Autran and Rochette1993; Cruden & Launeau, Reference Cruden and Launeau1994; Bouchez, Reference Bouchez, Bouchez, Hutton and Stephens1997; Cruden et al. Reference Cruden, Tobisch and Launeau1999; De Saint-Blanquat et al. Reference De Saint-Blanquat, Law, Bouchez and Morgan2001; Cañón-Tapia & Coe, Reference Cañón-Tapia and Coe2002; Cañón-Tapia & Chávez-Álvarez, Reference Cañón-Tapia and Chávez-Álvarez2004; Archanjo & Launeau, Reference Archanjo, Launeau, Martín-Herníndez, Lüneberg, Aubourg and Jackson2004; Eriksson et al. Reference Eriksson, Riishuus, Sigmundsson and Elming2011; Archanjo et al. Reference Archanjo, Barboza, Neves, Malard, Ferreira, Brant, Alves, Plentz, Carozo, Fragneaud, Maciel, Almeida, Jorio and Achete2012; Schöpa et al. Reference Schöpa, Floess, De Saint-Blanquat, Annen and Launeau2015). It also helps in determining the bulk internal structure of plutons in situations where macroscopic foliation and lineation are weak or absent (Sheibi et al. Reference Sheibi, Bouchez, Esmaeily and Siqueira2012). In anisotropic rocks, the magnetic susceptibility is represented by a second-order symmetric tensor, an ellipsoid with three principal susceptibility axes (Bouchez, Reference Bouchez2000). The relationship between preferred mineral orientation and magnetic fabric depends on the nature of the magnetic minerals, and on the textural relationships among the mineral grains (Stacey, Reference Stacey1962; Khan, Reference Khan1962; Uyeda et al. Reference Uyeda, Fuller, Belshe and Girdler1963; Rochette et al. Reference Rochette, Jackson and Aubourg1992; De Saint-Blanquat et al. Reference De Saint-Blanquat, Habert, Horsman, Morgan, Tikoff, Launeau and Gleizes2006). Maximum, intermediate and minimum susceptibilities are designated as Kmax = K1 > Kint = K2 > Kmin = K3, respectively, representing the maximum, intermediate and minimum axes of the magnetic susceptibility ellipsoid. The ellipsoid long axis, K1, defines the magnetic lineation and the short axis, K3, defines the pole to the magnetic foliation (Tcheumenak Kouémo et al. Reference Tcheumenak Kouémo, Njanko, Kwékam, Naba, Bella Nké, Yakeu Sandjo, Fozing and Njonfang2014). Magnetic lineation (K1) is often inferred to indicate the stretching direction of magmatic flow (Owens, Reference Owens1974; Guillet et al. Reference Guillet, Bouchez and Wagner1983; Bouchez et al. Reference Bouchez, Gleizes, Djouadi and Rochette1990; Bouchez, Reference Bouchez, Bouchez, Hutton and Stephens1997; Cañón-Tapia et al. Reference Cañón-Tapia, Walker and Herrero-Bervera1997; Bella Nké et al. Reference Bella Nké, Njanko, Kwékam, Njonfang, Naba, Tcheumenak, Gountié, Rochette and Nédélec2014). The average value of Km = 1/3(K1 + K2 + K3), known as the bulk susceptibility, varies according to the relative proportions of ferromagnetic, paramagnetic and diamagnetic minerals present in the rock (Tarling & Hrouda, Reference Tarling and Hrouda1993). The intensity of anisotropy (degree of eccentricity) of the AMS ellipsoid is studied through P% (Jelínek, Reference Jelínek1981). The shape of the AMS ellipsoid is illustrated by the T parameter, which varies from +1 for a perfectly oblate ellipsoid to −1 for a perfectly prolate ellipsoid (Jelínek, Reference Jelínek1981).
5.a. Bulk magnetic susceptibility (Km)
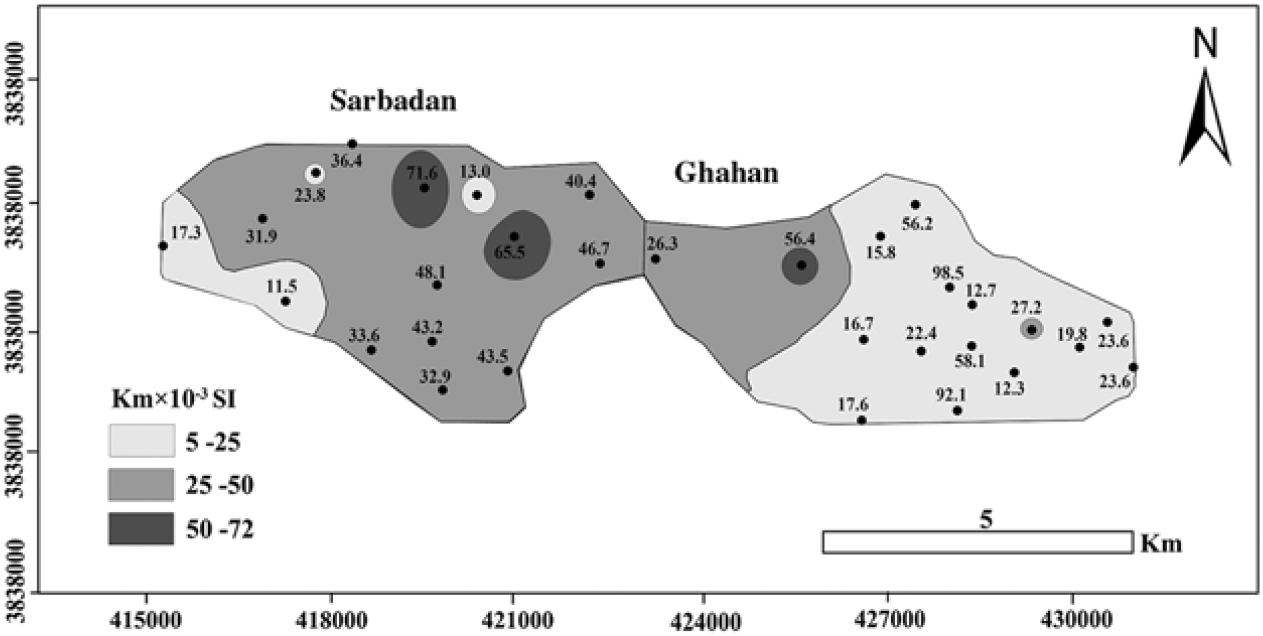
The classic subdivision into ‘paramagnetic’ and ‘ferromagnetic’ granites was recognized early on by Ishihara (Reference Ishihara1977) in order to sort Japanese granites into magnetite-absent and magnetite-bearing facies, as evidenced by low-field magnetic susceptibility and anisotropy measurements, respectively. In magnetite-absent granites, the susceptibility carriers are the iron-bearing silicates (i.e. biotite, chlorite, amphibole, tourmaline, etc) and Km does not exceed 0.5 × 10⁻³ SI. In the ferromagnetic type, the presence of magnetite in addition to the iron-bearing silicates is responsible for high Km (>5 × 10⁻³ SI). Since magnetite has a strong intrinsic susceptibility, the added effect of the paramagnetic and diamagnetic minerals is modest and the magnetic susceptibility of a rock is largely controlled by the magnetite content (Gleizes et al. Reference Gleizes, Nédélec, Bouchez, Autran and Rochette1993; Bouchez, Reference Bouchez, Bouchez, Hutton and Stephens1997). The magnetic susceptibility varies from 11.5 × 10⁻³ SI (station S1) to 71.6 × 10⁻³ SI (station S10) (mean value 37.3 × 10⁻³ SI) for Sarbadan, and 5.6 × 10⁻³ SI (station G8) to 56.4 × 10⁻³ SI (station G22) (mean value 19.1 × 10⁻³ SI) for Ghahan (Figs 10, 11). Susceptibility is highly variable across the stocks, and the average bulk magnetic susceptibility of the Sarbadan stock is higher than that of the Ghahan.

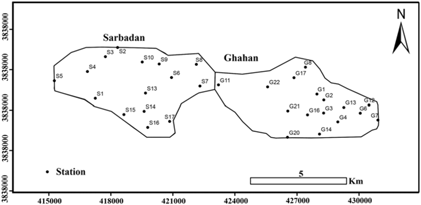
Fig. 10. Location of sampling stations used for the magnetic fabric study in the Sarbadan (S) and Ghahan (G) stocks.

Fig. 11. Contour map of magnetic susceptibility (Km) for the Ghahan and Sarbadan stocks.
5.b. Magnetic anisotropy percentage (P%)
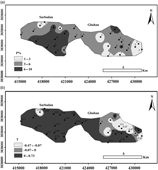
Since the anisotropy percentage is usually related to the intensity of deformation, this parameter is often used to distinguish magmatic flow from solid-state deformation (De Saint-Blanquat et al. Reference De Saint-Blanquat, Law, Bouchez and Morgan2001). In some cases, P% may be correlated with strain intensity (Bouchez, Reference Bouchez, Bouchez, Hutton and Stephens1997). P% is equal to 1 when K1 = K2 = K3 and the magnetic ellipsoid is a sphere. In any case, an increase in the magnetic susceptibility results in augmenting the differences among the axes and resultant degree of anisotropy. AMS depends upon several factors such as temperature, deformation and chemical composition of rocks, etc (Bouchez, Reference Bouchez2000). The measured P% for the Sarbadan and Ghahan stocks (Table 1) is shown as contours in Figure 12a. P% is low throughout the pluton, varying from 1 % to 11 % (mean 4.74 %), rarely exceeding 10 %. High values of P% are located at sites on the southern margin of the Sarbadan stock. Occasional undulose extinction in quartz and minor mechanical twining in plagioclase are the only evidence of solid-state deformation in the western margin of the Ghahan stock. Owing to the sub-granular texture of the two stocks, it is possible that traces of deformation are not recorded.

Fig. 12. (a) Contour maps of anisotropy percentage (P%) and (b) shape parameter (T) for the Ghahan and Sarbadan stocks.
5.c. Shape parameter (T)
The magnetic shape parameter (T) characterizes the shape of the magnetic susceptibility ellipsoid (Jelínek, Reference Jelínek1981; Borradaile, Reference Borradaile1988) and delineates the direction and arrangement of the magnetite crystals during emplacement (Jelínek & Kropáček, Reference Jelínek and Kropáček1978). If T is negative, the shape of the magnetic ellipsoid is prolate or linear, whereas for positive T the ellipsoid is oblate or disc shaped (Lanza & Meloni, Reference Lanza and Meloni2006). Shape parameters for the Sarbadan and Ghahan stocks range from −0.48 (station S3) to 0.74 (station S13) and −0.47 (station G2) to 0.71 (station G4), respectively (Fig. 12b). Stations with negative values may represent the locus of feeder zones.
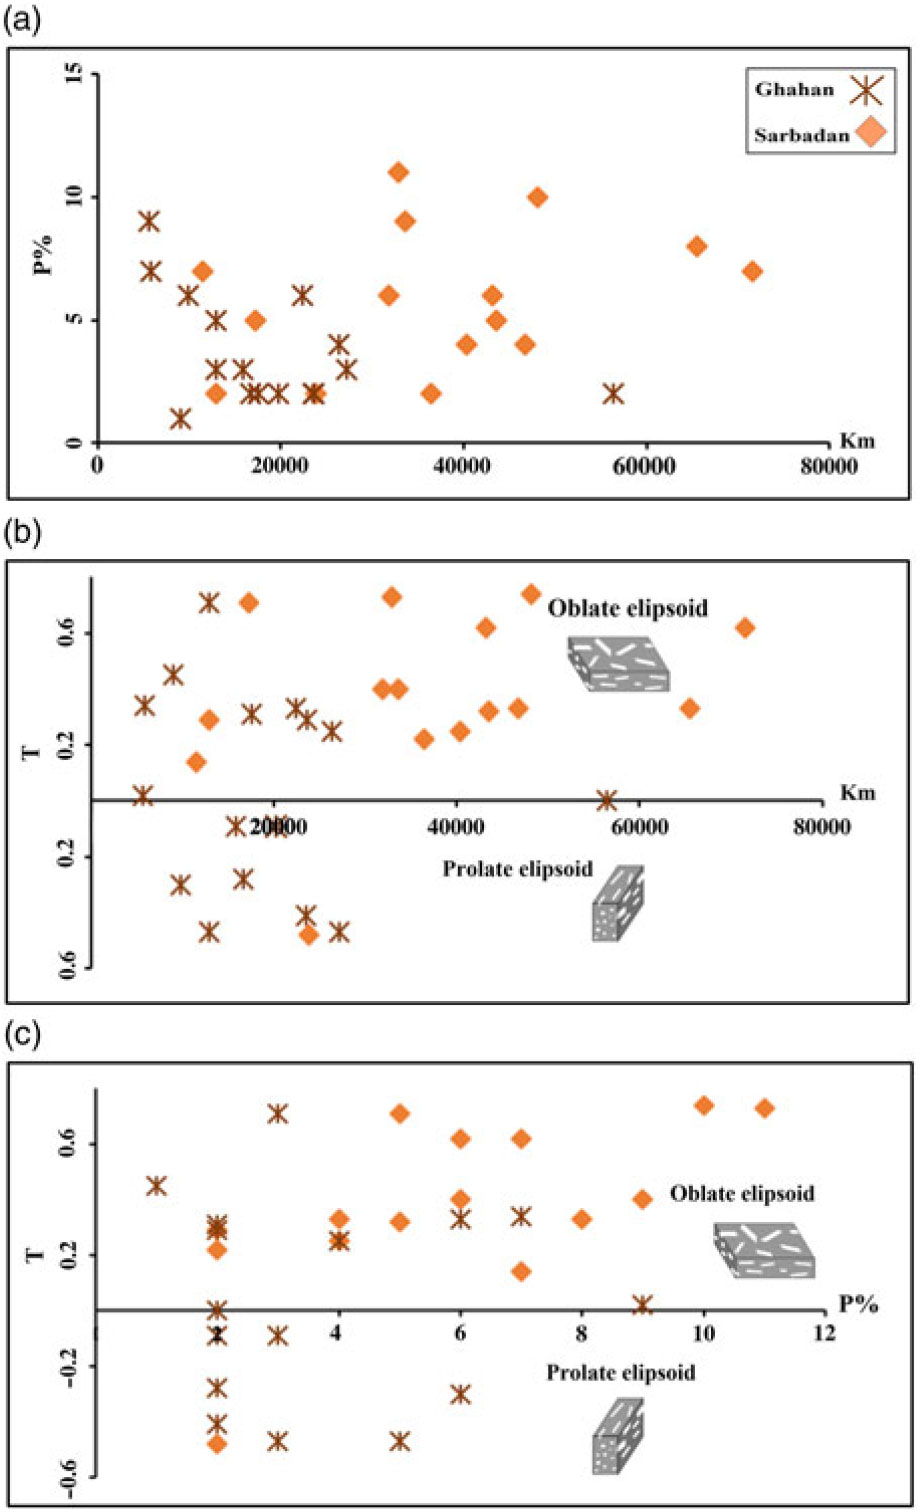
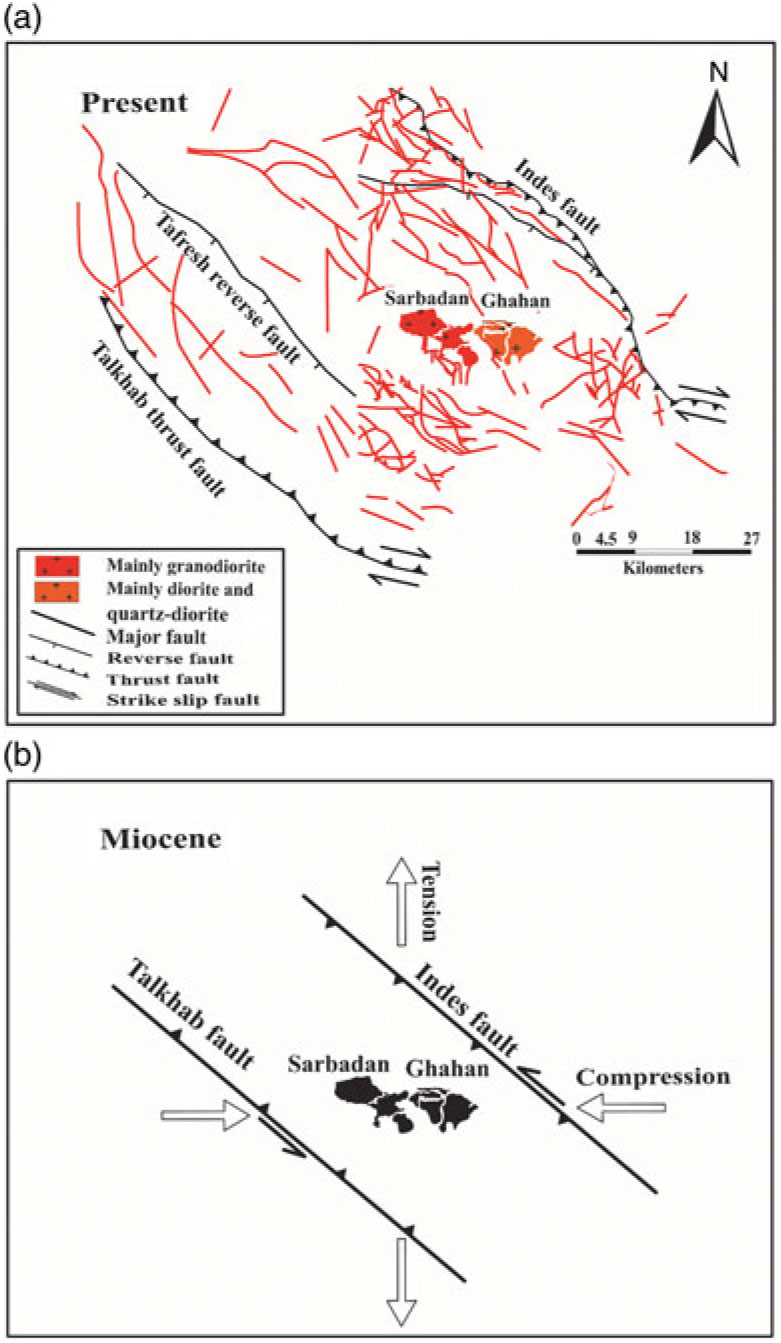
A plot of P% and T versus Km has been used in AMS studies to correlate specific shape fabrics with either susceptibility or anisotropy. Figure 13a, b shows P% versus Km and T versus Km, respectively. The relationship between P% and Km suggests the Sarbadan stock is both richer in magnetite and more deformed (Fig. 13a). No apparent correlation exists between T versus Km (Fig. 13b), but most stations of the Sarbadan stock are in the domain of an oblate ellipsoid, and 44 % of stations of the Ghahan granitoid are in the domain of a prolate-shaped ellipsoid. The T versus P% diagram reveals that the ellipsoids show a priority from oblate to prolate (Fig. 13c).

Fig. 13. Magnetic parameter diagrams. (a) P% v. Km; (b) T v. Km; (c) T v. P%.
5.d. Patterns of magnetic fabrics
Mineral lineations are crucial in understanding flow mechanism and emplacement history. Figure 14a, b displays magnetic lineation and foliation maps for the Tafresh granitoids, and stereoplots of the foliation and lineation poles. In general, the magnetic lineations are radially distributed from steep to gentle plunges from north to south in each stock. It is evident from the geometry of the lineation trajectories that the magma flowed outward radially from the northern entry point, towards the southern margins. In stereoplots, the magnetic lineations are widely spread (Fig. 14a, b). The average trend/plunge of magnetic lineation in the Sarbadan and Ghahan stocks is 142°/36° and 205°/48°, respectively (Fig. 14a). Seven stations having steep lineation plunges (>60°) are considered to be probable feeder zones. In 11 of the stations, magnetic foliation dips are greater than 70° with various strikes. The average foliation poles for the Sarbadan and Ghahan stocks are 221°/58° and 128°/30°, respectively (Fig. 14b). Most of the magnetic foliations are vertical or close to vertical, outlining a circular pattern on the Earth’s surface.
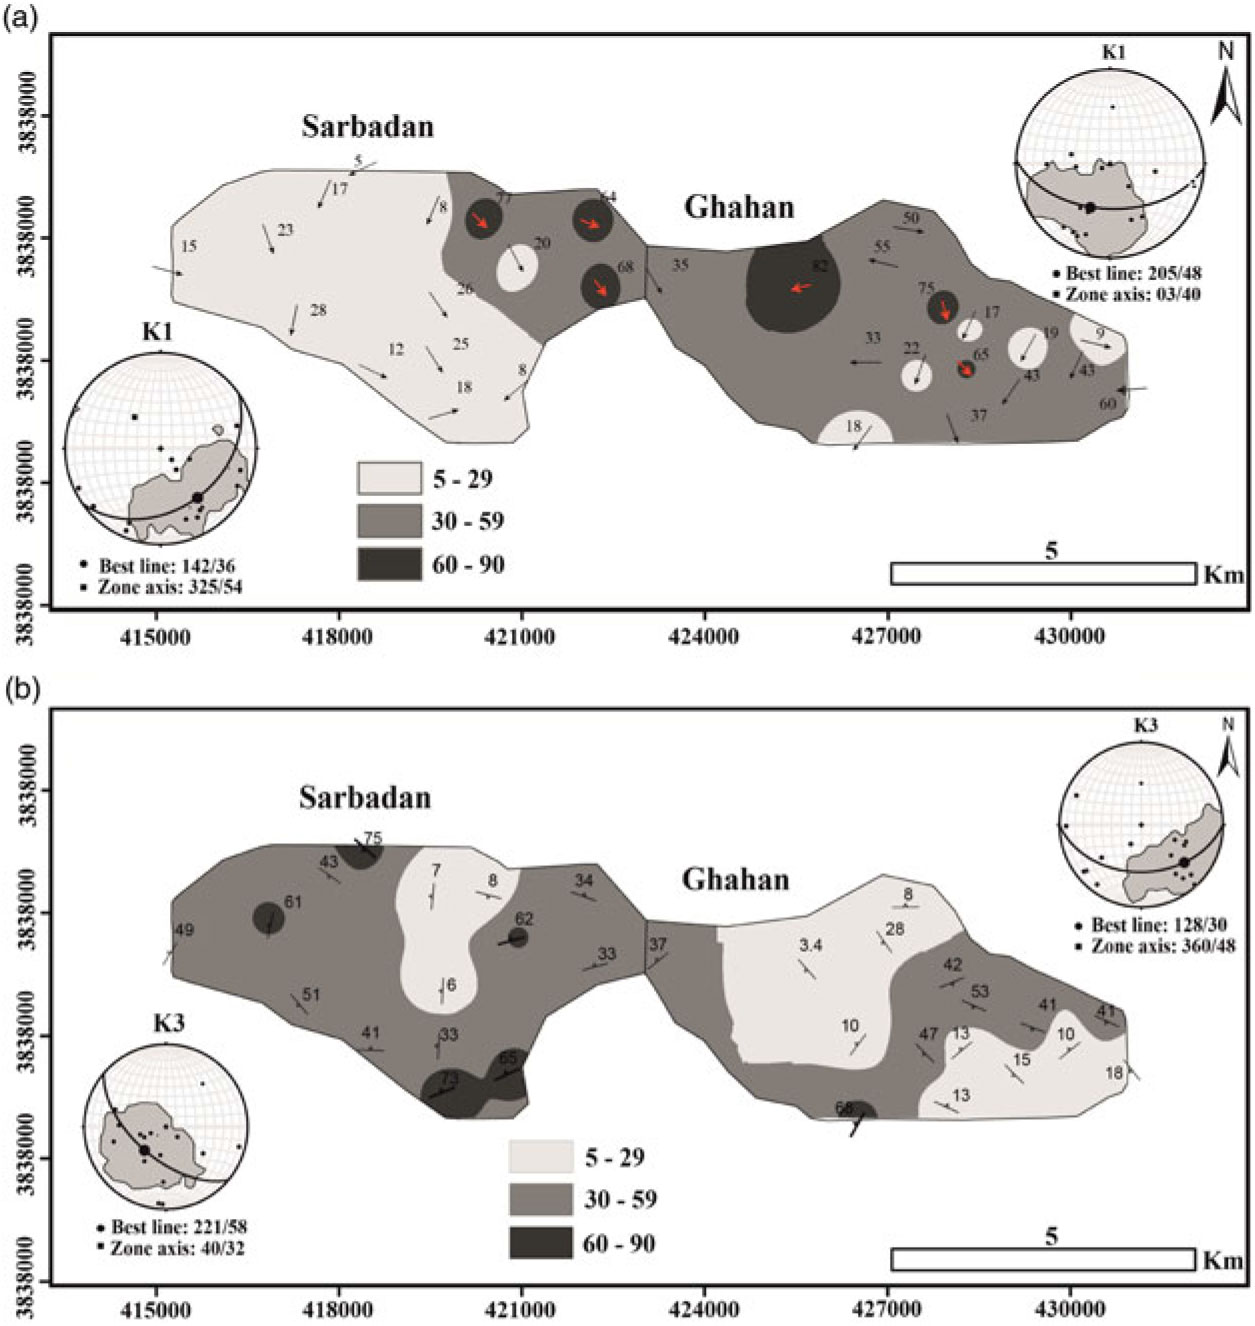
Fig. 14. (a) Magnetic lineation and (b) foliation maps of the Sarbadan and Ghahan stocks. Stereoplots represent the lineations (K1) and pole to foliation planes (K3).
6. Discussion
6.a. Constraint on petrogenesis
The Tafresh granitoids have arc-like, calc-alkaline signatures with similar REE patterns (especially in the HREEs), with Nb, Ta, Ti and Ba depletion, and with LREE and LILE enrichment (Fig. 9). Although negative anomalies in high field strength elements (HFSEs) might be linked to crustal contamination, we favour an interpretation that these anomalies typify subduction-related magmas; they originate from LILE enrichment in the subducting slab (Borg et al. Reference Borg, Clynne and Bullen1997). The Nb–Ta trough is considered to characterize arc-related I-type granitoids (e.g. Rogers & Hawkesworth, Reference Rogers and Hawkesworth1989; Sajona et al. Reference Sajona, Maury, Bellon, Cotten and Defant1996). On the chondrite-normalized diagram, the samples are LREE-enriched relative to enrichment in middle rare earth elements (MREE) and HREEs, but with relatively flat or upward-sloping MREE–HREE patterns, and with Eu anomalies absent. Second-order variations in LREE enrichment could be attributed to varying source compositions or degree of partial melting (Langmuir et al. Reference Langmuir, Bender, Bence, Hanson and Taylor1977; Le Roex, Reference Le Roex, Menzies and Hawkesworth1987; Kamenetsky et al. Reference Kamenetsky, Everard, Crawford, Varne, Eggins and Lanyon2000). The absence of negative Eu anomalies can be ascribed to the oxidizing conditions, such that Eu is present as Eu3+, and not Eu2+. The common occurrence of magnetite (Fig. 5) and hornblende in the Tafresh intrusive rocks indicates a high oxidation state and elevated water contents of the parent magmas (Hanson, Reference Hanson1980), which likely explains the lack of a distinct Eu anomaly. The profiles of REEs and the unfractionated HREE (and Y) patterns (Fig. 9) suggest that the magmas were produced outside the garnet stability field, likely in an amphibole-bearing mantle source, overlain by a relatively thin crust. On the tectonic discrimination diagram of Pearce et al. (Reference Pearce, Harris and Tindle1984) (Fig. 7d), all sample data fall in the domain of volcanic arc granitoids.
6.b. Emplacement model
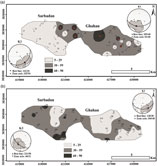
Petrological studies and the results obtained from the AMS methodology indicate that the Sarbadan and Ghahan stocks are I-type, ferromagnetic granitoids emplaced at shallow crustal depth in the central part of the UDMA. The two stocks share genetic relationships imposed during a single tectonic event. Microstructural analyses and consistently low anisotropy values across the Ghahan and Sarbadan stocks point to the dominance of magmatic flow rather than solid-state deformation. Occasional occurrence of weak solid-state deformation within the western margin of the Ghahan stock, the presence of microdioritic enclaves in the zone of convergence of these two stocks, the growth and southward expansion of the stocks and similar U–Pb ages all point to the coalescence of two magma chambers. The magnetic fabric of the Ghahan and Sarbadan stocks was created with a circular pattern and vertical foliation, and a high-dip lineation with a gradual distribution from an almost E–W vertical foliation and a horizontal southward lineation. In each stock, a distinct feeder zone with a steep magnetic lineation plunge (>60°) suggests that magma ascended dominantly along a NW–SE direction. Feeder zones are tentatively identified as being tectonically developed in extensional gashes. In separated feeder zones, magma conduits formed in the lower parts of a brittle crust. According to recent studies, most plutons are not ‘big-tank’ magma chambers but, rather, they are constructed by amalgamation of small magma pulses (Glazner et al. Reference Glazner, Bartley, Coleman, Gray and Taylor2004; Sheibi et al. Reference Sheibi, Bouchez, Esmaeily and Siqueira2012). For the Sarbadan and Ghahan granitoids, the E–W trend was located in a shear zone developed between the Indes and Talkhab faults (Fig. 15a). Minimum stresses, which are perpendicular to the main stress, act in a tensional manner. At Tafresh, the main NE–SW stress was parallel to the compression of Eurasian–Arabian block convergence (Fig. 15b). In this regard, we suggest that the Sarbadan and Ghahan granitoids were emplaced in a shear zone during an extensional opening phase. Evidence such as the pattern of emplacement of the Ghahan and Sarbadan stocks indicates that the main stress in the study area had a NE–SW trend and is parallel to the compressional stress induced by Eurasian–Arabian block convergence. Therefore, the Indes and Talkhab faults in Miocene time were active by left-lateral strike-slip movement (Fig. 15b). Coming back to the geological context and the AMS results obtained from the present study, we infer that the dextral shear zone tectonics in the UDMA might have given rise to local extensional voids or tensional gashes, into which the magma was emplaced. A simple shearing system created trends of individual plutons that are similar to the trend of widespread UDMA magmatism. We infer that the younger, more fractionated Sarbadan stock was emplaced later than the older, less fractionated Ghahan stock.

Fig. 15. (a) Location and movement of the Indes and Talkhab faults in the Tafresh area, and (b) the idealized model for emplacement of the Tafresh granitoids.
6.c. Structural significance
Structural investigation and modelling suggest a direct relationship between magma movement and emplacement along strike-slip (Corti et al. Reference Corti, Moratti and Sani2005), tensional (Hutton, Reference Hutton1988), transpressional (De Saint-Blanquat et al. Reference De Saint-Blanquat, Tikoff, Teyssier, Vigneresse, Holdsworth, Strachan and Dewey1998) and transtensional (Guineberteau et al. Reference Guineberteau, Bouchez and Vigneresse1987) faults. Study of internal fabrics of plutonic complexes provides insight into regional tectonics, since magmatism can be associated with both compressional and extensional phases of an orogeny (Brown & Solar, Reference Brown and Solar1998; De Saint-Blanquat et al. Reference De Saint-Blanquat, Tikoff, Teyssier, Vigneresse, Holdsworth, Strachan and Dewey1998).
Iran is located within the convergence domain between the Arabian and Eurasian plates (Regard et al. Reference Regard, Bellier, Thomas, Bourles, Bonnet, Abbassi, Braucher, Mercier, Shabanian, Soleymani and Feghhi2005). Movement of the Arabian plate was directed approximately N–S to N010E on average, relative to Eurasia (Masson et al. Reference Masson, Anvari, Djamour, Walpersdorf, Tavakoli, Daignières, Nankali and Van Gorp2007; Agard et al. Reference Agard, Omrani, Jolivet, Whitechurc, Vrielynck, Spakman, Monié, Meyer and Wortel2011). Shortening occurred in a SW–NE direction across the orogen during Mesozoic and Cenozoic times. Convergence between Arabia–Eurasia resulted in NW-trending parallel tectono-metamorphic and magmatic belts, among these being the SSZ and the UDMA (Berberian & Berberian, Reference Berberian, Berberian, Gupta and Delaney1981; Berberian & King, Reference Berberian and King1981; Berberian et al. Reference Berberian, Muir, Pankhurst and Berberian1982). Subduction of the Neo-Tethys oceanic plate beneath the Eurasian plate was accompanied by Triassic–Jurassic Andean-like arc magmatism in the SSZ that had therefore been active at least 150 Ma prior to collision. The NW-trending SSZ, one of the youngest continental collision zones on Earth, is characterized by an extensive magmatic history. The collision occurred during closure of the Neo-Tethys Ocean between the Arabian and Eurasian plates (Berberian, Reference Berberian1995; Golonka, Reference Golonka2004).
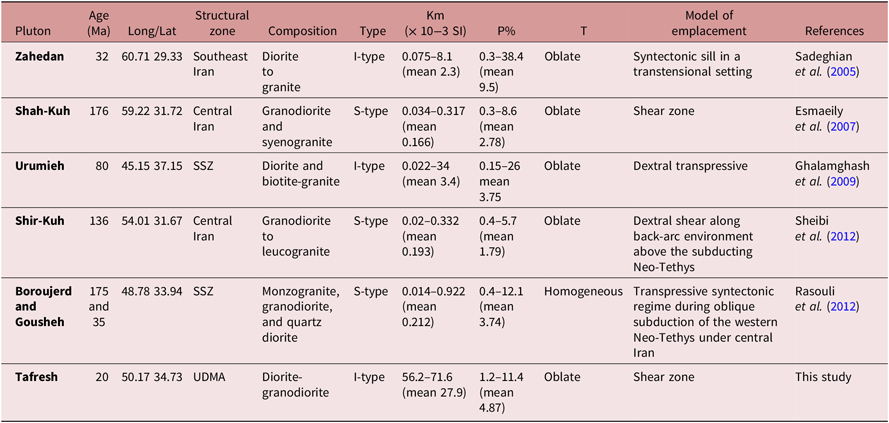
T versus P%, T versus Km, and Frequency versus Km plots on the different granitoids from Iran are shown in Figure 16. Compilations of AMS data for Iranian granitoids (Table 4) show that although the plutons differ in age and structural and magmatic type, they are emplaced by similar mechanisms. Strike-slip movements within or close to most of the oblique magmatic arcs and contraction structures are often found in fore-arc and back-arc environments (De Saint-Blanquat et al. Reference De Saint-Blanquat, Law, Bouchez and Morgan2001). Strike-slip faulting is observed in many volcanic structures of magmatic arcs (Beck, Reference Beck1983). In central Andean arcs (Mégard, Reference Mégard1987) and Japan (Lallemand & Jolivet, Reference Lallemand and Jolivet1986), for example, strike-slip deformation occurs on the surface. Strike-slip tectonics can be associated with a subduction zone in two ways: (1) the linear trend parallel to the margin of the magmatic arc, and (2) high heat flow in an arc due to magma transfer that forms a weak zone along with the continental lithosphere (Jarrard, Reference Jarrard1986). Shear displacements indicate the intensity and importance of regional fractures and associated magmatism.
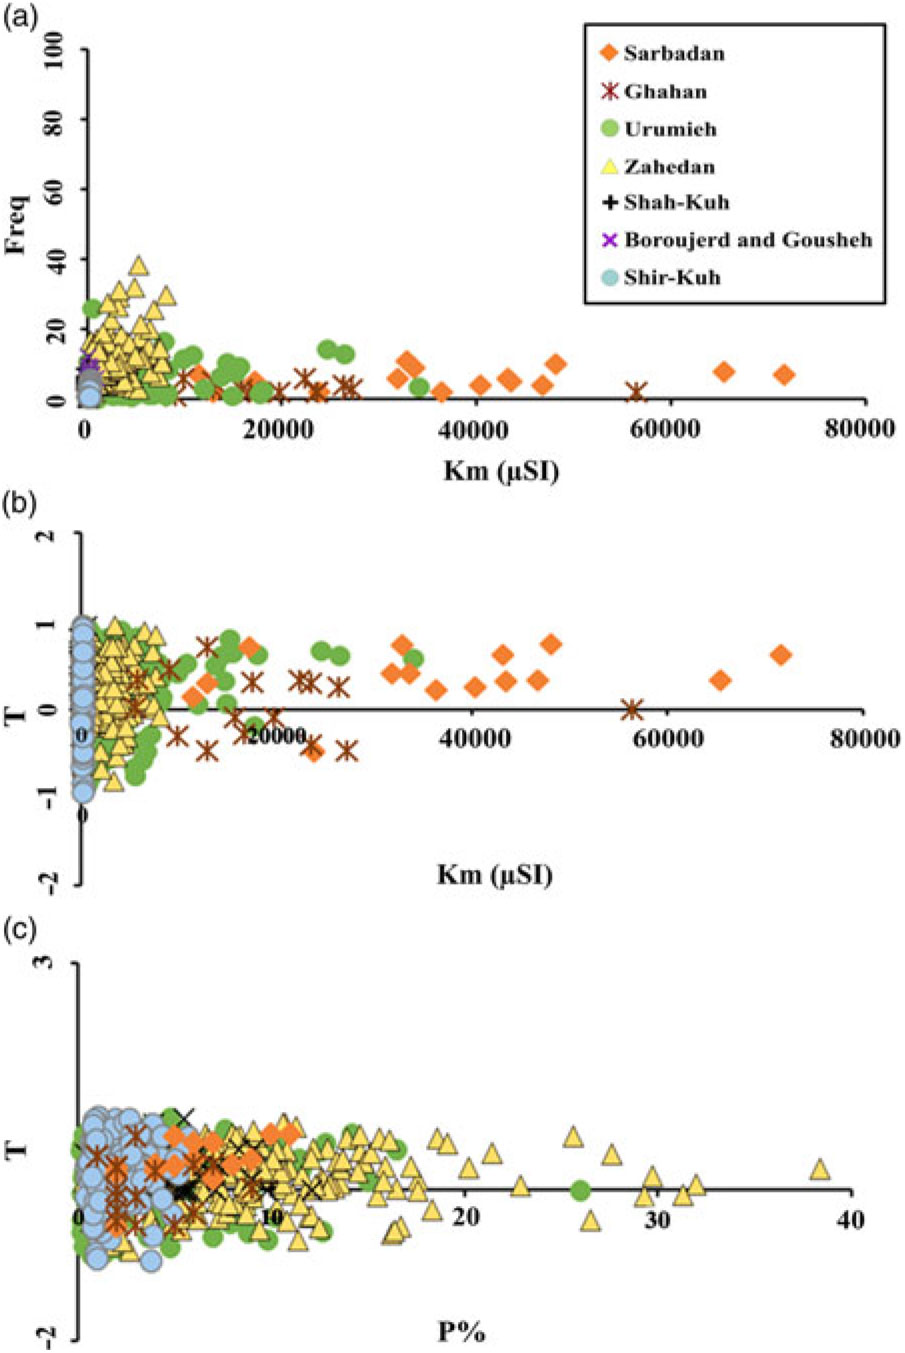
Fig. 16. Magnetic parameter diagrams. (a) Frequency v. Km; (b) T v. Km; (c) T v. P%.
Table 4. A summary of the AMS results on intrusive rocks in Iran
7. Conclusions
(1) Sub-intrusive and intrusive rocks of the diorite–quartz diorite Sarbadan and granodiorite Ghahan stocks in the Tafresh area show porphyritic, granular to sub-granular textures. Enriched LREE patterns, high abundances of LILEs and depletion in HFSEs with significant negative Nb and Ta anomalies suggest that Early Miocene magma at Tafresh formed during subduction activity.
(2) High values of the Km (>5 × 10⁻³ SI) and geochemical data indicate that the Tafresh stocks are classified as ferromagnetic and I-type granitoids.
(3) Magnetic lineations indicate that each stock contains distinct feeder zones that were opened as a consequence of extension.
(4) Magnetic data and structural evidence show that shear zones had caused an opening, facilitating consequent migration, ascent and emplacement of granitoid magmas in the Tafresh area during an extensional phase.
(5) The E–W trend of the Sarbadan and Ghahan stocks and their emplacement in the middle part of the UDMA developed between the Indes fault and Talkhab fault as a product of tensional stress in a brittle tectonic regime, ancillary to compressional stresses induced by Eurasian–Arabian block convergence.
(6) Compilation of several studies dealing with mechanisms of magma emplacement in Iran confirms that magma was emplaced during a transpressive to transtensional episode during oblique subduction of the western Neo-Tethys beneath central Iran. Structural investigation of these studies emphasizes a direct relationship between the faults and magma movements and emplacement along strike-slip faults. This shear deformation along the main faults of Iran can be attributed to the convergence between the major Arabian–Eurasian continental blocks.
Acknowledgements
Dear Prof. Jean Luc Bouchez kindly reviewed an earlier version of this manuscript. We are very grateful to suggestions and helpful discussions by Prof. Mohsen Eliasi and Prof. Reza Nozaeim on tectonic topics in this paper. Dear Prof. Leon E Long is so appreciated for proofreading and editing the revised manuscript. We would like to thank Prof. Chad Deering for editorial handling of the paper and two anonymous reviewers for their in-depth reviews and constructive comments.