


The InSight Mission
In 2012, NASA selected InSight (Interior Exploration using Seismic Investigations, Geodesy and Heat Transport, Banerdt et al. Reference Banerdt, Smrekar, Banfield, Giardini and Golombek2020) as the 12th Discovery mission, almost 30 years after the end of Viking 2 operation. With the seismic suite SEIS (Seismic Experiment for Interior Structure of Mars) as the primary instrument (Lognonné et al. Reference Lognonné, Banerdt, Giardini, Pike and Christensen2019, Reference Lognonné, Banerdt, Pike, Giardini and Christensen2020), the mission aimed to deploy the first Martian geophysical station equipped with a Very-Broad Band (VBB) seismometer and a Short-Period (SP) seismometer, both instruments were comparable to the highest quality seismometers operating on Earth. Additional payload elements were a geodesy sensor, RISE), a heat-flow experiment (HP3), a three-axis magnetometer, a set of wind and pressure sensors for observing the Martian atmosphere and providing crucial evidence for discriminating seismic events from other noise sources (APSS, Banfield et al. Reference Banfield, Spiga, Newman, Forget and Lemmon2020), and the robotic arm and cameras used to deploy SEIS on the ground (Banerdt et al. Reference Banerdt, Smrekar, Banfield, Giardini and Golombek2020).
Launched on 5 May 2018, InSight landed successfully in Elysium Planitia (Golombek et al. Reference Golombek, Warner, Grant, Hauber and Ansan2020) on November 26, 2018 and deployed its seismometer by February 2019. SEIS is still operating successfully at the time of writing, in August 2022. Figure 1 shows a composite picture of the InSight lander on Elysium Planitia before the installation of SEIS on the ground.
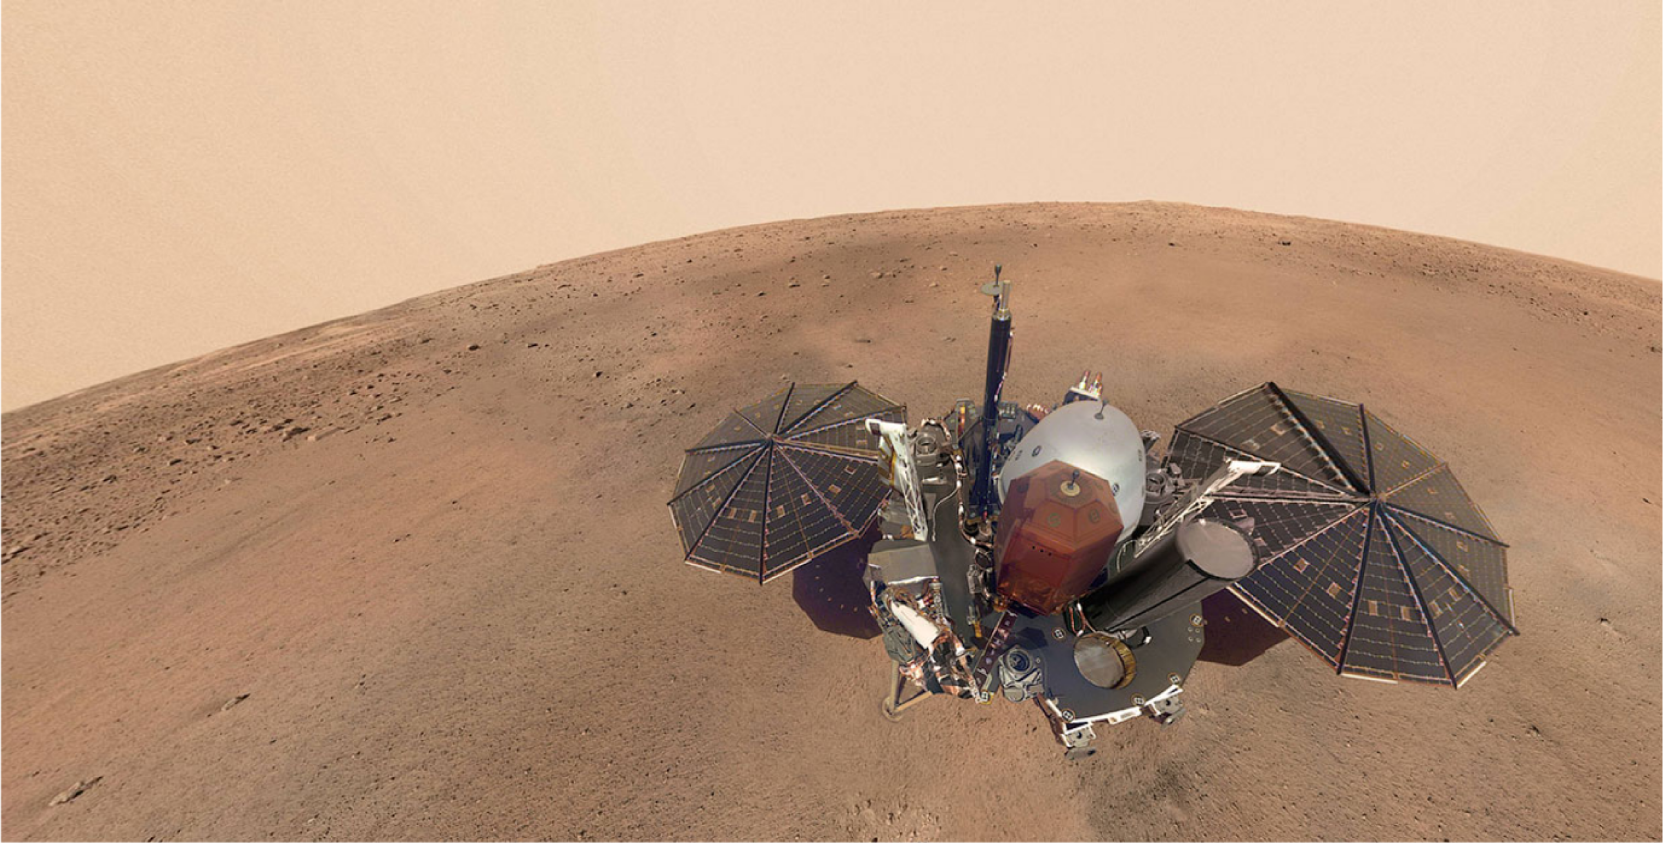
Figure 1. A selfie from Mars, built with composite images from the IDC camera, showing the InSight lander before the deployment of SEIS on the ground. (Source NASA; https://mars.nasa.gov/insight/resources/22211/insights-first-selfie/).
Data Collection
The nominal mission duration for InSight was a full Martian year, which was reached on sol 668 (a sol is a Mars day and equals 24 h and 39 min on Earth). InSight has managed to operate well beyond this period, and we have now reached sol 1325.
InSight is powered by two solar panels. With dust accumulating on these panels, the available power for InSight has steadily decreased over time. The cleaning events from local dust devils, as seen at other Martian landers (Lorenz et al. Reference Lorenz, Spiga, Lognonné, Plasman, Newman and Charalambous2021), had been expected to occur for InSight but have unfortunately not been observed. By late 2020, solar power generation had reduced to the extent that scientific instruments started to be turned off. Around this time, the magnetometer, wind speed, wind direction and pressure sensors were no longer operating continuously.
Ceylan et al. (Reference Ceylan, Clinton, Giardini, Böse and Charalambous2021) and Clinton et al. (Reference Clinton, Ceylan, van Driel, Giardini and Stähler2021) summarize the characteristics of the seismic data and of the seismicity collected up to sol 478. For the majority of the mission, and until the SP seismic sensor was turned off on sol 789, the VBB sensor was acquired at 20 sample-per-second (sps) and transmitted to Earth continuously (InSight Mars SEIS Data Service 2019). The SP sensor was acquired at 100 sps, but only transmitted to Earth in short windows via specific requests. The MarsQuake Service (MQS) routinely requested the 100 sps SP data for each identified marsquake. Once SP was switched off, the VBB was acquired at 100 sps, and since then we have 20 sps VBB transmitted continuously with some event-based VBB data at 100 sps for significant marsquakes. A notable gap of 21 sols occurred during the solar conjunction in the first Martian year due to InSight entering safe mode with all science payload turned off. The data were fully collected over the conjunction in the second Martian year.
Following the completion of the deployment and commissioning phases, both the VBB and SP seismometers exceeded the mission target noise levels (Lognonné et al. Reference Lognonné, Banerdt, Giardini, Pike and Christensen2019, Reference Lognonné, Banerdt, Pike, Giardini and Christensen2020). In addition, the steps of placing SEIS on the Martian surface and then covering with the wind and thermal shield (WTS) on sol 76 both led to significant noise reduction (Clinton et al. Reference Clinton, Ceylan, van Driel, Giardini and Stähler2021). Nevertheless, SEIS is still sensitive to the effects of the local weather perturbations, which is evident in diurnal patterns in the seismic recordings.
The average sol displays rather predictable seismic noise during the spring and summer in the northern hemisphere, with turbulent winds observed each afternoon and resulting in very high seismic noise. This period is followed by a sharp decline in the noise level shortly before sunset, with subsequently the quietest period of each sol lasting for a few hours. Light winds cause an increase in the noise level in the early morning. The background seismic noise increases in the whole sol during the autumn and winter seasons at the InSight landing site, reducing the observations to a few large quakes with a high signal-to-noise ratio. To date, the background noise patterns closely repeat the first Martian year, with minor perturbations even repeating on the same sol one Martian year later.
An overview of noise sources and artefacts was given by Ceylan et al. (Reference Ceylan, Clinton, Giardini, Böse and Charalambous2021) as observed in the data until sol 478. A specific group of artefacts, named glitches (broadband spikes), are the most dominant features in the seismic data.
MQS Operations
The MarsQuake Service is one of the vital ground segment support services of the mission (Clinton et al. Reference Clinton, Giardini, Böse, Ceylan and van Driel2018, Reference Clinton, Ceylan, van Driel, Giardini and Stähler2021). The MQS team comprises researchers from the InSight science team, with its operations based at ETH Zurich. The team is responsible for a prompt routine data review, detecting the seismic signals, locating quakes, and curating the seismicity catalogue. When a signal of potentially seismic origin is identified, MQS investigates possible contamination in the waveforms that may exist due to atmospheric disturbances. If weather sensors are operational during the event, seismic data are checked against pressure and wind channels. Otherwise, MQS utilizes the excitation of lander modes as seen in the seismic data, which are very well correlated with wind speed (Dahmen et al. Reference Dahmen, Zenhäusern, Clinton, Giardini and Stähler2021; Charalambous et al. Reference Charalambous, Stott, Pike, McClean and Warren2021).
The event detection tools were developed and tested before launch (Clinton et al. Reference Clinton, Giardini, Lognonné, Banerdt and van Driel2017; van Driel et al. Reference van Driel, Ceylan, Clinton, Giardini and Alemany2019) and have been updated to account for the conditions observed in marsquake records (Lognonné et al. Reference Lognonné, Banerdt, Pike, Giardini and Christensen2020; Giardini et al. Reference Giardini, Lognonné, Banerdt, Pike and Christensen2020). Although not as strong as on the Moon, scattering smooths impulsive arrivals and reduces the number of events with clear ballistic phases (Lognonné et al. Reference Lognonné, Banerdt, Pike, Giardini and Christensen2020; Menina et al. Reference Menina, Margerin, Kawamura, Lognonné and Marti2021; Karakostas et al. Reference Karakostas, Schmerr, Maguire, Huang and Kim2021). In addition, waveforms are often contaminated by atmospheric disturbances, glitches and other non-seismic features of the SEIS data. Clinton et al. (Reference Clinton, Ceylan, van Driel, Giardini and Stähler2021) and Ceylan et al. (Reference Ceylan, Clinton, Giardini, Böse and Charalambous2021, Reference Ceylan, Clinton, Giardini, Stähler and Horleston2022) provide all details on the techniques implemented by MQS.
When an event is confirmed, MQS provides seismic phase arrival times depending on the event type, quality, distance and magnitude. These include crustal Pg and Sg phases (where P and S are the primary and secondary seismic phases observed also in earthquakes); mantle-going P and S arrivals, or PP and SS for more distant large events (PP and SS are mantle-going P and S phases bouncing at the surface before reaching the station; their surface reflections (PP, SS, PPP, SSS) when detected for larger events. Other phases traveling in the deep mantle and at the core–mantle boundary have also been reassessed for the purpose of interior model inversions.
The MQS updates and releases a new version of the marsquake catalogue every three months, accompanying the periodic release of the data; the most recent version is catalogue V11, released on 30 June 2022 (InSight Marsquake Service 2022). Clinton et al, (Reference Clinton, Ceylan, van Driel, Giardini and Stähler2021) and Ceylan et al. (Reference Ceylan, Clinton, Giardini, Stähler and Horleston2022) provide all details on the catalogues up to catalogue V09. This Plenary Lecture is largely based on catalogue V11, with the addition of the events recorded until sol 1325.
Event Classification
MQS classifies events by their frequency content. At low amplitudes, when winds are low, the InSight data are characterized by a resonance at 2.4 Hz, which is also strongly excited during seismic events and is due to the shallow geological layering at the station site (Dahmen et al. Reference Dahmen, Zenhäusern, Clinton, Giardini and Stähler2021; Hobiger et al. Reference Hobiger, Hallo, Schmelzbach, Stähler and Fäh2021).
MQS and the InSight mission have developed the following event classification, reflecting the frequency content of the signal but also the origin of the events.
The low frequency (LF) family of events include energy predominantly below 1 Hz; they are similar to teleseismic events observed on Earth, where P and S waves are often identified; a few LF events have broad-band frequency content up to 2.4 Hz (BB).
The high frequency (HF) family of events are predominantly at and above 2.4 Hz. These events include phases that are assigned to be Pg and Sg and interpreted as crustal guided waves (Giardini et al. Reference Giardini, Lognonné, Banerdt, Pike and Christensen2020; van Driel et al. Reference van Driel, Ceylan, Clinton, Giardini and Horleston2021). A large number of smaller HF events are visible only on the 2.4 Hz amplification, and are termed as ‘2.4 Hz’ events.
A small number of HF events are characterized by higher frequency content, up to 20–30 Hz, and a notable amplification on the horizontal components at very high frequency, and are termed VF events.
Finally, super high frequency (SF) events are very short duration events with energy above 5 Hz. mostly on horizontal components; they occur predominantly around sunset on Mars and are interpreted as local thermal cracking (Dahmen et al. Reference Dahmen, Clinton, Ceylan, van Driel and Giardini2020).
In addition to the event type, an event quality is assigned to each event, ranging from QA (best – located) to QD (worst – very weak energy, possibly speculative).
The naming of the events is assigned based on the sol of occurrence, counting from the day of landing, and a letter indicating how many events were recorded on that sol; S0235b is then the second seismic event recorded on sol 0235.
Table 1 gives the numbers and types of events recorded until sol 1325. In addition, several hundred SF events have been recorded.
Table 1. Numbers and types of events recorded on Mars until sol 1325

Machine Learning was recently used to explore the Martian dataset and extract events from the noisy hours on Mars. With a CNN approach and synthetic marsquake training dataset, Dahmen et al. (Reference Dahmen, Clinton, Meier, Stähler and Kim2022) generated a catalogue replicating about 90% of MQS events and extending the total number by 60%. These additional events, and others obtained by other teams, will be added in future catalogue versions.
Figure 2 displays the VBB vertical component signal recorded on sol 421. The main characteristics of the signal can be seen: (i) the noise level increasing during the day; (ii) the lander modes, appearing as horizontal lines excited by wind, not or less visible in quiet hours, with frequency modulated by temperature, not excited by seismic events (for example the prominent 4 Hz mode); (iii) the 2.4 Hz ambient resonance, a wider band of signal visible only in quiet hours, not excited by wind, excited by most seismic events, the effect of the geological layering below the station; (iv) four marsquakes recorded by MQS on sol 421: S0421a, VF QB; S0421b, LF QC; S0421c/d, 2.4 Hz QD.

Figure 2. The VBB-Z SEIS recording of sol 421 on Mars, displayed as a spectrogram in the 0.02–10 Hz range.
A summary plot of the broadband signal recorded by the VBB vertical component on Mars is displayed in Figure 3. Each horizontal line shows the sol-long acceleration spectrogram. The LF and HF families are marked with symbols, while the event qualities are indicated by colour according to the legend. The plot covers the period from sol 72, after the installation and commissioning of SEIS on ground and shortly before the WTS was placed and SEIS started continuous recording, up to sol 1325.

Figure 3. Summary plot showing the broadband noise evolution recorded by VBB vertical component on Mars. The background image comprises a stack of sol-long acceleration spectrograms for frequencies 0.05–4 Hz. The x-axis is the local mean solar time (LMST). The InSight sols and corresponding solar longitudes (Ls) with Martian seasons in the northern hemisphere are shown on the y-axis. Sol 72-740 (dashed line) is the first full Martian year of high-quality data. The white regions on the spectrograms are data gaps, the largest being the solar conjunction.
A summary image showing the evolving Martian background noise as recorded by the VBB vertical component as well as the occurrence, amplitude and distances of LF family (top) and HF family (bottom) marsquakes in the V11 catalogue is shown in Figure 4. Symbols indicate the marsquake event type and the colour bar shows event distances. Note the clear evolution of noise amplitudes across the seasons and the repeating noise levels from year to year. The first full Martian year ends on sol 740, indicated by the vertical dashed line. The extended periods of low noise in spring and summer coincide with the routine detection of HF events.

Figure 4. Summary image showing the evolving Martian background noise as recorded by the VBB vertical component as well as the occurrence, amplitude and distances of LF family (top) and HF family (bottom) marsquakes in the V12 catalogue. Symbols indicate the marsquake event type and the colour bar shows event distances. Percentiles of the noise for each sol are indicated.
Event Location
Marsquakes are located by determining distance and back-azimuth. When phases are confirmed to be P and S arrivals or their surface reflections (PP and SS, respectively), the event distance is computed following the probabilistic single-station location algorithm (Khan et al. Reference Khan, van Driel, Böse, Giardini and Ceylan2016; Böse et al. Reference Böse, Clinton, Ceylan, Euchner and van Driel2017) using initially a set of a priori interior models. Since V9, the distance estimates for LF-BB family events in the MQS catalogue use new interior models based on the inversion of multiple body wave phases (Stähler et al. Reference Stähler, Khan, Banerdt, Lognonné and Giardini2021).
The models used for distance determination result from different inversion approaches:
(1) A seismic approach producing a model of linear velocity gradients to fit travel times.
(2) A geophysical parametrization that fits the travel times against interior models from thermodynamical modelling (Khan et al. 2018); these models allow for a variation of mineralogical compositions, but use an adiabatic temperature profile.
(3) A geodynamical parametrization, similar to (2), but restricted to one composition; the temperature profile is based on 1D convection simulations (Samuel et al. Reference Samuel, Ballmer, Padovan, Tosi, Rivoldini and Plesa2021).
Each approach produced 100 velocity models by Markov Chain Monte Carlo inversion. Together, these 300 models are used to determine the MQS distances and provide a distance uncertainty.
In Figure 5 we display (a) the travel time curves for P- and S-waves, their surface reflections (PP, PPP and SS, SSS), core reflected (PcP and ScS) and core diffracted (Pdiff, Sdiff) phases for a source at 50 km depth, and (b) the corresponding ray paths of the seismic phases.

Figure 5. Theoretical arrival times for major seismic phases using a reference model from Stähler et al. (Reference Stähler, Khan, Banerdt, Lognonné and Giardini2021). (a) Travel time curves for P- and S-waves, their surface reflections (PP, PPP and SS, SSS), core reflected (PcP and ScS) and core diffracted (Pdiff, Sdiff) phases for a source at 50 km depth. Black crosses denote the seismic phase picks used in Khan et al. (Reference Khan, Ceylan, van Driel, Giardini and Lognonné2021) for body-wave multiples, and purple crosses show core reflected ScS phases as reported in Stähler et al. (Reference Stähler, Khan, Banerdt, Lognonné and Giardini2021). Grey circles are seismic phase picks of MQS used for locating the events. (b) Ray paths of the seismic phases shown in panel (a).
In addition, a first-order determination of distance and origin time was obtained by visually aligning the events on the travel times, initially presented in Giardini et al. (Reference Giardini, Lognonné, Banerdt, Pike and Christensen2020). The approach relies on identifying similarities amongst seismic events via visual inspection of spectral envelopes, and weaker events are positioned in distance relative to well-located quality A events, which are used as distance anchoring points. This provides an opportunity to review existing phase-based distances, and assign distances to events too weak to have a phase-picked distance estimate. Alignment is a practical way of visualizing an overview of seismic events relative to each other, providing an alternative for interpreting the seismicity, specifically for the events that could not be fully located by MQS. It helps to classify the events that are similar to each other for further analysis and their relative positions in the distance–travel time domain. So far, alignments have been efficiently employed for distance and magnitude determination (Böse et al. Reference Böse, Stähler, Deichmann, Giardini and Clinton2021), broad structural interpretations (Giardini et al. Reference Giardini, Lognonné, Banerdt, Pike and Christensen2020), and as a gateway for picking additional seismic phases (Khan et al. Reference Khan, Ceylan, van Driel, Giardini and Lognonné2021). An alignment example applied to high-frequency family events, HF and VF, is shown in Figure 6. The event’s back-azimuth was obtained using polarization analysis of the primary body waves (Böse et al. Reference Böse, Clinton, Ceylan, Euchner and van Driel2017; Zenhäusern et al. Reference Zenhäusern, Stähler, Clinton, Giardini, Ceylan and Garcia2022).

Figure 6. Envelopes for quality B high-frequency family events. (a) HF and VF aligned on the Sg arrivals, sorted by distance with regular spacing; and (b) HF and 2.4 Hz events ordered by Ts-Tp differential times. The events reported in the V3 catalogue are plotted in grey, while coloured envelopes show V9 events. The envelopes are normalized and computed using the vertical component of VBB. The figure follows van Driel et al. (Reference van Driel, Ceylan, Clinton, Giardini and Alemany2019).
Magnitude Assessment
Magnitudes were computed for all events that have an estimated distance, with several scales based on P- and S-wave peak amplitudes for LF-BB events, and the maximum amplitude of excitation around the 2.4 Hz resonance for HF events. The magnitude relations for marsquakes were first derived by Böse et al. (Reference Böse, Giardini, Stähler, Ceylan and Clinton2018) using synthetic seismograms produced for a set of pre-launch Martian models that are also listed in Ceylan et al. (Reference Ceylan, van Driel, Euchner, Khan and Clinton2017). In Giardini et al. (Reference Giardini, Lognonné, Banerdt, Pike and Christensen2020), these pre-landing relations were updated to better reflect the actual content of marsquakes, and subsequently adopted by Clinton et al. (Reference Clinton, Ceylan, van Driel, Giardini and Stähler2021) for catalogue V3 and used until catalogue V7. Böse et al. (Reference Böse, Stähler, Deichmann, Giardini and Clinton2021) updated these scaling relations using real data from 485 marsquakes that occurred up to October 2020.
As on Earth, the preferred magnitude type on Mars is the moment magnitude MWMa, derived depending on the event type and regressing all magnitude scales to a common scale. The largest events recorded on Mars reach or exceed MWMa 4.0, such as the S0976b VF event and the S1000a and S1094b LF-BB events; with MWMa 4.7, S1222a is the largest event recorded so far. In addition to magnitudes, a direct estimation of the seismic moment M0 has been obtained for the larger LF-BB events by inverting for the whole Moment Tensor (Brinkmann et al. 2021; Jacob et al. Reference Jacob, Plasman, Perrin, Fuji and Lognonné2022). Figure 7 displays magnitude (MWMa) for the events up to sol 1325. For several LF-BB events in the 80–100° distance, the distance is only indicative and may change significantly in future releases of the catalogue.

Figure 7. Distance and Mars-calibrated moment magnitude MWMa distribution of the events recorded in catalogue V11. The magnitudes were computed following Böse et al. (Reference Böse, Stähler, Deichmann, Giardini and Clinton2021). Markers with thicker edges indicate the events that have a distance from alignments; other events have been located using the MQS phase picks.
Meteoric Impacts
The detection of meteoric impacts was one of the declared goals of InSight, and recently the first impacts have been detected and located by InSight on Mars. For four VF seismic events closer than 300 km, dispersive acoustic signals propagating along an acoustic waveguide were detected in the form of dispersive chirps with strong elliptical polarization pointing toward the impact source (Garcia et al. Reference Garcia, Daubar, Beucler, Posiolova and Collins2022). This allowed us to qualify the events as impacts and to locate them using differential times between seismic P and S and acoustic waves and atmospheric models. CTX and HiRISE images confirmed fresh craters in the error ellipses of the locations (Garcia et al. Reference Garcia, Daubar, Beucler, Posiolova and Collins2022). Investigations are being conducted to understand if other VF events can be confirmed as impacts.
An Overview of the Seismicity of Mars
The first overview of the Mars seismicity was provided by Giardini et al. (Reference Giardini, Lognonné, Banerdt, Pike and Christensen2020). Here we comment on our present understanding of the seismicity of Mars for the three classes of events LF-BB, HF and VF, as illustrated in Figures 7, 8 and 9, displaying the distribution of magnitude with distance, the map of the located seismicity and the source spectra of four significant events.

Figure 8. Map of seismicity on Mars. The orange triangle marks the position of the InSight lander. Black ellipses indicate LF family event location uncertainty ellipses from the catalogue V11 MQS, with additional events from Zenhäusern et al. (Reference Zenhäusern, Stähler, Clinton, Giardini, Ceylan and Garcia2022) and Drilleau et al. (Reference Drilleau, Samuel, Garcia, Rivoldini and Perrin2022). Purple diamonds indicate close-by VF events detected by SEIS and confirmed as impacts by satellite imaging. The white circle indicates the location of the HF event cluster. The dotted white line at 26° distance from InSight indicates the distance of complete observation of VF events from the lander. Background colour map uses Mars Orbiter Laser Altimeter elevation data.

Figure 9. Displacement spectra for three-component VBBs, calculated using Welch’s method using a window length of 25 s and 50% overlap. The time windows for noise and phases are hand-picked.
LF-BB
The hypocentre is known for about half of the recorded LF-BB events, owing to the difficulty of determining back-azimuth and in some cases also distance for the smaller events. The following elements are now understood.
Seismicity appears to be located only in few spots around Mars and no events were located within 25° from the InSight station.
A large number of LF-BB events are located at a distance of 26–30° from the station, resulting in the arc shape centred in the Cerberus Fossae region visible in the map view in Figure 8 (Ceylan et al. Reference Ceylan, Clinton, Giardini, Stähler and Horleston2022; Drilleau et al. Reference Drilleau, Samuel, Garcia, Rivoldini and Perrin2022; Zenhäusern et al. Reference Zenhäusern, Stähler, Clinton, Giardini, Ceylan and Garcia2022). Since the circular shape is likely the result of the uncertainty in back-azimuth determination, these events are interpreted to be associated with the active dynamics of the volcanic Cerberus Fossae area (Jacobs et al. Reference Jacob, Plasman, Perrin, Fuji and Lognonné2022). These marsquakes show relatively clear P and S energy in the envelopes.
A group of events show only a weak S-wave energy and are aligned using the P-wave and length of its coda in the spectral envelopes around 46°.
A few events are located around 60° with relatively emergent P- and S-wave energy, and are anchored by the S0185a event.
Two large events (S0976a and S1000a) lie beyond the core shadow and have PP and SS phases (Horleston et al. Reference Horleston, Clinton, Ceylan, Giardini and Charalambous2022). MQS located S0976a in the Valles Marineris region 146° away from InSight.
The events aligned at distances 80–100° in Figure 7 are positioned only using their S-wave coda length along the reference S-arrivals. These events are generally noisy with unclear P-energy that is at or below the noise level. Their S-wave coda is relatively long.
LF family events have the largest magnitudes with S1222a reaching MWMa 4.7 and 3 others at or above M4.0.
HF
The high-frequency seismic phases are identified as slope breaks on vertical component envelopes centred on the 2.4 Hz resonance. Often, two clear and separated phases are observed. The excitation of the 2.4 Hz resonance is interpreted as trapped energy within the layered Martian crust (Giardini et al. Reference Giardini, Lognonné, Banerdt, Pike and Christensen2020; van Driel et al. Reference van Driel, Ceylan, Clinton, Giardini and Horleston2021); therefore, these phases are labelled as Pg and Sg, respectively, following the phase naming nomenclature for Earth. The first comprehensive analysis of van Driel et al. (Reference van Driel, Ceylan, Clinton, Giardini and Horleston2021) and the alignment presented in Figure 6 show that the HF events all originate from a distance range of only a few degrees, in the 25–30° range, with magnitudes below MwMa 2.5. Stähler et al. (Reference Stähler, Mittelholz, Perrin, Kawamura and Kim2022) find that the HF events have also similar back-azimuth and propose that all HF events originate from a single area in the central Cerberus Fossae region, as very shallow events associated with large active volcanic dykes. The largest HF family event (S0976b) was also observed on the same sol as the most distant marsquake, coincidentally.
VF
VF events are observed close to the lander. While a few larger events have been detected up to a distance of 35°, the majority of them were located within 26° distance. Remote imaging of recent craters and the presence of a distinctive signal confirmed that the closest events were produced by meteoric impacts (Garcia et al. Reference Garcia, Daubar, Beucler, Posiolova and Collins2022). Only one VF (S0976b) at 16° reaches MWMa 4, although another high-amplitude VF signal was located at 50 km from InSight, with MWMa 3 (S1034a). To illustrate the differences and similarities among these different types of events, Figure 9 compares the displacement spectra for some of the most significant events recorded on Mars, including a large LF in the Cerberus Fossae region (S0173a) with signal typically visible up to 1 Hz, the largest distance event at over 140° distance from the station (S0976a), a large distant event (S1000a), the largest marsquake recorded by InSight, with MWMa 4.7 (S1222a) and the largest VF event (S0976b). The large variability in noise and signal levels and the corresponding frequency range of signal available for detection and analysis can be noted.
Data Availability
The InSight seismic event catalogue versions and waveform data (SEISdata2019, Marsquake catalogues V1-V12) are available from the IPGP Datacenter and IRIS-DMC. Seismic waveforms are also available from NASA PDS (National Aeronautics and Space Administration Planetary Data System) (https://pds.nasa.gov/).
Acknowledgements
The advancement in the understanding of the seismicity and internal structure of Mars since the landing of InSight is the result of the work and analysis of the Marsquake Service and the whole InSight Team, as published in numerous papers and reports. This manuscript is InSight contribution number 308. We acknowledge NASA, CNES, their partner agencies and Institutions (UKSA, SSO, DLR, JPL, IPGP-CNRS, ETHZ, IC, MPS-MPG) and the flight operations team at JPL, SISMOC, MSDS, IRIS-DMC and PDS for providing SEED SEIS data. The InSight event catalogue and waveform data are available from the IRIS-DMC, NASA-PDS, SEIS-InSight data portal and IPGP data centre. The majority of visualizations are prepared using the matplotlib library.
About the Authors
Domenico Giardini is Professor of Seismology and Geodynamics in the Department of Earth Sciences, ETH Zurich. He is the PI of the SEIS Electronic Box and leads the MarsQuake Service, is in charge of the routine detection and characterization and identification of marsquakes, and leads a research group working on the characterization of the seismicity and internal structure of Mars. He was elected as a Member of Academia Europaea in 2018.
Savas Ceylan is a senior researcher in the Institute of Geophysics at ETH Zurich, in charge of developing and testing the tools and techniques used in the MarsQuake Service for the detection and characterization of marsquakes.
John Clinton leads the National Seismic Network operations and monitoring for the Swiss Seismological Service at ETH Zurich. Similarly he also leads the development and operations of the MarsQuake Service for InSight.
Philippe Lognonné is Professor of Geophysics and Planetary Science at the Université Paris Cité, Institut de Physique du Globe de Paris. He is the SEIS PI and a major force behind the exploration of Mars. He leads the Mars internal structure analyses.
Simon Stähler is a senior researcher in the Institute of Geophysics at ETH Zurich, with a wide research spectrum in different aspects of planetary research, including the interior structure of Mars and the source characteristics and location of marsquakes.


