

Land use and climate change are major concerns for the sustainability of dryland ecosystems (Franz et al. Reference Franz, Caylor, Nordbotten, Rodrigueziturbe and Celia2010), which also affect the hydrological cycle in water-limited regions. The ecological and environmental degradations have been and will continue to be challenges in achieving global sustainability (Lü et al. Reference Lü, Zhang, Feng, Zeng, Fu, Yao, Li and Wu2015). In this context, ecological restoration and conservation have been implemented widely (Lü et al. Reference Lü, Zhang, Feng, Zeng, Fu, Yao, Li and Wu2015). Thus, it is necessary to assess the ecosystem responses to climate change with the restoration implemented in water-limited regions. Soil moisture is an integrative state variable that plays key roles in many ecosystem processes in water-limited regions (D'Odorico et al. Reference D'Odorico, Caylor, Okin and Scanlon2007; Wang et al. Reference Wang, Wang, Fu, Yang and Li2017b). Characterising soil moisture variability will help us understand the ecosystem responses to land use and climate change in the water-limited regions, such as the Loess Plateau in China.
The Loess Plateau is located in the upper and middle reaches of the Yellow River in China (Fig. 1). It is dominated by a monsoon climate and an obvious rainfall gradient exists across this region (Wang et al. Reference Wang, Wang, Fu, Li, Wu and Tang2017a). Due to long-term cultivation, intensive rainfall, and the complex landform, the Loess Plateau was considered one of the most severely eroded areas in the world (Lu et al. Reference Lu, Akujärvi, Wu, Liski, Wen, Holmberg, Feng, Zeng and Fu2015). Several large-scale restoration projects have been conducted to control soil erosion and restore ecological functions in the region (Liang et al. Reference Liang, Bai, Wang, Fu, Yan, Shuai, Yang, Di and Feng2015). The Grain for Green (GfG) project was implemented in 1999, which converted sloping croplands to forest and pasture lands. With the implementation of the GfG project, the land use has changed dramatically and fast-growing trees and shrubs have been introduced extensively. However, recent studies have found that introduced plants degrade over time after initial normal growth due to severe water restriction and soil desiccation (Li Reference Li2001; Yu et al. Reference Yu, Wei, Chen, Yang, Jia and Zhang2015). Soil water availability is quite important for plant growth in terms of soil water balance in the water-limited regions. Understanding the relationships between soil moisture dynamics and vegetation is essential for vegetation restoration sustainability in the Loess Plateau (Zhang et al. Reference Zhang, Zhao, Liu, Fang and Feng2016).
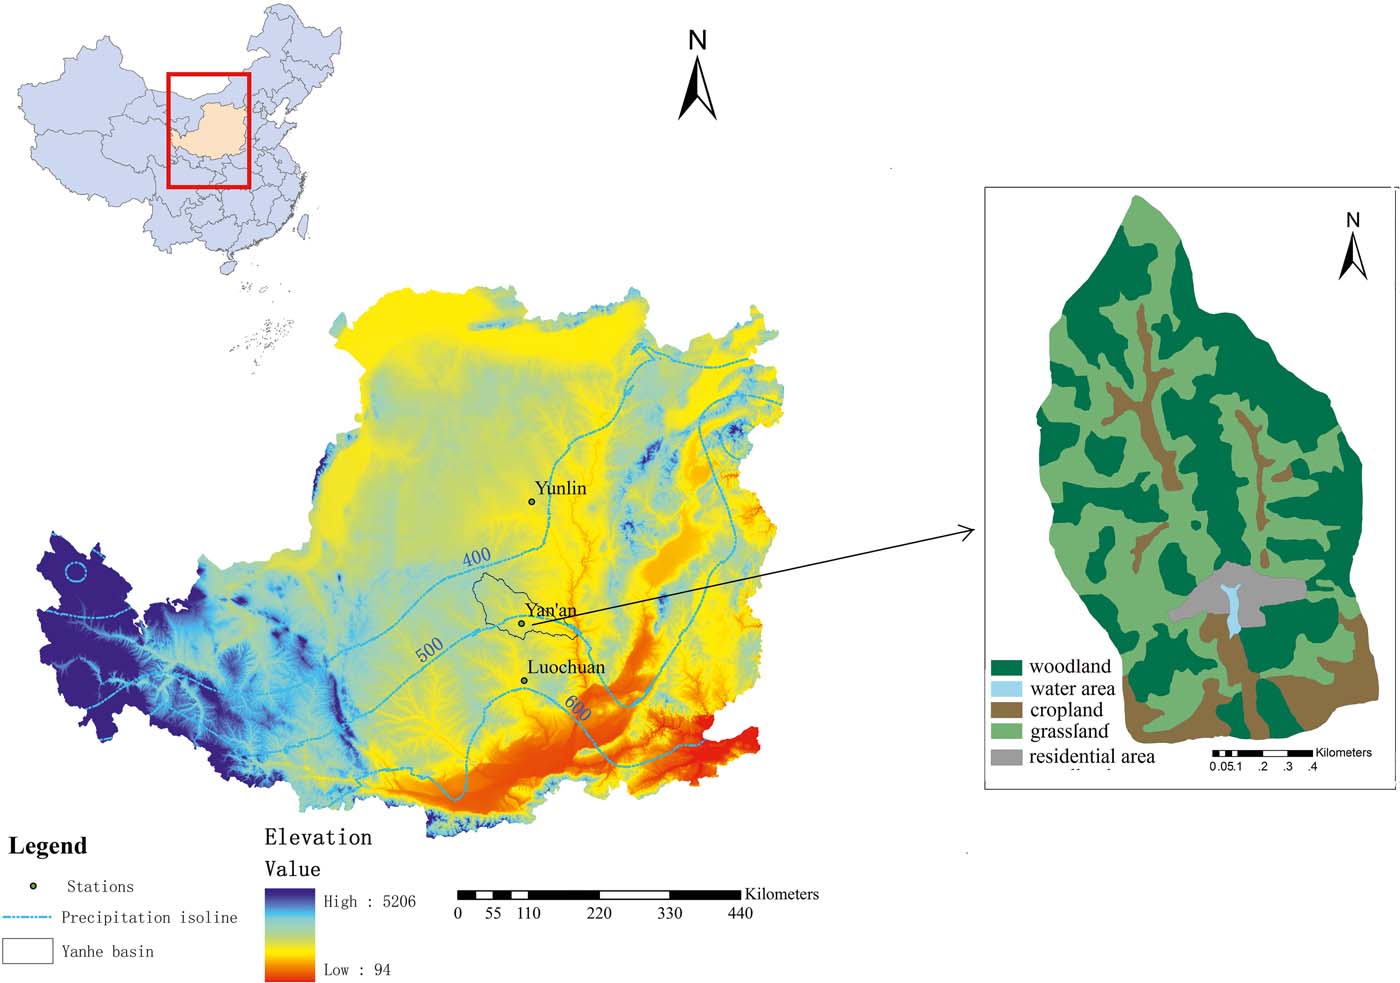
Figure 1 Location of Yangjuangou catchment and three meteorological stations in the Loess Plateau.
It has been shown that dryland ecosystems respond to shifts in rainfall climatology (Franz et al. Reference Franz, Caylor, Nordbotten, Rodrigueziturbe and Celia2010). The Loess Plateau has been found to be particularly sensitive to climate changes, due to the fragile ecological environment and geographic features (Miao et al. Reference Miao, Sun, Duan and Wang2016). Recent studies have shown that warming and drying trends exist in large areas of the Loess Plateau (Sun et al. Reference Sun, Miao, Duan and Wang2015; Miao et al. Reference Miao, Sun, Duan and Wang2016). The precipitation on wet days has decreased over large areas of the Loess Plateau during the past 50 years, which is either caused by a decrease in frequency despite a concomitant increase in rainfall intensity or caused by decreases in both intensity and frequency of rainfall (Sun et al. Reference Sun, Miao, Duan and Wang2015). Rainfall in drylands is heterogeneous in space (D'Odorico & Porporato Reference D'Odorico and Porporato2006; Franz et al. Reference Franz, Caylor, Nordbotten, Rodrigueziturbe and Celia2010), including the Loess Plateau (Liu Reference Liu2007). In addition, rainfall is the only source of soil moisture in the Loess Plateau. Thus, it is necessary to characterise soil moisture variability under the influences of temporal change and spatial variability in rainfall regimes in the Loess Plateau.
Soil moisture modelling schemes consist of deterministic dynamics allowing for an analytical description of the feedbacks within the system, and the stochastic components, which are required to account for the unpredictability of rainfall, temperature, and variability inherent to storage–discharge relationships (Verma et al. Reference Verma, Yeates and Daly2011). Focusing on the soil moisture dynamics, recent studies have developed various descriptions of the components of the water balance (Cordova & Bras Reference Cordova and Bras1981; Daly & Porporato Reference Daly and Porporato2006; Vervoort & van der Zee Reference Vervoort and van der Zee2008; Manfreda et al. Reference Manfreda, Scanlon and Caylor2010; Verma et al. Reference Verma, Yeates and Daly2011). Rawls et al. (Reference Rawls, Ahuja, Brakensiek, Shirmohammadi and Maidment1992) described the infiltration process and water movement in the soil. Milly (Reference Milly1993) provided an analytic solution of the stochastic storage problem by assuming that evapotranspiration occurred at a constant rate. Vervoort & van der Zee (Reference Vervoort and van der Zee2008) developed models that considered the capillary rise from groundwater to the unsaturated zone in a stochastic ecohydrological framework. Stochastic modelling is gaining more and more attention in soil moisture and water balance modelling in recent decades. As daily rainfall processes play a key role in dryland soil moisture variation, and they reveal obvious randomness, it is necessary to include daily rainfall as a stochastic forcing variable in soil moisture modelling schemes (Franz et al. Reference Franz, Caylor, Nordbotten, Rodrigueziturbe and Celia2010). In 1999, Rodriguez-Iturbe et al. (Reference Rodriguez-Iturbe, Porporato, Ridolfi, Isham and Coxi1999) developed a stochastic soil water balance model in which rainfall is represented by a marked Poisson process, and obtained an analytical solution for the soil moisture probability density function (pdf). Ridolfi et al. (Reference Ridolfi, D'Odorico, Porporato and Rodriguez-Iturbe2000) applied this model to explore the effect of climate variability on the water stress of the vegetation. Franz et al. (Reference Franz, Caylor, King, Nordbotten and Celia2012) developed a simple spatial-explicit daily stochastic ecohydrological model to explore the hillslope-scale vegetation patterns. Recently, a series of studies have developed and applied stochastic models similar to that of Rodriguez-Iturbe et al. (Reference Rodriguez-Iturbe, Porporato, Ridolfi, Isham and Coxi1999) in research focused on soil moisture dynamics.
In this study, the stochastic soil water balance model (Laio et al. Reference Laio, Porporato, Fernandez-Illescas and Rodriguez-Iturbe2001a, Reference Laio, Porporato, Ridolfi and Rodriguez-Iturbeb; Porporato et al. Reference Porporato, Laio, Ridolfi and Rodriguez-Iturbe2001; Rodriguez-Iturbe et al. Reference Rodriguez-Iturbe, Porporato, Laio and Ridolfi2001) was applied to explore the interactions of the climate–soil–plant system in the Loess Plateau, China. Specifically, the objectives of the study are: (1) to test the applicability of this model to the Loess Plateau; and (2) to detect soil moisture responses to the rainfall regime change.
1. Material and methods
1.1. Study area
The Yangjuangou catchment [36°42′N, 109°31′E] was selected in this study to test the applicability of the stochastic soil water balance model. The catchment is located near Yan'an in Shaanxi province, China (Fig. 1), which is a typical hilly gully region of the Loess Plateau, China. Due to afforestation campaigns, black locust (Robina pseudoacacia) plantations were distributed widely in this catchment (Jiao et al. Reference Jiao, Lu, Sun, Ward and Fu2015). The growing season spans approximately from May to September for most deciduous plants (Jiao et al. Reference Jiao, Lu, Sun, Ward and Fu2015). The mean average precipitation (MAP) is 531 (±115)mm, and the average precipitation in the growing season is 422 (±103)mm, accounting for approximately 80% of the annual precipitation (Jiao et al. Reference Jiao, Lu, Sun, Ward and Fu2015).
Two black locust plantation plots were monitored on the NW- and E-facing slopes in the catchment. The area of each plot was 10×10m2. The slope degrees of these plots were similar (approximately 25°), and their slope positions were relatively low on the slopes. Field surveys were conducted at each plot, and the understory vegetation is mainly composed of liana (Periploca sepoum) and herb (Artemisia sacrorum) (Jiao et al. Reference Jiao, Lu, Sun, Ward and Fu2015, Reference Jiao, Lu, Fu, Gao, Wang, Jin, Zhang, Liu and Zhang2016). The volumetric soil water content of each plot was measured at 10, 20, 40, 60, 100, 120, 150, and 180cm below the ground surface with the application of EC-5 sensors (Decagon Devices Inc., Pullman, WA, USA) in 2014. Then, the average volumetric water content at the rooting depth was calculated by the depth-averaged method based on the data recorded at the above depths. A HOBO logger (H21, Onset Computer Corp., Bourne, MA, USA) was used to record the soil moisture at 30min intervals, and daily moisture was calculated from these data. The precipitation in 2014 was measured with a tipping bucket rain gauge (TE525), and the data were collected via a data logger (CR1000, Campbell Scientific Inc., Logan, UT, USA) at 30min intervals. The observed soil moisture in the catchment was used to test the applicability of the stochastic soil water balance model.
1.2. Stochastic soil water balance model
1.2.1. Theoretical framework
The model applied in this study characterises the temporal dynamics of soil moisture at a given point without consideration of lateral moisture contribution (Rodriguez-Iturbe et al. Reference Rodriguez-Iturbe, Porporato, Laio and Ridolfi2001). The point water balance is shown as:
 $$nZ_r {ds(t) \over dt} = R(t) - I(t) - Q [s(t),t] - E[s(t)] - L[s(t)]$$
where n is soil porosity, Zr is the rooting depth, s(t) is relative soil moisture (0≤s(t)≤1) in the rooting depth, which is calculated by dividing volumetric water content by soil porosity, R(t) is rainfall rate, I(t) is the rate of losses due to canopy interception, Q(t) is the run-off rate, E[s(t)] is the rate of evapotranspiration, and L[s(t)] is the rate of leakage loss.
The stochastic soil water balance model used in this study is based on the conservation of water within the rooting zone of each species, forced by daily precipitation (Franz et al. Reference Franz, Caylor, Nordbotten, Rodrigueziturbe and Celia2010). Eagleson (Reference Eagleson1978) indicated that probabilistic-trait methods could be applied to simplify the randomness of a rainfall event, in which the rainfall, R(t), is represented as a marked Poisson process of storm arrivals in time with rate λ (day–1), storm depth h (mm) treated as an exponentially distributed random variable with mean α (mm) (Franz et al. Reference Franz, Caylor, Nordbotten, Rodrigueziturbe and Celia2010). The infiltration depth is determined by the minimum storm depth and the remaining soil moisture capacity at the time of the storm (Xingyao et al. Reference Xingyao, Lu, Nicholas, Jun and Yongqiang2011). The run-off is considered to be dominated by the Dunne run-off processes (Xingyao et al. Reference Xingyao, Lu, Nicholas, Jun and Yongqiang2011). As for evapotranspiration, the model incorporated a description of vegetation to water stress: evapotranspiration declines linearly with soil moisture (Kiang Reference Kiang2002). The evapotranspiration, E(s), was represented as a piecewise function for different soil moisture ranges (Laio et al. Reference Laio, Porporato, Ridolfi and Rodriguez-Iturbe2001b). The soil moisture cut-off points (in terms of values to saturation when s=1) were set as field capacity, sfc; onset of water stress, s*; wilting point, sw; and hygroscopic point, sh (Laio et al. Reference Laio, Porporato, Ridolfi and Rodriguez-Iturbe2001b). Evapotranspiration arrives at its maximum, E max, then declines to some minimum level, Ew (soil evaporation), at the wilting point, sw. The model described the function as below:
 $$E(s) = \left \{ \matrix{
0&s_*<s\le s_h \cr
E_w { s-s_h \over s_w - s_h}&s_h<s\le s_w \cr
E_W + (E_{\max} -E_w) { s-s_w \over s_* - s_w}&s_w<s\le s_*\cr
E_{\max}&s_*<s\le 1
} \right \}$$
$$E(s) = \left \{ \matrix{
0&s_*<s\le s_h \cr
E_w { s-s_h \over s_w - s_h}&s_h<s\le s_w \cr
E_W + (E_{\max} -E_w) { s-s_w \over s_* - s_w}&s_w<s\le s_*\cr
E_{\max}&s_*<s\le 1
} \right \}$$
The deep percolation starts when the soil moisture is larger than sfc, and the loss rate is assumed to reach its maximum when the soil moisture is saturated and then decays exponentially as the soil dries out, which follows the decrease of the hydraulic conductivity K(s) (Laio et al. Reference Laio, Porporato, Ridolfi and Rodriguez-Iturbe2001b). Then, the general solution of the steady-state soil moisture pdf, p(s), is shown in Eq. 3, where m=Ks/nZr[exp(β(1−sfc))−1]; η=E max/nZr; ηw=Ew/nZr; γ=nZr/α; λ′=λe–Δ/α; α is the mean depth of rainfall depth; λ is the rainfall event frequency; Δ is a threshold for rainfall depth, below which no water could reach the ground (assumed to be 2 for trees); Ks is the saturated hydraulic conductivity; C is an integration constant which could be obtained by the identity ∫10 p(s)ds = 1 (Laio et al. Reference Laio, Porporato, Ridolfi and Rodriguez-Iturbe2001b); and β is the coefficient of the exponential relationship between soil moisture and water conductivity dependent on soil type, it equals 2b+4, where b is an experimentally determined parameter in soil water retention curves.
The soil water balance could be obtained based on the model presented in Eqs 1, 2, 3. It is noted that the different water balance components refer to the long-term averages of the respective components of the soil moisture dynamics. Then, these components could be specified as (Rodríguez-Iturbe & Porporato 2004):
 $$p(s) = \left \{ \matrix {
{C \over \eta_w} \left ( { s-s_h \over s_w - s_h} \right )^{(( \lambda^' (s_w - s_h )) / (\eta_w)) -1 } e^{-\gamma s} &s_h < s \le s_w\vskip10\cr
{C \over \eta_w} \left [ 1+ \left ( { \eta \over \eta_w} -1 \right ) \left ( { s-s_w \over s^* - s_w} \right ) \right ]^{(( \lambda^' (s^* - s_w )) / (\eta - \eta_w)) -1 } e^{-\gamma s} &s_w < s \le s^*\vskip10\cr
{C \over \eta} e^{-\gamma s + ( \lambda^' / \eta ) ( s -s^*)} \left ( { \eta \over \eta_w} \right ) ^{ \lambda^' ((s^* - s_w ) / (\eta - \eta_w)) } &s^* < s \le s_{fc}\vskip12\cr
{C \over \eta} e^{ -({β}+ \gamma ) s + {β}s_{fc} } \left ( { \eta e^{\hskip1 {β}s} \vskip2\over \vskip6(\eta - m ) e^{\hskip1{β}s_{fc}} + m2e^{\hskip1{β}s}} } \right ) ^{ (\lambda^' / ( {β}( \eta - m )))+1} \left ( { \eta \over \eta_w } \right ) ^{(( \lambda ^' (s^* - s_w )) / ( \eta - \eta_w ))} e^{( \lambda ^' / \eta ) ( s_{fc} ( s_{fc} -s^*)} &s_{fc} < s \le 1\cr
}$$
$$p(s) = \left \{ \matrix {
{C \over \eta_w} \left ( { s-s_h \over s_w - s_h} \right )^{(( \lambda^' (s_w - s_h )) / (\eta_w)) -1 } e^{-\gamma s} &s_h < s \le s_w\vskip10\cr
{C \over \eta_w} \left [ 1+ \left ( { \eta \over \eta_w} -1 \right ) \left ( { s-s_w \over s^* - s_w} \right ) \right ]^{(( \lambda^' (s^* - s_w )) / (\eta - \eta_w)) -1 } e^{-\gamma s} &s_w < s \le s^*\vskip10\cr
{C \over \eta} e^{-\gamma s + ( \lambda^' / \eta ) ( s -s^*)} \left ( { \eta \over \eta_w} \right ) ^{ \lambda^' ((s^* - s_w ) / (\eta - \eta_w)) } &s^* < s \le s_{fc}\vskip12\cr
{C \over \eta} e^{ -({β}+ \gamma ) s + {β}s_{fc} } \left ( { \eta e^{\hskip1 {β}s} \vskip2\over \vskip6(\eta - m ) e^{\hskip1{β}s_{fc}} + m2e^{\hskip1{β}s}} } \right ) ^{ (\lambda^' / ( {β}( \eta - m )))+1} \left ( { \eta \over \eta_w } \right ) ^{(( \lambda ^' (s^* - s_w )) / ( \eta - \eta_w ))} e^{( \lambda ^' / \eta ) ( s_{fc} ( s_{fc} -s^*)} &s_{fc} < s \le 1\cr
}$$
 $$\left \{\matrix{
\langle R \rangle = {α} \cdot \lambda \cr
\langle I \rangle = {α} \lambda (1 - e ^{-(\Delta / \alpha)}) \cr
\langle E_s \rangle {α} \lambda^' P (s^*) - {α} \eta p (s^*) \cr
\langle E_{ns} \rangle = E_\max [1-P(s^*)] \cr
\langle L \rangle = {α} \left [ \lambda^' - \lambda^' P (s_{fc}) - \left ( \eta + {K_s \over nZ_r} \right ) p(1) + \eta p (s_{fc}) \right ] \vskip10\cr \kern-75pt - E_\max [1- P(s_{fc})] \cr
\langle Q \rangle = {α} \left ( \eta + { K_s \over nZ_r } \right )p(1)}$$
$$\left \{\matrix{
\langle R \rangle = {α} \cdot \lambda \cr
\langle I \rangle = {α} \lambda (1 - e ^{-(\Delta / \alpha)}) \cr
\langle E_s \rangle {α} \lambda^' P (s^*) - {α} \eta p (s^*) \cr
\langle E_{ns} \rangle = E_\max [1-P(s^*)] \cr
\langle L \rangle = {α} \left [ \lambda^' - \lambda^' P (s_{fc}) - \left ( \eta + {K_s \over nZ_r} \right ) p(1) + \eta p (s_{fc}) \right ] \vskip10\cr \kern-75pt - E_\max [1- P(s_{fc})] \cr
\langle Q \rangle = {α} \left ( \eta + { K_s \over nZ_r } \right )p(1)}$$
where ⟨ R ⟩, ⟨ I ⟩, ⟨ E_s ⟩, ⟨ E_{ns} ⟩, ⟨ L ⟩, and ⟨ Q ⟩, are the mean rates of rainfall, interception, evapotranspiration-under-stress condition, unstressed evapotranspiration, leakage, and run-off, respectively, and P(s) is the cumulative probability distortion of soil moisture.
1.2.2. Parameter estimation
Soil parameters such as field capacity (sfc), onset of water stress (s*), wilting point (sw), and hygroscopic point (sh) are determined by measurements through the soil water characteristic curve (the capillary suction method). Thus, reasonable values for the soil matrix potentials at these soil moisture cut-off points are important for the soil parameter estimation. In the Loess Plateau, typical values of soil matrix potentials at sfc and sw are −0.03MPa and −2MPa, respectively (Bai & Shao Reference Bai and Shao2009). The soil matrix potential at sh is set to be the reference value at −10MPa (Rodríguez-Iturbe & Porporato 2004). The soil matrix potential at incipient stomatal closure (s*) is determined through the black locust net photosynthetic rate observation with the soil matrix potential change (Wang et al. Reference Wang, Wang, Shi and Zhang2007) and the value is −0.06MPa. The soil porosity is determined by field investigation. Using the typical values for sandy loam reported by Laio et al. (Reference Laio, Porporato, Ridolfi and Rodriguez-Iturbe2001b), other soil parameters such as Ks and b are obtained because the soil texture in the study area is sandy loam according to the measurements of soil particle sizes. Since it is difficult to obtain soil parameters across the Loess Plateau, we only refer to variations due to different soil textures in this study. Thus, the soil parameters are constant in the study area due to the consistent soil texture.
The maximum daily average evapotranspiration (E max) is difficult to estimate due to the lack of direct measurements (Rodríguez-Iturbe & Porporato 2004). Scholes & Walker (Reference Scholes and Walker1993) indicated that typical E max values could be obtained by the observation of an eight-hour transpiration period during the peak growing season after sizeable rainfall events. Then, the E max (mmday–1) for black locust in this study could be estimated using the soil moisture variation after several sizeable rainfalls on August 8, 2011, in the Yangjuangou catchment (Wang et al. Reference Wang, Fu, Gao, Yao and Zhou2012). The soil evaporation, Ew, is set to be 5% of E max, according to Franz et al. (Reference Franz, Caylor, Nordbotten, Rodrigueziturbe and Celia2010). The effective soil depth (Zr) is set to be 180cm according to the field investigation, which is also in accordance with Zhang & Xu (Reference Zhang and Xu2011) in the Loess Plateau. The values of the parameters used in the model are summarised in Table 1. The rainfall parameters (λ and α) could be obtained through statistics on the observed daily precipitation data in the meteorological stations, and data could be obtained from the National Meteorological Information Center of the China Meteorological Administration. With the input of the climate, soil, and vegetation parameters, as previously mentioned, the soil moisture balance model could derive the pdf for soil moisture and water balance for given climates, soils, and vegetation.
Table 1 Parameters describing the soil and plant characteristics of the black locust in the Loess Plateau. Abbreviations: Sh = hygroscopic point; sfc = field capacity; Ks = saturated hydraulic conductivity; sw = wilting point; s* = onset of water stress; Zr = rooting depth; E max = maximum daily average evapotranspiration; Ew=soil evaporation; b=experimentally determined parameter.

1.3. Rainfall regimes
To illuminate the spatial variability of rainfall regimes across the Loess Plateau, three meteorological observation stations were selected along a precipitation gradient: Yulin (MAP = 420mm), Yan'an (MAP = 500mm), and Luochuan (MAP = 615mm) (Fig. 1). The observed daily precipitation data in these three stations were obtained from the National Meteorological Information Center of the China Meteorological Administration. The rainfall parameters in the stochastic model for these three stations were calculated based on the rainfall data from 1999 to 2015, then the effects of rainfall pattern spatial variability on the soil moisture were explored. Meanwhile, the precipitation data from 1951 to 2015 in Yan'an station were applied to detect the effects of temporal changes in rainfall on the soil moisture variation. Figure 2 shows the annual rainfall (growing season, from May to September) fluctuations in Yan'an from 1951 to 2015, and obvious deviations existed from the long-term average rainfall over this region. The period from 1958 to 1988 was wet, considering the number of years with higher than average rainfall, and the period from 1989 to 2008 was dry, given the number of years with lower than average rainfall. For the wet period from 1958 to 1988, the rainfall parameters are λ wet=0.37day–1 and α wet=8.2mm, while for the dry period they are λ dry = 0.33day–1 and α dry = 7.5mm.
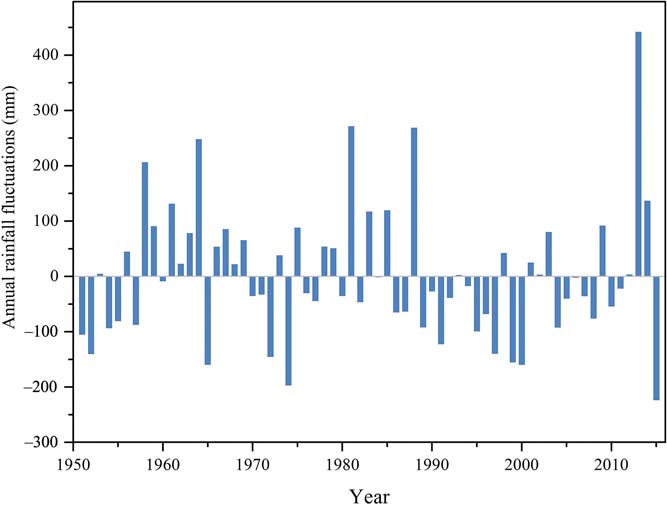
Figure 2 Fluctuations around the mean annual rainfall in Yan'an from 1951–2015.
2. Results
2.1. Soil moisture prediction in black locust plantations
The predicted and observed soil moisture pdfs for the growing season of black locust in plots (plot 1 and plot 2) in the Yangjuangou catchment are shown in Figure 3. Figure 3 shows that there is good agreement between the predicted and observed pdfs in both plots, though some small deviations existed at the high soil moisture level. This verifies the applicability of the stochastic soil water balance model used in this study and shows the potential for it to be applied to the hilly gully regions of the Loess Plateau.

Figure 3 Soil moisture pdfs for black locust in the growing season in 2014. (a) Plot 1 in Yangjuangou catchment. (b) Plot 2 in Yangjuangou catchment.
2.2. Soil moisture pdfs and water balance affected by spatial variability of rainfall regimes
The resulting soil moisture pdfs for the growing season of black locusts in the Yunlin, Yan'an, and Luochuan stations are shown in Figure 4. The effect of spatial variability in the rainfall regime is obvious. With decreasing MAP, it appears that black locust tends to be more frequent at low soil moisture levels in Yulin. In Yulin, the soil moisture mainly ranges from sw to s*, while the proportion was lower in Yan'an and Luochuan. Regarding the differences among these stations, they have a fatter right tail in their pdf, which could be attributed to the more frequent soil moisture excursions at high soil moisture levels.

Figure 4 Predicted soil moisture pdfs in Yulin, Yan'an and Luochuan.
The comparison of water balances among the three stations is presented in Figure 5. It is evident that transpiration under stress makes up a majority of the water balance in these three regions, and this could be attributed to the frequent low-intensity rainfalls during the growing season. A large proportion of rainfall is transpired with the stomata partially closed. Obvious differences existed among these three stations; the proportion of evapotranspiration under stress decreased (from 74.0% in Yulin to 52.3% in Luochuan) with increasing MAP, while the proportion of unstressed evapotranspiration increased with increasing MAP.

Figure 5 Components of the water balance normalised by the total rainfall in Yulin, Yan'an and Luochuan. The incoming rainfall is partitioned among leakage (L), unstressed evapotranspiration (Ens), evapotranspiration under stress (Es), runoff (Q) and canopy interception (I).
2.3. Soil moisture pdfs and water balance affected by temporal changes in rainfall regime
Obvious fluctuations existed in Yan'an during the period from 1951 to 2015, and alternating dry (1958–1988) and wet (1989–2008) periods were detected throughout the whole period. Then, the effect of a temporal change in rainfall on soil moisture pdfs and water balance variations were explored. Comparisons of the soil moisture pdfs and water balance in the dry period and wet period are shown in Figure 6. The soil moisture pdfs in the dry and wet periods revealed a similar pattern, while the pdf in the wet period moved to the high soil moisture level. Regarding the water balance (Fig. 7), evapotranspiration under stress increased slightly (from 59.5 to 72%) in the dry period, while the unstressed evapotranspiration decreased greatly compared to the wet period.

Figure 6 Predicted soil moisture pdfs in Yan'an in the dry and wet period.

Figure 7 Components of the water balance normalised by the total rainfall in Yan'an in the dry and wet period. The incoming rainfall is partitioned among leakage (L), unstressed evapotranspiration (Ens), evapotranspiration under stress (Es), runoff (Q) and canopy interception (I).
3. Discussion
3.1. Application and uncertainties of the stochastic soil moisture model in the Loess Plateau
Rainfall stochasticity is an important factor affecting the hydrological cycle and many hydrological processes; however, stochasticity issues have seldom been considered in soil moisture modelling in the Loess Plateau. The stochastic soil moisture model applied in this study would be beneficial to show how to cope with stochastic water availability in the Loess Plateau. The model applied in this study considers daily rainfall as an external random driving force (Rodríguez-Iturbe & Porporato 2004), in which the randomness of the rainfall event was simplified by the probabilistic-trait methods (Zhou et al. Reference Zhou, Fu, Gao, Lü and Wang2016). In addition, compared to other soil moisture models with physical interpretations, such as the Simultaneous Heat and Water model (SHAW) (Flerchinger et al. Reference Flerchinger, Baker and Spaans1996) and the Soil Water Carrying Capacity for Vegetation model (Xia & Shao Reference Xia and Shao2008), the parsimony in parameterisation of this model made it quite convenient for applications in data-sparse regions. More efforts are needed to better apply the stochastic soil moisture model to the Loess Plateau. First, although the black locust was selected to measure the impacts of soil moisture on ecosystem dynamics, other typical introduced vegetation in the Loess Plateau could also be used in soil moisture modelling due to their different transpiration characteristics. Second, more meteorological stations should be selected to reveal the spatial and temporal variability of the rainfall regimes with the spatial interpolation method so that the soil moisture pdf and water balance could be obtained at regional scales. Third, more long-term soil moisture datasets should be monitored and collected across the Loess Plateau, because these could further verify the stochastic soil moisture model.
The sources of uncertainties in this study could be mainly attributed to model parameterisation. In this study, the core of the model is its simplified characterisation of evapotranspiration variation with soil moisture, in which E max is an important parameter for indicating the physiological processes of the plant. However, the physiological state of the plant would vary with the growth stage. Recent studies have shown that the transpiration rate in juvenile black locust plantations was higher than in the mature plantations (Zheng et al. Reference Zheng, Zhao, Zhou, Zhou, Liang and Luo2011). The soil matrix potential at incipient stomatal closure, s*, is obtained through a simulated drought experiment, which would deviate from field observations. Thus, more cautions should be taken to predict the soil moisture pdf and water balance variation in future studies.
3.2. Soil moisture and water balance responses to rainfall regimes
The results of this study have shown the obvious effects of a rainfall regime change on the soil moisture and water balance. The s*−sw range for black locust in this study was relatively large, which indicated that the black locust could not quickly change from being wilted to unstressed (Rodríguez-Iturbe & Porporato 2004). Taking the Yangjuangou catchment as an example, the rainfall is intermittent and generally light at the beginning of the growing season. Heavy rains are relatively rare and concentrated in the peak of the growing season. Thus, the rainfall regime in the Yangjuangou catchment indicated that black locust would suffer greater water stress at the beginning of the growing season, as the winter charge is generally insufficient. The annual rainfall fluctuations result in Yan'an having alternating wet and dry periods from 1951 to 2015, which is also consistent with the warming and drying trends detected in large areas of the Loess Plateau. However, the temporal change in rainfall regime has been insufficiently accounted for in previous studies. Our study showed an example of how the soil moisture and water balance would vary from wet period to dry period, and the proportion of evapotranspiration under stress in response to the rainfall increased greatly from 59.5% to 72%. The results indicated that the warm and dry trends greatly affected the soil moisture dynamics and water balance. This study shows a simple way to assess how water stress would change from the wet period to the dry period, which could be quite practical for policymaking in the next stage of vegetation restoration in the Loess Plateau.
3.3. Implications for vegetation restoration in the Loess Plateau
Though the large-scale vegetation restoration projects in the Loess Plateau have achieved great outcomes in controlling soil and water loss since their implementation in recent years (Wang et al. Reference Wang, Fu, Piao, Lü, Ciais, Feng and Wang2015), dire challenges remain to be confronted regarding ecological and environmental degradations. Carefully considering plant species selection is imperative (Chen et al. Reference Chen, Wang, Wei, Fu and Wu2010), and clarifying the suitable areas for the species is quite important in the implementation of vegetation restoration in the Loess Plateau. Several studies have been conducted to address this issue. McVicar et al. (Reference McVicar, Niel, Li, Wen, Yang, Li and Jiao2010) mapped the suitability of 38 predominately native species through an environmental variable spatial overlay approach and rule set defining the species' tolerances. Fu et al. (Reference Fu, Huang, Gallichand and Shao2012) applied the SHAW model to simulate soil moisture variations for a critical climatic year to determine the optimal plant coverage for two typical shrubs. Wang et al. (Reference Wang, Wang, Fu, Yang and Li2017b) indicated that the soil moisture of woodland/shrubland was non-sustainable in the regions with MAP<520mm in the Loess Plateau. However, the interactions between soil moisture and the plant at the level of species were not fully considered in these previous studies. The results in this study could provide insights for guiding further vegetation restoration. In this study, the proportion of evapotranspiration under stress in response to the rainfall was calculated to quantify the water stress for the black locust. The high value in Yulin (74.0%) was consistent with recent findings in the regions with MAP<400mm where the dwarfed trees have occurred throughout the reforestation areas (McVicar et al. Reference McVicar, Niel, Li, Wen, Yang, Li and Jiao2010; Cao et al. Reference Cao, Ge, Zhang, Chen, Qi, Fu, Mcnulty, Shankman, Tang and Wang2011). The water stress for black locust in this study is calculated by dividing rainfall by the proportion of evapotranspiration under stress, which could be a quantitative and fundamental indicator assessing stress levels of the plant growth. However, the threshold for the normal growth of plants is not solely determined by the water stress; the ecohydrological optimality theory is an excellent way to explore this threshold. However, the complicated interactions among plants, soils, and climate make it difficult to obtain the ecohydrological optimisation mechanisms (Caylor et al. Reference Caylor, Scanlon and Rodriguez-Iturbe2009). Instead of the maximisation of resource, resource scarcity accompanying limited resource consumption has drawn great considerations recently (Franz et al. Reference Franz, Caylor, Nordbotten, Rodrigueziturbe and Celia2010). Caylor et al. (Reference Caylor, Scanlon and Rodriguez-Iturbe2009) indicated that the ability of vegetation to maximise water use and minimise water stress determined their optimum spatial pattern. Though more species should be modelled, the relatively high water stress suffered by the black locust in the arid regions (e.g., Yulin) might also indicate that black locust is not the optimum vegetation type for these regions. Studies in the next stages should further focus on how to detect the water stress threshold of the black locust in the reforestation regions. Our results at least provided a quantitative index to assess the water stress on the plant at the level of species in the Loess Plateau. In addition, the mean transpiration rate is linked to ecosystem productivity from the vegetation's point of view (Rodríguez-Iturbe & Porporato 2004). Our results showed the potential to solve the issue of how to determine suitable regions for species. Based on the niche concept, the species suitability could be defined as the subset of environmental conditions affecting a particular organism (Franz et al. Reference Franz, Caylor, Nordbotten, Rodrigueziturbe and Celia2010). Suitability is a relative concept, which indicates that the black locust was more suitable in Luochuan than Yan'an, but we could not conclude that the black locust is the most suitable species in Luochuan. Thus, our results could be applied in suitability comparisons among the vegetation restoration types in the Loess Plateau, and used to evaluate the current restoration project.
4. Conclusions
The stochastic soil water balance model provides new insights into the soil moisture and water balance variation responses under rainfall regime changes. In this study, the stochastic soil water balance model developed by Rodríguez-Iturbe et al. (2004) was verified by monitoring soil moisture data in the Yangjuangou catchment in the Loess Plateau. The effects of rainfall regime spatial variability on the soil moisture and water balance of the black locust were detected in Yulin, Yan'an, and Luochuan. The soil moisture tends to be more frequent at low soil moisture levels with decreasing precipitation, and evapotranspiration under stress increased with decreasing precipitation. In addition, the effects of a temporal change in rainfall on the soil moisture and water balance was also detected in Yan'an. The soil moisture and water balance revealed obvious differences between the dry and wet periods. Though the variation in soil moisture and water balance with the rainfall regime change should be further modelled across the Loess Plateau, our results indicated that this model could assess the response of vegetation to water stress in the arid environment, which would be helpful in the next stage of vegetation restoration.
5. Acknowledgements
This work was funded by the State Key Project of Research and Development Plan (grant number 2016YFC0501603), the National Natural Science Foundation of China (grant numbers 41390464, 41722102), and the Chinese Academy of Sciences (grant number GJHZ 1502). Thanks are also expressed to the National Meteorological Information Center of the China Meteorological Administration for archiving the observed rainfall data (http://cdc.cma.gov.cn).


