


The decision-making process for preparing and responding activities for health care systems in disaster management is a strategic challenge. Given the uncertainties of events, decision-making in this area must balance preparedness and risk. Generally, the structures of optimization models in disaster management include a preparedness phase and a response phase, which implies before and after the catastrophic occurrence, respectively.
In this article, we present a mathematical programming model for planning storage, selecting a warehouse, and delivering medical supplies between warehouses and hospitals. We present a model for emergencies and disaster situations in the center of Adana (Turkey), which is vulnerable to earthquakes. We introduce a two-stage stochastic programming (SP) scenario-based model for before and after the disaster (earthquake) in the preparedness phase.
SP can be used as a general purpose technique to make nonanticipatory decisions in uncertainty events. Our goals in this article were to select a subset of warehouses to store additional medical supplies and to determine the inventory level in the first stage and then to define a transportation plan for each scenario in the second stage. The goal of our mathematical model was to minimize costs and delivery times during a disaster. Thus, we utilized a scenario-based SP model to optimize this problem.
Two major challenges in our SP model were selecting the locations and allocating them. Concerning selecting a location, Shishebori and JabalameliReference Shishebori and Jabalameli 1 presented a multi-objective, mixed-integer, nonlinear programming model for determining locations of new medical service centers with respect to network design and system reliability. Their model minimizes total investment and operational costs. Rennemo et alReference Rennemo, Rø and Hvattum 2 proposed a three-stage SP model for locating and routing problems with stochastic elements. The first stage of the model entails facility location decisions with respect to opening of distribution centers. The last 2 stages involve amounts of aid to be delivered to each recipient and types of vehicles to be used for transportation. The goal of the model is to maximize the utility provided by covering the demand. In this model, the amount of uncertain demand is considered. LuReference Lu 3 presented a P-center model with uncertain nodal weights for locating urgent relief distribution centers in an emergency logistics responding system. In this model, a heuristic framework is used to obtain robust solutions. In another emergency facility location problem, Mirzapour et alReference Mirzapour, Wong and Govindan 4 used a P-center location to determine the location of relief rooms in affected areas before flood occurrence. They proposed a mixed-integer nonlinear programming model for minimizing the maximum expected weighted distance from the relief room to all demand regions in order to decrease the evacuation time of the population. In 2007, frameworks for facility location of medical service models were investigated by Jia et al.Reference Jia, Ordóñez and Dessouky 5 They first surveyed general facility location problems and then proposed a general facility location model that is suited for large-scale emergencies. This model can be cast as a covering model, a P-median model, or a P-center model in a large-scale emergency.Reference Jia, Ordóñez and Dessouky 5
Because it has uncertainty parameters, SP is an appropriate technique for planning in the preparedness phase. Scenario-based SP models take advantage of probabilistic scenarios to represent disasters and their outcomes. In this regard, Mete and ZabinskyReference Mete and Zabinsky 6 proposed a two-stage SP approach for the storage and distribution of medical supplies. The first stage of their model focuses on the location of medical supply warehouses, and the second stage focuses on distribution and transportation of the medical supplies. Warehouse selection is implemented according to the capacity of the warehouses from the asset of possible locations and ends by determining inventory levels of each warehouse. In fact, the SP model of Mete and ZabinskyReference Mete and Zabinsky 6 is closer to our proposition, but there is a significant difference in the major scenarios. In our SP model, major earthquake scenarios are on the Richter magnitude scale and this classification of earthquake events supports a wide variety of possible magnitude scales. We determined 86 routes, with each one starting from a warehouse and arriving at a hospital in the center of Adana. Each warehouse included limited capacities that can provide services to several demand points (hospitals). In order to accelerate delivery of medical supplies, warehouses were selected by considering the closest distance to demand points (hospitals). Because of uncertainty demands before the onset of the earthquake, we envisage fluctuating demands in hospitals. We estimated the demands of each hospital with respect to population density and their distance from other existing hospitals in the same region. In 2004, a scenario-based two-stage SP model was proposed for transporting humanitarian aid during emergency response. In the first stage of this model, goods are pre-positioned by allowing movement of goods between existing supply depots. In the second stage, a transportation plan is drawn up based on the existing supply and realization of uncertain demand and arc capacities. Those authors sought to determine transportation plans and to define both stages in the response phase.Reference Barbarosoǧlu and Arda 7
In the application of stochastic models in health services, Lamiri et al formulated a stochastic model for operating room planning with 2 classes of patients: elective patients and emergency patients.Reference Lamiri, Xie and Dolgui 8 That model minimized the sum of elective-patient-related costs and overtime costs of operating rooms. The researchers proposed a solution that combined Monte Carlo simulation and mixed integer programming. Beraldi et alReference Beraldi, Bruni and Conforti 9 used an SP model with chance constraints to design an emergency medical service. That model minimized overall costs for selecting the best location for a service site and vehicle assignment for each service site. In addition, the chance constraint in that study was due to the Poisson nature of the call arrival process. Another location problem addressed by SP is the necessity for regional emergency resources storage.Reference Wang, Yang and Zhu 10 In that case, the authors proposed a two-stage SP model to solve the region division problem. Their objective minimized resources, transportation cost, and penalty cost in disaster management. In scenario-based modeling of emergency management, Lv et alReference Lv, Huang and Guo 11 used a model for emergency evacuation management and risk analysis under multiple uncertainties in emergency management. In addition, Salman and YücelReference Salman and Yücel 12 presented a scenario-based practical optimization method to select the locations of emergency response facilities in the pre-disaster stage. That study provides insight from Istanbul.
In a study aimed to reduce the effects of earthquake, a formulation was presented to coordinate 3 main agencies and then propose a heuristic approach to solve different subproblems.Reference Edrissi, Poorzahedy and Nassiri 13 That study pointed out 3 main actors participating in disasters and emphasized the importance of coordination between the actors.Reference Edrissi, Poorzahedy and Nassiri 13 The authors considered 3 phases of 4 disaster management phases (preparedness, response, mitigation, and recovery). Each actor was in charge of 1 of the 4 phases, integrating all phases in disaster management except for recovery. For robustness of the entire transportation system in large-scale urban disasters such as earthquakes, Liu et alReference Liu, Fan and Ordóñez 14 developed a model network retrofit problem as a two-stage SP problem that optimizes a mean-risk objective of the system loss. In other study, Caunhye et alReference Caunhye, Nie and Pokharel 15 investigated optimization models used in emergency logistics. Disaster operations can be performed before or after disaster occurrence. Short-notice evacuation, facility location, and stock prepositioning are drafted as the main pre-disaster operations, whereas relief distribution and casualty transportation are categorized as post-disaster operations. In 2014 Sazvar et alReference Sazvar, Mirzapour Al-e-hashem and Baboli 16 developed a two-stage SP model and proposed a new replenishment policy in a centralized supply chain for deteriorating items. They considered inventory and transportation costs, as well as the environmental impacts under uncertain demand. Rennemo et alReference Rennemo, Rø and Hvattum 2 presented a three-stage SP model for disaster response planning, considering the opening of local distribution facilities, the initial allocation of supplies, and the last mile distribution of aid.
Tricoire et alReference Tricoire, Graf and Gutjahr 17 formulated a bi-objective model utilizing two-stage SP with recourse. They presented a covering tour model with stochastic demand in which the 2 objectives are given by (1) cost (opening cost for distribution centers plus the routing cost for a fleet of vehicles) and (2) expected uncovered demand. In the application of SP models, Alizadeh et alReference Alizadeh, Marcotte and Savard 18 considered a two-stage stochastic extension of the bi-level pricing model. They developed a SP model in the area of financial scope. In the first stage of the model, the leader sets tariffs on a subset of arcs of a transportation network, with the aim of maximizing profits. Their model is focused on sensitivity analysis with respect to the constraints linking the tariffs at the 2 stages of the stochastic program.
Our SP model is a mathematical model that minimizes the sum of total distance and transportation time from the warehouse to the hospital. We formulated the first-stage SP model by considering the distances from the warehouses to the existing hospitals in the center of the city (Adana). During the second stage, the amount of medical supplies that must be delivered to the hospitals for each scenario was determined.
We developed the SP model by considering a new classification scenario in earthquake events. We introduced major scenarios utilizing the Richter magnitude scale. In this study, all possible scenarios were under several intervals of the Richter magnitude scale. In addition, each major earthquake scenario was divided into 3 times (scenarios): working times (W), rush hour times (R), and non-working times (N). Thus, we had 9 scenarios in this SP model. In the center of Adana, there are 12 great hospitals and 7 medical supply warehouses.
METHODS
In this section, our SP model is defined and formulated. A two-stage SP model was proposed for the medical supply location and the allocation problem in the center of Adana. Our SP model was composed of the first stage and the second stage, which included deterministic and nondeterministic decisions, respectively. The nomenclature of the model elements is given as follows:
The parameters were as follows:
-
I is sets of warehouses,
-
J is hospitals
-
c ij is transportation time between warehouse (i) and hospital (j),
-
w jk is the penalty for each unit of unfulfilled demand at j hospital,
-
d jk is the demand of k type at j hospital,
-
h ik is the storage capacity of warehouse (i) for medical supplies (k),
-
e k is the maximum amount available of k type,
-
f ij is the distance between warehouse (i) and hospital (j),
-
τ jk is the upper limit for penalty of unsatisfied demands in hospital (j),
-
K is the type of medical supplies, and
-
M is the number of warehouses selected.
The decision variables were as follows:
 $${\rm x}_{{\rm i}} \,{\equals}\,\left\{ \matrix{ 1,\, If\, warehouse\,i\,is\,selected\,for\,service \hfill \cr 0,\,otherwise \hfill \cr} \right.,$$
sik is the inventory level of k in i warehouse,
$${\rm x}_{{\rm i}} \,{\equals}\,\left\{ \matrix{ 1,\, If\, warehouse\,i\,is\,selected\,for\,service \hfill \cr 0,\,otherwise \hfill \cr} \right.,$$
sik is the inventory level of k in i warehouse,
yjk is the amount of unfulfilled demand at j hospital, and
tijk is the amount of k type to deliver from i to j.
Stage 1: Warehouse Selection and Inventory Decisions
This stage selects warehouses from the set of existing warehouses by considering total distances between warehouses and hospitals. In the first stage of SP, the binary decision variable x i is 1, if warehouse i is selected for service, or 0 otherwise, for each warehouse i∈I and s ik represents the inventory level of medical supply k in the warehouse I for all i∈I, k∈K. In addition, f ij represents distances between warehouses i and hospitals j as well as the objective function in our first-stage SP model, the minimized sum of the total distance between warehouses and hospitals. The triplet of (x,s,ξ) is a simple probability and ξ is denoted as being scenarios (ξ∈Ξ) in the formulation.
The first stage of the SP model is as follows:
 $$Min \,\,Z\,{\equals}\mathop{\sum}\limits_i {( {\mathop{\sum}\limits_{j{\equals}J} {f_{{ij}} x_{i} } } )} {\plus}E_{\Xi } \left[ {Q\left( {x, s,\xi } \right)} \right] $$
Subject to:
 $$ \matrix{ {\mathop{\sum}\limits_{i\,{\equals}\,I} {s_{{ik}} \leq e_{k} } } & {for\, all\,\,k\in K} \cr } $$
 $$\matrix{ {{\rm s}_{{{\rm ik}}} \leq h_{{ik}} x_{{i }} } & {for\, \,all\,\,i\inI,k\in K} \cr } $$
 $$\matrix{ {\mathop{\sum}\limits_i {x_{i} \leq m} } & {for\,all\, \,i\in I} \cr } $$
 $$\matrix{ {x_{i} \in\left\{ {0,1} \right\}, s_{{ik}} \geq 0} & {for\,\,all\,\,i\in I,k\inK} \cr } $$
The objective function of the first stage problem (1) minimizes the sum of the total distance plus the expected value function
 $\left( {E_{\Xi } \left[ {Q\left( {x, s,\xi } \right)} \right]} \right)$
The limitations on the availability of medical supplies and capacities of warehouses are represented by (2) and (3), respectively. Finally, (4) constraint includes a selection of warehouse numbers.
$\left( {E_{\Xi } \left[ {Q\left( {x, s,\xi } \right)} \right]} \right)$
The limitations on the availability of medical supplies and capacities of warehouses are represented by (2) and (3), respectively. Finally, (4) constraint includes a selection of warehouse numbers.
Stage 2: Demand Satisfaction Decisions and Transportation Amount
Stage 2 presents the transportation amount of medical supply k to be delivered from warehouse i to hospital j under disaster scenario. ξ The objective function of this stage is the action of the first stage (Q(x,s,ξ)) that is expanded as the objective function.
We minimized the transportation durations and penalizations devoted for each unit of unfulfilled demand at hospital j under scenario ξ (w ij(ξ)). The decision variable yjk(ξ) represents the amount of unfulfilled demand in each hospital j under the different scenarios. We let djk(ξ) represent the demand of medical supply type k at hospital j for scenario ξ. In addition, this model utilizes a parameter, namely τjk, to denote the upper limit for penalties of unsatisfied demand for each hospital j and medical supply type k. We will define notifications of our SP model in the rest of this section.
The second stage of the SP model is formulated as follows:
 $$ Q\left( {x,s,\xi } \right)\,{\equals}\,Min\, \mathop{\sum}\limits_{i\,\in\, I} {\mathop{\sum}\limits_{j\,\in \,J} {( {c_{{ij}} \left( \xi \right)\mathop{\sum}\limits_{k\,\,\in\,\,K} {t_{{ijk}} \left( \xi )} } \right)} } {\plus}\mathop{\sum}\limits_{j\ \in J} {\mathop{\sum}\limits_{k\ \in K} {w_{{jk}} \left( \xi \right)y_{{jk}} (\xi )} } $$
Subject to:
 $$\matrix{ {\mathop{\sum}\limits_{\rm j} {{\rm t}_{{{\rm ijk}}} \left( \xi \right)\leq {\rm s}_{{{\rm ik}}} } } & {for\,\, all\,\,i\ \in I,k \in K} \cr } $$
 $$\matrix{ {\mathop{\sum}\limits_i {t_{{ijk}} \left( \xi \right)\,{\equals}\,d_{{jk}} \left( \xi \right){\minus}y_{{jk}} \left( \xi \right)} } & {for\,\,all\,\,j \in J,k \in K} \cr } $$
 $$\matrix{ {{\rm w}_{{{\rm jk}}} \left( \xi \right){\rm y}_{{{\rm jk}}} \left( \xi \right)\leq {\rm \tau }_{{{\rm jk}}} } & {for\,\, all \,\,j \in J,k \in K} \cr } $$
 $$\matrix{ {t_{{ijk}} \left( \xi \right),y_{{jk}} \left( \xi \right)\geq 0 } & {for\,\, all\,\,i \in I,k \in K} \cr } $$
The objective function of the second stage problem (6) includes the total transportation duration and the penalty of unfulfilled demand. The total amount of medical supplies that will be shipped from a warehouse is bounded by the inventory levels of the corresponding warehouse for every supply type (7). Moreover, we add the balance constraint (8) to determine the unsatisfied demand amounts, y jk (ξ), and a non-negativity constraint for them to prevent favoring deliveries over the demand amounts. The constraint (9) ensures that the total penalty for each hospital and medical supply type is smaller than a threshold value, τjk. In this study, unfulfilled demand is not assumed and total availability of medical supplies is assumed to be sufficient for all scenarios.
Our SP model is a scenario-based optimization model. We assumed 3 major earthquake scenarios based on Richter magnitude scale rather than fault.Reference Mete and Zabinsky 6 In this model for the weekdays we assumed 9 working hours, 4 rush hours, and 11 non-working hours. We treated Saturdays as a workday and Sundays as non-working time. Thus, we had 168 hours in a week that were divided into 54 working hours, 24 rush hours, and 90 non-working hours. We proposed the probabilities of the 9 scenarios with respect to earthquake sequence and their probabilities (Table 1) since approximately 1500 years ago in Adana. 19 We calculated the occurrence probabilities for each scenario in Table 2.
Table 1 Earthquake Sequence in the Center of Adana
Table 2 Probabilities of ScenariosFootnote a
a Abbreviations: W, working times; R, rush hour times; N, non-working times.
Decision-makers can also plan with respect to the fluctuations in demand of the different hospitals in each scenario. We considered the fact that downtown Adana has a higher population during working hours, whereas residential areas are more populated in the non-working hours. On the other hand, the center of Adana is divided into 2 districts west and east of the Seyhan River. The district west of the Seyhan River has a high-density population in the center of Adana. Demand in hospitals near residential areas is increased during non-working hours. We assumed that the demand for hospitals in rush hour is balanced in different parts of the city.
In catastrophic events, due to excess recourse to hospitals, demand increases. In order to manage these situations, constraints were used at available medical supply warehouses. There are 7 medical supply warehouses in Adana, 2 of which are cooperative firms and the remaining of which are private firms. In addition, we considered 12 hospitals in the center of Adana city, 4 of which are private and the remaining of which are state hospitals. The location of the hospitals and warehouses are marked on the map shown in Figure 1.
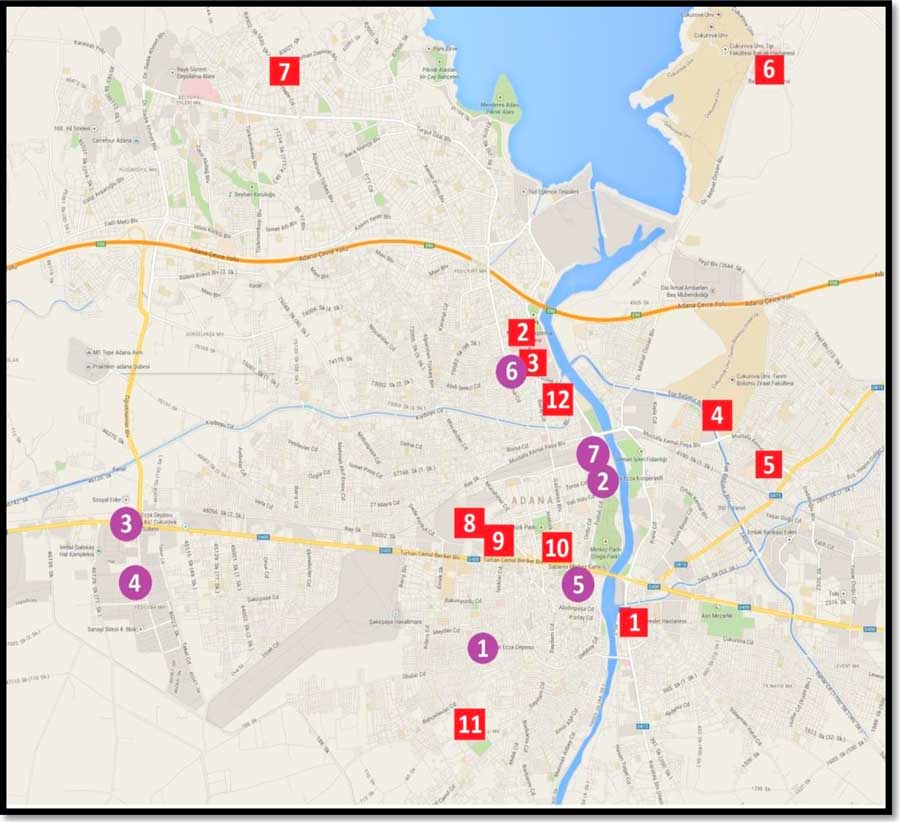
Figure 1 Location of Hospitals and Warehouses in the Center of Adana, Turkey.
We extracted the demand of hospitals for each scenario (Table 3) by considering the approximate number of injuries in each part of Adana (plan of disaster action and scenarios, Adana, 2008). Table 3 includes the amount of estimated demand for each hospital by using the predicted damage and population density in each scenario declared by Disaster and Emergency Management of Adana.
Table 3 Demand at HospitalsFootnote a
a Abbreviations: W, working times; R, rush hour times; N, non-working times.
In estimating the demands of hospitals, we considered the fact that downtown Adana has a higher population during working hours, whereas residential areas are more populated in non-working hours. Thus, we assigned relatively high demand to downtown hospitals during working hours for big earthquakes. Demand in hospitals near residential areas is increased during non-working hours. We assumed that the demand of hospitals is balanced in different parts of the city in rush hours. We assigned a large fixed value as a penalty coefficient to unsatisfied demand (w jk ) in the objective function to provide an incentive to satisfy the demand of hospitals with equal importance. The total availability of medical supplies (e k =18000) is assumed to be sufficient for all scenarios.
We determined 84 routes; each started from a warehouse and arrived at a hospital, depending on their locations in the city. The distance and transportation time between warehouses and hospitals under each scenario are provided in Table 4.
Table 4 Distances and Transportation Time Under ScenariosFootnote a
a Abbreviations: W, working times; R, rush hour times; N, non-working times.
The solution of the SP model was achieved by solving the deterministic equivalent of the model, which allowed us to compute the optimal first-stage decision when the second stage can be represented in a closed form. The SP model was coded in GAMS (GAMS Software GmbH, Frechen, Germany) and was solved by CPLEX solver in less than 1 minute in Windows 7 (Microsoft Corp, Redmond, WA) with a 64-bit operating system and 4 GB RAM.
RESULTS AND DISCUSSION
Because of the significant differences in building strength in a city, we proposed a new classification of scenarios by using Richter magnitude scales rather than the intensity scale. Major highways will experience substantial damage, partial closures, and collapsed small bridges, which will cause longer transportation times. The streets of the center of Adana, which are heavily traveled, are more likely to be damaged. When the Richter magnitude scale (scenarios) increases, significant disruption of utilities and damage to tall buildings in the downtown area are expected. Although our case study highlights earthquakes in Adana, our methodology can provide robust preparedness plans for many types of disasters in different cities. The availability of medical supply types, possible warehouse locations, and capacities should be determined in advance. We also need the frequently used routes from warehouses to hospitals as well as alternative routes according to the possible damage to transportation infrastructure. Our models can cover several types of medical supplies (k); in this case study, we considered a single type of medical supply for the sake of clarity in the representation.
According to the optimal solution, we selected 4 warehouses to actively store medical supplies in preparation for the possible scenarios (earthquakes). The major factor in warehouse selection is the sum of the total distance from the warehouses to the hospitals (f ij ). The sum of the total distances between warehouses and hospitals and their capacities are shown in Table 5.
Table 5 Selecting Warehouses
In the given case, selected warehouses 1, 5, 6, and 7 are closer to the downtown hospitals. Owing to the short distance between warehouse 1 and hospital 11 as well as the high-density population in the south of Adana, warehouse 1 is selected instead of warehouse 2.
One of the major parameters in the second stage is the transportation time (cij) under each scenario. In the rescue of victims and injured people, time is a crucial factor; thus, one of the most important goals in this study was accelerating deliveries of medical supplies in an earthquake. The second stage of the SP model proposes delivery amounts from warehouses to hospitals. The detailed results are presented in Table 6, which shows the transportation amount on each route from warehouse to hospital. The totals indicate the amount of supplies needed to be stored at each warehouse by scenario. In this case study, the demands of all hospitals are satisfied for all earthquake scenarios.
Table 6 Transportation AmountsFootnote a
a Abbreviations: W, working times; R, rush hour times; N, non-working times.
The northern and southern parts of center Adana lack enough hospitals. There exists only one hospital in the northern region (hospital 7) and one hospital in the southern region (hospital 11). Obviously, in the mentioned regions, an increase in the number of injuries in hospitals 7 and 11 under the non-working-hour scenario (N) is expected.
CONCLUSION
We offer a stochastic optimization approach to medical supply distribution and selection of warehouses in the preparedness phases. Our method takes advantage of a two-step approach. We planned our two-stage SP model for the center of Adana in Turkey, which is an earthquake-prone city. The goal of our SP model was the timely delivery of medical supplies and determining the amount of medical supplies delivered from warehouses to hospitals. In this study, we selected warehouses from a set of existing warehouses and determined their inventory levels in the first stage. In addition, we determined a transportation plan that includes amount of delivery of medical supplies in the second stage. Finally, our methodology is applicable to any city if the necessary data are provided by different stakeholders in disaster management.


