Health care facilities have been recognized as strategic buildings in hazardous events and play a key role in disaster rescues; however, no attempt to practically relate structural damage to the organizational aspects of a facility has been proposed so far. Extensive literature reviews are available on the definition of the main parameters of disaster resilience for health care systems and on the definition of the general framework,Reference Bruneau, Chang and Eguchi 1 , Reference Cimellaro, Fumo and Reinhorn 2 but no references are found regarding modeling and the measure of the organizational aspects of resilience. Indeed, organizational resilience is needed to be able to evaluate the response of the community to hazardous events and to evaluate the real loss in terms of healthy population and quality of care provided. This article describes the implementation of an organizational model describing the response of a hospital emergency department (ED).
Managing and improving processes are not possible in any organization without capturing knowledge about the models and also collecting measures about processes and compiling them into performance indicators at different levels of granularity. In the health care domain, similar to other domains, (i) collecting measures and (ii) pulling them together in the form of performance indicators are critical elements for drawing the overall picture representing states of care processes. The status of indicators can then be used to improve the effectiveness and efficiency of care processes. Delivering satisfactory health care services relies on effective and efficient care processes. Achieving and maintaining such qualities depend on continuously measuring the performance of processes.
Care processes are usually described informally. They are frequently complex and can be composed of numerous steps. These processes involve a variety of care-providing actors; these actors provide different care services to patients. Frequent transfer of responsibilities among the actors blurs the boundary lines of patient states, which are required to calculate basic measures such as waiting time (WT).Reference Richards, Crandall and Hubble 3 Take the example of a cardiac patient whose WT exceeds the regulatory limit of 1 hour. To identify the root cause of the excessive delay, fine-grained data about the patient, the current care process, and the involved actors must be aggregated into more abstract and meaningful measures that can be used by care administrators. The informal representation of complex cardiac processes makes it very difficult to know, with reasonable certainty, the exact steps of the process that are contributing to longer WTs.Reference Di Bartolomeo, Valent and Rosolen 4
Technical and Organizational Resilience
The main purpose of this research is to relate the technical aspects of health care facilities to their organizational aspects to obtain a measure of organizational resilience that has not been attempted so far. The goal is to relate the resilience index to the quality of care provided and the eventual loss of healthy population, caused by the performance of the health care facility during a disaster. Disaster resilience is defined in Equation 1.1 as the integral of the normalized function Q(t) indicating the capability to sustain a level of functionality or performance over a control period of time T LC . In other words, it describes the ability to recover from disastrous events.
 $$R=\mathop \int \nolimits_{t_{{OE}} }^{t_{{OE}} {\plus}T_{{LC}} } Q(t)/T_{{LC}} dt$$
Technical aspects are combined with organizational aspects, and the formulation of organizational resilience for a hospital facility is provided by using a hybrid simulation analytical model (metamodel) that can describe the response of the ED during a hazardous event. The system diagram in Figure 1 identifies the key steps of the framework to quantify resilience.
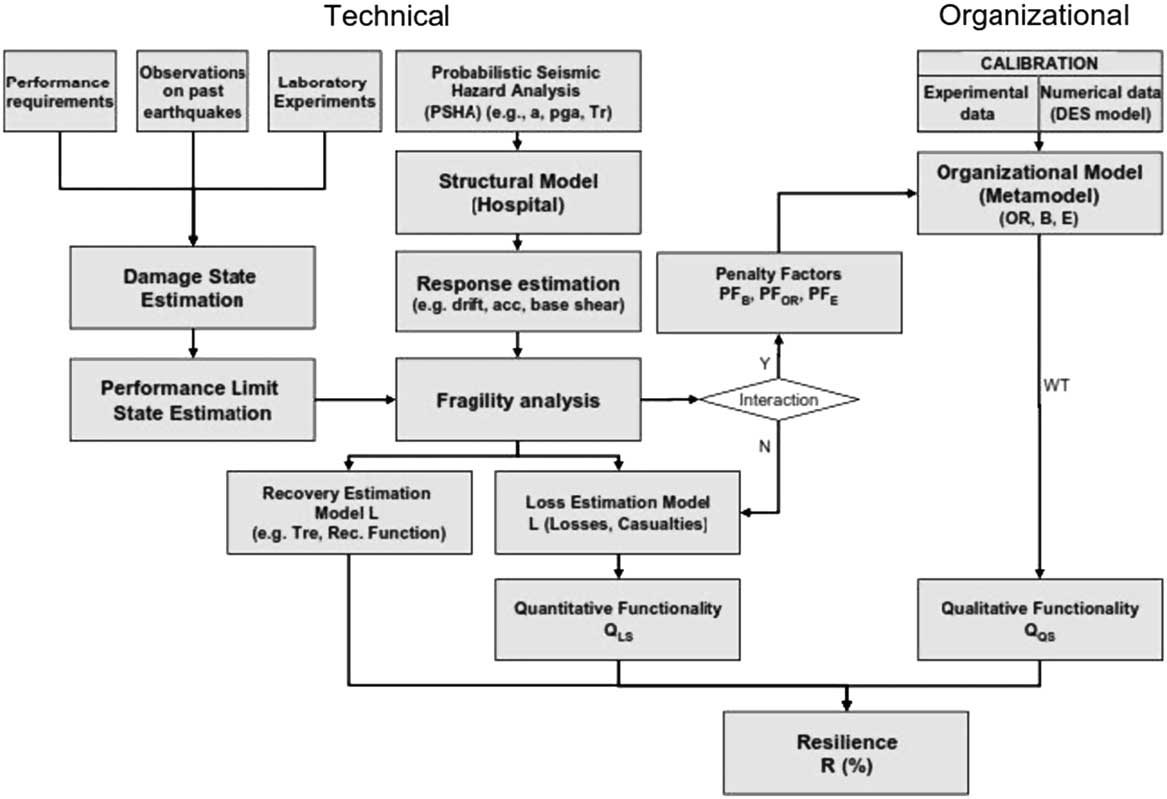
Figure 1 Resilience framework (Multidisciplinary Center for Earthquake Engineering Research approach). B indicates beds; DES, discrete event simulation; E, efficiency; OR, operating rooms; WT, waiting time.
In order to define resilience, it is necessary to first define the functionality Q of the hospital facility. Three definitions of functionality and its components are discussed below:
∙ a qualitative functionality related to the quality of service (QS),
∙ a quantitative functionality related to the losses in healthy population,
∙ a combined generalized functionality related to both qualitative (i.e., QS) and quantitative services.
In this article, functionality is defined as the combination of a qualitative functionality related to QS and a quantitative functionality related to the losses in healthy population. The qualitative functionality is related to QS and can be defined by using the WT spent by patients in the emergency room before receiving care. The WT is the main parameter for evaluating the response of the hospital during normal and hazardous event operating conditions. Common sense, but also a relevant literature review reported in various references,Reference Maxwell 5 - Reference Vieth and Rhodes 7 indicates that the functionality of a hospital is definitely related to the QS. Therefore, if a measure of QS is found, then it is possible to measure the functionality Q of the health care facility. MaxwellReference Maxwell 5 identified several multidimensional aspects of the QS. In particular, 6 dimensions were suggested, such as access to care, relevance of need, effectiveness of care, equity of treatment, social acceptability, and efficiency and economy. Each dimension needs to be recognized and requires different measures and different assessment skills.
A well-acknowledged study demonstrated that the WT in an ED can be used as a key parameter in the quantification of QS in health care settings.Reference Maxwell 5 WT is defined as the time elapsed between the received request of care by the hospital and the provision of care to the patient. Thompson et al.Reference Thompson, Yarnold, Williams and Adams 8 recognize that the WT is considered an important determinant of patient satisfaction, which results from meeting or exceeding patient expectations, but that providing information, projecting expressive quality, and managing WT perceptions and expectations may be a more effective strategy to achieve improved patient satisfaction in the ED than decreasing actual WT. An extensive review of the literature indicated that WT is a good indicator of the QS; therefore, QS can be defined by using the WT spent by patients in the emergency room before receiving care. Thus, WT is the main parameter for evaluating the response of the hospital during normal and hazardous event operating conditions. Shown in Figure 2 is the qualitative functionality that is the linear combination of two functions describing the QS of the hospital in saturated and nonsaturated conditions. In particular, as shown in Equation 1.2, in the nonsaturated condition, when λ≤λU, the quality of care is expressed by the function Q QS,1 (t), equal to
 $$Q_{{QS,1}} (t)={{{\rm max}((WT_{{crit}} \, {\minus} \, WT(t)),0)} \over {WT_{{crit}} }}\ if\ \lambda \leq \lambda _{u} $$
where
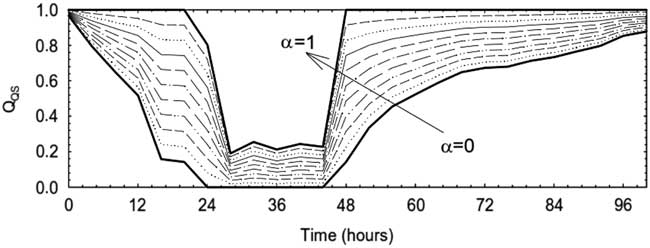
Figure 2 Qualitative functionality for different α factors. QS indicates quality of service.
λ(t)=arrival rate of patients at the hospital λU;
λU=critical arrival rate of patients when the hospital reaches the saturated condition;
WTcrit=critical waiting time of the hospital in the saturated condition, when λ=λU; and
WT(t)=waiting time when λ=λ(t).
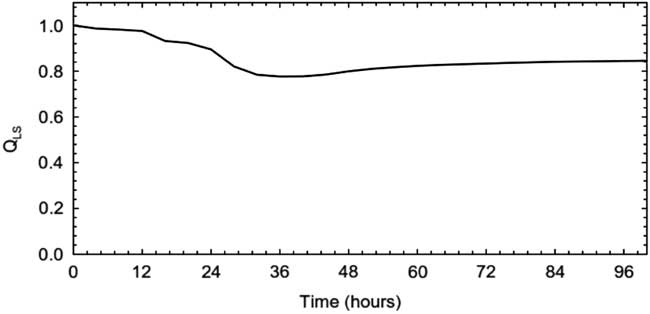
In the saturated condition, when the maximum capacity of the hospital is reached, the hospital cannot guarantee a normal level of QS, because the main goal now is to provide treatment to the most number of patients. Therefore, in this case, the number of patients treated N is a good indicator of functionality Q. The quantitative functionality Q LS (t) is then defined as a function of the losses L(t), which are defined as the total number of patients not treated N NTR versus the total number of patients requiring care N tot . The quantitative functionality Q LS for a large hospital (500 beds), with a high surgery capacity (15 operating rooms [ORs]), and the highest class of efficiency (1200 operations per OR per year) is shown in Figure 3. The total functionality Q(t) of the hospital that appeared in Equation 1.1 is given by the product of the two functionalities defined above
 $$Q(t)=Q_{{QS}} (t)\,.\,Q_{{LS}} (t)$$
where

Figure 3 Quantitative functionality (500 beds, 15 operating rooms, and 1200 class of efficiency).
Q QS (t)=qualitative functionality related to the quality of service and
Q LS (t)=quantitative functionality related to the losses in terms of healthy population.
In the literature, the evaluation of the performance of the hospital in the saturated condition, when the maximum capacity of the hospital is reached, is not considered. In this latter condition, the hospital cannot guarantee a normal level of QS, because the main goal now is to provide treatment to the most number of patients. Therefore, in this case, the number of patients treated NTR is a good indicator of functionality Q. The quantitative functionality Q LS (t) is then defined as a function of the losses L(t), which are defined as the total number of patients not treated (NNTR) versus the total number of patients requiring care (Ntot). In this case, the loss is given by the number of patients who are not treated as follows:
 $$QLS(t)=1\,{\minus}\,L(t)$$
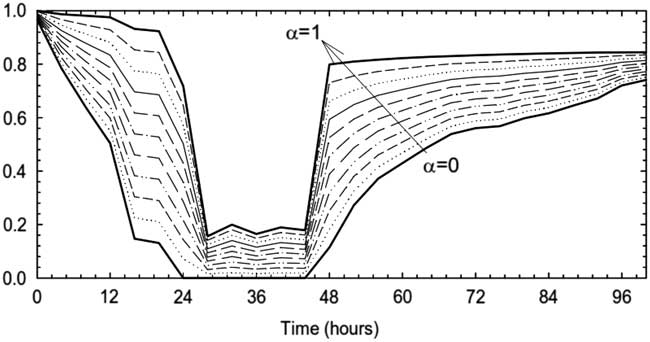
where the loss function is defined by the normalized patients not treated. The combined functionality and the sensitivity to the weighting factor of the qualitative part Q QS (t) is shown in Figure 4. It is important to mention that both Q QS and quantitative Q LS functionality require the estimation of the WT that is given in the next paragraph.

Figure 4 Combined functionality Q for different weighting factors.
Modeling Health Care Facilities
Health care systems are inherently complicated, in terms of details and dynamic and organizational aspects, because of the existence of multiple variables, which may produce an enormous number of connections and effects. A variety of modeling methods are available in the literature to represent hospital operations; these are summarized by model type in Cimellaro et al.Reference Cimellaro, Fumo and Reinhorn 2 Among the models described, the metamodel is the simplest because it requires less computational effort, is reliable, and can describe the dynamic behavior during the transition. Because all simulations are run off-line and the metamodel is developed in advance, system dynamic behavior can be obtained virtually instantaneously in real time. Therefore, the use of a continuous metamodel seems to be the best candidate for the description of a generic hospital because it satisfies all of the following requirements:
1. It represents the operations for any generic hospital;
2. It can be used in real time, with a great reduction in time consumption;
3. It describes the complexity of the hospital operations;
4. It captures the transient dynamic behavior of the hospital;
5. It predicts the long-term steady state behavior of the hospital; and
6. It uses the continuously changing dynamic arrival rate as input.
Assumptions in the Discrete Event Simulation Model
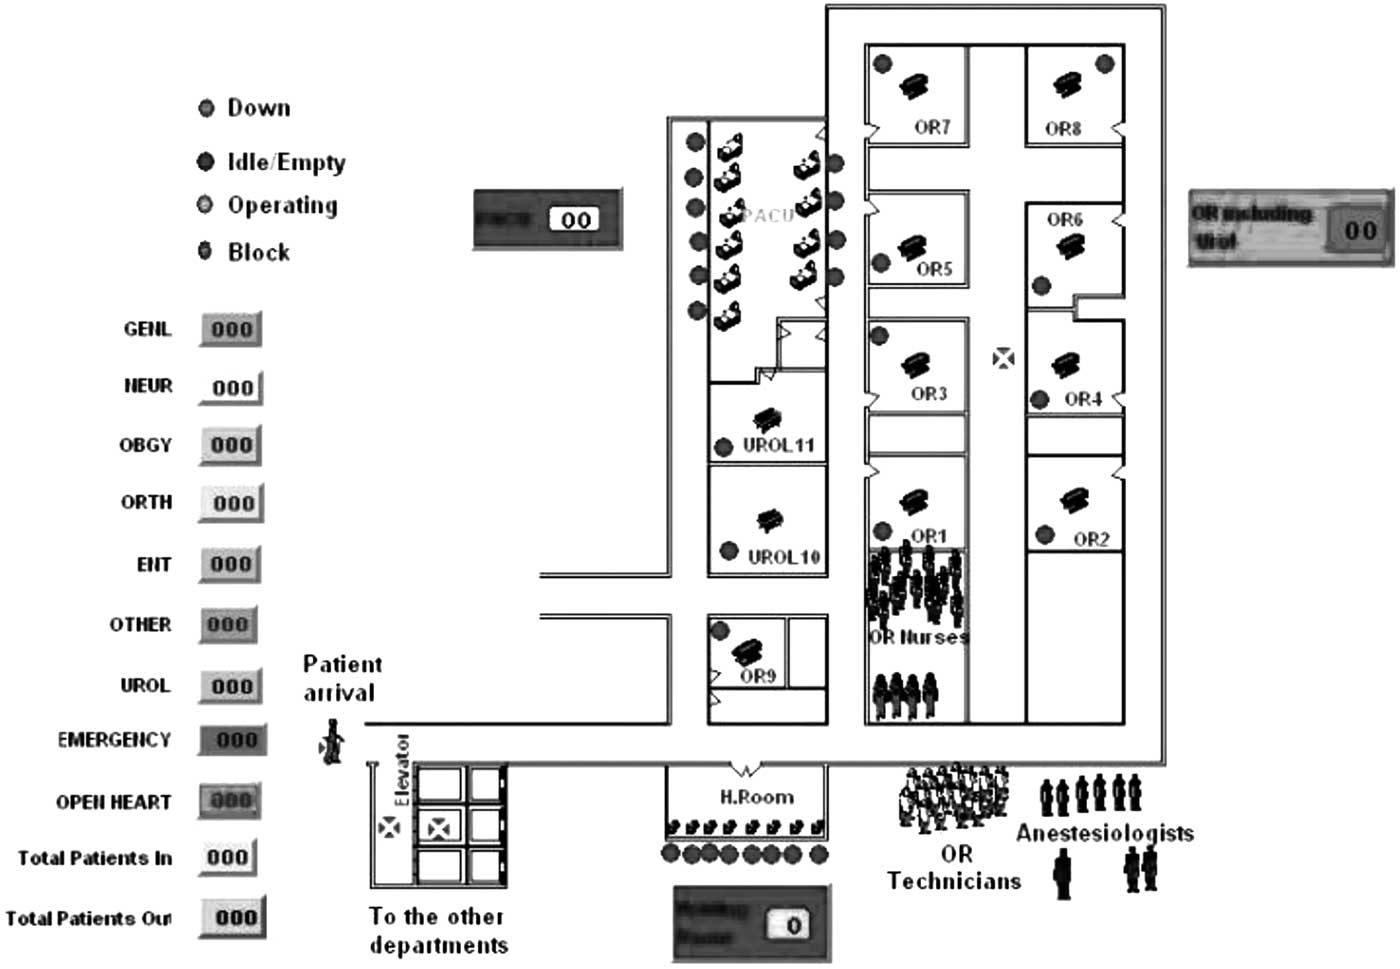
All of the parameters of the metamodel depend on the calibration done on the data generated by more complicated simulation models such as the discrete event simulation (DES) model. The results are strongly dependent on the assumption made at the simulation level. The parameters of the metamodel were obtained from a statistical analysis of a set of simulation runs performed by YiReference Yi 9 and Paul et al.Reference Paul, George, Yi and Lin 10 with use of the DES model. The structure of the ED of the Mercy Hospital located in Buffalo, NY, and the human resources have been modeled by using Promodel (Promodel Cooperation, Orem, UT), and the DES model is shown in Figure 5. It is assumed that all ORs have the same capability and a path processing assigns to each entity the routing through the system and defines which operation takes place at each location. Patients coming through the ED are treated in different units of the ED and after treatment are discharged and either leave the ED or are admitted for longer treatment to one of the other units of the facility. Each patient is assigned to a certain survivability time (WT) corresponding to his or her severity of injury according to the HAZUS definition. The survivability time gives the priority to accede resources, but when two patients of the same severity level attempt to enter the same unit, a First In, First Out (FIFO) rule is used.Reference Asmussen and Glynn 11

Figure 5 Discrete event simulation model of Mercy Hospital in Buffalo.
A more general model can be obtained by using off-line simulation runs, which can represent hospitals of various sizes and capabilities, which describes statistically one ensemble of hospitals located in California. The numerical simulations of the model described by YiReference Yi 9 provided the data for the calibration of the parameters of the metamodel described in the next paragraph.
In this article, the hospital functionality during a disaster is indicated by how quickly it can treat the injured patients. Therefore, it is directly correlated to the patient WT that is the response variable of the metamodel and it indicates how busy the hospital is. The mathematical formulation for the evaluation of WT is taken in analogy with the model of a manufacturing production line system in Yi,Reference Maxwell 5 because the transient behavior of the hospital during a disaster resembles that of a machine breakdown in a manufacturing production line. WT depends on internal and external organizational factors. The internal factors are the number of beds (B), the number of ORs, the resources, and staff productivity; the arrival rate and the patient mix are the external inputs that can be defined as the percentage of patients who need the OR, which is the most critical resource in the disaster condition. Regarding capacities, emergency rooms and labs are assumed to be proportional to the size of the hospital (i.e., the number of beds) and are not a direct input of the simulation model. The resources and staff productivity as well as the equipment and instruments are not modeled explicitly, but with the efficiency factor E, which provides the number of surgeries per OR per year.Reference Soong 12
By combining the potentiality of off-line simulation runs and the capability of metamodeling to describe the transient behavior of the system, a generic hospital model is built and calibrated, according to the ED patient volume, hospital size, and operating efficiency considered. The metamodel obtained in this way is built in two steps:
1. Off-line simulations (normal condition). In this phase, the calibration of the parameters of the model is based on hospital steady-state behavior under a constant arrival rate. The initial parameters of the model are usually provided by numerical simulations and national statistics. In particular, three steady-state conditions are considered:
a) Normal operative condition: This is the steady state in which the hospital copes with the normal arrival rate expected in a facility of that size and the efficiency and normal duties of nurses, doctors, physicians, and anesthetists.
b) Base case condition: This is the instant in which, after the disaster strikes, the hospital activates the emergency plan, calls all physicians and nurses on duty, and accedes to the emergency resources. It is assumed that there is a delay between activation of the emergency plan and the highest flow of patients in the hospital. Thus, it can be assumed that the arrival rate in the base condition is equal to the normal arrival rate.
c) Critical case condition: This is the steady state reached by the hospital in the saturated condition, in which all the resources are used and no further patients can be accepted. The hospital works at full capacity and be overcapacitated with any additional input.
2. Online simulations during the disaster condition. In this phase, the results of the off-line simulation are used to build the response of the hospital in real time, when the disaster patient flow reaches the ED.
Continuous Metamodel
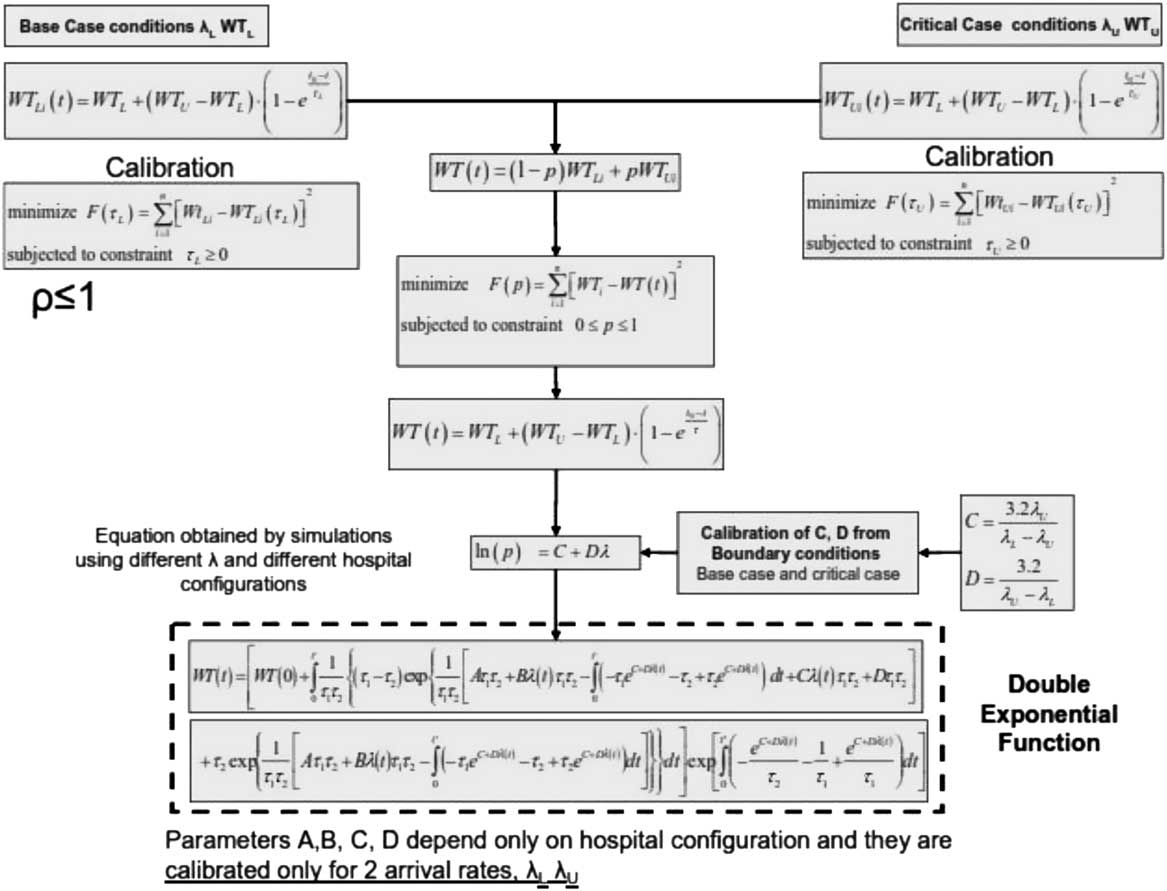
The main parameters of response of the hospital are divided into internal organizational factors and external ones. The number of beds (B), the number of ORs, the resources, and staff productivity belong to the first group; the arrival rate λ and the patient mix α are the external inputs that can be defined as the percentage of patients who need the OR. The mathematical formulation for the evaluation of WT is taken in analogy with the model of a manufacturing production line system in Yi.Reference Yi 9 A double exponential function that allows generic modeling of transient WT is considered and the procedure to calibrate the double exponential function is described in the flowchart shown in Figure 6. Using the double exponential function, it is possible to calibrate the time constant for only the base case and the critical case, without the need for simulation runs for any patient arrival rate. Further details about the method can be found in Cimellaro et al.Reference Cimellaro, Reinhorn and Bruneau 13

Figure 6 Flowchart of double exponential function.
Case Study: Statistical Hospital Model of a California Hospital
The example shown is a statistical hospital model, representative of a typical configuration of a Californian hospital. Three levels for each of the following parameters, the number of beds (B=100, 300, 500), the number of ORs (OR=5, 10, 15), and the efficiency (E=600, 900, 1200) are used. In total, 27 combinations are possible, but only 21 feasible combinations were considered. The parameters of the metamodel are calibrated from the statistical analysis of data obtained on a set of simulation runs performed by YiReference Yi 9 and Paul et al.,Reference Paul, George, Yi and Lin 10 using a DES model during the post-earthquake event. Regression equations are obtained for both pre-earthquake and post-earthquake WTs by using average daily patient arrival rates calculated from national statistics. For the case of patient inflow to an ED during an earthquake, the only data available are those collected during the Northridge Earthquake, which are the data used in this example. The sensitivity analysis of resilience to the main parameters that characterize the organizational metamodel were investigated. As shown in Figure 7, for a medium-sized hospital (B=300), the best way to improve the organizational resilience of the hospital is to increase the number of ORs, generating an increment of the resilience index up to 40%.
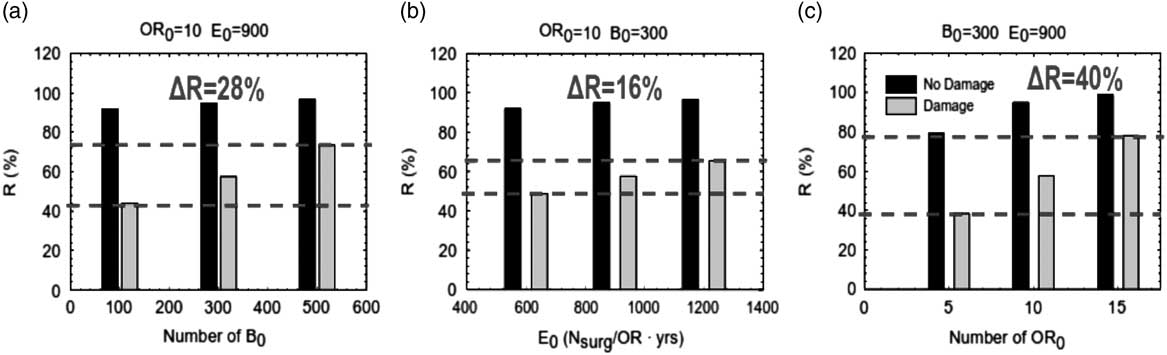
Figure 7 Increments of the resilience index versus different internal parameters B, OR, and E. B indicates beds; E, efficiency; OR, operating rooms.
The metamodel also considers the capabilities of the staff and the existence of an emergency plan during the disaster. During a disaster, a facility may elect a tiered response, which provides for different actions to be taken according to the number of casualties expected. The hospital can apply the so-called “surgery in place response”: it can increase its capability with a premature discharge of the inpatients already present, adapt the existing surgery capacity, and organize temporary external shelters.Reference Hick, Hanfling and Burstein 14 A large portion of inpatients can be discharged within 24 to 72 hours in the event of a mass casualty accident. The discharge function is not an exact science, and there is no mathematical formulation. Usually, 10% to 20% of operating bed capacity can be mobilized within a few hours, and the availability of ORs can increase 20% to 30%. The external shelters can provide additional room for the triage and first aid of the injured, thus reducing the pressure on the hospital by allowing the staff to concentrate on the nonambulatory patients. Triage and initial treatment at the site of injury, the so-called “off-site patient care,” can relieve pressure on the emergency transportation and care system or can relieve pressure when local health care is damaged. It is assumed that doctors’ skills can increase the efficiency of the hospital up to 20%. On the other hand, the existence of the emergency plan, which can be applied with a certain delay, can increase the number of ORs and the number of beds, respectively, by 10% and 20%. The effect of the application of the emergency plan on the values of resilience has been investigated. It is assumed that the emergency plan increases the number of beds by 10% and the surgery capacity (number of ORs) by 30%. The values of the penalty factors before and after the application of the emergency plan for the three size classes considered are reported in Table 1.
Table 1 Penalty factors before and after the application of the emergency plan

Abbreviations: B, beds; eff, efficiency; EP, emergency plan; OR, operating rooms; PF, penalty factor.
The variation of the organizational resilience is illustrated in Figure 8 as a function of the time of application of the emergency plan. The emergency plan generates a sudden increase in the values of the organizational parameters (in this case, the number of beds and the number of ORs) with a certain delay from the stroke of the earthquake (0, 4, 8, 16, and 24 hours). The emergency plan has a beneficial effect only in the case of medium- and large-sized hospitals, with a medium to high surgery capacity (10 to 15 ORs) as shown in the figure. The figure also shows that the performance in terms of hospital resilience increases up to 20% for medium-sized and high-efficiency hospitals and the number of patients treated is up to 20 units higher.
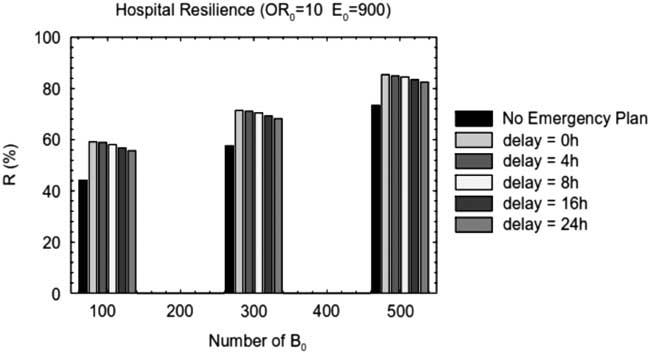
Figure 8 Effect of the emergency plan on the configuration with 10 ORs and E=900 operations per year for different sized hospitals. B indicates beds; E, efficiency; OR, operating rooms.
Concluding Remarks
In this article, the technical and organizational aspects of health care facilities to obtain a measure of disaster resilience that has not been attempted so far are introduced. The resilience index is directly related to the quality of care, measured through the WT, and to the eventual loss of healthy population, caused by the performance of the health care facility during an extreme event. An organizational metamodel for health care facilities (e.g., hospitals) has been defined and implemented that can measure the hospital capacity and the dynamic response of the hospital ED in real time by use of a single parameter: the WT before the service can be received. The WT is described by using a double exponential function that has been opportunely modified to take into account the behavior of the ED in overcapacitated conditions. Furthermore, the effect of damage to structural and nonstructural components inside the hospital is incorporated into the organizational model by using penalty factors. The metamodel has been designated to cover a large range of hospital configurations and takes into account hospital resources, in terms of staff and infrastructures, operational efficiency and the possible existence of an emergency plan, maximum capacity, and behavior in both saturated and overcapacitated conditions. In order to illustrate the methodology, an example of a statistical hospital model representative of a typical Californian hospital was implemented. The results based on the example showed that for a medium-sized hospital of 300 beds, the most significant way to improve the performance of the ED during a disaster is to increase the number of ORs, whereas the presence of an emergency plan has a beneficial effect only in the case of medium- and large-sized hospitals.
The metamodel does not need to remain static. It can be updated through additional inputs as more simulation replications become available. The metamodel could also be updated through direct observation of the system, if that were possible. Both of these additional training methods could be applicable to the ED. More simulations may be run as computational resources and time allow, and the system may be observed directly through special studies or daily records. However, changes to the simulation (e.g., distribution parameters, addition or subtraction of variables) would invalidate the network metamodel, and a new metamodel reflecting the altered simulation would need to be developed. Future research efforts in this area should include communication strategies, patient tracking, and a general methodology for variance estimates and should work on establishing the trade-offs of using simulation computation time for replications versus new training points. Updating the metamodel with new simulation runs could also be investigated to develop a workable methodology. Another area mentioned in the previous section is the use of statistics besides mean and variance to account for asymmetries in the system. This is especially applicable in ED simulations of patient time in the system, where one would expect a skewed distribution. The authors are pursuing efforts in all these areas.
A framework for integrating modeling, simulation, and visualization tools can help to address some of the requirements of the first responders, in particular, for the command and control personnel at the state, regional, and national level Emergency Operations Centers. Integration of such tools will allow looking at the overall picture and will help to guide better decision making. It will allow the bringing together of tools from various modeling domains such as plume dispersion, traffic movement, communication processes, and hospital operations to rapidly build a virtual representation of an emergency response scenario.Reference Jain and McLean 15
Because this research covers several heterogeneous topics, many future research directions can arise out of it. Here we briefly characterize some of these research issues.
∙ Further research on RFID (radio frequency identification) implementation in ED. Actual full-scale RFID implementation affects many aspects of ED functioning. Therefore, to make a final decision on actual full-scale implementation of RFID, a more comprehensive simulation study is needed.
∙ Numerous practical and research challenges arose prior to this relocation of the hospital operations. For example, multi-skilled emergency medicine physicians will work in the new ED, in contrast with the previous state, where internal and trauma patients were treated by different physician teams.
∙ Enhancing forecasting algorithms. This issue deserves additional research effort. For example, an alternative approach to arrival load forecasting has been presented in which the authors estimate the parametric rate function of a nonhomogeneous Poisson process.Reference Jain and McLean 15 - Reference Kuhl, Wilson and Johnson 18 Verifying whether these methods provide better goodness-of-fit to our data than long-term moving average (MA) is an interesting research topic.
∙ Integration between ED simulators and hospital data repositories. The Service Engineering Enterprise Center at the Faculty of Industrial Engineering and Management in the Technion has created and maintained data repositories from service systems. These are all based on the DataMOCCA model.Reference Trofimov, Feigin and Mandelbaum 19 The model provides a uniform presentation of (mainly operational) data from various sources for statistical analysis, operations research, and simulation. Initially designed for call center data storage and processing, DataMOCCA was generalized to accommodate other sources and types of data, including health care data in general and ED data in particular. Indeed, repositories at the Service Engineering Enterprise Center now contain data from the EDs and internal wards of several hospitals.
To increase processing speed, Service Engineering Enterprise Center databases are designed in two levels, containing as the second level precompiled summary tables, which are created once and are efficient enough to support online (few-seconds) processing. This provides an environment that is suitable for real-time statistical analysis and simulations. In addition, software for statistical algorithms (including fitting of parametric and mixture distributions, survival analysis, etc) has been developed and connected to the databases.
Data from any hospital, in particular Service Engineering Enterprise Center data, can be used by our simulation model. Moreover, the statistical capabilities of DataMOCCA could be integrated into the simulator. Note that enhancement of data-collection methods (using, RFID, for example) will increase the benefits of such an integration. For example, estimates of service times for nurses and physicians will be derived from the database, whereas field studies are now required to incorporate them into the model.