Developing the ability to recognize and regulate one's emotions in accordance with contextual demands (i.e., emotion regulation) is a central developmental task of early childhood (Blair & Raver; Reference Blair and Raver2015; Cole, Martin, & Dennis, Reference Cole, Martin and Dennis2004; Thompson & Goodman, Reference Thompson, Goodman, King and Sloan2010). Nonetheless, some children struggle with these skills; many showing behavioral and/or physiological response patterns that undermine their abilities to adapt flexibly to emotionally salient experiences (Beauchaine, Gatzke-Kopp, & Mead, Reference Beauchaine, Gatzke-Kopp and Mead2007; Cicchetti, Ackerman, & Izard, Reference Cicchetti, Ackerman and Izard1995; Gross & Jazaieri, Reference Gross and Jazaieri2014). These patterns of emotion dysregulation, in turn, pose risks for a litany of subsequent psychopathological outcomes across the life course (see Aldao, Gee, De Los Reyes, & Seager, Reference Aldao, Gee, De Los Reyes and Seager2016; Beauchaine, Reference Beauchaine2015a; Sheppes, Suri, & Gross, Reference Sheppes, Suri and Gross2015). Efforts to address problems with emotion regulation in childhood before they cascade to later developmental tasks require a better understanding of processes that influence the development of emotion dysregulation, particularly in contexts that vary in risk. The purpose of this study was to examine emotion dysregulation at both the behavioral and the physiological levels for children from a range of early life experiences, using an underutilized analytic strategy for capturing cardiac dynamics.
Emotion Regulation and Dysregulation
Several recent reviews have outlined the historical challenge of establishing a common working definition of emotion regulation (e.g., Beauchaine, Reference Beauchaine2015a, Reference Beauchaine2015b; Compas et al., Reference Compas, Jaser, Bettis, Watson, Gruhn, Dunbar and Thigpen2017; Eisenberg, Spinrad, & Eggum, Reference Eisenberg, Spinrad and Eggum2010; Jones, Bailey, Barnes, & Partee, Reference Nelson-Le Gall2016; Nigg, Reference Nigg2017). Similar to others (e.g., Nigg, Reference Nigg2017), we define emotion regulation as behavioral and/or physiological response patterns that support children's abilities to maintain goal-directed behavior or allostasis in the context of affectively salient stimuli. Emotion regulation is a complex process that draws from a variety of internal (e.g., approach/inhibition tendencies; emotion understanding; and cognitive control) and external sources (e.g., social and physical affordances). It can reflect the downregulation of salient prepotent emotional tendencies, for instance, minimizing angry or overly exuberant responses, when they would otherwise interrupt a desired social interaction. It can also reflect the upregulation of emotional responses that counter one's dominant response tendencies, for example, ramping up positive emotions in an empathic response to a social partner's needs. It can be effortful or automatic (Eisenberg et al., Reference Eisenberg, Spinrad and Eggum2010; Gross & Thompson, Reference Gross, Thompson and Gross2007) and manifest as a state or as a more stable trait.
From a dynamical systems perspective, emotion regulation can be seen as an “emergent property” arising spontaneously from interactions of these bottom-up and top-down processes to produce complex adaptive patterns at a given time—interactions that yield emergent, softly assembled structures (Barrett, Wilson-Mendenhall, & Barsalou, Reference Barrett, Wilson-Mendenhall, Barsalou and Gross2013; Thelen & Smith, Reference Thelen and Smith1996). From this perspective, “complex” refers to nonlinear interactions across multiple loci and scales, rather than simply the involvement of many component parts. In dynamical systems theory, complexity reflects a fundamental context-sensitivity of each constituent part that either disallows removing any single part or ensures that the removal of any single part will change that part's meaning/purpose. Emotion dysregulation manifests when the overall organization of the underlying processes breaks down, such that necessary connections between constituent parts become increasingly random or increasingly rigid to change. Taken another way, effective regulatory organization is supported by internal organization that is neither too rigid nor too disconnected.
Transient bouts of emotion dysregulation are normative, in young children and adults alike. Negotiating the ebb and flow of passing dysregulatory states is likely vital to building self-regulatory skills in childhood (Lyons, Parker, & Schatzberg, Reference Lyons, Parker and Schatzberg2010; Berry et al., Reference Berry, Blair, Willoughby, Granger and Mills-Koonce2017; Blair, Berry, & Family Life Project Key Investigators, Reference Blair and Berry2017). However, when protracted and extreme, emotion dysregulation has been implicated as a transdiagnostic marker of psychopathological risk (see Aldao et al., Reference Aldao, Gee, De Los Reyes and Seager2016; Compas et al., Reference Compas, Jaser, Bettis, Watson, Gruhn, Dunbar and Thigpen2017; Eisenberg et al., Reference Eisenberg, Spinrad and Eggum2010).
The Autonomic Nervous System (ANS)
A well-developed literature places ANS functioning as an important physiological indicator of regulatory capacity (Beauchaine & Thayer, Reference Beauchaine and Thayer2015; Calkins, Graziano, & Keane, Reference Calkins, Graziano and Keane2007; Porges, Reference Porges1995, Reference Porges2007). Comprised by its sympathetic and parasympathetic branches, the ANS serves as the hub of the central autonomic network (CAN; Benarroch, Reference Benarroch1993; Smith, Thayer, Khalsa, & Lane, Reference Smith, Thayer, Khalsa and Lane2017; Thayer & Lane, Reference Thayer and Lane2000), a structural and functional network supporting bidirectional connections between the ANS and cortical (e.g., prefrontal cortex and anterior cingulate cortex) and subcortical (e.g., limbic and mesolimbic) neural regions implicated in goal-directed behavior and motivation. Collectively, the CAN supports the flexible integration of physiological, neurocognitive, and behavioral responses to changing experiential demands and goal states.
Much of the literature regarding ANS and emotion regulation has concerned parasympathetic functioning (Porges, Reference Porges1995, Reference Porges2007; Thayer & Lane, Reference Thayer and Lane2002) as indexed by respiratory sinus arrhythmia (RSA). RSA represents a band of high-frequency heart rate variability that occurs across successive respiratory cycles thought to reflect vagal control of the heart (Porges, Reference Porges1995, Reference Porges2007). The myelinated vagus (Xth cranial nerve) is a central locus of parasympathetic influence on peripheral and central nervous system integration. Porges's polyvagal theory (Reference Porges1995, Reference Porges2007) highlights the regulatory role of the vagus on sympathetic, endocrine, and social communication, where changes in vagal efference inhibit sympathetic and hypothalamic–pituitary–adrenal axis activity. Greater resting vagal tone leads to a calm state, reflective of the “rest and digest” parasympathetic branch of the ANS. In low-stress situations, greater vagal tone promotes social approach and engagement and is considered to reflect an individual's general readiness to adapt to change. In the context of challenge, withdrawal of vagal control (and corresponding suppression of RSA) promotes a physiological state and is, thus, considered to be an index of regulatory capacity.
Thayer and Lane's (Reference Thayer and Lane2000) neurovisceral integration (NVI) model and its more recent iterations (Smith et al., Reference Smith, Thayer, Khalsa and Lane2017) also situate vagal influences as central to an extensive array of coordinated regulation-related processes. Like polyvagal theory, this includes more local regulatory organization of the ANS on cardiovascular and endocrine function. However, the NVI model also highlights explicitly the role of the PNS in the complex, real-time integration of interoceptive and contextual information from the viscera and limbic system—in particular, the frontotemporal processes required to organize these high-dimensional data streams. Collectively, this massive, dynamic coordination is required to predict and revise adaptive internal and behavioral responses to contextual demands (i.e., self-regulate; Barrett et al., Reference Barrett, Wilson-Mendenhall, Barsalou and Gross2013).
At its roots, the NVI model is grounded in dynamical systems thinking (e.g., Thayer & Friedman, Reference Thayer, Friedman and Vingerhoets1997; Thayer & Lane, Reference Thayer and Lane2000). These authors posit that emotions represent attractor states, or preferred organizations, that emerge in the context of particular, softly assembled arrangements of these internal processes, given particular external demands. Here, emotion dysregulation reflects being “stuck in an attractor or behavioral pattern” that is unresponsive to changing contextual demands (Thayer & Lane, Reference Thayer and Lane2000, p. 203).
Empirical evidence from over the past 20 years indicates that vagal tone and phasic vagal reactivity support regulation in the context of challenge and, ultimately, more optimal child outcomes. Higher levels of resting vagal tone (indexed via resting RSA) and/or moderate RSA suppression to experiential challenge have been linked with an extensive array of regulation-relevant behavioral outcomes in childhood (see Beauchaine et al., Reference Beauchaine, Bell, Knapton, McDonough-Caplan, Shader and Zisner2019; Beauchaine & Thayer, Reference Beauchaine and Thayer2015; Zahn et al., Reference Zahn, Adams, Krohn, Wenzel, Mann, Gomille and Kubiak2016), ranging from better behavioral regulation to frustrating social and cognitive challenges (Calkins, Smith, Gill, & Johnson, Reference Calkins, Smith, Gill and Johnson1998; Forbes, Fox, Cohn, Galles, & Kovacs, Reference Forbes, Fox, Cohn, Galles and Kovacs2006; Lewis, Hitchcock, & Sullivan, Reference Lewis, Hitchcock and Sullivan2004; Shahrestani, Steward, Quintana, Hickie, & Guastella, Reference Shahrestani, Stewart, Quintana, Hickie and Guastella2014), to executive attention (Feldman, Reference Feldman2009; Richards, Reference Richards1987; Suess, Porges, & Plude, Reference Suess, Porges and Plude1994), and empathic responding (Hastings, Miller, Kahle, & Zahn-Waxler, Reference Hastings, Miller, Kahle, Zahn-Waxler, Killen and Smetana2014; Taylor, Eisenberg, & Spinrad, Reference Taylor, Eisenberg and Spinrad2015). Alternatively, excessively low resting vagal tone and/or comparatively blunted phasic responses to challenge have been implicated in childhood and adolescent psychopathology, including anxiety (Schmitz, Kramer, Tuschen-Caffier, Heinrichs, & Blechart, Reference Schmitz, Krämer, Tuschen-Caffier, Heinrichs and Blechert2011), depression (Patriquin, Lorenzi, Scarpa, & Bell, Reference Patriquin, Lorenzi, Scarpa and Bell2014; Patriquin, Lorenzi, Scarpa, Calkins, & Bell, Reference Patriquin, Lorenzi, Scarpa, Calkins and Bell2015; see Koenig, Kemp, Beauchaihne, Thayer, & Kaess, Reference Koenig, Kemp, Beauchaine, Thayer and Kaess2016), and aggression, attention, and conduct problems (see Beauchaine, Reference Beauchaine2012; Beauchaine et al., Reference Beauchaine, Gatzke-Kopp and Mead2007, Reference Beauchaine, Bell, Knapton, McDonough-Caplan, Shader and Zisner2019; Graziano & Derefinko, Reference Graziano and Derefinko2013).
Complexity and the CAN
Converging theoretical and empirical evidence suggests that atypical parasympathetic functioning serves as a physiological indicator common to both behavioral indices of emotion dysregulation and broader manifestations of psychopathology in children and adolescents. Of note, it is also well recognized that our common measures of parasympathetic processes (e.g., RSA) reflect a “snapshot in time,” with respect to the complex cross-system dynamics of CAN functioning. Informed by work in statistical physics and dynamical systems modeling, there is increasing evidence that cardiac time series data carry nonlinear, or complex, statistical signatures reflecting the multisystem, multiscale, and highly interactive nature of cardiac activity (see Barbieri, Scilingo, & Valenza, Reference Barbieri, Scilingo and Valenza2017). When considered in the context of negotiating real-time adaptations to changing demands, we propose that the complexity of cardiac time series may shed important light on the dynamics of the CAN.
Cardiac fractality
Despite their highly interactive and nonlinear properties, complex systems carry organizational structures that can be formalized mathematically. In particular, complex systems often show fractal patterns, marked by repeated, self-similar organization across a variety of scales (Mandelbrot, Reference Mandelbrot1977). Mathematically, fractals reflect power-law scaling, such that a relation at one level is proportionally similar across nested levels of observation. Common examples of spatial fractality include the self-similarity of mountain ranges, riverbeds, and vasculature, where organizational structures repeat across nested levels of spatial resolution.
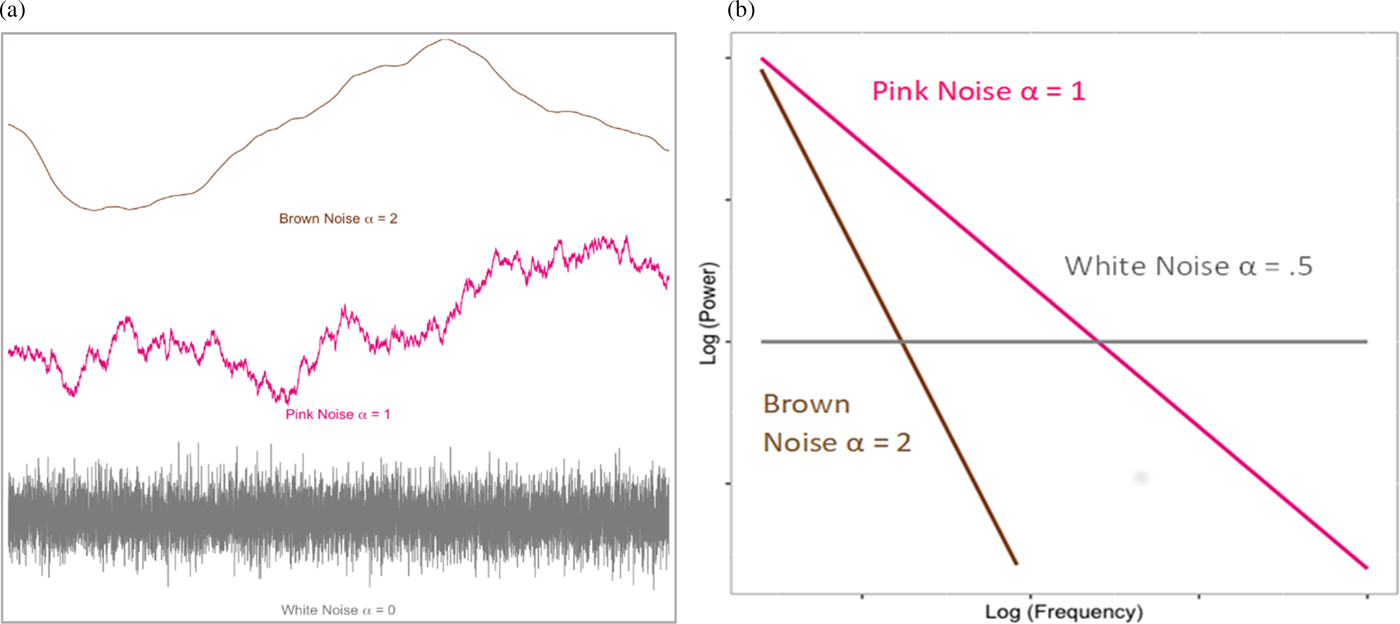
Fractal organization is also evident in the temporal dynamics of complex systems. A number of algorithms can be used to estimate time series fractality; however, they typically converge on the idea of capturing the long-term interrelatedness (or “color”) of the time series (Figure 1a). Completely random temporal variability represents white noise. At the other extreme, highly self-similar or rigid series can be represented as brown (or Brownian) noise. Optimal (i.e., fractal) complexity is thought to occur in the middle of this distribution, pink noise, where there is order to the temporal system, without it being overly constrained. As such, systems showing pink noise are self-organized, yet also readily flexible to change. When the complexity of a system can be captured by a single parameter, the system is monofractal. However, systems can also exhibit multiple power laws, or “multifractality,” which allow the system to tune its pink noise to suit more drastic structural or contextual change. Substantively, the fractal nature of such time series is interpreted as the long-term memory of the system, how preceding events in the system cascade to affect downstream functioning.
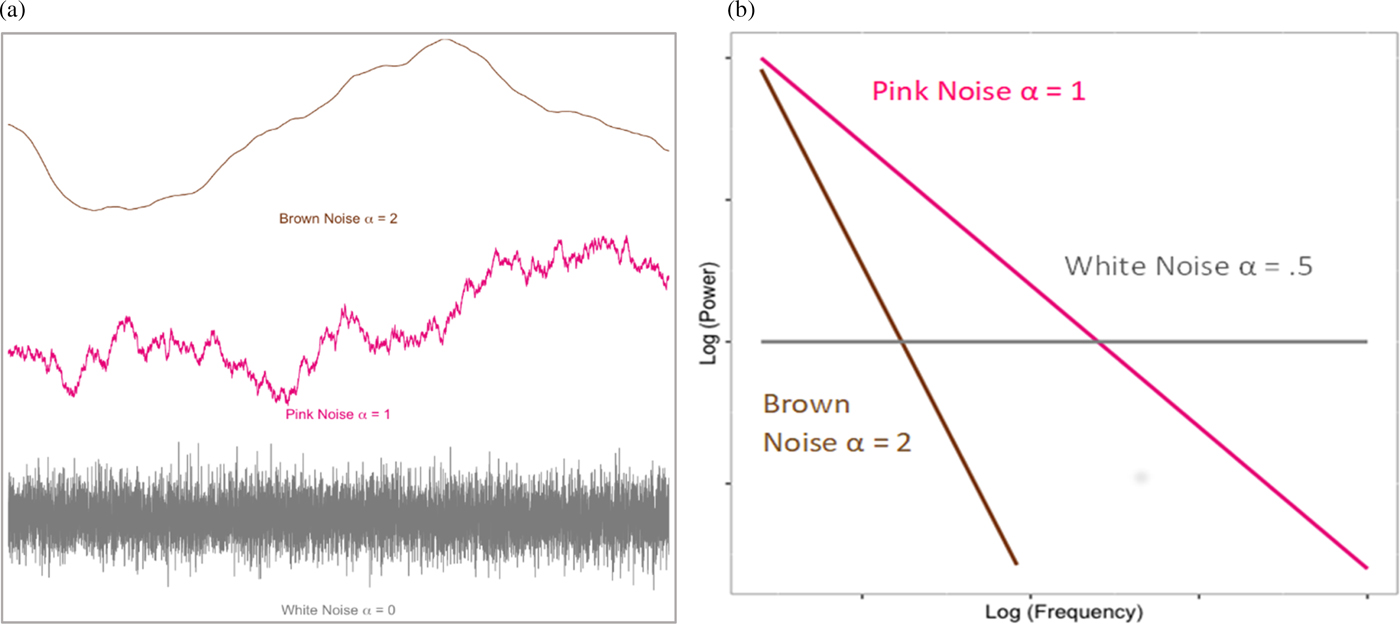
Figure 1. (a) Simulated example of time series noises. (b) “Power law” relation between (log), power, and (log) frequency of the fluctuations defined by respective noise series in (a).
Heart rate variability (HRV) is widely known to show fractal properties—complexity typically ascribed to the far-reaching dynamics between the ANS and its vast connections throughout the peripheral and central nervous systems (Barbieri et al., Reference Barbieri, Scilingo and Valenza2017; Seoane-Collazo et al. Reference Seoane-Collazo, Fernø, Gonzalez, Diéguez, Leis, Nogueiras and López2015; Thayer & Lane, Reference Thayer and Lane2000; Thayer & Sternberg, Reference Thayer and Sternberg2006). An accumulating literature indicates that HRV fractality tends to be associated with optimal system functioning across a number of health and psychologically relevant outcomes. For example, developmentally normative HRV tends to show complex fractal organization throughout much of life, yet precipitous declines into senescence (Beckers, Verheyden, & Aubert, Reference Beckers, Verheyden and Aubert2006; Pikkujamsa et al., Reference Pikkujämsä, Mäkikallio, Sourander, Räihä, Puukka, Skyttä and Huikuri1999). In adulthood, loss of HRV complexity has been considered to be a broad predictor of mortality and morbidity across a number of pathological states, such as arterial fibrillation or cardiometabolic dysfunction (Angelini et al., Reference Angelini, Maestri, Marinazzo, Nitti, Pellicoro, Pinna and Tupputi2007; Costa, Goldberger, & Peng, Reference Costa, Goldberger and Peng2002; Vikman et al., Reference Vikman, Mäkikallio, Yli-Mäyry, Pikkujämsä, Koivisto, Reinikainen and Huikuri1999). These changes mirror and likely partially reflect similar long-term trajectories observed for RSA (Masi, Hawkley, Rickett, & Cacioppo, Reference Masi, Hawkley, Rickett and Cacioppo2007).
Although studied far less often, similar findings extend to mental health and psychological outcomes (see de la Torre-Luque, Bornas, Balle, & Fiol-Veny, Reference de la Torre-Luque, Bornas, Balle and Fiol-Veny2016). For example, meta-analytically, adults and adolescents suffering from major depression show evidence of HRV patterns that are less complex than their matched peers. Recent work with preschoolers suggests that engaging in tasks that require executive function (EF) following a period of low demand (resting baseline) may produce a shift from nonfractal to fractal patterns of HRV complexity (Berry & Stallworthy, Reference Berry and Stallworthy2018). Further, for children who were challenged by the task (i.e., not at ceiling), there was an inverted-U relation between HRV complexity and EF accuracy and reaction times. EF performance was optimal when HRV complexity was in the fractal range (~1), compared with more random or rigid time series organization.
Cardiac sample entropy
A second index of complexity (i.e., sample entropy; SampEn; Richman & Moorman, Reference Richman and Moorman2000) is also increasingly leveraged to clarify the underlying organizational structure of cardiac time series. Drawing from early work by Shannon (Reference Shannon1948) and Kolmogorov (Reference Kolmogorov1958), contemporary conceptions of entropy refer to the loss of information from a system, or movement from states of systemic stability to states of temporal chaos (Pincus, Reference Pincus1991: Richman & Moorman, Reference Richman and Moorman2000; Yentes et al., Reference Yentes, Hunt, Schmid, Kaipust, McGrath and Stergiou2013). Unlike the commonly negative connotation of the term chaos, here, moderately chaotic temporal variation around a steady state is thought to reflect the dynamic flexibility of the system to change (Yentes et al., Reference Yentes, Hunt, Schmid, Kaipust, McGrath and Stergiou2013, p. 350). Like fractality, adaptive system organization is theorized to be neither too stable nor too chaotic (Lipsitz, Reference Lipsitz2002).
Several algorithms have been introduced to capture time series entropy (e.g., Shannon's entropy [Reference Shannon1948]; and approximate entropy [Pincus, Reference Pincus1991]; however, contemporary work tends to adopt a variant called sample entropy (SampEn; Richman & Moorman, Reference Richman and Moorman2000), given its appropriateness for short time series common to biological studies (Lake, Richman, Griffin, & Moorman, Reference Lake, Richman, Griffin and Moorman2002; Richman & Moorman, Reference Richman and Moorman2000; Yentes et al., Reference Yentes, Hunt, Schmid, Kaipust, McGrath and Stergiou2013). Mathematically, sample entropy represents the negative natural logarithm for the conditional probability that an epoch of data points m distance apart will remain similar (within an arbitrary tolerance r) at the next point, m +1. Formally,
Sample entropy is estimated by, first, defining m and r. For instance, consider a cardiac interbeat-interval (IBI) time series, where m = 2 and r = .10. Here, m = 2 would represent two adjacent IBIs in the series, and r = .10 would represent a tolerance band of .10 × SD total series, where the two adjacent IBI points within this band would be considered close enough to be considered the same value. B i from Equation 1 is defined by the total number of matches, m = 2, across the time series (excluding self-match). A i from Equation 1 is defined by the total number of matches, m + 1 (given tolerance r), within the subset B i. Values approximating 0 would represent a perfectly repeating series, whereas values approximating infinity would, in principle, represent a completely random series. As detailed by Richman, Lake, and Moorman (Reference Richman, Lake and Moorman2004), there are trade-offs with respect to precision and variance, in selecting appropriate values of m and r. With short cardiac time series (n < 1,000), r ~ .10 and m ~ 2 are commonly thought to reflect an optimal balance; however, sensitivity analyses are typically warranted.
Although empirical findings are only just beginning to accumulate, measures of HRV entropy are increasingly used in the medical literature (see Sassi et al., Reference Sassi, Cerutti, Lombardi, Malik, Huikuri, Peng and Lip2015). For example, declines in fetal HRV entropy predict restricted intrauterine fetal growth and distress (Ferrario, Signorini, & Magenes, Reference Ferrario, Signorini and Magenes2009). In neonates, decreases in entropic HRV tend to reliably precede the onset of sepsis-like illness (Griffin, Lake, & Moorman, Reference Griffin, Lake and Moorman2005; Lake et al., Reference Lake, Richman, Griffin and Moorman2002), and loss of HRV entropy has been implicated as a risk factor for subsequent atrial fibrillation (Tuzcu, Nas, Börklü, & Ugur, Reference Tuzcu, Nas, Börklü and Ugur2006) and congestive heart failure in adults (Graff, Graff, & Kaczkowska, Reference Graff, Graff and Kaczkowska2012; Poon & Merrill, Reference Poon and Merrill1997).
To date, there is a paucity of work considering HRV entropy in the context of emotion dysregulation or psychopathology, particularly with children. However, the burgeoning literature hints at its potential utility. Research with adults, for instance, suggests that HRV entropy measures can reliably differentiate patients with schizophrenia, bipolar disorder, and depression from matched controls (e.g., Bär et al., Reference Bär, Boettger, Koschke, Schulz, Chokka, Yeragani and Voss2007; Chang et al., Reference Chang, Yoo, Yi, Hong, Oh, Hwang and Kim2009; de la Torre-Luque et al., Reference de la Torre-Luque, Bornas, Balle and Fiol-Veny2016; Nardelli, Lanata, Bertschy, Scilingo, & Valenza, Reference Nardelli, Lanata, Bertschy, Scilingo and Valenza2017; Valenza et al., Reference Valenza, Nardelli, Lanata, Gentili, Bertschy and Scilingo2015).
The limited available studies of children suggest similar differences. In middle childhood, children rated by their parents as displaying heightened levels of temperamental negative affect and/or internalizing problems have been shown to demonstrate lower levels of resting cardiac entropy, relative to their lower internalizing peers (Fiskum et al., Reference Fiskum, Andersen, Bornas, Aslaksen, Flaten and Jacobsen2018). Comparable associations have been noted with adolescents in more ecologically valid settings. For example, using an extreme-groups design, Bornas, Balle, de la Torre-Luque, Fiol-Veny, and Llabrés (Reference Bornas, Balle, de la Torre-Luque, Fiol-Veny and Llabrés2015) found that high-anxious adolescents showed considerably lower cardiac entropy, as they went about their typical school day, than did those reporting low levels of anxiety.
To date, there is virtually no research on the association of cardiac entropy with self-regulation or mental health problems in young children. However, collectively, the extant literature suggests that both cardiac fractality and sample entropy may serve as novel tools to capture the physiological instantiation of emotion regulation in childhood.
Homelessness as a marker of high contextual risk
Although stable attributes of temperament, such as negative emotionality/withdrawal, positive affect/approach, and more effortful regulatory capacities, play an important role in clarifying individual differences in children's emotion regulation capacities (Beauchaine, Reference Beauchaine2001; Nigg, Reference Nigg2017; Rothbart & Sheese, Reference Rothbart, Sheese and Gross2007; Stifter, Dollar, & Cipriano, Reference Stifter, Dollar and Cipriano2011), considerable evidence indicates that the organization of these emerging physiological systems is also canalized by children's early experience (Blair & Raver, Reference Blair and Raver2012; Karssen et al., Reference Karssen, Her, Li, Patel, Meng, Bunney and Schatzberg2007; Liston et al., Reference Liston, Miller, Goldwater, Radley, Rocher, Hof and McEwen2006; Patel, Katz, Karssen, & Lyons, Reference Patel, Katz, Karssen and Lyons2008). In particular, unsupportive, unpredictable, and/or overwhelming social and physical contexts are implicated in organizing these systems toward more reactive and reflexive response patterns (Berry, et al., Reference Berry, Blair, Willoughby, Granger and Mills-Koonce2017; DelGuidice, Ellis, & Shirtcliff, Reference Del Giudice, Ellis and Shirtcliff2011; Holmes & Wellman, Reference Holmes and Wellman2009) and, thus, heightened risk for emotion dysregulation.
Family homelessness is, perhaps, one of the most extreme examples of such contextual risks in the United States. Homelessness and high levels of family mobility serve as acute stressors that undermine the continuity and predictability of children's physical and social environments. Beyond these acute effects, homelessness also typically occurs in the context of other chronic and persistent risk factors (e.g., extreme poverty, food insecurity, low educational obtainment, minority status, etc.; Cutuli & Herbers, Reference Cutuli and Herbers2014). Thus, collectively, it is not surprising that childhood homelessness has been linked to a litany of negative child outcomes, ranging from emotion dysregulation and psychopathology to academic problems and ill health (e.g., Bassuk, Richard, & Tsertsvadze, Reference Bassuk, Richard and Tsertsvadze2015; Labella, Narayan, & Masten Reference Labella, Narayan and Masten2016; Masten, Fiat, Labella, & Strack, Reference Masten, Fiat, Labella and Strack2015; Obradović, Bush, Stamperdahl, Adler, & Boyce, Reference Obradović, Bush, Stamperdahl, Adler and Boyce2010).
The Current Study
The current study had two primary aims. The first aim was to integrate indices of HRV complexity with more typical RSA-based metrics of parasympathetic functioning, as a means of better characterizing differences in physiological response patterns across different behavioral manifestations of emotion regulation. Specifically, we hypothesized that, on average, our challenge task would elicit decreases in children's mean RSA levels (i.e., RSA suppression), relative to baseline, along with increases in second-to-second variation in RSA (i.e., more temporal RSA variability around his/her own RSA mean). With respect to HRV complexity, we hypothesized that the challenge would evoke increases in overall HRV complexity, as indicated by increases in the temporal organization of the cardiac time-series (i.e., higher α, lower sample entropy).
In addition, we hypothesized that these response patterns would vary across children evincing different affective and regulatory responses to the challenge. Informed by prior work, we expected that children showing more effective regulatory strategies would show greater RSA suppression, compared with their more dysregulated peers. We also expected well-regulated children to show more within-person stability in their second-to-second RSA levels during the task. Drawing from our previous work suggesting that HRV complexity increases in the context of active regulatory engagement (e.g., executive functioning; Berry & Stallworthy, Reference Berry and Stallworthy2018), we hypothesized that HRV complexity would be greater for children displaying the most actively effortful regulation patterns (i.e., moderate negative affect + high regulatory behavior). Specifically, we expected a nonlinear pattern, in which actively regulating children would show greater complexity than either their dysregulated (i.e., high negative affect + low regulatory behavior) or their regulated peers, who seemingly had less negative to actively regulate (i.e., low negative affect + high regulatory behavior).
Our second aim was to test the extent to which the behavioral profiles and/or HRV responses differed across children from low- versus high-risk contexts. We hypothesized that, on average, children currently experiencing homelessness would be more likely to show behavioral dysregulation and lower levels of HRV complexity.
Method
Participants
The study recruited 4- to 6-year-old children and their primary caregivers from two different populations (N = 115). The first sample included low- to middle-income children from a community participant pool (N = 57). The second was recruited from an urban emergency family homeless shelter in a large Midwestern city (N = 58). In an attempt to make the two groups as comparable as possible, only families within 200% of the federal poverty line were recruited from the participant pool. However, given that the available income data was collected shortly after the child's birth (when parents joined the participant pool), many of the community families were above this threshold at the time of data collection.
To be eligible for participation in the study, children in both samples had to speak and hear primarily English, have no physical disabilities affecting vision or hearing, and have no known developmental delays or disorders. For participants residing in the emergency homeless shelter, families had to reside in the shelter for a minimum of 3 days, to acclimate to their new living environments. A total of 59 families from the shelter consented to participate (though 1 ultimately failed to do so). The remaining eligible families (approximately 50) did not participate because they either left the shelter, never learned of the study, or were too busy or uninterested. With respect to the broader community participant pool, 84 of the eligible families agreed to participate and 57 actually participated due to visit cancelations. In both samples, the primary caregivers were female and most were biological mothers. Demographic information for the full sample and by subsample can be found in Table 1. As expected, the two samples differed markedly in sociodemographic variables, including ethnicity, education level, and income.
Table 1. Descriptive statistics of sample demographics

Missing data
Out of the 115 participants, 20 were missing observational data. In 19 of these cases, missing data were due to technical difficulties (e.g., audio/video problems). In addition, 1 child refused to participate in the task. To address this missingness, we used a robust full information maximum likelihood estimator in all models (along with several auxiliary variables; see Graham, Reference Graham2003). In so doing, we invoked the missing at random assumption that missingness was conditionally random, given the other variables included in the observed covariance matrix.
Procedure
The University of Minnesota Institutional Review Board approved all study procedures, and parents provided informed consent for themselves and their children. For families experiencing homelessness, study sessions took place in a private research room located inside an emergency shelter. For community participant pool families, sessions took place in a university lab setting. Assessors were trained female graduate and undergraduate students. All children participated in a 60-min self-regulation assessment, while parents were interviewed in a different room.
Throughout the session, children wore a small, noninvasive ambulatory heart rate monitor (FirstBeat: BodyGuard2) on their torsos, in a modified Lead II electrode configuration (i.e., no ground). To capture “resting” heart rate, children first spent 5 min sitting quietly, watching a video narration of the story book Snowy Day by Ezra Jack Keats. We attempted to equate posture, movement, and vocalizations as much as possible between the baseline and the self-regulation task. Respiration was not directly measured (see Limitations section).
Children then participated in a “Barrier Box” challenge task designed to tax children's regulatory capacities (Goldsmith, Reilly, Lemery, Longley, & Prescott, Reference Goldsmith, Reilly, Lemery, Longley and Prescott1999). Specifically, children picked one of two attractive toys, prior to beginning the task. The toy was then locked in a transparent box and put into a cabinet, while the child participated in another set of tasks. At the end of the session, the locked transparent box was returned to the child, along with a large ring of keys. Children were then told that they could claim their preferred prize from the box, upon finding the correct key. Unbeknownst to the child, none of the keys fit the lock. They were given 5 min to open the box and were told that they could quit the task at any time. The experimenter pretended to be busy with paperwork and provided no help to the children, even if explicitly requested by the child. After 5 min (or whenever the child resigned from the task), the experimenter realized that she had given the child the wrong set of keys and provided the child with the correct key. All children received their desired prize.
Measures
Negative emotion and emotion regulation
Observed negative affect and behavioral regulation were coded from videos recorded during the Barrier Box challenge task, using a coding scheme developed by Perry and colleagues (Perry, Calkins, Dollar, Keane, & Shanahan, Reference Perry, Calkins, Dollar, Keane and Shanahan2018; Perry, Calkins, Nelson, Leerkes, & Marcovitch, Reference Perry, Calkins, Nelson, Leerkes and Marcovitch2012; Williford, Calkins, & Keane, Reference Williford, Calkins and Keane2007). Children's levels of negative affect were based on observer ratings of their verbal and physical expressions of negative emotion across the entirety of the task (e.g., complaints, frustrated huffing, name calling, and shaking/hitting box). Verbal and physical expressions were each coded on a 0 to 4 scale (0 = absence, 4 = four or more occurrences), summed, and ultimately square root transformed, to adjust the positive skew. Two additional indicators were included to capture behaviors likely reflecting negative affect. Child resignation was coded 0 (none) to 4 (> 2 min), based on how much time she or he spent “waiting out the clock” (e.g., unfocused looking at the box, without trying to solve it; head in hands, ignoring box; or “I give up” statements). Given the largely binary nature of the observed distribution, we subsequently dichotomized all nonzero values as 1. In addition, off-task behavior was coded (0–4), based on the total number of 15-s intervals in which the child seemed to be actively avoiding the task.
Three regulation codes were also included. The first two were based on specific regulatory behaviors: help seeking and self-distraction. Help-seeking behaviors included asking the experimenter for assistance during the task. Distraction behaviors included activities unrelated to the task, such as focusing on other objects in the room, participating in soothing behaviors like humming, or attempting to engage the experimenter in conversation. These regulatory activities were originally rated on a 0 to 4 scale (0 = absence, 4 = four or more instances). However, given the largely binary nature of the observed distributions, we ultimately collapsed them into a dichotomous indicator (1 = presence of behavior). Global regulation scores were based on observations of children's overall abilities to minimize the distress imposed by the challenge task, based on a 0 to 4 scale. Children who consistently demonstrated the ability to stay engaged with the challenge, while using behavioral strategies seemingly intended to modulate their emotions (e.g., self-talk/planning, self-distraction, joking/silliness, or pretense) were scored as 4. In contrast, children who used no consistent strategies and illustrated distress or resignation were scored as 0. The global code was intended to catch the overall impression of regulatory behaviors, beyond what is specific to help seeking and self-distraction.
Coders were blind to the research questions and contextual risk. Coders established reliability on a set of practice videos from previous studies with the same task and reached intraclass correlations above .80 on all coded domains. Approximately 30% of the videos were double coded across both samples, and coders met weekly to prevent coder drift. Interclass correlation coefficients varied from good to excellent across both samples (community sample: global regulation = .79, negative reactivity = .96, off-task = .69; shelter sample: global regulation = .70, negative reactivity = .83, off-task = .82).
Emotion (dys-)regulation
Informed by prior work suggesting that emotion regulation may be best captured by integrating blends of emotion-related and regulation-related behaviors (e.g., Ramsook, Cole, & Fields-Olivieri, Reference Ramsook, Cole, Fields-Olivieri, Beauchaine and Crowell2018), we hypothesized three qualitatively distinct behavioral profiles: a normative “actively regulating” group reflecting moderate levels of negative affect and off-task behavior, coupled with moderate to high levels of regulation; a “regulated” group, reflecting low levels of negative affect, low levels of off-task behavior, and moderate to high levels of regulation; and a much smaller “dysregulated” group, reflecting children with the highest levels of negative affect and off-task behavior, and the lowest levels of regulation. We also allowed for a potential fourth “disengaged” profile, marked by low levels of both negative affect and regulation; however, given our sample size and the nature of the task, we considered this to be largely a post hoc sensitivity check. To test the plausibility of these groupings, we fitted a taxonomy of finite mixture models using a robust maximum likelihood estimator (Mplus, 8.1; Muthén & Muthén, Reference Muthén and Muthén1998–2019), working systematically across one- to four-class specifications. As discussed below, we included all of the variables that would ultimately contribute to our substantive analyses as auxiliary variables in these measurement models (i.e., three-step strategy; see Analytic Plan). We based our preferred model on the collective evaluation of a number of relative fit indices, class discriminability, class size, and theory (Collins & Lanza, Reference Collins and Lanza2010; Masyn, Reference Masyn and Nathan2013). As a sensitivity check, we also considered descriptive (i.e., low statistical power) differences in the class structure as a function of shelter status, using a variant of multiple-groups analysis appropriate for mixed models (Collins & Lanza, Reference Collins and Lanza2010).
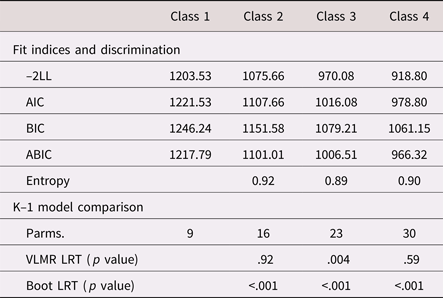
As shown in Tables 2 and 3, there was general support for the three-class structure, both statistically and substantively. Across fit indices, the three-class model led to considerable improvements in model fit. In addition, it was the only specification to yield statistically significant improvements beyond the k – 1 class, for both an adjusted Vuong–Lo–Mendell–Rubin likelihood ratio test and a bootstrapped likelihood ratio test (10,000 iterations).
Table 2. Fit statistics and model comparisons from a taxonomy of finite mixture models (N = 115)
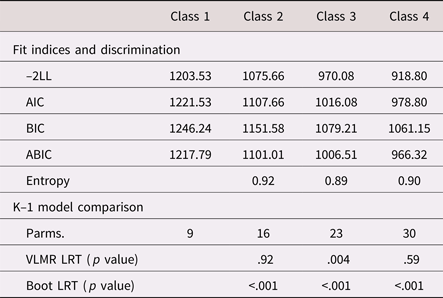
Note: –2LL = –2*log likelihood. AIC, Akaike information criterion. BIC, Bayesian information criterion. ABIC, adjusted Bayesian information criterion. Parms., free parameters. VLMR LRT, Vuong–Lo–Mendel–Rubin likelihood ratio Test. Boot LRT, bootstrapped likelihood ratio test.
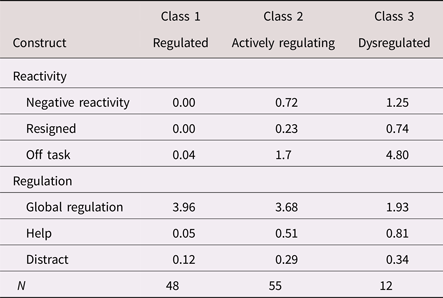
Table 3. Estimated means/probabilities of emotional reactivity and regulation by latent class (N = 115)
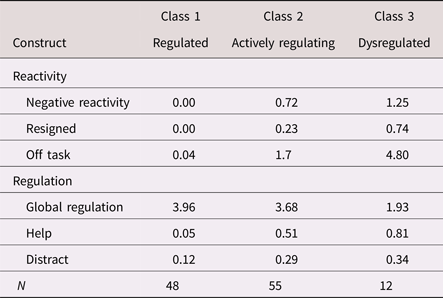
Note: Negative reactivity, negative verbal and/or physical emotional reaction. Resigned, resigned behavior. Off task, off-task behavior. Help, help-seeking behavior. Distract, self-distraction behavior.
The three-class solution was also consistent with our hypothesized model, with respect to both meaning and class size. Specifically, the largest actively regulating profile (48%) comprised children illustrating modest levels of negative reactivity and off-task behavior, yet low probabilities of resignation, high levels of global regulation, and moderate probabilities of help seeking and self-distraction. The second largest regulated profile (42%) comprised children who showed no negativity, nor any resignation or off-task behavior, coupled with high levels of global regulation and minimal help seeking or self-distraction. The smallest dysregulated profile (11%) comprised children who illustrated the highest levels of negative emotion, the most off-task behavior, and the greatest probability of resigning behavior. Although these children showed high probabilities of help seeking and self-distraction, they did so in the context of low levels of overall global regulation. As such, these specific strategies seemed to reflect disorganized and ineffective attempts at regulation. Overall, these latent profiles were highly discriminable; class probabilities for the most likely class ranged from .90 to 1.00 (entropy = .89). We, thus, adopted these three classes as our emotion-regulation typologies.
IBI data
IBI data were sampled at 1000 Hz using FirstBeat BodyGuard2 ambulatory heart rate monitors, with a modified Lead II electrode configuration. In prior work (Palmer, Berry, & Leneman, Reference Palmer, Berry and Leneman2018), we have shown that the reliability between the BodyGuard 2 and a gold standard Biopac MP150 ECG approached unity. All raw IBI data were edited by hand using Cardio Edit software (Brain Body Center; University of Illinois at Chicago) by research assistants reliable to Porges' gold standard. Fifteen percent of the IBI files were double-edited to check for drift.
Linear HRV
RSA
Second-to-second RSA values were estimated using a moving-window technique created by Gates, Gatzke-Kopp, Sandsten, and Blandon (Reference Gates, Gatzke-Kopp, Sandsten and Blandon2015). This method utilizes a peak-matched multiple window technique across a 32-s window epoch, with a frequency band of 0.40 to 1.04 Hz (per normative child respiration). Succinctly, the algorithm calculates RSA by moving across successive overlapping windows of IBI epochs. For example, the first epoch would consist of the first 32 s of IBI data, and the second epoch would consist of IBI data from 2 to 33 s, and the third between 3 and 34 s, and so on. This moving window is repeated until the end of the segment, to provide second-by-second estimates of RSA across the series. RSA represents the natural log of the power spectral density estimate for each epoch.
We aggregated the RSA time series data in two ways, separately for each of the respective baseline and challenge tasks. To account for overall level, we first calculated children's individual RSA means. To capture second-to-second within-person variability in RSA, we calculated the within-person standard deviation in RSA for the given task (i.e., baseline and challenge).
Nonlinear HRV
Fractal analyses
Fractal complexity was estimated by applying detrended fluctuation analysis (DFA; Peng, Havelin, Stanley, & Goldberger, Reference Peng, Havlin, Stanley and Goldberger1995) and multifractal DFA (Kantelhardt et al., Reference Kantelhardt, Zschiegner, Koscielny-Bunde, Havlin, Bunde and Stanley2002) to each of the individual edited IBI series. Mathematically, fractal structures reflect an inversely proportional relationship between the power (i.e., size of change) and the frequency (i.e., how frequently changes of that size occur) of variation within a time series (Coey, Wallot, Richardson, & Van Orden, Reference Coey, Wallot, Richardson and Van Orden2012). For fractal structures, this relationship is stable across multiple measurement scales, meaning that small variations have the same structure as larger variations within a given time series. In the frequency domain, the degree to which the data approximate this linear relationship between power (P) and frequency (f), P = 1/f α, or fractal structure, can be summarized by the scaling exponent, α. Values of α fall on a continuum from 0 to 2, reflecting the relationship between the size and frequency of fluctuations within a time-series (see Figures 1a and 1b). More random fluctuation is reflected in a white noise series, which correspond to α values near 0.5 (Coey et al., Reference Coey, Wallot, Richardson and Van Orden2012). Fractal organization is indicative of self-similarity and scale-invariant patterns displayed in pink noise, summarized by α values approximating 1. Finally, random-walk structures, or brown noise series, represent more tightly organized or “rigid” temporal structures and are reflected in α values approaching 2 in the frequency domain and 1.5 in the context of our DFA approach (i.e., the two are aligned via an integral transform; Heneghan & McDarby, Reference Heneghan and McDarby2000).
DFA is increasingly included as a standard routine in HRV software (e.g., Kubios HRV, Tarvainen, Niskanen, Lipponen, Ranta-Aho, & Karjalainen, Reference Tarvainen, Niskanen, Lipponen, Ranta-Aho and Karjalainen2014; HRHV, Rodríguez-Liñares et al., Reference Rodríguez-Liñares, Méndez, Lado, Olivieri, Vila and Gómez-Conde2011). We used the open-source program Heart Rate Variability Analysis With R (Ramshur, Reference Ramshur2010), as it has batch processing capabilities that are often either nonstandard or require additional programming in other software. Monofractal DFA was estimated based on the following steps. The time series was converted to a random-walk-like structure by subtracting the mean value and integrating. The time series was then divided into equal, non-overlapping, user-specified windows sizes (see below), and detrended by fitting a quadratic model to each window of data. The local root mean square (RMS) was then computed for residual variation that remains for that window.
Given that fast- and slow-changing fluctuations in a time series influence the RMS differentially depending on the window size (i.e., fast-changing fluctuations influence small window sizes and slow-changing fluctuations influence larger windows), the RMS is then calculated for an array of different window sizes. The range of window sizes is intended to capture the range of temporal resolution that is meaningful for the system (Ihlen, Reference Ihlen2012). For instance, with a common HRV times series length of ~ 1000 points, a typical range of window sizes might be as small as 4 adjacent heartbeats and as large as a quarter of the size of the entire series (i.e., 250).
The monofractal scaling exponent, α, is estimated as the proportional or “power law” relation between RMS power and frequency. Specifically, given that proportional relations are a natural property of linear relations between two log-scaled variables, α is estimated as the regression slope between log RMS and log window size.
In the present study, we used a slight variation of this approach to capture both the shorter run (α1) and the longer run (α2) memories of the IBI series, where α1 captures a smaller window of adjacent heartbeats (4 to 13) and α2 captures a larger window of adjacent heartbeats (14 to n/4; see Peng et al., Reference Peng, Havlin, Stanley and Goldberger1995).
Alpha spectrum width (W)
The complexity of some time series is not fully captured by one or two summary-level α values, when it contains local fluctuations with both extremely small and large magnitudes. To capture this “multifractal (MF)” complexity, MF-DFA (Kantelhardt et al., Reference Kantelhardt, Zschiegner, Koscielny-Bunde, Havlin, Bunde and Stanley2002) computes the local RMS repeatedly, varying the weights of segments with large and small fluctuations (q-order weights). Negative qs heavily weight segments with small RMS while positive qs weight segments with large RMS values. Q-order α values are derived as the slopes of the regression lines for each q-order RMS. The multifractal spectrum width (W) denotes the deviation n from the average fractal structure, α, for segments with large and small fluctuations within a time series. Here, larger spectrum widths are often thought to reflect greater complexity; however, like DFA, it is likely that the relation is nonlinear (i.e., extreme widths correspond to less system organization). MF-DFA is not commonly available in HRV software, though Ihlen (Reference Ihlen2012) provides comprehensively annotated MATLAB code.
SampEn
As introduced above, SampEn is thought to represent the loss of information from a temporal system, where very low values index constrained or rigid system organization and very large values index unpredictable and highly chaotic systems. SampEn can technically range from 0 to infinity, and unlike DFA, there are no rough bounds to tie its values to overall organizational structure of the time series (i.e., continuum of noises). However, given that the SampEn scale is substantively the inverse of the fractal complexity scale, one would typically expect the two to be negatively associated.
We calculated SampEn by applying Richman and Moorman's (Reference Richman and Moorman2000) algorithm to the IBI series using the Heart Rate Variability Analysis With R program (Ramshur, Reference Ramshur2010). Per Richman and Moorman's (Reference Richman and Moorman2000) recommendation, we used raw rather than detrended data. As described above, this algorithm requires the user to define a tolerance band, r, to designate the required degree of similarity between two data points and, m, the number of contiguous data points analyzed for similarity. Informed by prior work using IBI series of similar lengths (e.g., Yentes et al., Reference Yentes, Hunt, Schmid, Kaipust, McGrath and Stergiou2013), we specified r to represent 10% of the standard deviation of given time series and m to represent two contiguous data points. Of note, as sensitivity checks, we conducted the same analyses using alternative specifications (combinations of non-/detrended IBI; r = .5 and .15; m = 2 and 3). As the findings were functionally identical, we do not discuss them further.
Control covariates
To adjust for potential confounding between self-regulation group and HRV, we adjusted for a number of control covariates, including child age (mean-centered), child sex (male = 1), sample (shelter vs. community sample; shelter = 1), length of the IBI time series (mean-centered), and mean-centered baseline values of the given HRV outcome (i.e., autoregressive effect). It should be noted that, despite our aim of minimizing differences between the shelter and community samples, demographic factors such as income, education, and race were too collinear with shelter status to include in our models. As such, we are unable to disentangle the unique relations of these sociodemographic variables from those due to sample.
Data analytic plan
Our analytic plan comprised multiple steps. First, to test the extent to which the Barrier Box task was predictive of within-person decreases in RSA and increases in HRV complexity, on average, we fitted a series of latent difference score models (McArdle & Hamagami, Reference McArdle, Hamagami, Marcoulides and Schumacker2001).
Second, to test whether children evincing regulatory control at the behavioral level showed more responsive HRV patterns at the physiological level, we fitted a taxonomy of finite mixture models using the “three-step” approach (see Asparouhov & Múthen, Reference Asparouhov and Muthén2014; Vermunt, Reference Vermunt2010). Specifically, we regressed each HRV index on latent class membership (i.e., regulation type) and a vector of control covariates, including that same HRV index measured during the baseline condition (i.e., autoregression), using a robust maximum likelihood estimator (Mplus 8.1; Muthén & Muthén, Reference Muthén and Muthén1998–2019). The three-step approach helps to assure that the class structure is similar across the respective measurement and regression steps of the modeling process (Step 1), and that the regression step adjusts for the estimated nature of class assignment (i.e., proper standard errors; Steps 2 and 3).
Because this approach estimates the conditional means of the given outcome as a function of latent class and the control covariates, rather than estimating differences between these conditional means directly, as in typical regression, we recovered these differences using model constraints. These are represented as dummy variables in Table 6, where the excluded comparison is based on relevance for the given outcome. All 95% confidence intervals (CIs) were estimated using a nonparametric bootstrap (10,000 iterations).
Results
Preliminary analyses
As displayed in Table 4, the results
from the latent change models indicated that the challenge task was predictive
of within-person changes from baseline, for the majority of the HRV indices.
Children showed noteworthy declines in their mean RSA levels (Δ![]() $\overline {RSA} _{i\;} $= –1.01, p
< .001; d = –0.89).
They also showed increases in RSA variability
(ΔRSASD = 0.09,
p < .001,
d = 0.41), short-run
(Δα1 = .18, p
< .001, d = 0.91) and
long-run fractal complexity
(Δα2 = .07, p
< .001, d = 0.41), and
decreases in sample entropy
(ΔSampEn = –.08,
p = .08,
d = –0.19). For each of the
complexity indices, these changes suggest a tightening of the temporal
organization of the cardiac time series. Although there was evidence of
substantial between-person variability, there was no statistically significant
change in α spectral width, on average.
$\overline {RSA} _{i\;} $= –1.01, p
< .001; d = –0.89).
They also showed increases in RSA variability
(ΔRSASD = 0.09,
p < .001,
d = 0.41), short-run
(Δα1 = .18, p
< .001, d = 0.91) and
long-run fractal complexity
(Δα2 = .07, p
< .001, d = 0.41), and
decreases in sample entropy
(ΔSampEn = –.08,
p = .08,
d = –0.19). For each of the
complexity indices, these changes suggest a tightening of the temporal
organization of the cardiac time series. Although there was evidence of
substantial between-person variability, there was no statistically significant
change in α spectral width, on average.
Table 4. Unconditional within-person differences in linear and nonlinear HRV indices from baseline to challenge task (N = 115)

Note: BL, baseline. ![]() $\Delta $, change from BL to
challenge task.
$\Delta $, change from BL to
challenge task. ![]() $\overline {RSA} $, task-mean RSA.
RSAsd, task-standard deviation RSA.
α1, alpha 1 short-run fractality.
α2, alpha 2 long-run fractality.
αW, multifractal spectral width.
SampEn, sample entropy. ~p
< .10. *p
< .001.
$\overline {RSA} $, task-mean RSA.
RSAsd, task-standard deviation RSA.
α1, alpha 1 short-run fractality.
α2, alpha 2 long-run fractality.
αW, multifractal spectral width.
SampEn, sample entropy. ~p
< .10. *p
< .001.
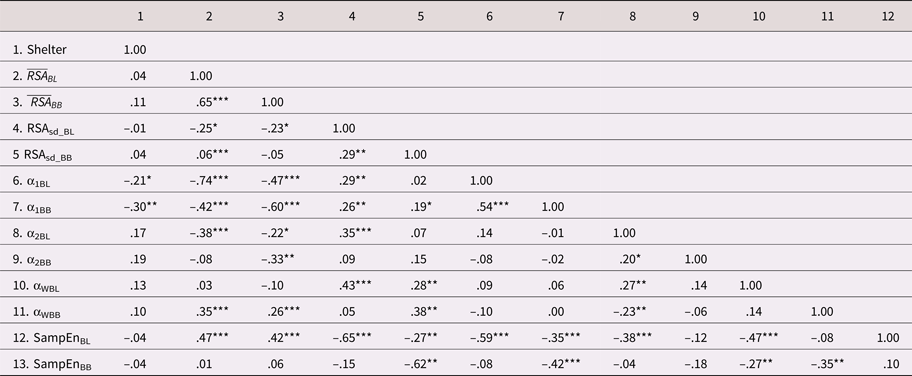
Table 5 displays the intercorrelations
between the HRV indices. There was moderate to strong rank-order stability
across the baseline and challenge tasks for some of the HRV indices (e.g., ![]() $\overline {RSA} _i\; $ and α1). However, others
showed only modest stability across the tasks (e.g.,
RSASD, α2, and SampEn). With
respect to the correlations across the HRV indices,
$\overline {RSA} _i\; $ and α1). However, others
showed only modest stability across the tasks (e.g.,
RSASD, α2, and SampEn). With
respect to the correlations across the HRV indices, ![]() $\overline {RSA} _i$ during baseline (i.e., resting RSA) tended
to be inversely correlated with the baseline measures of HRV complexity (lower
α1, α2, and higher SampEn). This is
consistent with the idea that higher resting RSA reflects better regulatory
control and preparedness for adaptive change (i.e., less need for complex
organization when overall vagal tone is high). Similar inverse relations were
evident between resting RSA and some of the complexity indices measured during
the challenge task. Of note, the absolute magnitudes of these relations were
considerably weaker than those collected during baseline. The indices of fractal
complexity and sample entropy were negatively correlated, as expected, given
their substantively inversed scales.
$\overline {RSA} _i$ during baseline (i.e., resting RSA) tended
to be inversely correlated with the baseline measures of HRV complexity (lower
α1, α2, and higher SampEn). This is
consistent with the idea that higher resting RSA reflects better regulatory
control and preparedness for adaptive change (i.e., less need for complex
organization when overall vagal tone is high). Similar inverse relations were
evident between resting RSA and some of the complexity indices measured during
the challenge task. Of note, the absolute magnitudes of these relations were
considerably weaker than those collected during baseline. The indices of fractal
complexity and sample entropy were negatively correlated, as expected, given
their substantively inversed scales.
Table 5. Descriptive statistics and zero-order correlations across the HRV indices collected during a baseline and challenge task (N = 115)
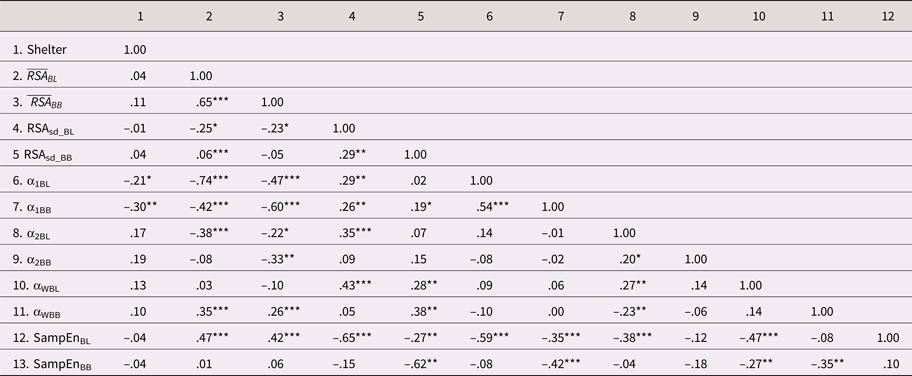
Note: Shelter:
1 = experiencing
homelessness and
0 = community
sample. BL, baseline. BB, barrier box. ![]() $\overline {RSA} $, task-mean RSA.
RSAsd, task standard deviation RSA.
α1, short-run fractality.
α2, longer-run fractality.
αW, multifractal spectral width.
SampEn, sample entropy. * p
< .05. **p
< .01.
***p
< .05.
$\overline {RSA} $, task-mean RSA.
RSAsd, task standard deviation RSA.
α1, short-run fractality.
α2, longer-run fractality.
αW, multifractal spectral width.
SampEn, sample entropy. * p
< .05. **p
< .01.
***p
< .05.
As shown in Table 5, there were few HRV differences between the community and shelter samples; however, children from the shelter sample did show modestly lower levels of short-run fractal complexity, during both the baseline (r = –.21, p < .05) and challenge tasks (r = –.30, p <.01). These relations were robust, after adjusting for the control covariates (see M5 and M6 in Table 6).
Table 6. Unstandardized fitted regression parameters from a series of finite mixture models testing regulation-group differences in linear and nonlinear HRV across baseline and challenge tasks (N = 115)

Note: italicized values
represent equality constraint. — represents
comparison group, based on the most relevant contrast. BL,
resting baseline. BB, barrier box challenge task. ![]() $\overline {RSA} $, task-mean respiratory
sinus arrhythmia. RSAsd,
within-task/within-person standard deviation in respiratory
sinus arrhythmia. α1, short-run HRV
fractality. α2, long-run HRV fractality.
αw, multifractal spectral width.
SampEn, HRV sample entropy. Intercept, conditional outcome
value for excluded group. BaselineDV, same DV,
but collected during resting baseline. Length, absolute
length of IBI series. Regulated, “regulated”
behavioral profile. Act. Reg, “actively
regulating” behavioral profile. Dysreg,
“dysregulated” behavioral profile.
~p < .10 *
p <.05.
**p < .01.
***p
< .001.
$\overline {RSA} $, task-mean respiratory
sinus arrhythmia. RSAsd,
within-task/within-person standard deviation in respiratory
sinus arrhythmia. α1, short-run HRV
fractality. α2, long-run HRV fractality.
αw, multifractal spectral width.
SampEn, HRV sample entropy. Intercept, conditional outcome
value for excluded group. BaselineDV, same DV,
but collected during resting baseline. Length, absolute
length of IBI series. Regulated, “regulated”
behavioral profile. Act. Reg, “actively
regulating” behavioral profile. Dysreg,
“dysregulated” behavioral profile.
~p < .10 *
p <.05.
**p < .01.
***p
< .001.
To test whether children from the shelter sample were at greater risk for behavioral dysregulation, we conducted a contingency table analysis across most-likely regulation class and shelter status (10,000 iteration bootstrap). Although the community and shelter children were distributed fairly evenly across the regulation profiles, there was some indication of nonindependence (φ = .19, 95% CI [.03, .43]). This was driven largely by the slightly greater representation of children experiencing homelessness being classified as dysregulated, relative to regulated.
Behavioral self-regulation and linear HRV indices
Mean RSA
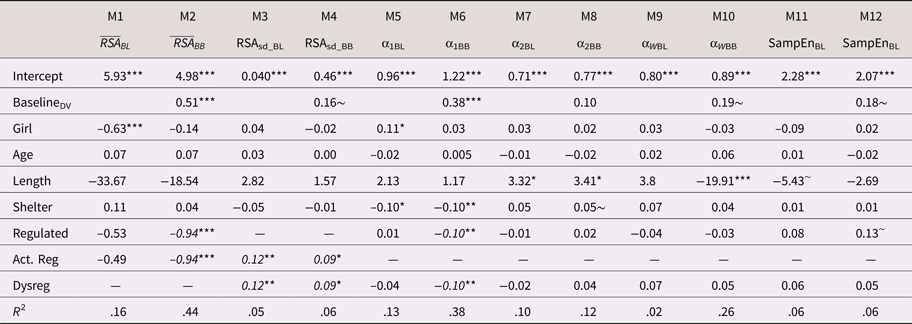
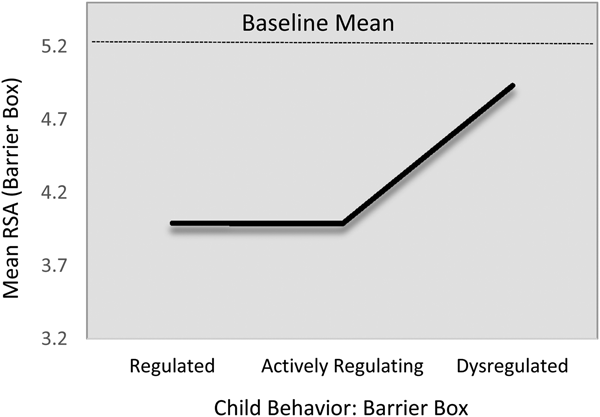
On average, children's baseline mean RSA levels did not differ statistically across the regulation groups (Table 6; M1). However, as displayed in Table 6 (M2) and Figure 2, there were statistically significant group differences in children's mean RSA levels during the challenge task (adjusting for baseline mean RSA and the other control covariates). On average, dysregulated children showed comparatively higher RSA (i.e., less withdrawal) during the challenge task, compared with either the regulated (B = 0.86, 95% CI [0.183, 1.94]) or the actively regulating children (B = 0.98, 95% CI [0.22, 2.01]). Tests of model constraints indicated that the differences between the regulated and actively regulating children were statistically indistinguishable (B 1,2 = 0.12, 95% CI [–0.20, 0.49]). We, thus, constrained these parameters to equality for parsimony (i.e., B = dysregulated > regulated or regulating = 0.94, 95% CI [0.22, 2.07]). Standardizing on the baseline RSA variance, this harmonized relation corresponded to a standardized association of approximately 0.84. As expected (i.e., sample size), the 95% CI bands indicated some imprecision in these estimates. Of the control covariates, only baseline mean RSA was predictive of mean RSA during the challenge task (B = 0.51, 95% CI [0.34, 0.66]; β = .56).
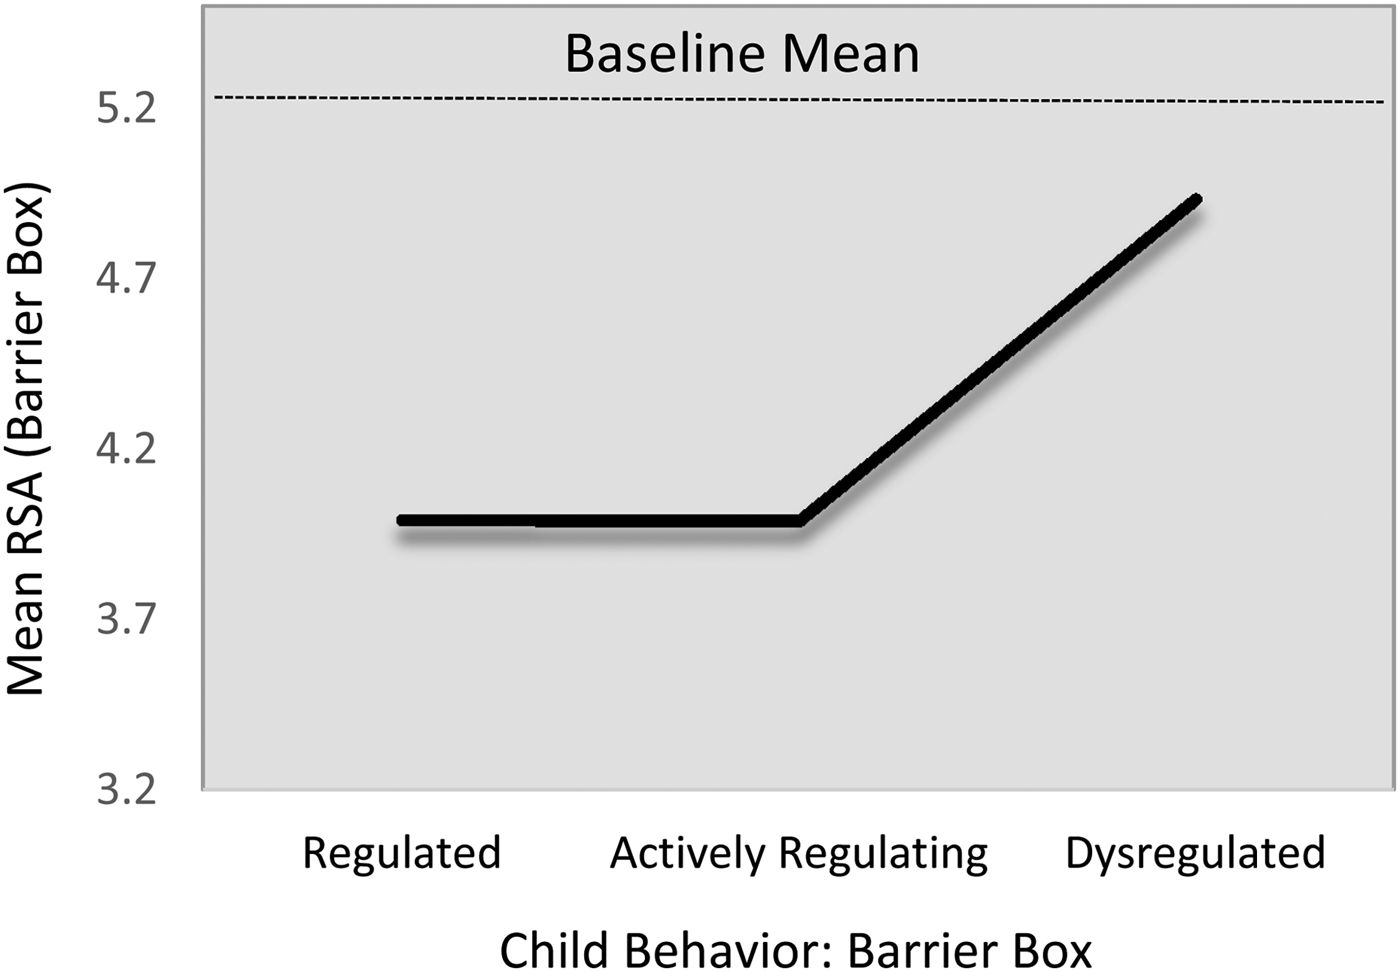
Figure 2. Fitted mean respiratory sinus arrhythmic (RSA) values during challenge task by emotion regulation profile. Note that the scale of the y-axis = 2 SD.
SD RSA
There was some evidence of baseline differences in children's levels of RSA variability. This was the only HRV index to show a baseline difference. On average, children in the regulated group showed comparatively less second-to-second variability in their RSA levels during the baseline task than did those in either the actively regulating or the dysregulated groups. As the two differences were statistically identical, we constrained them to equality, manifesting in harmonized relation of approximately B = 0.12 (p < .01; Table 6, M3).
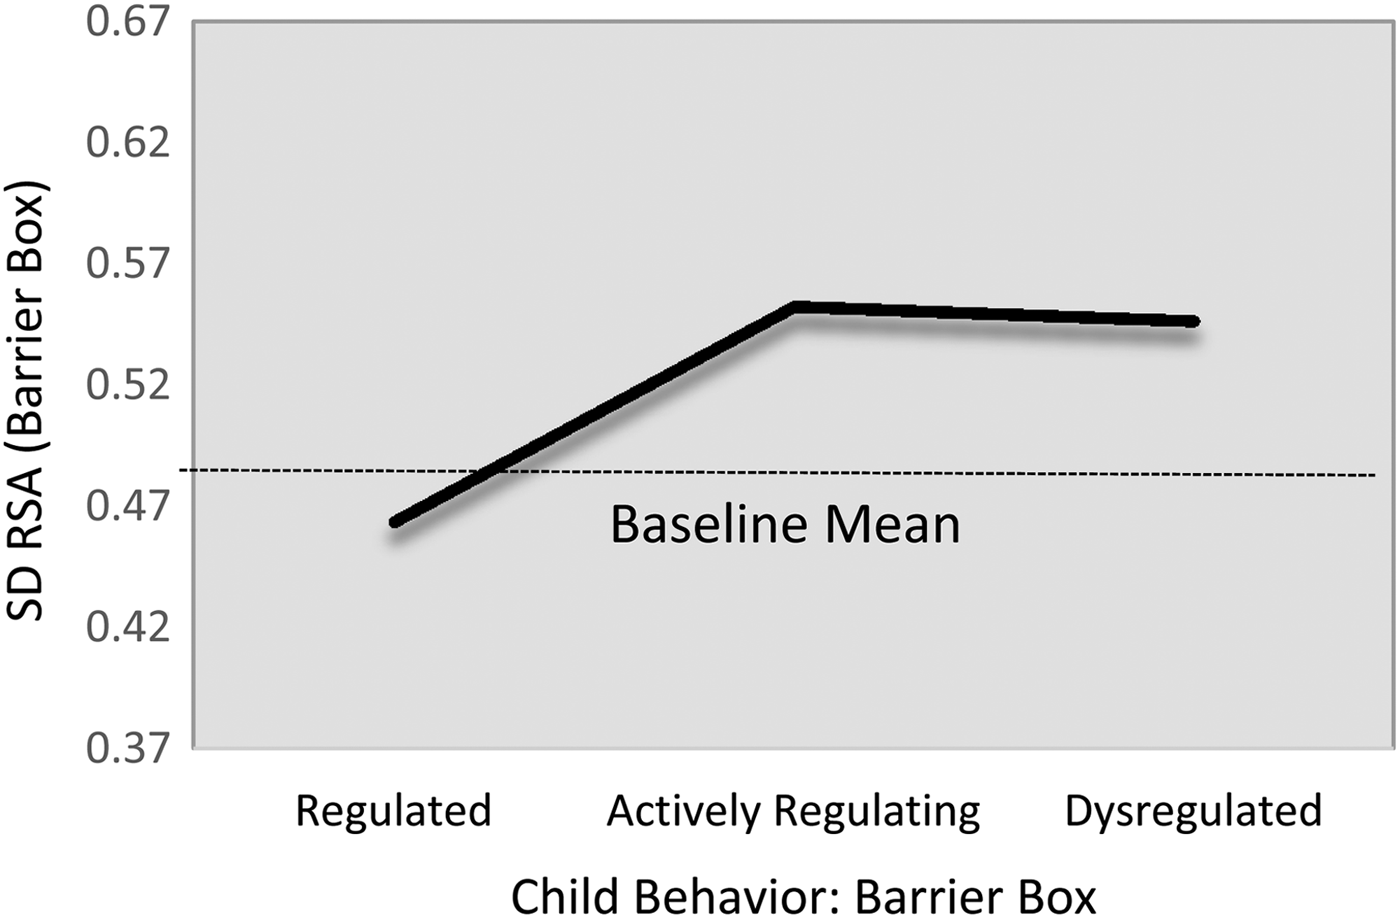
After adjusting for this baseline difference, as well as the other control covariates, a similar relation was evident for RSA variability during the challenge task (M4; Figure 3). Children in the regulated group tended to show less second-to-second RSA variability, compared with either the actively regulating group (B = –0.09, 95% CI [–.0.16, –0.02]) or the dysregulated group (B = –0.08, 95% CI [–0.19, 0.01]), though the latter was statistically marginal (p = .05). As above, because these relations were statistically identical (B 2,3 = –0.02, 95% CI [–0.11, 0.09]), we constrained them to equality, resulting in a harmonized relationship of B = –0.09, 95% CI [–0.16, –0.03]). This corresponds to a standardized effect size of approximately 0.60. None of the control covariates were predictive of RSA variability during the challenge task, save a marginal relation with baseline RSA variability.

Figure 3. Fitted respiratory sinus arrhythmia variability (task standard deviation; SD RSA) values during challenge task by emotion regulation profile. Note that the scale of the y-axis = 2 SD.
Behavioral self-regulation and nonlinear HRV indices
Alpha1.
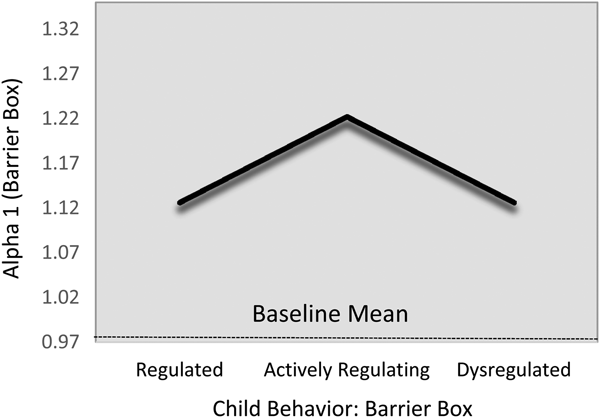
Children's α1 complexity levels were statistically indistinguishable across the regulatory profiles during the baseline task (Table 6; M5). However, during the challenge task, children in the actively regulating group showed comparatively greater α1 HRV complexity than did either the regulated (B = –0.10, 95% CI [–0.19, –0.01]) or dysregulated groupings (B = –0.08, 95% CI [–0.19, 0.01]), though the latter only reached marginal statistical significance. Again, because these relations were substantively and statistically identical (B 1,3 = 0.02, 95% CI [–0.15, 0.10]), we constrained them to equality for parsimony. This resulted in a harmonized difference of (B = –0.10, 95% CI [–0.17, –0.02]), which corresponds to a standardized effect size approximately 0.51. The fitted estimates are present in Figure 4. With respect to the covariates, children's baseline α1 levels were positively associated with their α1 levels during the challenge task (B = 0.38, 95% CI [0.29, 0.55]; β = .45). In addition, children from the shelter tended to show lower α1 levels than did their community sample counterparts (B = –0.10, 95% CI [–0.18, –0.03]; d = –0.27).
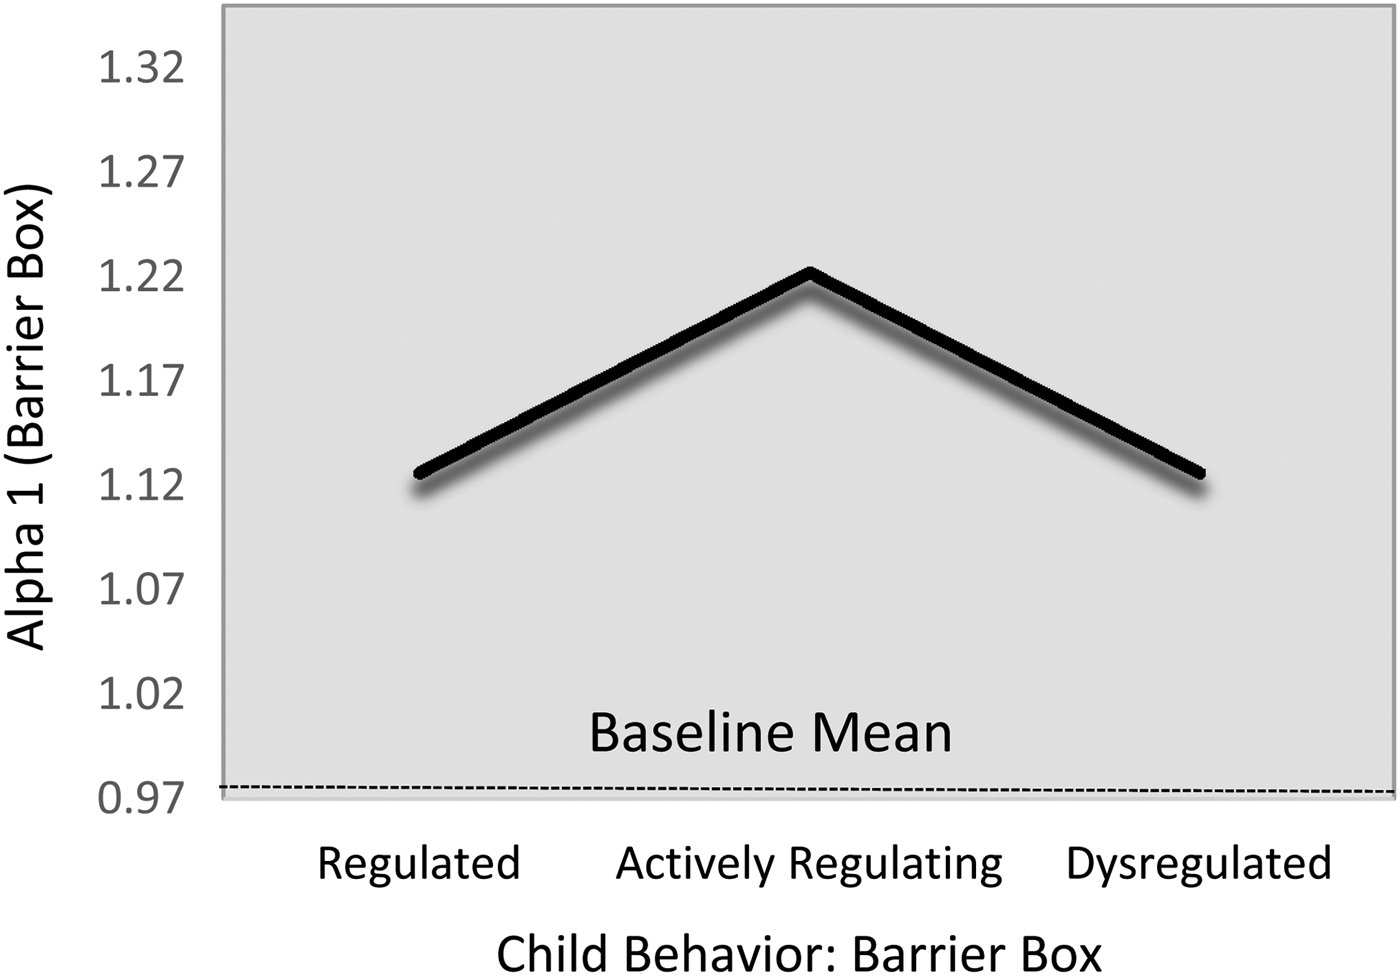
Figure 4. Fitted α1 values during challenge task by emotion regulation profile. Note that the scale of y-axis = 2 SD.
Alpha2 and multifractal spectrum width
No statistically significant differences in the long-run complexity (α2) nor the multifractal spectrum widths (αw) were evident across regulation profiles, irrespective of the inclusion of the control covariates (Table 6; M7–M10).
SampEn
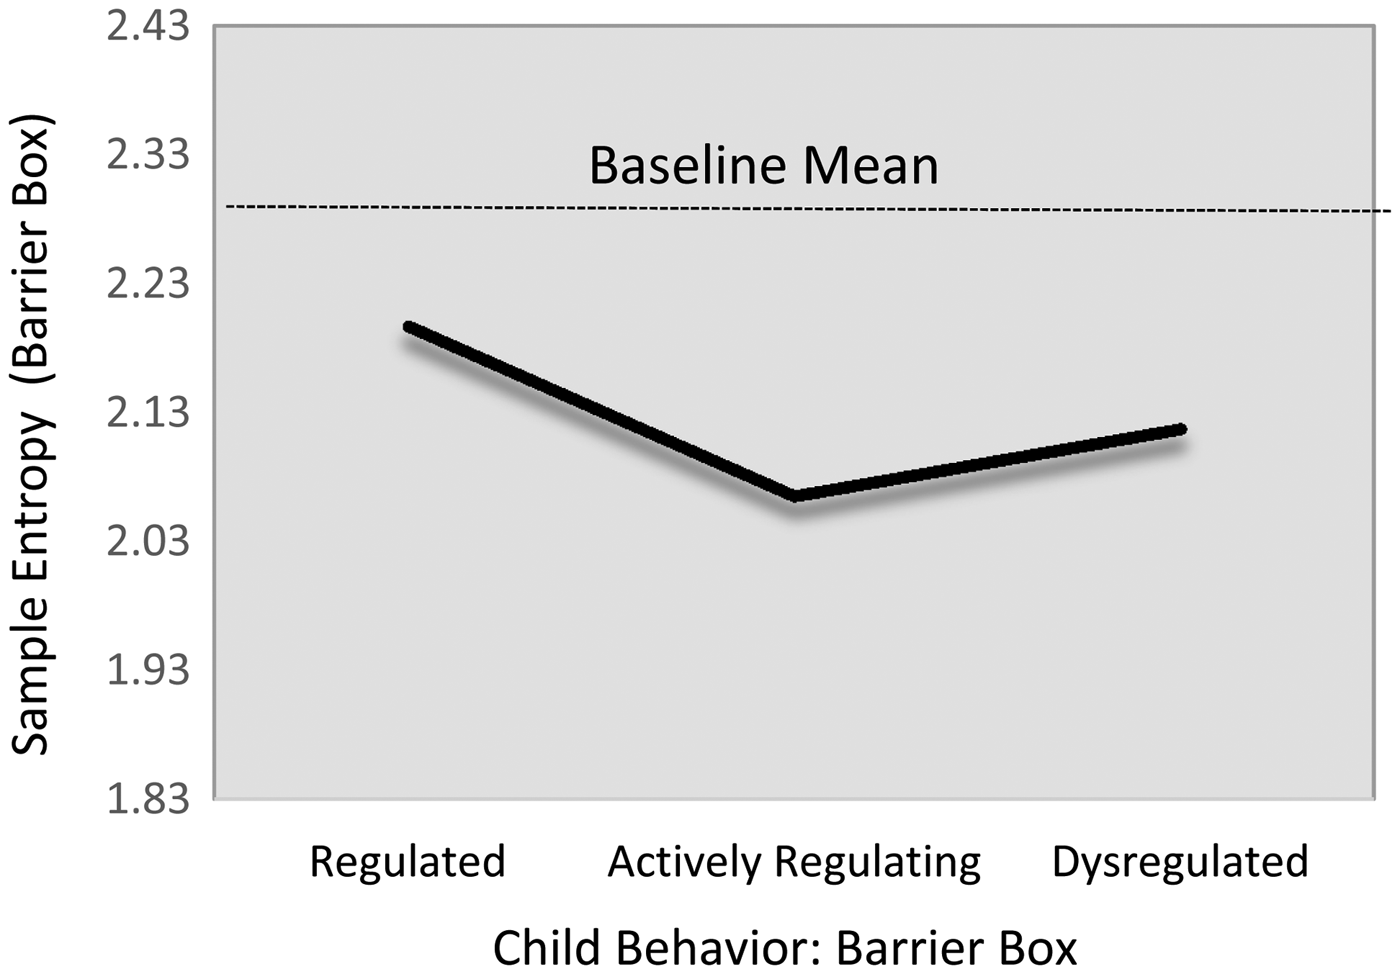
There were no regulation-group differences in children's sample entropy levels during the baseline task. However, there was evidence that children in the actively regulating group showed nontrivially lower HRV sample entropy during the challenge task than did their regulated peers (Table 6; M12, d = –0.44). Of note, this relation only reached marginal levels of statistical significance (B = –0.13, 95% CI [–0.28, 0.02]). Modest descriptive differences were evident for the group of dysregulated children, such that actively regulating children show modestly lower SampEn level (β = –.13). Yet, this difference also failed to reach statistical significance (B = –0.04, 95% CI [–0.19, 0.13]). The fitted estimates from this model are presented in Figure 5.
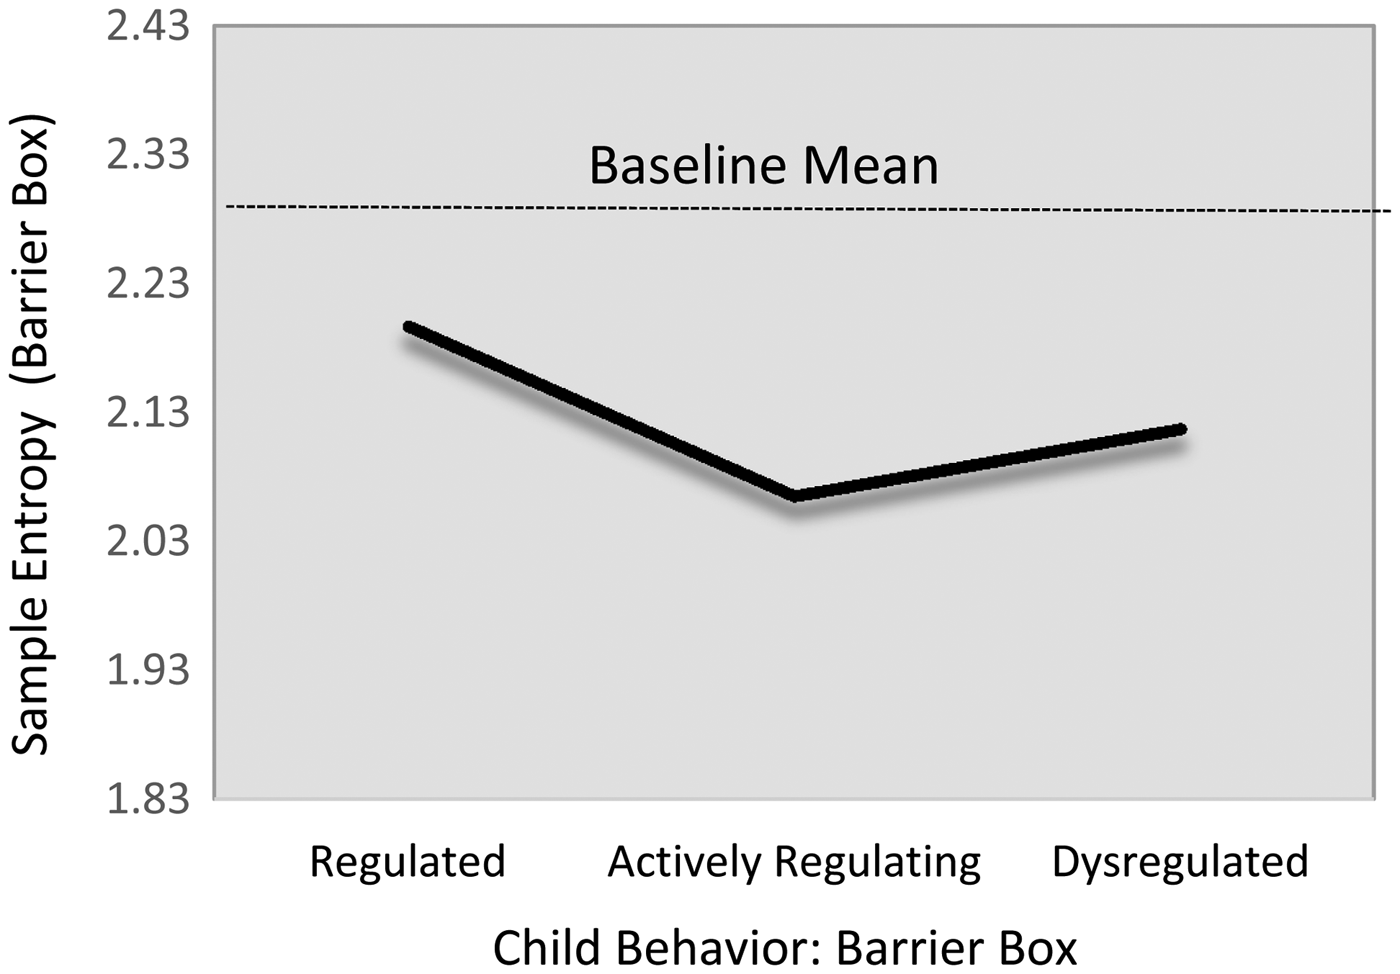
Figure 5. Fitted SD RSA values during challenge task by emotion regulation profile. Note that the scale of y-axis = 2 SD.
Findings summary
Collectively, these findings suggest that the behaviorally measured regulatory profiles were differentiated descriptively by different patterns of linear and non-linear HRV. First, children illustrating regulated behavioral profiles—low negative affect, with high persistence and global regulation—showed clear RSA suppression, coupled with low levels of second-to-second RSA variability (i.e., higher stability), and a more loosely organized temporal structure. Second, actively regulating children—those displaying modest levels of negative affect and off-task behavior, coupled with high levels of global regulation—similarly, showed clear RSA suppression. They also showed comparatively more second-to-second RSA variability than did children in the regulated group; however, this variability occurred in the context of an overall tightening of the temporal organization of cardiac series. Third, children in the dysregulated group showed comparatively blunted RSA suppression and high levels of second-to-second RSA variability, coupled with more loosely organized temporal structure.
Finally, although this study was underpowered to reject all but large interaction effects, we nonetheless conducted a mixture-based version of a multiple-groups analysis to test possible heterogeneity among these relations across the shelter and community samples. We found no statistical nor any consistent descriptive differences in the parameter estimates across community and shelter children.
Discussion
There is strong scientific consensus that emotion dysregulation in early childhood can confer developmental vulnerabilities for subsequent psychopathology (e.g., Beauchaine, Reference Beauchaine2015a; Cole, Hall, & Hajal, Reference Cole, Hall, Hajal, Beauchaine and Hinshaw2013). As such, clarifying the affective, sociocognitive, and biological manifestations of emotion regulation remains a core theme in the field of developmental psychopathology. Informed by multiple theoretical models (e.g., polyvagal theory, Porges, Reference Porges1995, Reference Porges2007; and neurovisceral integration, Thayer & Lane, Reference Thayer and Lane2000), parasympathetic functioning, indexed by RSA, has been a central physiological marker of children's regulatory capacity (Beauchaine & Thayer, Reference Beauchaine and Thayer2015; Thompson, Lewis, & Calkins, Reference Thompson, Lewis and Calkins2008). This work has provided important insights into the physiological instantiation of emotion regulation. However, RSA is just one indicator of a vastly complex and dynamic central autonomic network—a system tasked with integrating information from across the brain and body (Thayer & Lane, Reference Thayer and Lane2000). Drawing from work in statistical physics and dynamical systems modeling, our aim was to consider the extent to which nonlinear indices of HRV complexity might begin to tap some of these dynamics. More specifically, our aim was to test whether our indices of HRV complexity, in addition to RSA, differed across carefully characterized regulatory profiles collected across children with a diverse array of early life experiences.
Our findings provided mixed support for the role of HRV complexity in children's patterns of emotion regulation. Specifically, there were four main findings. First, the challenge task elicited fairly consistent changes in HRV, across both the linear (e.g., RSA) and the nonlinear HRV indices (e.g., α1, α2, and SampEn). Second, there was evidence of three, fairly distinct latent profiles of regulation-related behavior, comprising pairings of negative affect and regulatory behaviors. Third, these regulatory profiles were associated with noteworthy differences in HRV during the challenge task. Specifically, looking across the HRV indices, there was an indication that the regulatory groups maintained different balances of RSA suppression, within-person RSA variation, and HRV complexity. Behaviorally regulated children tended to show considerable RSA suppression, RSA levels that were comparatively more stable during the challenge task, and complexity levels indicative of more loosely organized temporal patterns. Actively regulating children (those showing moderate levels of negative affect, coupled with high regulatory behavior) similarly, showed substantial RSA suppression during the challenge task. They also illustrated greater second-to-second RSA variation; however, this was accompanied by a more tightly organized temporal structure. Behaviorally dysregulated children tended to show minimal RSA suppression and high levels of RSA variability during the challenge task—variability coupled with a more loosely organized temporal structure. Fourth, on average, children experiencing homelessness were slightly more likely to be categorized within the dysregulated behavioral profile. They also showed modestly lower levels of short-run HRV fractality. However, the majority of the behavioral and physiological outcomes were statistically and descriptively similar across the high- and low-risk samples.
Eliciting HRV in the lab and in the field
Irrespective of collection site, the challenge task elicited rather consistent changes in HRV, across both the linear and the nonlinear indices. Compared to baseline, the challenge task was predictive of decreases in children's mean RSA levels (i.e., RSA suppression), increases in second-to-second RSA variability, as well as increases in HRV complexity (as indexed via short-run and long-run fractality, and sample entropy). The effects sizes ranged from fairly modest (d = 0.18) to rather strong (d = 0.50).
We found few differences across the community and shelter samples, with the exception of short-run fractality, which was somewhat lower during both the baseline (d = –0.22) and the challenge task (d = –0.27) for the shelter sample. This is consistent with theory and prior research indicating that chronic exposure to adversities, such as those more common in homeless and highly mobile families, can undermine children's development of effective regulatory skills (e.g., Bassuk et sl., Reference Bassuk, Richard and Tsertsvadze2015; Labella et al., Reference Labella, Narayan and Masten2016; Masten et al., Reference Masten, Fiat, Labella and Strack2015; Obradović et al., Reference Obradović, Bush, Stamperdahl, Adler and Boyce2010). Of note, though, because differences in children's backgrounds and early life experiences were inextricably confounded with data collection site (i.e., shelter vs. lab), it is impossible to parse whether these differences reflect substantive differences in children's experiences or, alternatively, more idiosyncratic differences with respect to where the data were collected.
Although we are hesitant to breathe too much substantive life into a null finding, particularly given our sample size, it is nevertheless interesting that we observed so few differences, given the cumulative risks commonly experienced by homeless and highly mobile families. These children tend to lag behind their lower risk peers, with respect to related constructs like EF (Masten et al., Reference Masten, Fiat, Labella and Strack2015), which, in turn, would be theorized to place these children at risk for comparatively less effective downregulation of ANS activity (Blair & Raver, Reference Blair and Raver2012). Such null relations could be due to many things, including the power afforded by our sample size. Throughout, the width of the 95% CIs highlight the imprecision in our estimates. It, however, remains a somewhat unexpected finding that we aim to pursue in future work.
Typologies of emotion- and regulation-related behavior
In addition to evoking autonomic activity, the challenge task was originally designed to elicit levels of negative affect and frustration that require active modulation in order to successfully minimize the outward appearance of negative emotion and disengagement (Goldsmith et al., Reference Goldsmith, Reilly, Lemery, Longley and Prescott1999). Given the inherent bidirectional dynamics of emotion and the regulation of emotion, labeling either as “bottom-up” or “top-down” is largely heuristic. However, drawing from prior work (e.g., Ramsook et al., Reference Ramsook, Cole, Fields-Olivieri, Beauchaine and Crowell2018), we expected that behavioral patterns suggestive of emotion regulation would comprise mixtures of outward negative affect and regulatory control. As part of this, we aimed to capture simultaneously affective reactivity (i.e., minimal to moderate displays of negative affect/high persistence), as well as regulatory effort (i.e., high levels of regulation are more effortful, when they occur in the context of a stronger negative affect). This idea of regulatory effort was particularly relevant to our interest in HRV complexity because, based on prior work (e.g., Berry & Stallworthy, Reference Berry and Stallworthy2018), we expected HRV to become more internally organized in the context of active effortful engagement.
Consistent with these ideas, there was evidence of three rather distinct latent behavioral profiles, comprising particular pairings of negative affect and regulatory behavior. We labeled the first group as regulated, as they showed no negative affect nor off-task behavior, coupled with heightened regulation-related behaviors. We labeled the second group as actively regulating, in that they showed modest levels of negative affect and off-task behaviors, yet also high levels of regulation-related behavior. We labeled the third, much smaller group as dysregulated, as they showed high levels of negative affect, off-task behavior, and resignation, paired with low levels of regulatory behavior.
Children in the dysregulated group also showed the most help seeking and self-distraction behaviors—behaviors historically ascribed to more adaptive regulatory capacities (Nelson-Le Gall, Reference Nelson-Le Gall1981; Thompson, Cothran, & McCall, Reference Thompson, Cothran and McCall2012). This likely reflects the context-specific nature of what can be considered to be adaptive. That is, help seeking is only an effective strategy to the extent to which help is available. By design, no such help was available during the challenge task. Similarly, self-distraction can be a useful tool for minimizing negative affect because it allows one to shift attention away from the affect-eliciting stimulus (e.g., Reijntjez, Stegge, Terwogt, Kamphuis, & Telch, Reference Reijntjes, Stegge, Terwogt, Kamphuis and Telch2006; Stansbury & Sigman, Reference Stansbury and Sigman2000). However, such self-distraction is an arguably ineffective strategy, when attention and persistence are required to achieve the broader affective goal (i.e., unlocking the box to attain the prized toy). Such mismatches between regulatory strategy and context may actually exacerbate the original negative emotions that the regulatory behavior was intended to allay (Cole, Bendezú, Ram, & Chow, Reference Cole, Bendezú, Ram and Chow2017).
Of course, across the board, our class labels represent behaviorally informed inferences about the underlying affective and regulatory processes, rather than direct measures of the processes themselves. For instance, based on the fact that the regulated group showed similar levels of behavioral regulation as the actively regulating group, yet did so without negative affect or disengagement, we reasoned that the latter group was engaging in comparatively more effortful regulatory control (i.e., more emotion to regulate). Of course, alternatively, it could the case that the regulated group showed so little negative affect because they were applying considerable regulatory effort. Based on our purely behavioral data, we cannot rule out this alternative possibility.
Of note, our results with respect to HRV complexity may begin to shed some light on this question. Informed by some of our prior work with young children (Berry & Stallworthy, Reference Berry and Stallworthy2018), as well as a growing literature with adults (e.g., Kelty-Stephen, Stirling, & Lipsitz, Reference Kelty-Stephen, Stirling and Lipsitz2016; Wallot & Kelty-Stephen, Reference Wallot and Kelty-Stephen2018), we hypothesized that the internal organization of the HRV time series would become more pronounced in the context of more effortful regulation. For example, using HRV data collected during the administration of a battery of EF tasks in a different sample, we found that fractal complexity within the optimal pink noise range (~1) was associated with better EF performance than either more random (~0.8) or rigid time series organization (~1.5), yet only when children were actively challenged by the given task. HRV fractal complexity was unrelated to EF performance, in task blocks in which children were at ceiling (i.e., less challenged). In the present work, we found that the challenge task elicited increases in α1 from baseline, on average, and that that this was particularly the case for the actively regulating children. Holding baseline α1 constant, children in the actively regulating group had α1 levels that were ~0.51 SD higher than either their regulated or dysregulated peers.
Given the presumed curvilinear relation between α1and “optimal” regulatory functioning and the fact that all groups of children were performing within the optimal “pink” noise range, it is difficult to assert that these children's HRV organization showed better complexity, in any general sense. However, these data do suggest that the short-run temporal organization of these children's cardiac time series becomes comparatively more tightly organized during the challenge task, without moving into high levels of rigidity indicated by brown noise (α1 = 1.5). Although it only reached marginal levels of statistical significance, a similar substantive finding was evident for the HRV sample entropy. Actively regulating children tended to evince lower sample entropy levels during the challenge task than their regulated counterparts. Recall, lower levels of sample entropy are thought to reflect greater maintenance of information within a system, whereas higher levels suggest loss of information as the system becomes increasingly chaotic. As such, children in the actively regulating group showed comparatively larger movement toward tighter temporal organization of their cardiac time series during challenge, as indicated by sample entropy. Though statistically marginal, these differences corresponded to effects sizes of nearly half a standard deviation (d ~ 0.44). Thus, there is at least some indication that the actively regulating group showed nontrivial differences in the temporal organization of their cardiac time series data, across two of our complexity indices.
It is important to note that no group differences were evident for two of the other complexity indices: long-run HRV fractality or multi-fractal width. Here, long-run fractality was defined as α estimated from heartbeat data that varied beyond a distance of 14 beats from heartbeatt. It is worth noting that the original coining of the “short-” versus “long-run” language was based on 24-hr ambulatory cardiac (Holter) recordings (Peng et al., Reference Peng, Havlin, Stanley and Goldberger1995), a fundamentally different time scale than our 5-min task. Nonetheless, it is interesting that we failed to see similar relations across larger time scales. We think it highlights a critical (and open) question regarding the alignment between system complexity and system and context specificity. It may be the case that understanding the organization of a system over long spans of time is critical for some phenomena, such as overall cardiometabolic decline or the onset of senescence, which reflect the massive integration of far-reaching systems functioning at highly variable times scales. In contrast, it may be the case that shorter term temporal organization is more appropriate for real-time regulatory phenomena, such as the millisecond to multiminute time scales of an acute ANS response. In addition, some phenomena may require high levels of flexibility in the temporal organization of the system as it unfolds in time (i.e., multifractality), for instance, contexts requiring nimble shifts between highly variable task demands (e.g., sight reading while playing a difficult musical composition). Other contexts (e.g., writing a manuscript) may benefit from stability in internal organization over longer spans of time. On a long enough timeline, a single individual could move continuously through all of these varying types of “optimal” time series organization. This is all to say that time series complexity is not a single thing. Rather, optimal complexity is likely contingent on the temporal scale of the phenomenon of interest, as well as the context in which the system is unfolding. Although rarely discussed, alignment across these different scales will be central to clarifying the ultimate utility of the method.
For the time being, we find that considering these complexity indices in concert with more common linear indices of HRV, like RSA, likely provides the clearest picture with regard to their substantive meaning. Specifically, our findings suggest that our observed regulatory profiles could fall on a multidimensional scale comprising overall basal tone and phasic flexibility of vagal control, along with the overall complexity of HRV series.
Our regulated grouping of children showed clear RSA suppression and the most within-person RSA stability during the challenge task. Yet, with respect to complexity, they largely maintained their baseline levels. Given their clear parasympathetic response and seemingly low levels of negative affect, this could reflect the possibility that these children's internal regulatory needs were met largely through an effective parasympathetic response. That is, there is little need to orchestrate broader autonomic engagement, if there is (a) minimal negative affect to regulate, and/or if (b) changes in vagal control alone achieves one's allostatic needs. The actively regulating children also showed clear RSA suppression during the challenge task. In addition, they illustrated substantial within-person variation in their RSA levels. Yet, of note, this increase in RSA variability was accompanied by an increase in the temporal organization of the broader HRV time series. As such, it could be the case that the children had to orchestrate movement into the broader autonomic space, yet they did so in the context of a reasonably organized ANS landscape. Finally, the small grouping of dysregulated children illustrated comparatively less RSA suppression and greater within-person RSA variability during the challenge task. Further, this variability was comparatively more loosely organized than seen with the actively regulating children. Thus, this could suggest dysregulation at both the parasympathetic and broader autonomic levels.
Although these interpretations are ultimately speculative, it is heartening that the findings with respect behavioral regulation and RSA suppression are consistent with prior work (e.g., Beauchaine et al., Reference Beauchaine, Bell, Knapton, McDonough-Caplan, Shader and Zisner2019; Graziano & Derefinkko, Reference Graziano and Derefinko2013). It is also interesting that all three indices (RSA suppression, within-person RSA variability, and HRV complexity) were required to differentiate the overall cardiac profiles across the behavioral regulatory groups. At the end of the day, though, much needs to be done to clarify the ultimate substantive meaning of the HRV complexity parameters.
A downside to summary-level complexity statistics is that they tell us nothing about process. For example, we have made the inferential jump that changes in HRV complexity elicited in the context of an ANS-relevant challenge may capture some of the broader organization of the CAN. Yet, even if we could be sure that this was a valid inference (we cannot), we would nonetheless be left with a rather nonspecific marker of a remarkably complex and dynamic network. For example, although there are meaningful substantive and empirical differences between HRV complexity and more typical measures of RSA, RSA dynamics presumably drive some of the self-organizational properties captured by our complexity index. On one hand, this could be seen as a limitation. On the other hand, it is a virtually definitional aspect of the dynamical systems approach because complex systems cannot be discretized into their distinct constituent parts. Thus, if we are to take dynamical systems models of socio-neurocognitive development seriously (i.e., massively interactive, multidirectional, nonlinear, self-organizing, and emergent processes; e.g., Barrett et al., Reference Barrett, Wilson-Mendenhall, Barsalou and Gross2013), then these admittedly “black box” summaries of system-level organization may be as close as we can get, at least in the near future. At present, there are no clear ways to explicitly measure and model the structure of ANS dynamics with “free-range” humans, let alone the expansive dynamics of the CAN. When considered along with the presumably massive population heterogeneity in these processes (e.g., Molenaar, Reference Molenaar2004), the problem space seems even more intractable. Although indices of HRV complexity are no panacea, we think that they may be a promising and computationally elegant proxy for the complex system dynamics that lay at the heart of many developmental questions.
Limitations
Of course, our findings should also be considered in light of their limitations. Our sample was relatively small (N = 115). This is noteworthy, given that our analytic approach requires a nontrivial number of parameters. The fact that our models derived a small number of highly discriminable classes likely helped to address this weakness (Masyn, Reference Masyn and Nathan2013). Nonetheless, our statistical power was limited for all but moderate to large effect sizes. In addition, because we expected a relatively low proportion of children to exhibit truly dysregulated behavior during this type of challenge task, our absolute n for this grouping was quite small (N = 12). Given the limited number of participants experiencing homelessness available to participate at any given time, this remains an ongoing practical challenge for this line of work.
Similarly, although maintaining two very different samples allowed us to test our questions with children with a diverse array of early life experiences, it also came with some costs. First, the collinearity between shelter status and our sociodemographic measures (e.g., education, race, and adverse life events) approached unity. Thus, we could not statistically differentiate sample variation from sociodemographic variation. Second, measurement location was perfectly confounded with shelter status; shelter children were assessed only in the shelter and community children were assessed only in our lab. As such, we cannot disaggregate substantively meaningful differences between the samples from differences that might be due to the venue in which the data were collected.
In addition, although we attempted to align posture/movement and speech (i.e., none) across the baseline and challenge tasks, our resting baseline was decidedly “vanilla” (Jennings et al., Reference Jennings, Kamarck, Stewart, Eddy and Johnson1992). That is, despite being a staple in work with young children, quietly watching an unstimulating video may not capture children's true basal RSA levels, nor are the task demands aligned completely with those of the challenge task. Thus, although we cannot think of any specific methodological confounds that would explain the present findings, we also cannot rule out this possibility. We were also unable to measure and adjust for respiration. Thus, it is possible that some of the variation in both RSA and the complexity indices reflects respiration (i.e., not purely parasympathetic/general ANS processes, respectively). This is a perennial methodological challenge when working with young children, and increasing evidence indicates that the misspecification of age-appropriate respiratory bands can lead to nontrivial biases in RSA (Shader et al., Reference Shader, Gatzke-Kopp, Crowell, Reid, Thayer, Vasey and Beauchaine2018). The band employed in the present study (0.40 to 1.04 Hz) was somewhat restrictive and may have truncated some of the respiration-relevant spectral power for children with comparatively slower respiration rates. We are presently validating ambulatory impedance cardiographic methods, as a means of better estimating and controlling for potential respiration effects. However, to the extent to which respiration also differs across our regulation groups, it remains a threat to validity in the present work.
Finally, most complexity indices require at least one user-specified analytic decision (e.g., SampEn: tolerance band [r] and number of repeated beats [m]). We adopted commonly used values and conducted sensitivity analyses with alternative parameters. However, we cannot say whether other parameters combinations might alter our conclusions.
Summary
These caveats notwithstanding, the present work suggests that integrating concepts and tools derived from dynamical systems thinking may provide novel insights into our understanding of the cross-level organization of emotion regulation. In particular, our results suggest that cardiac complexity may be especially useful for discerning active, effortful emotion regulation from less effortful regulation and dysregulation.
Acknowledgments
We thank the children and families who participated in the research as well as Amanda Grenell, Keira Leneman, Isabella Stallworthy, and Stephanie Carlson for their help with data collection and processing. We also gratefully acknowledge the support of our community partners, without which this work would not be possible.
Financial support
This research was supported by a predoctoral fellowship from the National Institute of Health (T32 MH015755), the University of Minnesota Interdisciplinary Fellowship, the Irving B. Harris Professorship (to A.M.), and the Institute of Child Development Graduate Student Small Grants Program. The content is solely the responsibility of the authors and does not necessarily represent the official views of the National Institutes of Health.


