Introduction
Pursey et al.Reference Pursey, Stanwell, Gearhardt, Collins and Burrows 1 found that the prevalence of food addiction is around 20% in the Western world population. It is well known that food components and diets can modulate brain functionality and brain activity,Reference Small, Zatorre, Dagher, Evans and Jones-Gotman 2 , Reference Tillisch, Labus, Kilpatrick, Jiang, Stains and Ebrat 3 while the brain’s activity patterns influence the quality and the quantity of nutritional intakeReference Gomez-Pinilla 4 , Reference Thomas, Ryu and Bartness 5 . However, the nature of this relationship is unclear. Our early studies done on rats showed that specifically the mixture of 35% fat and 50% carbohydrate rather than the pure energy content in food leads to hedonic hyperphagia.Reference Hoch, Pischetsrieder and Hess 6 , Reference Hoch, Kreitz, Gaffling, Pischetsrieder and Hess 7 Hedonic hyperphagia is described as caloric hyperalimentation beyond satiety.Reference Sharma and Padwal 8 Humans also show preference to refined foods with high fat, sugar, or salt content, in quantities that show abuse and addictive-like behaviors.Reference Gearhardt, Davis, Kuschner and Brownell 9 These high caloric foods, such as potato chips, are often consumed for reward and pleasure and not for homeostatic purposes. Furthermore, Schulte et al.Reference Schulte, Avena and Gearhardt 10 assessed among 518 participants a list of 35 foods and their likelihood to be addictive. From their results, the snack food potato chips turned out to be the third most likely addictive food.
Functional magnetic resonance imaging (fMRI) studies, being the gold-standard for non-invasively investigating human brain functions, have highlighted the existence of brain anomalies and vulnerability factors related to obesity and eating disorders such as binge eating or anorexia nervosa.Reference Burger and Stice 11 – Reference Frank 15 fMRI is expanding our knowledge on the neurobehavioral dimensions of food choices and motivation processes. For example, one study reported that in humans, pleasantness of a food is highly correlated with whether it will be eaten and how much will be eaten.Reference Rolls 16 A different study identified the primary gustatory cortex in the anterior insula of human subjects with the quality and intensity of taste. The orbitofrontal cortex and anterior cingulate cortex were also found to represent the reward value of taste; activations in this area correlate with the subjective pleasantness of taste.Reference Grabenhorst and Rolls 17 , Reference Grabenhorst, Rolls and Bilderbeck 18 Another neuroimaging study suggested that the ventromedial prefrontal cortex (vmPFC) is in charge of short-term value of stimuli (eg, taste), whereas the dorsolateral prefrontal cortex (DLPFC) is in charge of long-term considerations (eg, health). The researchers concluded that failed self-control in obesity can be dependent on the extent to which the DLPFC can modulate the vmPFC.Reference Hare, Camerer and Rangel 19 These neuroimaging findings pave the way to prevention studies that could help early diagnostics and better treatment options for eating disorders. However, the exact neuronal mechanisms underlying these disorders remain unclear.
Recently, neuroimaging interest has been directed toward spontaneous brain activity in the absence of a task or stimulus, the so-called resting state fMRI (RS-fMRI).Reference Lee, Smyser and Shimony 20 The results are different spatial patterns of functionally connected brain structures that are referred to as resting state networks (RSNs). A variety of these networks have been identified as behavior driving.Reference Damoiseaux, Rombouts, Barkhof, Scheltens, Stam and Smith 21 It has been proven that RSNs can individually adapt to experience after short-time exposures to a stimulus, and these RSNs are a good indicator for addictive behaviors.Reference Ma, Liu, Li, Wang, Zhang and Jiang 22 , Reference Kelly, Zuo, Gotimer, Cox, Lynch and Brock 23 Furthermore RS-fMRI has proven to work as an early indicator of neurological and psychiatric disorders due to pathological changes in the brain.Reference Liu, Liang, Zhou, He, Hao and Song 24 , Reference Zhao, Liu, Wang, Liu, Xi and Guo 25
Graph theoretical analyses consider the whole brain dynamics and have been proven effective in detecting abnormalities of RSNs.Reference dos Santos Siqueira, Biazoli Junior, Comfort, Rohde and Sato 26 – Reference van den Heuvel, Mandl, Stam, Kahn and Hulshoff Pol 28 Graph theory (GT) describes the whole brain as an interrelated network and quantifies this network organization, like the information flow, using different measures.Reference Bullmore and Sporns 29 Additionally, support vector machines (SVM) are one of the most robust tools used in machine learning because of their ability to discriminate a set of features between (2) categories in high dimensional spaces, and an excellent reproducibility of the classification results.Reference Cortes and Vapnik 30 , Reference Quanquan, Zhenhui and Jiawei 31 Used in conjunction with GT, SVM provides new insights in understanding brain dynamics.Reference Khazaee, Ebrahimzadeh and Babajani-Feremi 27 , Reference Dosenbach, Nardos, Cohen, Fair, Power and Church 32 – Reference Li, Qin, Chen and Li 34
The current study aimed to determine whether visualization followed by ingestion of different food types (high-caloric: potato chips, and low-caloric: zucchini) is able to generate different changes in the resting state networks of healthy individuals. In addition, we propose a method using graph theoretical analysis in conjunction with SVM for identifying biomarkers that can differentiate the 2 types of food stimulation.
Methods
Participants
A total of 19 (10 female, 9 male) healthy right-handed participants with body mass index (BMI) in the range 19–27 and aged 26–47 were recruited from the research staff of the Friedrich-Alexander-Universität Erlangen-Nürnberg (FAU). Participants did not receive financial compensation. Exclusion criteria included absence of any current or past form neurological/psychiatric diseases, having a BMI outside the range of 19–27, or having any contradictions to fMRI scanning. Ethical approval (220_15B) was provided by the local ethics committee of FAU, and informed consent was obtained from all participants. The study adhered to the tenets of the Declaration of Helsinki.
Study design
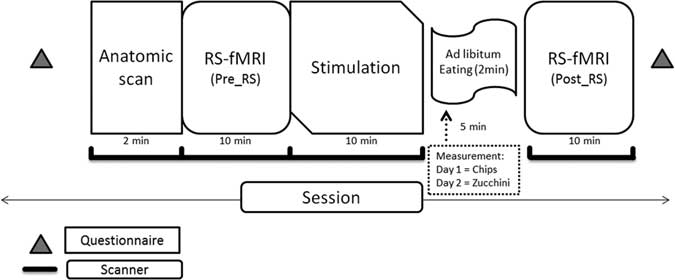
The experimental procedures are summarized in Figure 1. Every subject underwent 2 different fMRI sessions of ∼40 minutes in total. The interval between the 2 sessions was 3 days. Participants arrived to the university clinic previously knowing what food they would be presented each day. The intention behind this was to increase the expectation of food reward, which is known to enhance neural cue reactivity.Reference Malik, McGlone and Dagher 35 The subjects were asked not to eat food for at least 2 hours before the experiment. At arrival, participants filled out a questionnaire and subsequently entered the MRI scanner. In each session, resting state was measured twice by instructing the participants to rest with their eyes open and lay still in an ambient light environment. Each fMRI session started by acquiring the individual anatomical imaging, followed by the first resting state (RS) scan (Pre RS-fMRI) and BOLD visual stimulation [presentation of different images of potato chips and zucchini: image presentation: total 196 vol. (time points)=28×7, 1 block of images contained 7 images, 1 image=1 vol.=3 sec)]. There was then a pause of 5 minutes, where the participants were moved out of the scanner but remained on the motor table and had to consume (day 1= salted potato chips: 528 kcal/100 g, 33% fats, 49% carbohydrates; day 3=sliced zucchini: 17 kcal/100 g, 3% fats, 3.5% carbohydrates) ad libitum for 2 minutes. They were then introduced once again in the scanner for a second RS scan (Post RS-fMRI). [Note: The results of the BOLD stimulation and questionnaire results are beyond the scope of the current publication.]

Figure 1 Schematic of the study protocol.
The MRI data were collected by a 3T scanner (Magnetom trio; Siemens) using a standard 8-channel, phased-array head coil. For anatomic datasets, a T1-weighted, magnetization-prepared, rapid gradient-echo (standard Siemens MP-RAGE) sequence with 1 mm isotropic resolution was used; functional data were acquired using a standard single-shot, echo-planar imaging (EPI) sequence [repetition time/echo time (TR/TE)=3000/30 ms] using a 128×128 matrix and a spatial resolution of 1.5 mm in plane, 3 mm slice thickness, and 0.75 mm gap between slices.
Data processing and analysis
The RS-fMRI data were analyzed initially for each subject, session, and measurement by means of BrainVoyager QX (v. 2.8, Brain Innovation B.V. Maastricht, The Netherlands). Our brain atlas of choice was the Harvard-Oxford brain atlas (http://www.fmrib.ox.ac.uk/fsl/), which is a set of probabilistic atlases covering 48 cortical and 21 subcortical structural areas. This atlas was used to define the different regions of interest (ROIs) necessary for the multi-seed region analysis, which preceded GT.
The next step was to preprocess the RS-fMRI data in BrainVoyager. Preprocessing of the anatomical data included inhomogeneity correction, brain extraction, spatial transformations, and selection of ROIs for white matter and ventricles. Inhomogeneity correction estimates the bias field of the B1 field of the receiver coil by analyzing the variability of white matter intensities over space.Reference Vaughan, Garwood, Collins, Liu, DelaBarre and Adriany 36 The brain was then segmented from the skull and other head tissues using automatic “brain peeling.” This tool analyzes the local intensity histogram in small volumes (20×20×20 voxels) to define different thresholds for an adaptive region-growing technique.Reference Goebel, Esposito and Formisano 37 The outcome was visually inspected and manually refined. Data were then transformed into anterior commissure - posterior commissure line and Talairach standard space (1mm3 isotropic). Finally ROIs were manually selected for both white matter and ventricles and stored for later processing.
The preprocessing of functional data in BrainVoyager included slice scan time and head motion correction and a frequency space high pass filter on 0.009 Hz. Slice scan time correction was performed using sinc interpolation based on information about the TR (3000 msec) and the order of the slice scanning. 3D motion correction (trilinear and sinc interpolation) was carried out to detect and correct small head movements by spatially aligning all volumes of a subject to the first volume through rigid body transformations.Reference Goebel, Esposito and Formisano 37 No spatial smoothing was performed at this stage. Due to software limitations of BrainVoyager QX 2.8, MagnAn (BioCom GbR, Uttenreuth, Germany) was used to perform the low-pass filter at 0.08 Hz, completing then the band-pass filter. The bandpass-filtered data were transferred back to BrainVoyager. Finally, a general linear model (GLM) was performed with the time courses from the previously selected ROIs (ie, white matter and ventricles) together with the motion correction predictors as cofounders. This was done to regress out these nonbrain function–related global fluctuations.
Connectivity analysis
Data were analyzed using BrainVoyager QX 2.8, Amira (FEI Company, OR, USA), and MagnAn. For the automatic multiseed corregistration method,Reference Kreitz, de Celis Alonso, Uder and Hess 38 48 cortical and 13 subcortical brain structures for each hemisphere were defined by registering (affine transformation with 9 degrees of freedom) the Harvard-Oxford 4D probability atlas to each dataset using BrainVoyager. This was done for all the individuals in all the different condition groups (pre RS-fMRI, post RS-fMRI for potato chips and zucchini sessions). Next, the seed regions were determined automatically through the center of mass of each of the identified atlas brain structures. The correlation was then calculated for all the voxels in the brain with the average time course of each seed region. Based on resulting 3D correlation volume map for each seed region, the mean correlation value per brain structure was obtained by averaging over all significant correlating voxels of the given brain structure. By doing so, an asymmetric correlation matrix was generated with seed regions in rows and the correlating brain structures in columns.
Graph networks
In the next step, the resulting individual correlation matrices were transformed into network graphs consisting of vertices (or nodes) and edges. Vertices represent the brain’s regions, whereas edges between pairs of brain regions indicate functional connectivity. The topology of network graphs is strongly dependent on the numbers of represented connections. The connections configuring a graph with a given sparsity were defined by thresholding (binarizing) the associated correlation matrix with the top 1230 number of connections [123 structures with an average number of edges (k) of 10]. The resulting network leads to different threshold values per matrix but of equal sparsity and therefore important to comparable graph topology.
Graph measures
The organization of complex networks can be characterized by various graph measures. These quantify the network’s properties of integration and segregation and, therefore, are suitable to describe the efficiency of information flow within a network. Watts and StrogatzReference Watts and Strogatz 39 were the first to characterize “small world network” topology. This was represented by the small world index (σ), which represents the effectiveness of the information flow, and is calculated as the quotient of the normalized clustering coefficient and the normalized average path length. To generate characteristic network features (network statistics per brain region), diverse graph measures were calculated on the binarized matrices from the 2 post RS measurements for each brain structure per individual using MagnAn: path length, clustering coefficient (functional integration and functional segregation), and degree. The path length measures the average functional distance between 2 nodes, whereas the clustering coefficient is the tendency of network nodes to cluster.Reference Bullmore and Sporns 29 A network with short path lengths and high clustering coefficient can be considered functionally integrated. On the other hand, long path lengths and low clustering coefficient is a sign of functional segregation.
Degree is a factor of local significance of nodes in network topology. In addition, hub and authority (local nodal measures) features were computed on the averaged individual correlation matrices for each post RS measurement to see the effect of the stimulation. Local nodal measures describe the properties of individual network elements and determine connectivity characteristics associated with these elements.Reference Rubinov and Sporns 40 For hub identification we used the hyperlink-induced topic search (HITS).Reference Flake, Lawrence, Giles and Coetzee 41 This algorithm assigns 2 scores for each node: its authority, which estimates the amount of valuable information a node holds, and its hub score, which measures how many highly informative or authoritative nodes are being pointed to by a node.Reference Kleinberg 42
Significant differences network-based statistics
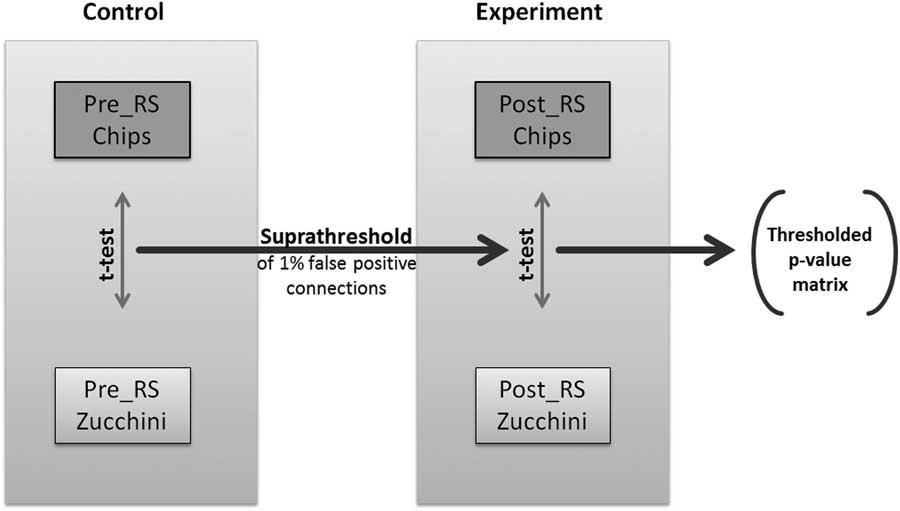
In order to be able to compare differences in network topologies across 2 experimental conditions, here potato chips vs. zucchini, we decided to study the changes in connectivity between each pair of nodes (Figure 2). To identify pairwise RS associations that are significantly different in relation to the ingested food, we implemented a modified version of the network-based statistics (NBS), first introduced by Zalesky et al.Reference Zalesky, Fornito and Bullmore 43 NBS relies on the assumption that the group differences in single connections are more likely to be false positive than the differences in larger connected components. To each connected component of group differences, a p-value, which controls for the family-wise error, was attributed using permutation testing.Reference Zalesky, Fornito and Bullmore 43 However, experimental designs with paired subjects between groups cannot be permutated, as the subjects’ affiliation to a group cannot be randomly changed. To overcome this limitation, we implemented an additional control experiment with identical experimental parameters. The pre-RS measurements for both food conditions were considered as the control experiment, as repeated RS measurements have been shown to be robust and stable.Reference Damoiseaux, Rombouts, Barkhof, Scheltens, Stam and Smith 21 , Reference Braun, Plichta, Esslinger, Sauer, Haddad and Grimm 44 – Reference Smith, Beckmann, Ramnani, Woolrich, Bannister and Jenkinson 46 Our paired NBS approach used the Fisher’s z-transformed correlation matrices of all 4 RS scans per individual (2 of the experimental and 2 of the control measurements). For each individual, the differences of correlation values per connection between the 2 RS correlation matrices of each session (control and experimental) were calculated. These difference matrices are used to calculate the pairwise t-statistics and later on the permutation testing. We then determined the 99% quantile of the p-values of the paired t-statistics of the control group and identified a set of supra-threshold links corresponding to 1% hypothetical false positive connections. This threshold was applied to the paired t-statistics p-values of the experimental group, and all connected components above this threshold that are equal or smaller than the largest component of the control group were eliminated. The remaining connected components of modulated connections were exclusively based on the connections that were part of RS graphs with defined sparsity (1230 strongest directed connections, see above).

Figure 2 Flowchart of the applied paired Network Based Statistics approach.
Fisher score and SVM
For each brain structure, the 5 statistical parameters mentioned above (path length, clustering coefficient, degree, hub, and authority) were computed per RS measurement. Consequently, using all the brain structures (123 in total), we obtained a feature vector of 738 dimensions for each measurement.
Once the features were created, the high dimensionality became a problem. This is because when dimensionality increases, the volume of the space augments so fast that the data results become sparse. Sparsity is problematic for any method that requires statistical significance. In order to obtain a statistically reliable result, the amount of data needed to support the result often needs to grow exponentially with the dimensionality.Reference Bellman 47 As a result, we employed a specific feature selection for dimensionality reduction. For this task we chose the Fisher score, which immediately allows the comparison of the discriminating power of the selected features, one by one, granting the possibility to choose the features that would best classify the data while keeping their number to a minimum.Reference Khazaee, Ebrahimzadeh and Babajani-Feremi 27 , Reference Quanquan, Zhenhui and Jiawei 31 , Reference He, Cai and Niyogi 48
Support vector machines (SVMs) belong to the field of machine learning for 2-group classification problems. The selected features were mapped in a high m-dimensional space (m being the number of selected features). In this space a linear hyperplane classifier was constructed to robustly separate the groups.Reference Cortes and Vapnik 30 , Reference Quanquan, Zhenhui and Jiawei 31 , Reference Chang and Lin 49 SVM analyses were conducted in Python (Python Software Foundation, https://www.python.org/) using the scikit-learn library (http://scikit-learn.org/stable/). To test the accuracy performance of the classification model, we employed leave-one-out cross-validation (LOOCV). LOOCV is a form of K-fold cross-validation, where K is equal to N (being in our case N=32, 2 measurements per subject).Reference Cawley and Talbot 50 The most discriminative features based on the Fisher scores were used to train the classifier. Using the LOOCV method, we aimed at evaluating the classifier’s accuracy, specificity, and sensitivity. The number of selected features increased for each fold until all were considered, obtaining different accuracies for each run.Reference Khazaee, Ebrahimzadeh and Babajani-Feremi 27 , Reference Hastie, Tibshirani and Friedman 51 We chose specificity as a measure to reflect the capacity of SVM to correctly classify potato chips stimulation and sensitivity to reflect the capacity to correctly classify zucchini stimulation. Moreover, we thereby identified the most discriminative brain regions related to specific graph measures, according to different cutoff scores.
In addition, Pearson correlation coefficients were calculated among potato chips post RS-fMRI graph measures and BMI, to check for the specific effect of high-caloric food stimulation. Linear regression models were used to determine significant associations (p<0.05). Only degree and path length showed significant correlations with BMI. Therefore, we focused on these measures to investigate both local and global dynamics.
Results
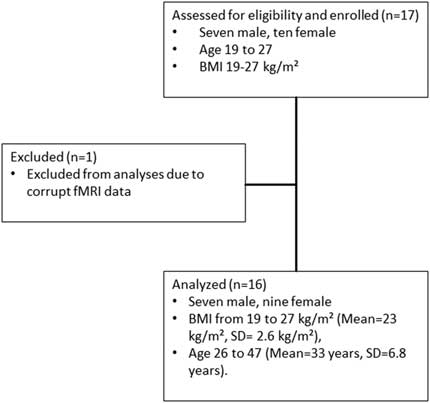
The STROBEReference von Elm, Altman, Egger, Pocock, Gotzsche and Vandenbroucke 52 flowchart for recruitment is shown in Figure 3. One female participant was excluded from the analysis, as her fMRI data were corrupted. The final sample used for the complete analysis resulted in 16 (9 female and 7 male) healthy participants with BMI in the range 19–27 kg/m2 (mean=23 kg/m2, SD=2.6 kg/m2), aged 26–47 years (mean=33 years, SD=6.8 years).

Figure 3 STROBE flowchart for recruitment.
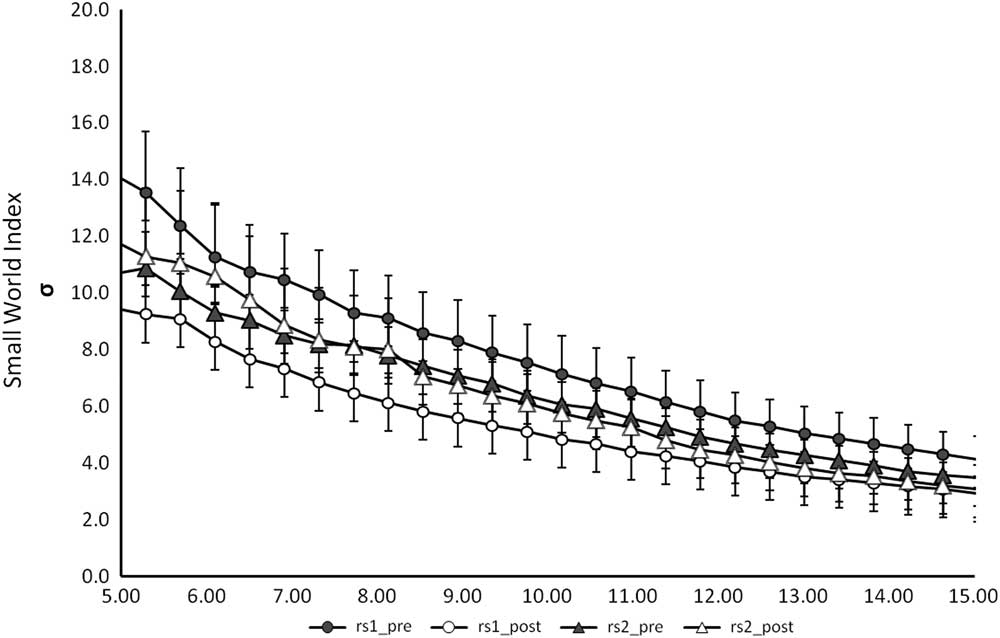
In order to study how potato chips consumption after visual stimulation induces dynamic modulations in resting state connectivity as opposed to zucchini consumption, we performed 4 different kinds of analysis. First we checked for the global measure the small world index σ, as introduced in the Methods section as a measure of information flow (Figure 4). Results show that σ was preserved, as there were no significant differences between the different measures. For this reason we conducted a more sophisticated analysis to understand the RSN differences. NBS and SVM are methods for characterizing networks with the advantage of not compressing all information into one single value.

Figure 4 Graph representing the small world index for the different RS-fMRI measures against k (average number of connections per node). No significant differences were detected between the groups.
Connectivity differences
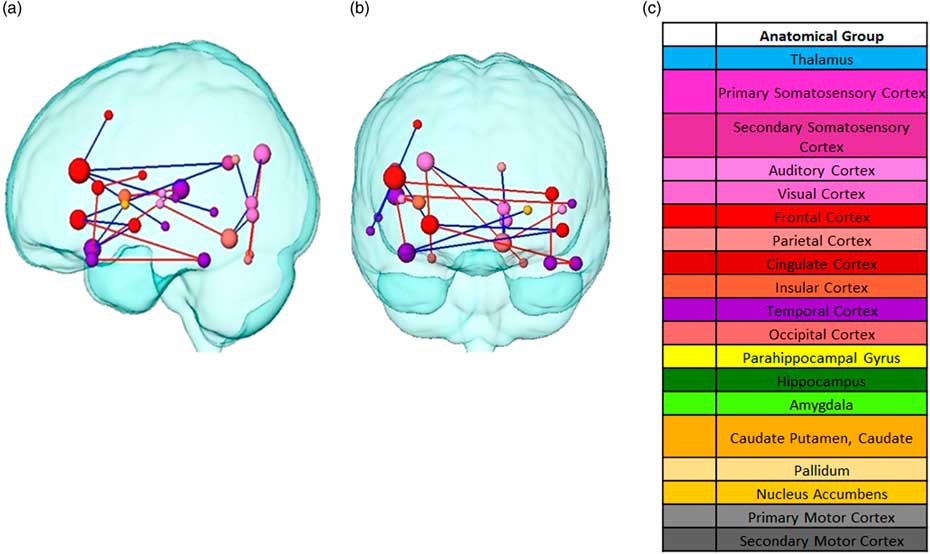
Following, paired NBS was used to determine any significant changes between pairwise connectivity. For the statistical analysis, the difference matrices were used to calculate the uncorrected paired t-statistics. Compared to the control condition, the visual presentation followed by the consumption of different food led to significant connectivity changes in the post resting state (both at α=0.0186) with widespread significant differences between potato chips and zucchini (as illustrated in Figure 5). After thresholding the paired t-statistics p-values, a p-value controlling the family-wise-error was ascribed using permutation testing to each remaining connected component of group differences (p=0.093).These changes took place mainly between cortical structures, with the exception of the basal ganglia. Overall, the left hemisphere showed more connectivity changes, mainly decreased, than the right one. Three frontal nodes stood out among the rest: the inferior frontal gyrus, frontal orbital cortex, and planum polare, the pairwise connectivities of which mainly decreased for potato chips compared to zucchini. In contrast, the pairwise connectivity mostly increased for potato chips compared to zucchini between temporal structures, such as the planum temporale, inferior temporal gyrus, and temporal pole. The occipital area also showed changes in connectivity in both directions, increased and decreased.

Figure 5 Pairwise connectivity differences between food stimuli from two different planes. (a) Sagittal view (b) Coronal plane. Node Red edges represent increased connectivity for chips compared to zucchini. Blue edges represent decreased connectivity for chips compared to zucchini. Colors correspond to the anatomical groups in the Harvard-Oxford brain atlas (c) Color label of the anatomical brain regions. Node size represents the total degree (total amount of connections with the rest of the network).
Classifier accuracy
The SVM was calculated to detect the most discriminative structures and measures between potato chips and zucchini. Table 1 shows the classification, sensitivity, and specificity scores using LOOCV when comparing potato chips to zucchini consumption, when preceded by a visual presentation of both food items. The number of features that resulted in the best classifier performance depended on the desired cutoff score. As shown, 67 features were needed to obtain the best classification performance with 100% of LOOCV classification accuracy.
Table 1 Accuracy, sensitivity and specificity scores using LOOCV when comparing chips to zucchini stimulation

Most selective features
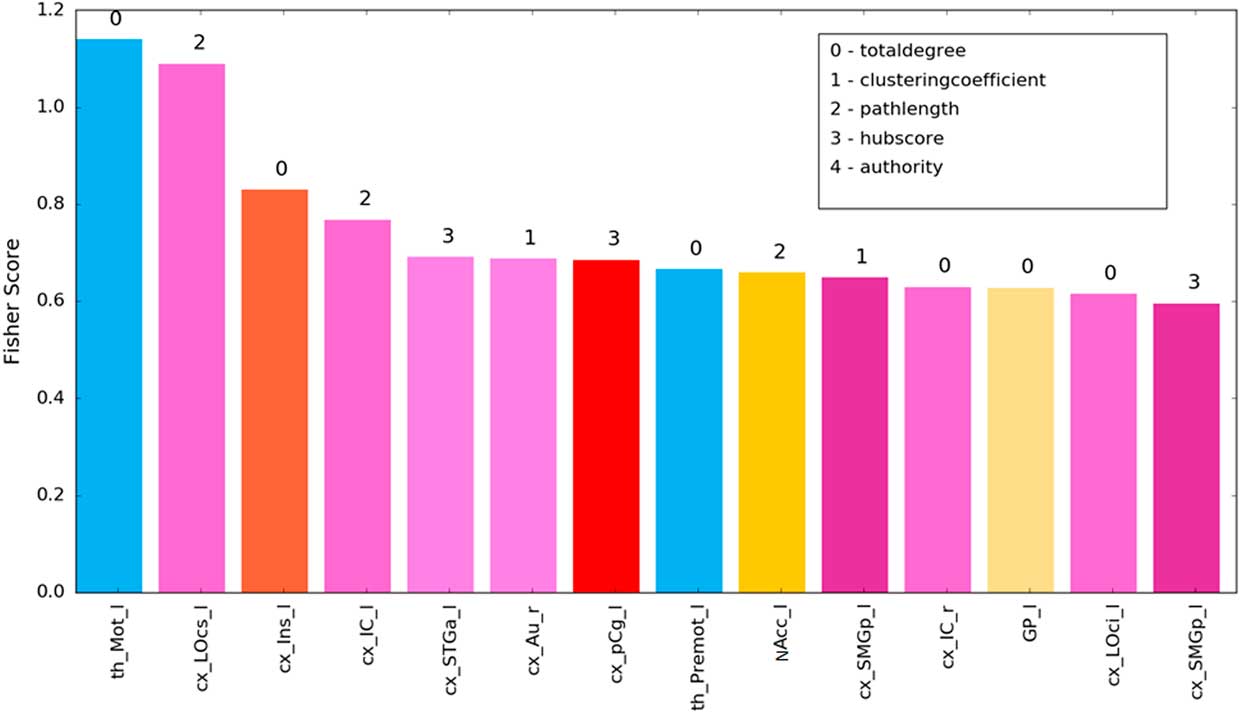
For the identification of the most discriminative brain structures according to the graph theoretical measures, we selected the regions with 100% accuracy. Figure 6 and Table 2 illustrate the most discriminate features (cutoff of 0.15). Visual, auditory, and somatosensory structures were predominant. Various subcortical structures (thalamus, insula, and basal ganglia) were also found to play a role in discriminating between which food item had been consumed. Interestingly, results of our experimental design revealed changes mainly in left-sided brain regions.

Figure 6 SVM of most discriminative features (cutoff 0.15) showing the fisher z-score for the individual brain structures. Bar colors correspond to labelling scheme given in Figure 4c.
Table 2 SVM’s highest discriminative brain regions (cutoff 0.15) according to the Harvard-Oxford atlas

Note: L, left; R, right.
BMI
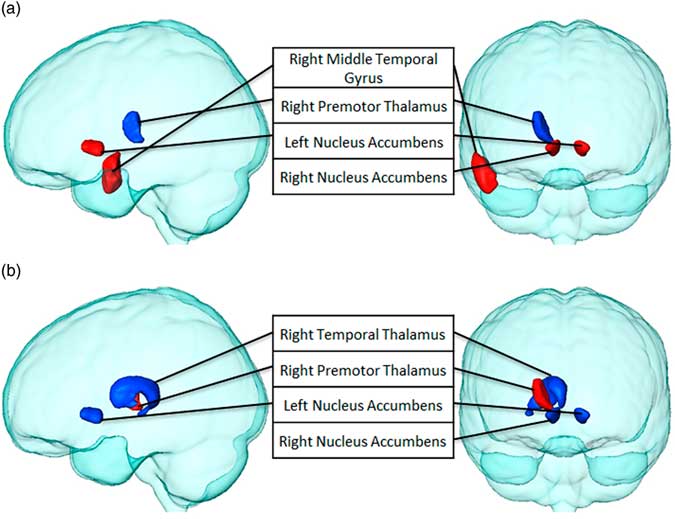
Finally, we examined the relationship between BMI, degree, and path length after eating potato chips when preceded by the visual presentation of both food items through Pearson’s correlation coefficients. BMI was found to correlate significantly with degree and path length of several brain structures (see Table 3 and Figure 7). BMI was positively associated with the path length of the right middle temporal gyrus and bilateral nucleus accumbens, and negatively associated with the right premotor thalamus. Similar findings were obtained for BMI and degree. However, in this case, the right premotor thalamus was found to be positively associated, and the right temporal thalamus and bilateral nucleus accumbens was found to be negatively associated, meaning the higher the BMI, the fewer number of connections in the latter areas.
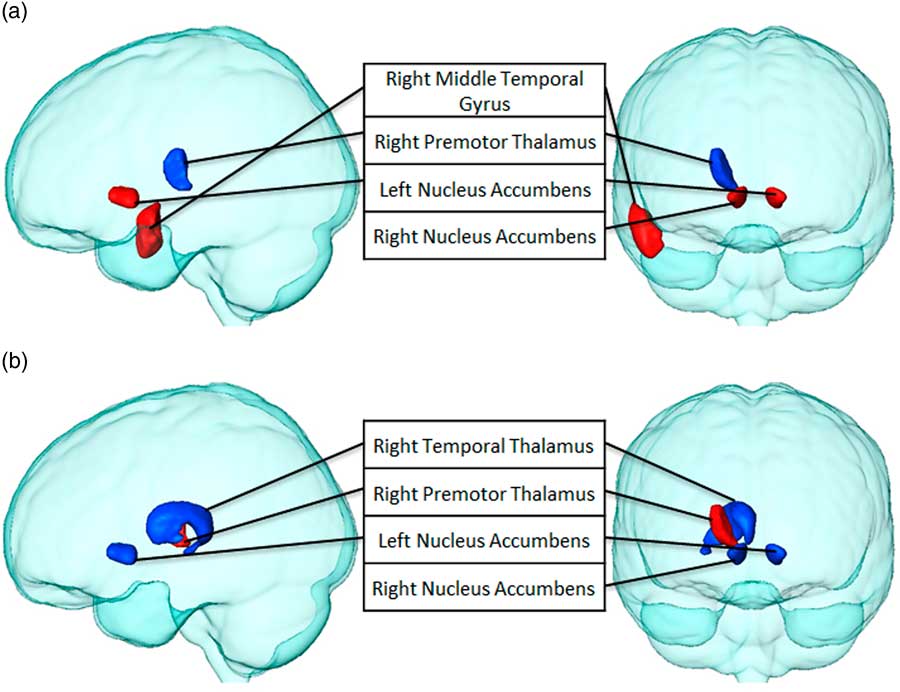
Figure 7 Brain structures that significantly correlate between BMI with (a) path length and (b) degree, after chips consumption (p<0.05). Regions with positive correlations are highlighted in red, while negatively correlated regions are blue.
Table 3 ■

Note: r=Pearson correlation coefficient; *p<0.05.
Discussion
This study shows that the combination of visualization and ingestion of different food types (potato chips and zucchini) leads to specific changes in resting state networks of healthy individuals. Interestingly, graph theoretical analysis in conjunction with SVM was able to discriminate with 100% accuracy between the effect of the 2 types of food consumption after subjects were primed with the visual presentation. Moreover, graph-theoretical analyses illustrate differences at the connectivity and intra-node level of activation between the 2 types of food stimuli. Additionally, BMI should be considered when investigating the connectivity effects of high caloric foods.
The global assessment of the RSNs in terms of the small world index σ was proven insufficient for our study. Previous RS-fMRI studies using clinical populations found σ as an index for effectiveness of information flow in a network, which is valuable for differential diagnosis, ie, Alzheimers, mild cognitive impairment.Reference Sanz-Arigita, Schoonheim, Damoiseaux, Rombouts, Maris and Barkhof 53 , Reference Zhou and Lui 54 However, in normal functioning brain networks, as investigated here, a more detailed analysis is needed that does not compress the complexity of the information flow into a single value.
Using RS-fMRI derived measures and paired NBS, we created the brain’s functional network connectivity. We found global connectivity differences between potato chips and zucchini compared to the pre-RS-fMRI condition. Connectivity of diverse frontal structures, especially the left frontal orbital cortex, mainly decreased for potato chips compared to zucchini. The frontal orbital cortex responds to visual presentations of food stimuli and plays a role in visual, olfactory, and taste representation, as well as in the evaluation of food reward.Reference Zald 55 One previous study found increased frontal orbital cortex activation when viewing low-caloric foods in comparison to high caloric foods.Reference Killgore, Young, Femia, Bogorodzki, Rogowska and Yurgelun-Todd 56 The authors speculated about the possibility that association with reward of low strength (in our case zucchini) may require more extensive integrative processing in the frontal orbital areas. Food with lower reward value may have encouraged less effective responses throughout a lifetime.Reference Nederkoorn, Smulders and Jansen 57 Conversely, the frontal orbital cortex is also involved in representing negative reinforcements, such as aversive taste.Reference Rolls 58 Our healthy participants may have found zucchini unpleasant, experiencing an aversive response to zucchini resulting in stronger frontal orbital connectivity. We specifically found decreased connectivity between the inferior frontal gyrus (frontal cortex) and the middle temporal gyrus (temporal cortex) for potato chips in comparison to the zucchini condition. The first region is related to associative and item recognition. Moreover, the connections with the middle temporal gyrus have been already described. The middle temporal gyrus supports the use of pre-experimental acquired associations during the retrieval efforts of the inferior frontal gyrus.Reference Staresina and Davachi 59 Zucchini might be a weaker stimulus than potato chips, and stronger retrieval efforts might be needed for its identification as a food item. Equally important is the increase of connectivity between temporal structures as well as the decrease of pairwise connectivity in frontal areas for chips in comparison to zucchini. These areas have not been previously associated with food processing; however, they comprise part of Wernicke’s area, which is involved in semantic processing. The potato chips fMRI was the first session to take place; therefore it is possible to speculate that the effects on the semantic processing of the visual categories were stronger during this session due to a novelty response.Reference Bookheimer 60 , Reference Vandenberghe, Price, Wise, Josephs and Frackowiak 61 Furthermore, we found planum temporale activation which could be explained by the scanner’s noise and its novelty effect during the first session.Reference Zatorre, Belin and Penhune 62 , Reference von Saldern and Noppeney 63
Once food type differences after visual presentation were established though paired NBS, we used graph theoretical measures as discriminative features for automatically classifying individuals depending on the food received that day. SVM’s best classification accuracy was achieved with 67 features. Consequently, the current study demonstrates an analysis method capable of distinguishing between the type of food received with an accuracy of 100%. It was shown that the lateral occipital cortex, insula, striatum (basal ganglia), and nucleus accumbens have a high sensitivity for food stimulus discrimination. These highly discriminative regions have been previously described in food-related research. The lateral occipital cortex has been proven to be related to the perception of emotionally salient stimuli like food, which can lead to increased attention.Reference van der Laan, de Ridder, Viergever and Smeets 64 , Reference Killgore and Yurgelun-Todd 65 Consequently, potato chips might be more salient stimuli than zucchini or vice versa, proving the lateral occipital cortex as a critical brain region. The insula, being in our study partly responsible for the modulation of connectivity by different food, is involved in memory retrieval of previous experiences, including imagining the taste of food, craving for food, and the mouth feel of water and fat, and has been described in the context of eating disorders and obesity.Reference van der Laan, de Ridder, Viergever and Smeets 64 , Reference Simmons, Martin and Barsalou 66 – Reference Frank, Reynolds, Shott, Jappe, Yang and Tregellas 68 Among many functions, the ventral striatum has been related with the attribution of a superior metabolic reward value to high energy foods as compared to low energy foods.Reference Piech, Lewis, Parkinson, Owen, Roberts and Downing 69 Furthermore, one study related satiation with attenuated BOLD activity in the nucleus accumbens (ventral striatum).Reference Thomas, Higgs, Dourish, Hansen, Harmer and McCabe 70 In our study, the intake of zucchini might have resulted in lower food craving than potato chips intake due to its low reward value, being the striatum, and more concretely the nucleus accumbens a critical brain region for reward processing. Additionally, most discriminative brain structures were located in the left hemisphere. This effect was also seen for the pairwise connectivity, where most changes were also lateralized to the left. Our research evidenced that after attending food pictures and consuming food, a large network of left-sided brain regions is strongly activated. The involvement of these left brain areas in the explicit processing of food cues is in accordance with previous findings.Reference Killgore, Young, Femia, Bogorodzki, Rogowska and Yurgelun-Todd 56 , Reference Simmons, Martin and Barsalou 66 Furthermore, all of our participants were right-handed. Different studies associated performance of a visual working memory task in right-handed participants with lateralization of brain activity in the left hemisphere.Reference Staresina and Davachi 59 , Reference Siep, Roefs, Roebroeck, Havermans, Bonte and Jansen 71
Another key finding of this study is that when stimulated with the same food pictures followed by potato chips consumption, the degree and path length in certain areas were associated with BMI; particularly interesting is again the nucleus accumbens. A previous study related nucleus accumbens activation to the amount of fat consumed at a buffet.Reference Mehta, Melhorn, Smeraglio, Tyagi, Grabowski and Schwartz 72 Furthermore, the nucleus accumbens contains opioid pathways that stimulate intake of highly palatable and energy-rich foods.Reference Kelley, Baldo, Pratt and Will 73 The structures of these pathways seem to increase their path length, being less globally efficient with increasing BMI. Moreover, part of our participants had a BMI higher than 25 kg/m2, which can be considered slightly overweight. Scientists found that increased reward responsivity to food cues in the nucleus accumbens is associated with subsequent weight gain during the 6 following months,Reference Demos, Heatherton and Kelley 74 and that overweight women have functional alterations within the nucleus accumbens.Reference Coveleskie, Gupta, Kilpatrick, Mayer, Ashe-McNalley and Stains 75 On the other hand, the number of connections of the accumbens after potato chips consumption decreased with increasing BMI, again indicating less global interconnectivity. One study showed similar results, where dopamine release was reduced in the accumbens after calorie intake in obese subjects in contrast to healthy individuals.Reference Wang, Tomasi, Convit, Logan, Wong and Shumay 76
Several limitations should be considered when interpreting the present findings. Unfortunately in this study there was no RS-fMRI measurement between the visual stimulation and the food consumption. Therefore individual effects of both components on the resting state networks could not be differentiated. Furthermore, an important covariate such as gender was not considered in this study due to limited number of participants. Different studies stress the importance of sex differences in the response to satiation, suggesting that the regulation of food intake by the brain may vary depending on gender.Reference Siep, Roefs, Roebroeck, Havermans, Bonte and Jansen 71 , Reference Smeets, de Graaf, Stafleu, van Osch, Nievelstein and van der Grond 77 , Reference Frank, Laharnar, Kullmann, Veit, Canova and Hegner 78 A higher number of participants is recommended for future studies to avoid limited statistical power.Reference Button, Ioannidis, Mokrysz, Nosek, Flint and Robinson 79 Furthermore, different studies identified the hypothalamus as the structure responsible for modulating food reward.Reference Kullmann, Heni, Linder, Zipfel, Haring and Veit 80 – Reference Cornier, Von Kaenel, Bessesen and Tregellas 82 Our atlas of choice, the Harvard-Oxford atlas, did not include the hypothalamus; therefore, this area was not considered during our analysis. The external validity of our results should also be taken into account, as our results are limited to the 2 food items of our choice. Furthermore, Western diets are different from diets of other regions, and therefore our food choice might not be translatable to other populations.Reference Schulte, Avena and Gearhardt 10
Conclusions
Overall, this study determined that there are different changes in RSNs after visualizing and ingesting potato chips (high caloric) vs. zucchini (low caloric) food in healthy individuals. We proposed our method based on graph theoretical analysis in conjunction with SVM to distinguish between different types of food stimuli. Our results aim to understand how nutritional components and diets can specifically modulate brain functionality and brain activity. We found that BMI positively correlated with activity in the nucleus accumbens when consuming snack foods. Unraveling human eating behavior and its neuronal mechanisms is of high importance to understand food-related disorders and ultimately to develop targeted obesity prevention.
Disclosures
None of the authors had any conflicts of interest or financial ties related to this work.