Introduction
Low-field magnetic stimulation (LFMS) is a noninvasive neuromodulation technique. LFMS may stimulate the brain by emitting electromagnetic fields (similar to those produced by echo planar magnetic resonance imaging [MRI]) and could induce rapid mood elevation in bipolar depressive patients.Reference Rohan, Parow, Stoll and Demopulos1, Reference Rohan, Yamamoto and Ravichandran2 The antidepressant-like effects of LFMS were also demonstrated by reducing immobility in the forced-swim test of the depressive animal model.Reference Carlezon, Rohan and Mague3 Although previous studies demonstrated rapid improvement in mood after a single LFMS intervention, the durability of these effects and the optimized stimulation parameters also need to be determined by further study.Reference Shafi, Stern and Pascual-Leone4
Magnetic stimulation is hypothesized to have antidepressant effects by resetting cortical oscillatory activity and reestablishing intrinsic cerebral rhythms.Reference Leuchter, Cook, Jin and Phillips5 Based on the rationale and supportive findings of low-field synchronized transcranial magnetic stimulation in patients with major depressive disorder (MDD),Reference Leuchter, Cook and Feifel6 deep-brain magnetic stimulation (DMS) has been developed with diverse rhythmic stimulations and was demonstrated to be effective for neuropsychiatric disorders, including depression.Reference Kammer and Spitzer7 It has been reported that DMS as monotherapy or augmentation may improve the cognitive impairments in patients with Alzheimer’s disease.Reference Peng, Zhu, Yuan and Zhang8 On the molecular and cellular levels, DMS has been shown to greatly facilitate adult hippocampal neurogenesis and maturation, and to alleviate depression and stress-related responses in animal models.Reference Zhang, Mao and Chen9 LFMS/DMS does not need to be orientated to specific brain regions prior to treatment due to its uniform, unidirectional, and pulsed magnetic field, which is hypothesized to have diffusive effects on neuronal regions.Reference Carlezon, Rohan and Mague3
DMS seems to be a promising alternative treatment for MDD. However, there are still many uncertainties that require further investigation. For example, the role of the dorsal lateral prefrontal cortices (DLPFCs) in depression is asymmetric, with relative hypoactivity in the left DLPFC, along with relative hyperactivity in the right.Reference Garcia-Toro, Montes and Talavera10 High-frequency stimulation to the left DLPFC and low-frequency stimulation to the right DLPFC have both been proved effective in the treatment of MDD.Reference Burt, Lisanby and Sackeim11, Reference Gershon, Dannon and Grunhaus12 A wide range of stimulation frequencies has been shown to modulate brain function, and the alpha band has been specifically focused.Reference Leuchter, Cook, Jin and Phillips5, Reference Thut, Veniero, Romei, Miniussi, Schyns and Gross13, Reference Veniero, Brignani, Thut and Miniussi14 Alpha band power is involved in modulating connections among the dorsal anterior cingulate cortex, anterior insula, anterior prefrontal cortex, and thalamus.Reference Sadaghiani, Scheeringa, Lehongre, Morillon, Giraud and Kleinschmidt15 Our previous pilot study has proven that rhythmic alpha stimulation (RAS, 8~12 Hz) of DMS improved the depressive, anxiety, and sleep symptoms in treatment-resistant MDD patients, and as well increased the serum level of brain-derived neurotrophic factor (BDNF).Reference Xiao, Feng, Feng, Hu, Zhang and Wang16 Two recent randomized sham-controlled studies investigated the antidepressant efficacy of low-field synchronized alpha frequency stimulation for MDD and found that alpha stimulation greatly improved depression compared to sham.Reference Jin and Phillips17, Reference Leuchter, Cook and Feifel6 In Rohan’s two studies of LFMS in the treatment of bipolar or unipolar depression,Reference Rohan, Parow, Stoll and Demopulos1, Reference Rohan, Yamamoto and Ravichandran2 the 0.5-Hz paradigm, which is regarded as low-frequency delta stimulation, has been proved significantly effective compared to sham. However, there is still a lack of randomized and head-to-head studies that compare the antidepressant efficacy of LFMS by different rhythms.
Given the heterogeneity of the therapeutic effects in patients with MDD, it will be important to identify clinically relevant moderators and mediators of treatment response. Most repetitive transcranial magnetic stimulation (rTMS) studies focused on BDNF as a potential moderator or mediator variable. BDNF is a critical prosurvival factor for the developing and adult central nervous system, acting through modulation of activity-induced neuronal plasticity,Reference Park and Poo18 which has been repeatedly implicated in the etiology of depression. Moreover, the established antidepressant properties of BDNF led to elaboration of the neurotrophic hypothesis of depression.Reference Groves19 Finally, BDNF expression and signaling have been related to the efficacy of antidepressant treatments.Reference Adachi, Barrot, Autry, Theobald and Monteggia20, Reference Duman and Monteggia21
Based on the above, we aimed to evaluate: (1) the efficacy of DMS with two different rhythms in MDD, (2) the effect of DMS on BDNF, and (3) the relationship between baseline BDNF and BDNF change with antidepressant effects. Since serum BDNF levels in depressed patients are reduced compared to healthy controls and are normalized after antidepressant treatment,Reference Brunoni, Lopes and Fregni22, Reference Sen, Duman and Sanacora23 we hypothesized that the efficacy of DMS would be moderated by low baseline BDNF and mediated by treatment-related increases in BDNF.
Methods
Design
This was a randomized, double-blinded, active-controlled trial comparing rhythmic alpha stimulation (RAS) and rhythmic delta stimulation (RDS) that was conducted between May of 2010 and January of 2011 at the Beijing Anding Hospital. The study protocol was approved by the Human Research and Ethics Committee of Beijing Anding Hospital and was registered (clinicaltrials.gov, no. NCT02184221). All participants provided written informed consent.
Subjects
The inclusion criteria were as follows: (1) males and females; (2) aged 18–60 years; (3) right-handed; 4) out- or inpatient; (5) single or recurrent moderate or severe DSM–IV diagnosis of MDD; (6) 17-item Hamilton Rating Scale for Depression (HAMD–17)Reference Hamilton24, Reference Xie and Shen25 total score ≥18; and (7) medication-free for ≥5 days before the trial. Patients who took psychotropic medications entered a washout phase that lasted for at least 7 days, during which psychotropic medications were tapered and stopped.
The exclusion criteria were as follows: (1) current diagnosis of DSM–IV axis I primary psychiatric illness other than MDD; (2) clinically significant medical diseases, including any cardiovascular, hepatic, renal, respiratory, hematologic, endocrinological, or neurologic diseases; (3) organic mental disease; (4) clinically significant laboratory abnormality that was not stabilized or that was anticipated to require treatment during the study; (5) pregnant or lactating women, as well as females of childbearing potential without appropriate birth control measures; (6) treatment with electroconvulsive therapy within 12 months prior to screening; (7) significant risk of suicidal or self-harm behaviors; (8) cardiac pacemakers or implanted medical objects (other than dental work) within or near the head that could not be safely removed; and (9) treatment with fluoxetine during the current episode or had long-acting psychotropic medication/injection within the previous 6 months.
Interventions
Eligible patients were blindly randomized to 6 weeks of either RAS or RDS using a 1:1 ratio based on a computer-generated random number table. Treatment sessions were administered by two trained nurses for 20 minutes at a time, with 5 sessions per week, totaling 30 sessions over 6 weeks.
Only non-benzodiazepine short-acting hypnotics—including zolpidem, zopiclone, and zaleplon—were allowed for insomnia during the study period, and for a maximum of <7 days consecutively. Other medications for physical conditions with no effects on the central nervous system were allowed.
DMS device
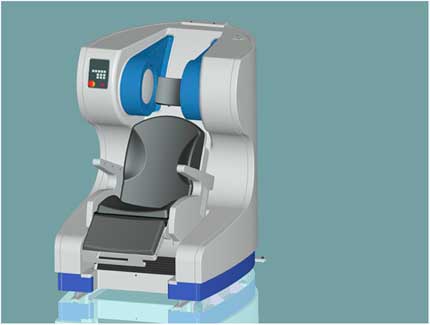
The DMS device (model ADS-L-1, Beijing Aldans Biotechnology, Beijing, China; certified by the Beijing medical device quality supervision and inspection center at the State Food and Drug Administration inspection center and met the GB9706.1 standard; for investigational use only), included a pair of coils with a diameter of 360 mm and a distance of 300 mm between coils (Figure 1). The magnetic field generator can be discharged through two coils to produce a time-varying pulsed magnetic field. A linear gradient magnetic field is generated when the reverse current flows through the coils; conversely, a uniform magnetic field is generated when current flows in the same direction. The two coils was symmetrically positioned on both sides of the patient’s head to provide a global magnetic field distributed broadly across the whole brain region. The waveform was a 1000-Hz train of alternating trapezoidal gradient pulses, and the maximum magnetic field intensity acting on the brain regions was 20 Gs. The time-varying rate was 150 Gs/ms. Notably, the strength of DMS fields are 100 to 1,000 times weaker than regular rTMS fields, penetrate throughout the whole brain, and are delivered at 1 kHz.

Figure 1 Deep-brain magnetic stimulation device.
The delta stimulating paradigm (Program 1) is shown in Figure 2A. In this paradigm, the magnetic flux density was a linear gradient, divided into 10 2-minute outputs (Figure 2A-A). Each 2-minute output consisted of a 500 ms long RUN followed by a 1500 ms long REST and repeats (Figure 2A-B). Each RUN consisted of 500 alternating trapezoids, each lasting 1000 μsec (Figure 2A-C). The alpha-stimulating paradigm (Program 2) is shown in Figure 2B. Different from Program 1, the magnetic flux density of Program 2 was a uniform alternating linear gradient. In this program, each 20-minute treatment consisted of 10 2-minute long microcycles (Figure 2B-A). Each microcycle started with a 2-second long RUN, followed by an 8-second long REST and repeats (Figure 2B-B). Each RUN generated 20 1-ms alternating trapezoid pulses at 8~12 Hz (Figure 2B-C). Figure 2B-D shows the microstructure of the 20-ms output pulses.
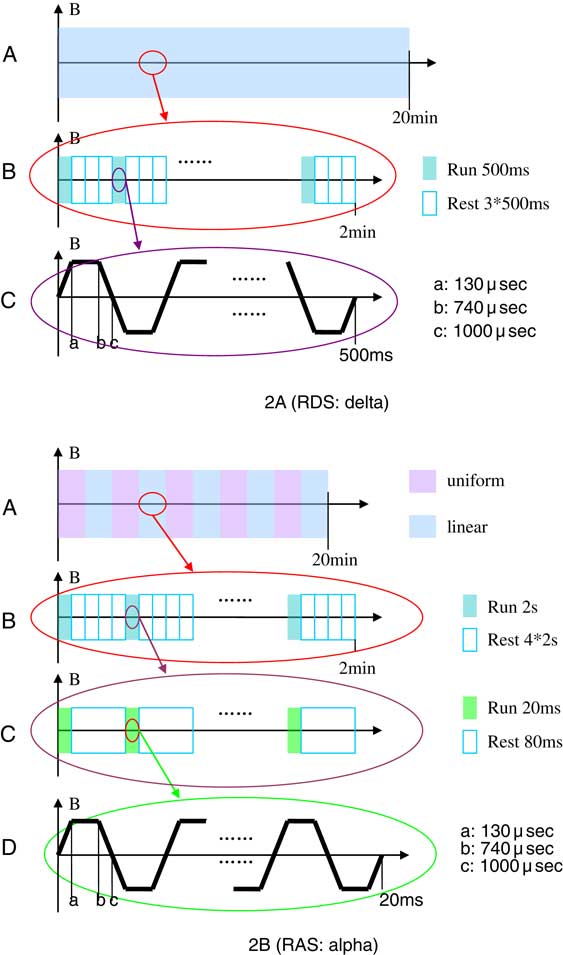
Figure 2 Schematic illustration of the DMS paradigm.
Assessments
Efficacy outcomes were assessed with the HAMD–17, the Hamilton Rating Scale for Anxiety (HAMA),Reference Hamilton26 and the Clinical Global Impression–Severity (CGI–S)Reference Guy27 at baseline and at weeks 1, 2, 3, 4, and 6. Three certified raters were blinded to study assignment. Safety outcomes in this study were assessed by adverse event reporting, clinical laboratory measurements, and physical examination. Treatment-emergent adverse events, vital signs, and body weight were monitored at each visit. Laboratory tests—including clinical chemistry, urinalysis and hematology panels, electrocardiogram (EKG), and electroencephalogram (EEG)—were recorded at baseline and at the 6-week endpoint or discontinuation visit.
BDNF measurement
At baseline and weeks 2, 4, and 6, venous blood (5 ml) was collected in anticoagulant-free tubes between 8:00 and 10:00 AM at fasting state of at least 10 hours, and were allowed to clot at room temperature for 60 min followed by centrifugation at 2000 rpm for 10 min at 4°C. Serum samples were stored at –80°C for tests. Serum BDNF was measured using an enzyme-linked immunosorbent assay (ELISA) kit according to the manufacturer’s instructions. Absorbencies were measured by a Varioskan Flash Multimode Microplate Reader (Thermo Labsystems, Helsinki, Finland). All assays were conducted at the same time.
Outcome measures
The primary outcome was treatment response, defined as a reduction in HAMD–17 score of ≥50%Reference Trivedi, Rush and Wisniewski28 from baseline to week 6. Remission was defined as a HAMD–17 total score ≤7 at endpoint. Additional efficacy outcomes included change in HAMD–17, HAMA, and CGI–S scores. Further outcomes included BDNF levels and safety, as well as tolerability outcomes.
Statistical analysis
The analyses were conducted in the modified intent-to-treat sample (patients with a baseline and at least one follow-up assessment). The Shapiro–Wilk test was used to check the normality of data. The data were analyzed using SPSS (v. 20.0, SPSS Inc., Chicago, Illinois, USA). Demographic and clinical characteristics at baseline were compared between the two groups using an independent sample t test, the Mann–Whitney U test, and the chi-square test, as appropriate.
The change from baseline over the entire 6-week study period within and across groups was analyzed for all outcomes by repeated measures analysis of variance (ANOVA). When Mauchly’s sphericity test was significant, we adjusted the degrees of freedom and F ratios using the Greenhouse–Geisser adjustment.Reference Greenhouse and Geisser29 The change from baseline was modeled as an effect of treatment group (treatment), treatment progression (visit), and the treatment × visit interaction as fixed effects. In addition, last observation carried forward (LOCF) ANOVA analyses were conducted across groups for change from baseline to each individual study visit. Since the two treatment groups differed significantly on illness duration, the baseline-to-endpoint analyses across groups were also repeated covarying for illness duration using logistic regression analyses for response and remission.
Furthermore, pooling results from both treatment conditions together, the t test was used to compare the difference between responders and nonresponders regarding baseline BDNF and mean baseline-to-endpoint change of BDNF. Spearman’s correlation coefficient was calculated between the change of HAMD–17 total score and BDNF level from baseline to week 6. Finally, in order to examine significant correlates of response and remission across both treatment conditions, multivariate logistic regression was carried out with response and remission as the dependent variables separately, and with treatment, age, sex, number of depressive episodes, illness duration, duration of the current episode, baseline HAMD–17 and HAMA scores, baseline BDNF, and change in change as independent variables.
All statistical tests were two-sided, with α=0.05. Since a type II error is likely in small samples with insufficient power to differentiate effects between two active treatments, and to provide estimates of the magnitude of observed effects in this pilot study, we also calculated effect sizes with their 95% confidence intervals (CI 95%) for all group contrasts, even if between-group results were not statistically significant. Specifically, for categorical outcomes, we calculated numbers-needed-to-treat (NNT) by dividing 1 by the risk difference. In general, NNTs of 10 or less are considered clinically relevant.Reference Citrome30 For continuous outcomes, we calculated Cohen’s d by dividing the difference in means by the pooled standard deviation. According to Cohen,Reference Cohen31 0.2 represents a small effect size, 0.5 a medium effect size, and 0.8 a large effect size.
Results
A total of 26 patients were screened, 22 of whom met the study criteria and were randomized to RAS (n=11) or RDS (n=11). Since all patients had at least one follow-up visit, all 22 randomized patients were included in the analyses. 15 patients had failed to respond to at least two antidepressant treatments. Patients were treated with sertraline, citalopram, escitalopram, paloxetine, venlafaxine, or mirtazapine before entering the study.
No significant differences were found between groups regarding demographic and clinical characteristics, including baseline HAMD–17, HAMA, and CGI–S scores; and BDNF level at baseline; except for a significantly longer duration of illness in the RAS vs. RDS group (p=0.040) (Table 1).
Table 1 Baseline demographic and clinical characteristics

a=Fisher’s exact test; b=Mann–Whitney U test;
BDNF= brain-derived neurotrophic factor; CGI–S=Clinical Global Impression–Severity; HAMA= Hamilton Rating Scale for Anxiety; HAMD–17=17-item Hamilton Rating Scale for Depression; RAS=rhythmic alpha stimulation; RDS=rhythmic delta stimulation; SD=standard deviation.
Efficacy outcomes
In the RAS group, 54.5% patients (6/11) responded at endpoint compared to only 2 in the RDS group (18.2%), but the difference did not reach statistical significance (adjusted p=0.108, NNT=3). There was also no significant difference in remission between the RAS (4/11, 36.4%) and RDS groups (1/11, 9.1%; adjusted p=0.147, NNT=4) (Table 2).
Table 2 Primary outcome measures of clinical efficacy from baseline to endpoint

CI 95%=95% confidence interval; NNT=number needed to treat; RAS=rhythmic alpha stimulation; RDS=rhythmic delta stimulation.
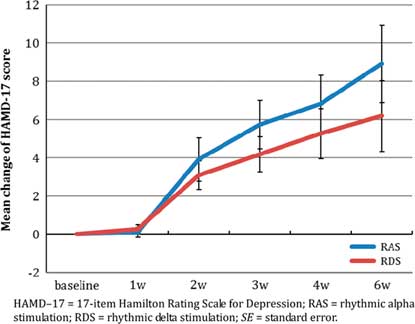
The improvement in HAMD–17 score was significant from baseline over the entire 6-week study period (Greenhouse–Geisser adjusted F(1.5, 704.4)=24.94, p<0.001. No significant difference was found between the RAS and RDS groups overall (F(1, 182.01)=1.45, p=0.24), and without significant time-by-treatment interaction (Greenhouse–Geisser adjusted F(1.5, 21.93)=0.78, p=0.44). The mean reduction in HAMD–17 score in the RAS group was numerically greater than that in the RDS group (8.9±7.4 vs. 6.2±6.2, Cohen’s d =0.40).
The improvement in HAMA score was also significant from baseline over the entire 6-week study period (Greenhouse–Geisser adjusted F(2.0, 346.24)=13.67, p<0.001). No significant difference was found between the RAS and RDS groups overall (F(1, 112.76)=1.06, p=0.32), and without significant time-by-treatment interaction (Greenhouse–Geisser adjusted F((2.0, 17.16)=0.68, p=0.52). However, different from the HAMD–17 results, RDS was associated with a numerically better improvement in HAMA change than RAS (8.2±8.0 vs. 5.3±5.8, Cohen’s d=0.42).
The improvement in CGI–S score was also significant from baseline over the entire 6-week study period (Greenhouse–Geisser adjusted F(2.7, 6.57)=10.65, p<0.001). Again, no significant difference was found between RAS and RDS overall (F(1, 0.03)=0.01, p=0.92), and without significant time-by-treatment interaction (Greenhouse–Geisser adjusted F((2.7, 1.32)=2.14, p=0.11). RDS had numerically greater improvement on the CGI–S than RAS (1.6±1.2 vs. 0.6±1.3, Cohen’s d=0.75).
The HAMD–17, HAMD, and CGI–S score changes at each postbaseline visit are shown in Table 3, and the mean changes in HAMD–17 and HAMA scores over the 6-week period are shown in Figures 3a and 3b.

Figure 3a Mean change of HAMD–17 total score over 6 weeks (mean±SE).

Figure 3b Mean change of HAMA total score over 6 weeks (mean ± SE).
Table 3 Change in HAMD–17, HAMA, and CGI–S scores at each postbaseline visit

* Positive Cohen’s d indicates superiority of RAS over RDS.
CGI–S=Clinical Global Impression–Severity; CI 95%=95% confidence interval; HAMA=Hamilton Rating Scale for Anxiety; HAMD–17=17-item Hamilton Rating Scale for Depression; RAS=rhythmic alpha stimulation; RDS=rhythmic delta stimulation; SD=standard deviation.
BDNF outcomes
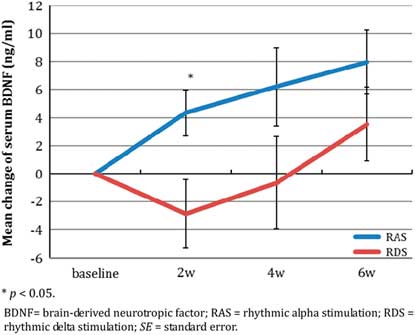
The change in BDNF levels at each postbaseline visit over the 6-week period are shown in Table 4 and Figure 3c.
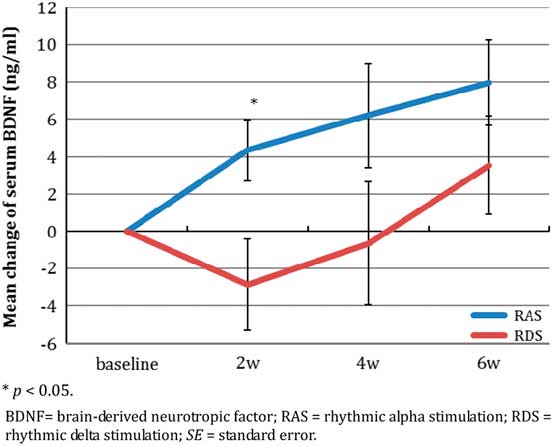
Figure 3c Mean change of BDNF level over 6 weeks (mean±SE).
Table 4 Change in BDNF levels from baseline to endpoint (ng/ml)

* Positive Cohen’s d indicates superiority of RAS over RDS.
BDNF= brain-derived neurotrophic factor; CI 95%=95% confidence interval; RAS=rhythmic alpha stimulation; RDS=rhythmic delta stimulation; SD=standard deviation.
BDNF levels increased significantly after treatment with RAS, while it fluctuated with RDS (Figure 3c). The increase in BDNF was significant from baseline over the entire 6-week study period (F(3, 99.01)=4.09, p=0.013), but without significant time-by-treatment interaction (F(3, 40.98)=1.69, p=0.184) and without a significant group difference (F(1, 0.90)=0.003, p=0.957). The mean BDNF change was consistently numerically greater in the RAS than in the RDS group at each postbaseline study timepoint, including endpoint (8.0±6.1 vs. 3.5±7.5), but the difference between groups was only significant at week 2 (p=0.034), and the effect sizes favoring RAS were moderate (Cohen’s d=0.66) to large (Cohen’s d=1.23).
Factors associated with treatment response
Baseline BDNF in the 8 responders was significantly lower than in the 14 nonresponders (24.8±9.0 ng/ml vs. 31.1±7.3 ng/ml, df=20, t=1.822, p=0.083, Cohen’s d=–0.79). The mean BDNF increase was significantly higher in responders than in nonresponders (8.9±7.8 ng/ml vs. 1.8±3.5 ng/ml, df =13, t=2.307, p=0.044, Cohen’s d=1.17). However, Spearman’s correlation analysis showed that the BDNF change was not significantly correlated with the change in HAMD–17 score (r=0.32, p=0.244): RAS (r=0.18, p=0.699) and RDS (r=0.38, p=0.349). Logistic regression showed that the BDNF change at week 2 was the most important variable in terms of predicting a response (p=0.016).
Safety outcomes
DMS was well tolerated, and no seizures or headaches were reported throughout the study. Only one patient in the RAS group reported mild and transient fatigue during treatment (at week 1). No other spontaneously reported adverse effects occurred. Further, no abnormalities were found regarding vital signs, or laboratory, EEG, and EKG values.
Discussion
To the best of our knowledge, this is the first randomized controlled trial to investigate the effect of LFMS with two different rhythmic stimulations in the treatment of MDD. We found that both alpha and delta stimulation significantly reduced depressive and anxiety symptoms. Although no statistically significant difference in efficacy was observed between the two groups, RAS tended to induce greater improvement in HAMD–17 scores than RDS (ES=0.40), while RDS resulted in a potentially greater improvement in HAMA scores than RAS (ES=0.42). The differences of antidepressant treatment response (NNT=3) and remission of depression (NNT=4), although not statistically significant, showed large and clinically relevant effect size advantages for RAS.
BDNF is expressed throughout the central nervous system and can cross the blood/brain barrier.Reference Pan, Banks, Fasold, Bluth and Kastin32 Peripheral serum BDNF levels are highly correlated with cerebral levels in animal models.Reference Sartorius, Hellweg and Litzke33 Repetitive TMS enhances the expression of BDNF in both cortex and lymphocytes.Reference Wang, Crupi and Liu34 Consistent with this advantage for depression-related outcomes with RAS, BDNF increased with RAS but decreased slightly with RDS at week 2. Although group differences were only significant at week 2, favoring RAS, the effect sizes were moderate to large for greater BDNF increases in the RAS group (ES=0.66–1.23). Some studies found that rTMS may increase serum BDNF,Reference Yukimasa, Yoshimura and Tamagawa35, Reference Zanardini, Gazzoli and Ventriglia36 but others failed to replicate this finding.Reference Lang and Schüler37, Reference Gedge, Beaudoin, Lazowski, du Toit, Jokic and Milev38 However, some studies suggested that high-frequency rTMS increases serum BDNF levels, whereas low-frequency stimulation reduces BDNF levels.Reference Wang, Crupi and Liu34, Reference Angelucci, Oliviero and Pilato39 Our results confirm prior findings that low-field magnetic stimulation could promote neural growth, with frequency-dependent characteristics.Reference Rusovan, Kanje and Mild40
The baseline level and change in serum BDNF levels after treatment were associated with the antidepressant efficacy of DMS, which supports the notion that BDNF may have potential use as a predictor of antidepressant efficacy.Reference Sen, Duman and Sanacora23 Our findings indicate that DMS is more effective for depressed patients with comparatively lower BDNF levels, suggesting that low serum BDNF may be a moderator and predictive biomarker for the efficacy of DMS. The change in BDNF in responders was significantly higher than in nonresponders, and the increased BDNF at week 2 strongly predicated the ultimate response at week 6. This relationship suggests that a BDNF increase is a relevant mediator of DMS activity that may be mechanistically and causally related to DMS efficacy, a finding that needs to be investigated further.
Studies have shown that LFMS significantly affects cerebral metabolism and neuronal activityReference Volkow, Tomasi and Wang41 as well as having antidepressant-like effects.Reference Rohan, Parow, Stoll and Demopulos1, Reference Carlezon, Rohan and Mague3, Reference Rokni-Yazdi, Sotoudeh, Akhondzadeh, Sotoudeh, Asadi and Shakiba42 Our results support the notion that low-intensity magnetic fields constitute an effective treatment for MDD, whether or not the stimulation is delivered at high or low frequency. While the antidepressant effects of RAS may be due to an elevation of BDNF levels, the mechanism of RDS remains incompletely understood. MDD involves dysfunction in a number of cortical regions, such as the dorsolateral prefrontal cortex and anterior cingulate cortex, as well as deep gray matter structures, such as the nuclei of the thalamus and hypothalamus.Reference Leuchter, Cook, Jin and Phillips5, Reference Drevets, Price and Furey43 Furthermore, MDD is increasingly understood as a disorder of connectivity in the brain networks linking these regions.Reference Leuchter, Cook, Hunter, Cai and Horvath44 It is assumed that DMS may alter neural activity and induce network effects in the brain.Reference Zhang, Mao and Chen9 The process of repetitive magnetic stimulation is hypothesized to reset brain oscillatory activity and connectivity, and to increase neuroplasticity, which together lead to antidepressant effects.Reference Leuchter, Cook, Jin and Phillips5 Our results add to the growing body of literature suggesting that LFMS is effective in the treatment of MDD. Further research should investigate different parameters and durations of stimulation to determine the optimal DMS strategy. Furthermore, future studies with significantly larger samples should investigate whether different patient and illness variables predict greater treatment improvement with RAS or RDS.
There are several limitations of our study. First, the sample size was relatively small, which limits the power for group comparisons, rendering most results of this pilot study exploratory. However, we calculated effect sizes showing that, although not reaching statistical significance, most of the treatment group differences for antidepressant activity and increase in BDNF favored RAS versus RDS with effect sizes that were clinically meaningful. Second, we only compared two active treatments, and there was a lack of a sham control. However, at least, raters were blind to treatment assignment. Third, despite randomization, illness duration was significantly longer in the RAS versus the RDS group, but we adjusted all group comparisons for this variable. Fourth, peripherally measured BDNF levels are an imperfect assessment of centrally active BDNF, and previous antidepressants and withdrawal could affect baseline BDNF. Finally, this was a 6-week study, indicating that long-term effects need to be examined in future studies. Nevertheless, to our knowledge, this is the first randomized controlled trial of DMS comparing two stimulating paradigms providing preliminary evidence for the utility of DMS in treating MDD and providing relevant effect size information for the design of adequately powered studies.
Conclusion
We found that rhythmic DMS is a noninvasive and effective treatment for MDD without significant risk and a low rate of adverse events. Therefore, DMS may constitute a valuable neuromodulation treatment option for MDD. The antidepressant efficacy of rhythmic alpha frequency appeared to be larger than that of delta stimulation and was correlated with BDNF elevation. Furthermore, a low baseline serum BDNF level may be a predictive biomarker for better efficacy of rhythmic magnetic stimulation, and the change in BDNF at week 2 may mediate efficacy. The results from our study need to be replicated in larger samples, ideally including a sham control group, and the long-term effects of rhythmic magnetic stimulation need to be assessed further.
Disclosures
Le Xiao has the following disclosure: Beijing Municipal Administration of Hospitals Incubating Program grant, code no. PX2017048.
Christoph Correll reports personal fees from AbbVie, personal fees from Acadia, personal fees from Actavis, personal fees from Alkermes, grants from Bristol-Myers Squibb, grants and personal fees from Otsuka, grants and personal fees from Lundbeck, grants and personal fees from Takeda, personal fees from Eli Lilly, personal fees from Pfizer, personal fees from ProPhase, personal fees from Roche, personal fees from Sunovion, and personal fees from MedAvante, outside the submitted work.
Lei Feng, Chang-Qing Hu, Rena Li, Yuan Feng, and Yu-Tao Xiang have nothing to disclose.
Gang Wan Wang reports grants from the Beijing Municipal Administration of Hospitals Clinical Medicine Development of Special Funding Support (no. ZYLX201403), grants from the Beijing Municipal Administration of Hospitals Clinical Medicine Development of Special Funding Support (no. ZYLX201607), grants from the National Key Technology Research and Development Program of the Ministry of Science and Technology of China (no. 2015BAI13B03), grants from the Beijing Municipal Administration of Hospitals’ Ascent Plan (no. DFL20151801), outside the submitted work.