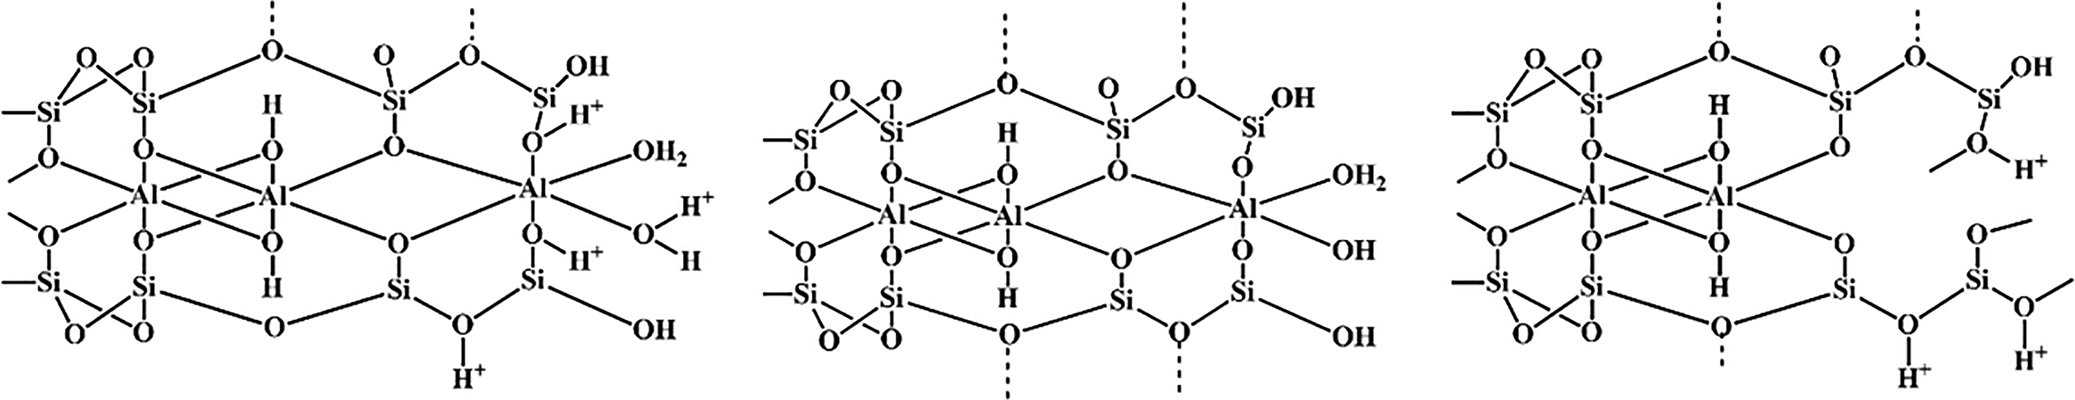
Colloidal inorganic particles with a size of <2 μm are generally classified as clays regardless of their composition and crystal structure (Rautureau et al., Reference Rautureau, Gomes, Liewig and Katouzian-Safadi2017; Stawinski, Reference Stawinski2017; Guo et al., Reference Guo, Zhang, Li, Peng, Xiong and Wang2020). Bentonite is a clay with multiple applications in the oil, gas, petrochemical, food, pharmaceutical, building and agriculture industries (Mannu et al., Reference Mannu, Vlahopoulou, Sireus, Petretto, Mulas and Garroni2018; Abuchenari et al., Reference Abuchenari, Hardani, Abazari, Naghdi, Keleshteri, Jamavari and Chahardehi2020; Javed et al., Reference Javed, Khushnood, Memon, Jalal and Zafar2020; Rouhani & Farhadi, Reference Rouhani and Farhadi2020; Qureshi et al., Reference Qureshi, Behera, Mohanty, Mahapatra, Verma and Sukyai2021; Shakiba et al., Reference Shakiba, Kakoei, Jafari, Rezvani Ghomi, Kalaee and Zarei2021). The main mineral constituent of bentonite is montmorillonite, a member of the smectite group (Chen et al., Reference Chen, Sun, Cui, Ye and Liu2019). Montmorillonite is a layer silicate consisting of an octahedral sheet with aluminium as a principal cation placed between two tetrahedral sheets with silicon as the main cation (Fig. 1) (Schoonheydt et al., Reference Schoonheydt, Johnston, Bergaya, Bergaya and Lagaly2018; Fayoyiwa, Reference Fayoyiwa2020). Cations such as Fe3+ and Mg2+ may replace Al3+ in the octahedral sheet and Al3+ may replace Si4+ in the tetrahedral sheets (Prandel et al., Reference Prandel, Dias, da Costa Saab, Brinatti, Giarola and Pires2017; Vaculíková et al., Reference Vaculíková, Plevová and Ritz2019). Because of these substitutions, montmorillonite bears a negative layer charge. Cations such as Na, Ca, Mg and K enter the interlayer space to neutralize the negative charge. These cations adsorb water between the layers and are readily exchanged, contributing to the cation-exchange capacity (CEC) of the clay (Pérez-Cabrera et al., Reference Pérez-Cabrera, Diaz-de-León, Antúnez-García, Galván, Alonso-Núñez and Fuentes-Moyado2019; Leporatti et al., Reference Leporatti, Cascione, De Matteis and Rinaldi2020).
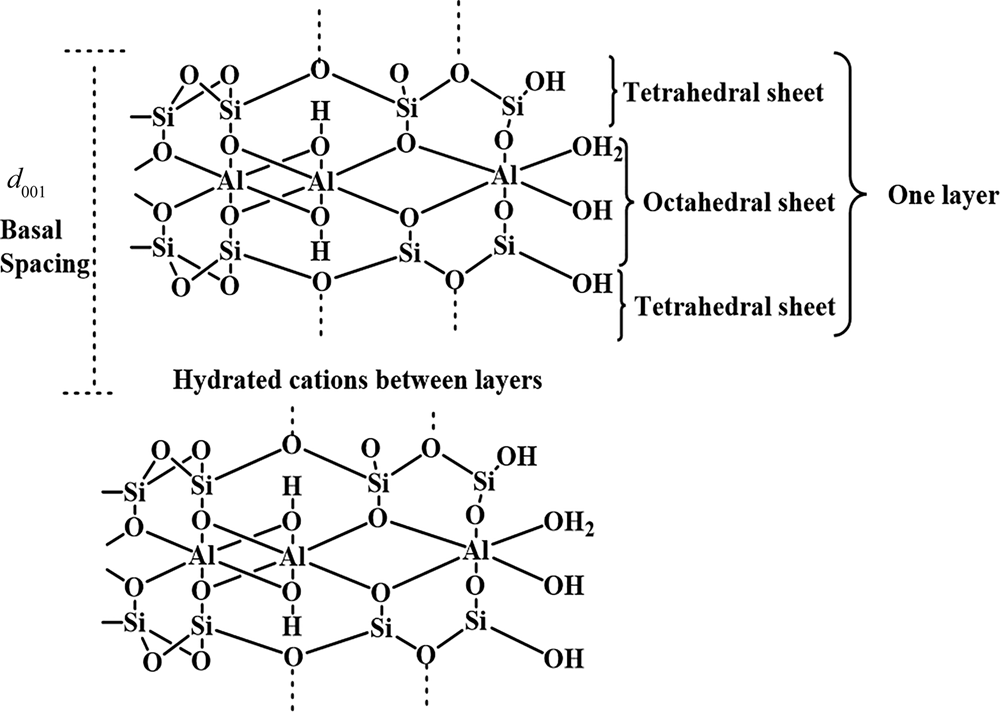
Fig. 1. Crystal structure of montmorillonite.
Montmorillonite is an efficient adsorbent of heavy metals and is easily activated by inorganic acids such as sulfuric acid (H2SO4) and hydrochloric acid (HCl) (Balci, Reference Balci2016; Abdellaoui et al., Reference Abdellaoui, Olguín, Abatal, Ali, Méndez and Santiago2019; Hao et al., Reference Hao, Wei, Wei, Mohamed, Yu and Xie2019; Qin et al., Reference Qin, Yuan, Xiong, Tan and Wang2020). During activation, H+ ions substitute for exchangeable cations, and Al3+ and other octahedral and tetrahedral cations of montmorillonite are released, whereas SiO4 units remain intact (Al-Essa, Reference Al-Essa2018; Sims, Reference Sims2019; Elmorsi et al., Reference Elmorsi, Mostafa and Abou-El-Sherbini2021).
Two major types of bentonites have been reported in the literature. In the sodium-rich bentonites, montmorillonite contains exchangeable Na and adsorbs water readily. Thus, it is stable in dilute suspensions, forming gels (Uddin, Reference Uddin and Zoveidavianpoor2018; Hayakawa et al., Reference Hayakawa, Oya, Minase, Fujita, Teepakakorn and Ogawa2019; Kumar & Lingfa, Reference Kumar and Lingfa2020). The calcium-rich bentonites (where calcium is the major cation of montmorillonite) absorb less water and thus swell less than the Na-rich bentonites (Mahmoud et al., Reference Mahmoud, Nasr-El-Din, Vryzas and Kelessidis2018; Uddin, Reference Uddin and Zoveidavianpoor2018; Yang et al., Reference Yang, Reddy, Du and Fan2018). X-ray diffraction (XRD) and the swelling index are used for bentonite characterization (Andrini et al., Reference Andrini, Toja, Gauna, Conconi, Requejo and Rendtorff2017; Monteiro et al., Reference Monteiro, de Oliveira, dos Santos, de Barros Neto, de Lima Leite, Aroucha and de Oliveira Silva2018; Özgüven et al., Reference Özgüven, Pekdemir, Müşerref and Sarikaya2020).
Physical and chemical modifications of clays that improve their properties are known as ‘activation processes’. One type of activation process is acid activation by mineral acids such as H2SO4 and HCl (Samudrala et al., Reference Samudrala, Kandasamy and Bhattacharya2018; Dutta, Reference Dutta2019). Upon acid activation, protons penetrate the clay layers and attack their structural OH groups. The subsequent dehydroxylation occurs through the sequential release of central atoms from octahedral cell units as well as the removal of Al3+ from tetrahedral sheets. Consequently, the tetrahedral sheets are gradually transformed into three-dimensional frameworks. The resultant solid product comprises partially dissolved layers and amorphous silica, depending on the intensity of activation, whereas the ambient acid solution contains ions that depend on the chemical composition of the clay material and the acid employed. Acid-treated clay minerals always produce various reaction products with enhanced catalytic properties (Carrado & Komadel, Reference Carrado and Komadel2009; Komadel & Madejová, Reference Komadel, Madejová, Bergaya and Lagaly2013; Yu et al., Reference Yu, Wang, Zhou, Zhao, Tong and Zhang2017; Huang et al., Reference Huang, Song, Liu, Yang, Lu, Liu and Liu2019; Balbay et al., Reference Balbay, Selvitepe and Saka2021). A schematic representation of the acid activation process of montmorillonite is shown in Fig. 2.

Fig. 2. Representation of the acidic process on montmorillonite.
Petroleum processing produces aromatic streams containing benzene, toluene and xylene during reforming and cracking processes. The production of these compounds is accompanied by the production of undesirable olefins that can be harmful to downstream units and poison their catalysts (Liu et al., Reference Liu, Liu, Ren, Shi and Meng2017; Wang et al., Reference Wang, Meng, Wang, Shi, Hu and Liu2021).
Two processes are typically used for the removal of olefins from aromatic streams: (1) clay treating and (2) catalytic hydrotreating (Liu et al., Reference Liu, Liu, Ren, Shi and Meng2017; Guo et al., Reference Guo, Zhang, Li, Peng, Xiong and Wang2020). In catalytic hydrotreating, olefins are saturated during the hydrogenation reactions on selective hydrogenation catalysts. In the clay-treating process, the acidic ability of the clay leads to the separation of olefins from aromatics according to the Friedel–Crafts alkylation reaction (Xin et al., Reference Xin, Alvarez-Majmutov, Dettman and Chen2018; Choudhary et al., Reference Choudhary, Pham and Uppili2020). Clay treating is commonly used for separating olefins from aromatic streams because catalytic hydrotreating is associated with considerable olefin losses only at greater temperatures and pressure conditions, thus raising operating costs (Emam, Reference Emam2018; Wu et al., Reference Wu, Han, Ni, Zhang, Li and Wang2018; Wang et al., Reference Wang, Meng, Wang, Shi, Hu and Liu2021).
In the present study, the most suitable bentonite was selected among four different materials after the evaluation of the swelling index, CEC, specific surface area and suspension stability. Previous studies focused on the preparation of activated clays by adding metal halides or other compounds through processes that were time-consuming, not environmentally friendly and not cost-efficient (Li et al., Reference Li, Luan, Zeng and Shi2011; Luan et al., Reference Luan, Li and Shi2011; Choudhury, Reference Choudhury and Do Nascimento2020). The selected bentonite was activated using two different acids (HCl and H2SO4) and was used to eliminate olefins from a hydrocarbon mixture. The activated clays and the natural clay were characterized using XRD, X-ray fluorescence (XRF), Brunauer–Emmett–Teller (BET) specific surface area analysis, ζ-potential, Fourier-transform infrared (FTIR) spectroscopy after treatment with pyridine (pyridine-FTIR), scanning electron microscopy (SEM) and transmission electron microscopy (TEM). Olefin removal was also examined in pilot tests. The efficiency of the desired sample (HCl-activated bentonite) was demonstrated according to these analyses. Pyridine-FTIR was used for the first time to elucidate the mechanism of trace olefin removal from an aromatic stream by acid-activated clay. Moreover, this work proposes a method of selection of the most suitable bentonite for the removal of olefins from aromatics based on a series of analyses. Ultimately, the HCl-activated bentonite yielded a conversion rate of olefins of ~95% after 48 h, which is significantly greater than has been previously reported.
Experimental
Materials
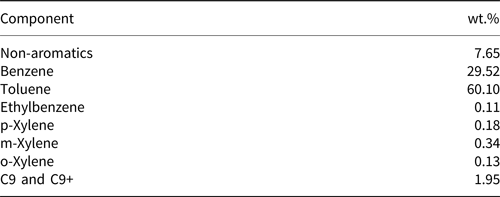
Natural bentonite samples were obtained from various mines of Iran, namely Nasimab 1 (N-1), Nasimab 2 (N-2), Abgarm (A; Semnan province) and Kheyrabad (K; Kerman province). All chemicals (sodium chloride, ethylene amine copper, HCl and H2SO4) were of analytical grade (Merck, Germany). Aromatic hydrocarbons were obtained from Bou Ali Sina (Avicenna) petrochemical company for pilot tests. The composition analysis was accomplished by gas chromatography (GC; Varian CP-3800) according to ASTM D-5134 with Cpsil CB column (L = 50 m, d = 0.5 μm) (Table 1). The conditions for the GC analysis were oven temperature 75–280°C, inlet injection temperature 250°C and flame ionization detector temperature 250°C.
Table 1. Aromatic hydrocarbon component analysis.
Selection of the suitable bentonite
The samples were ground with a ball mill (Cross Beater Mill SK 100, Retsch Co., Germany) and sieved so that ~80% passed through a 200 mesh (74 μm) sieve (Fig. 3). The samples were then dried at 110°C for 12 h.
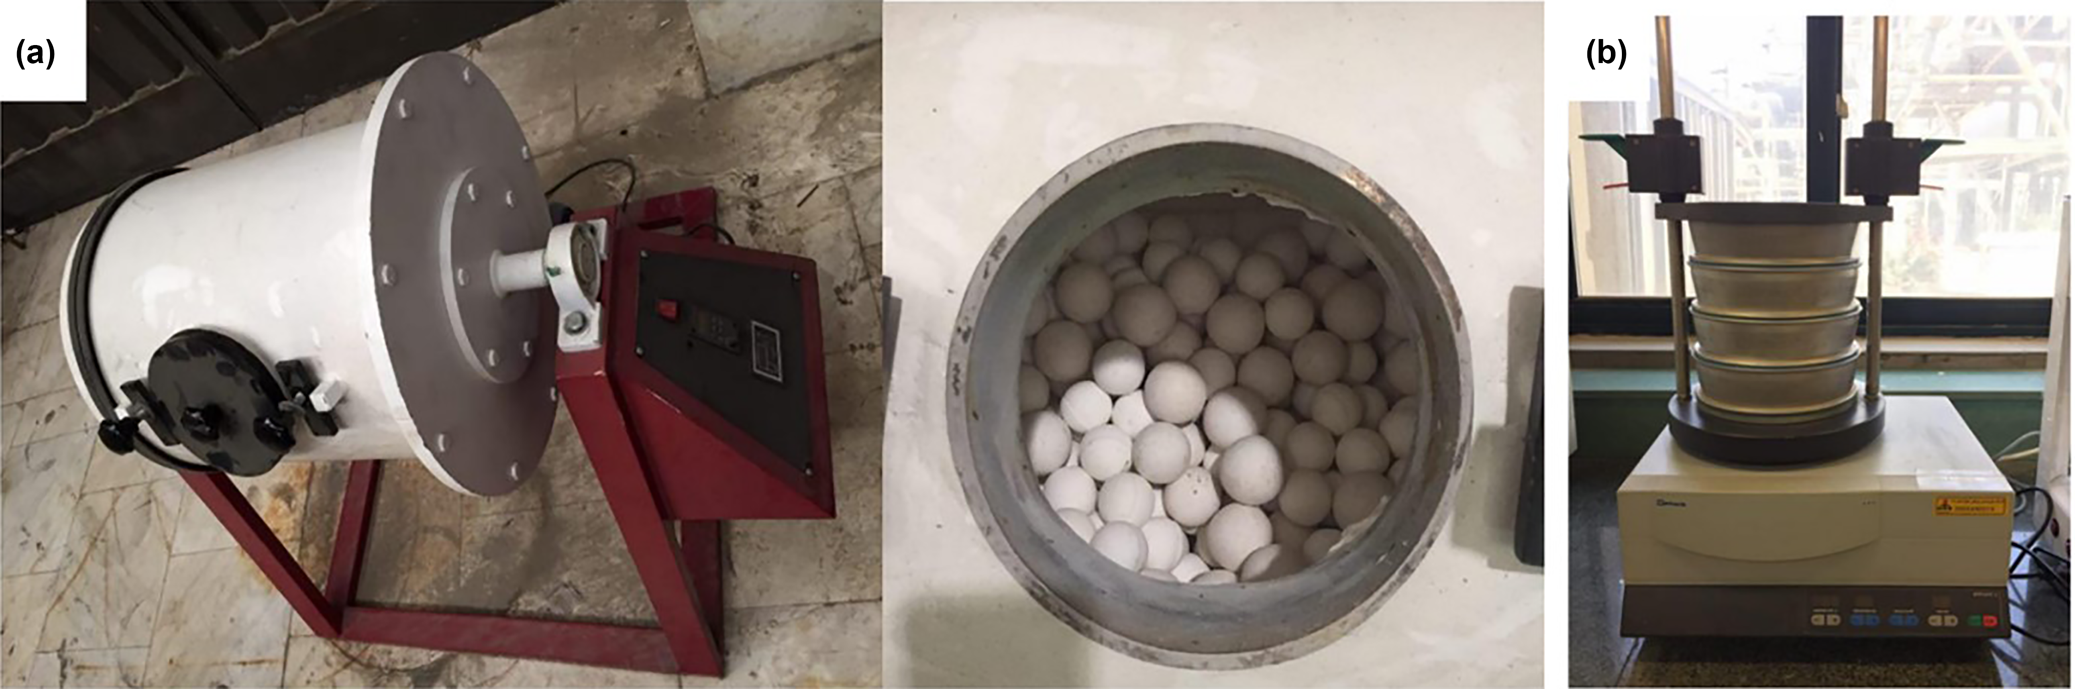
Fig. 3. (a) The ball mill and (b) the vibration sieve shaker for preparing the raw bentonite samples.
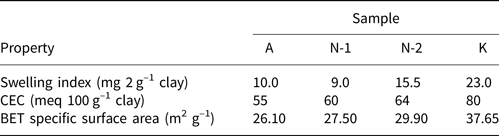
The swelling index, CEC, BET specific surface area and ζ-potential analyses were conducted to determine the most suitable bentonite for the acid treatment. The first test conducted on fine bentonite samples was the swelling index. Because calcium bentonite has a low specific surface area, this test was necessary to select the most suitable sample (Yu et al., Reference Yu, Yang, Wu, Jiang, Liao and Deng2021). The swelling index test was conducted according to ASTM D-5890 and 2 g of each sample were added to 100 mL of deionized water and the volume of the gel formed was measured after 24 h (Table 2) (Rouhani et al., Reference Rouhani, Sarrafi and Tahmooresi2016). Bentonite sample K is Na-rich and the remaining bentonites are Ca-rich. To further support the results of the swelling test, the ζ-potential was determined to measure the suspension stability of the raw clays. Bentonite sample K is more stable than the remaining samples with a ζ-potential of ~–48 mV, compared to the ζ-potential value of ~0 mV for the remaining bentonites (Fig. 4). Hence, bentonite sample K suspensions would be more stable during the acid-treatment process than the other bentonite suspensions (El-Geundi et al., Reference El-Geundi, Ismail and Attyia1995; Dikmen et al., Reference Dikmen, Yilmaz, Yorukogullari and Korkmaz2012). Moreover, the CEC and BET specific surface area analyses demonstrated the suitability of bentonite sample K as a promising sample for activation (Table 2). Therefore, bentonite sample K was selected for further study because of its high CEC, high BET specific surface area, promising swelling index value and stability.
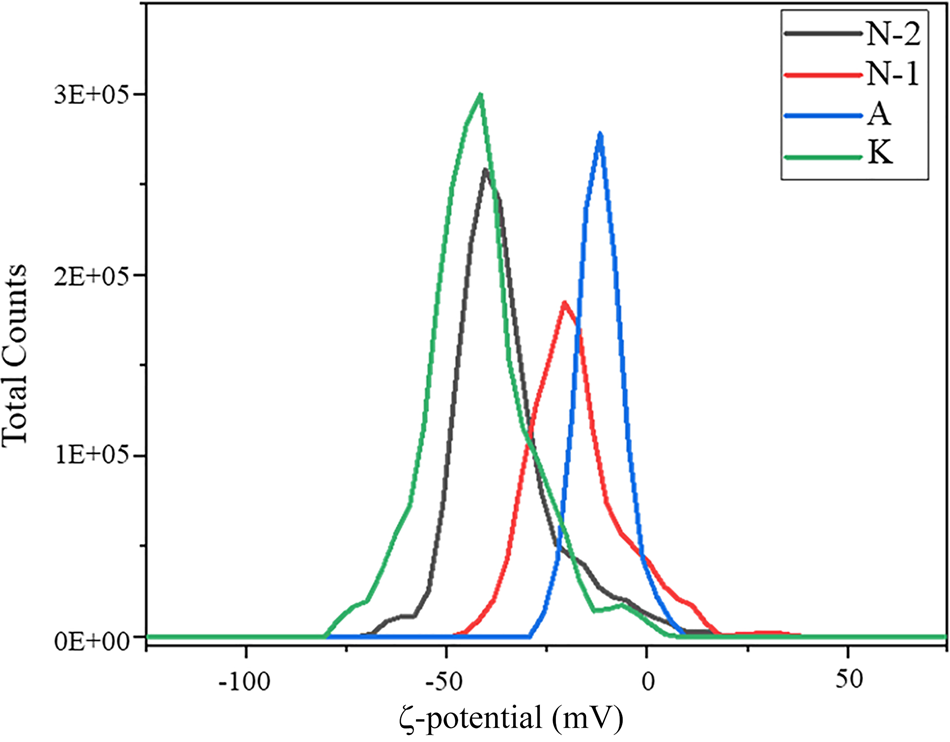
Fig. 4. ζ-potential values of the raw bentonites.
Table 2. Swelling index, CEC and BET specific surface area values of the bentonite samples.

Acid-treatment process
Acid treatment of natural clays improves their performance and increases their specific surface area, thereby improving their ultimate catalytic performance. In this work, HCl and H2SO4 were used for the acid-treatment process due to their significant impact on improving the properties of bentonite sample K (Komadel, Reference Komadel2003; Carrado & Komadel, Reference Carrado and Komadel2009; Komadel & Madejová, Reference Komadel, Madejová, Bergaya and Lagaly2013).
Acid activation was carried out using 4 M HCl and 4 M H2SO4. Greater acid concentrations may lead to the destruction of the smectite structure, while lower concentrations may not create a specific surface area that is suitable for activation (Christidis et al., Reference Christidis, Scott and Dunham1997; Finevich et al., Reference Finevich, Allert, Karpova and Duplyakin2007). A total of 5 g of the bentonite was stirred magnetically with 100 mL of each acid for 8 h at 85°C in a round-bottomed flask under total reflux conditions to prevent acid evaporation (Fig. 5a). The temperature was kept constant using a heater and thermometer that were checked regularly. The slurry was cooled by air, centrifuged and washed with distilled water until the pH and conductivity of the washing water were stable and sufficiently close to the respective values for distilled water (Fig. 5b) (Christidis et al., Reference Christidis, Scott and Dunham1997).
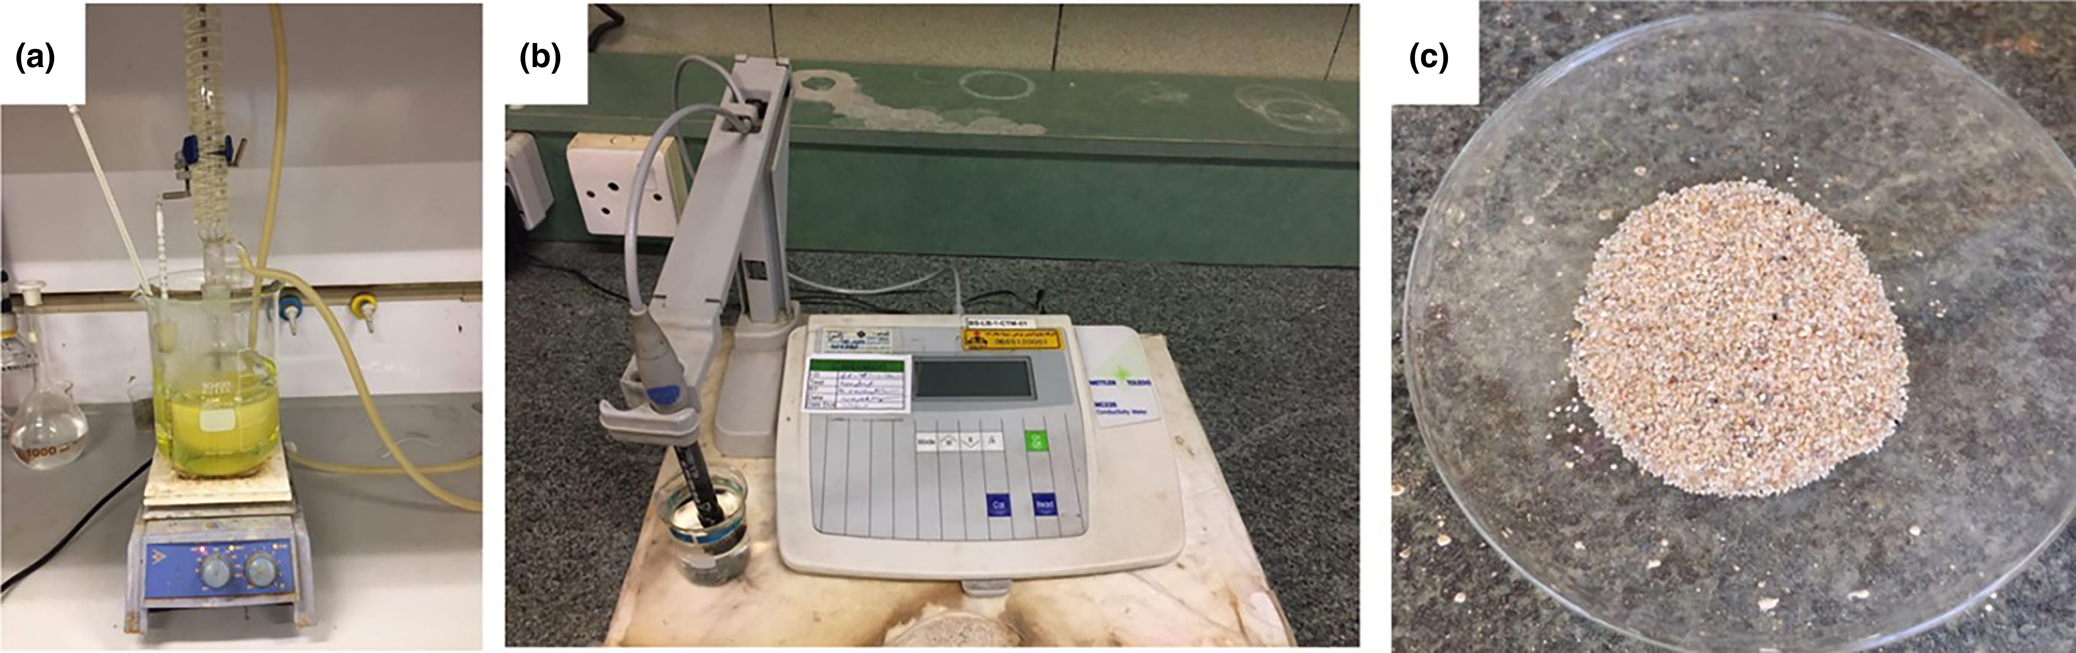
Fig. 5. (a) Preparation setup of the activated clays. (b) Device for measuring the conductivity of distilled water. (c) Acid-activated clay after drying.
Filtered samples were collected and dried at 120°C for 6 h (Fig. 5c). The activated samples were labelled as ‘HClA’ for HCl-activated clay and ‘HSA’ for H2SO4-activated clay, while natural bentonite was labelled as ‘NC’ for natural clay.
Determination of CEC
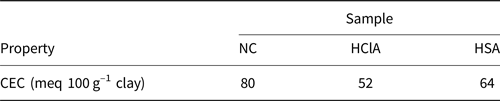
The CEC values of the samples were determined using the copper ethylenediamine method (Bergaya & Vayer, Reference Bergaya and Vayer1997). Copper ethylenediamine complex solution was obtained by mixing 1 M NaCl and ethylene amine copper, and the product solution was diluted to 0.01 M. Then 25 mL of solution was stirred with 0.5 g of natural clay for ~30 min, and the obtained suspension was filtered. The concentration of copper in the filtrate was measured using atomic absorption spectroscopy. The CEC values were determined according to the absorption of copper in the sample (Bergaya & Vayer, Reference Bergaya and Vayer1997; Rihayat et al., Reference Rihayat, Salim, Arlina, Fona, Jalal and Alam2018). Acid treatment reduced the CEC values (Table 3). HCl reduced the CEC values more than H2SO4.
Table 3. The CEC values of the raw and acid-activated bentonite samples.

Catalyst test in a pilot plant
Dried samples were crushed with a pestle and mortar after cooling and screened to 20–40 mesh. The screened samples were placed in an oven at 120°C for 100 min. Finally, samples were prepared for loading into the reactor (Fig. 6a).
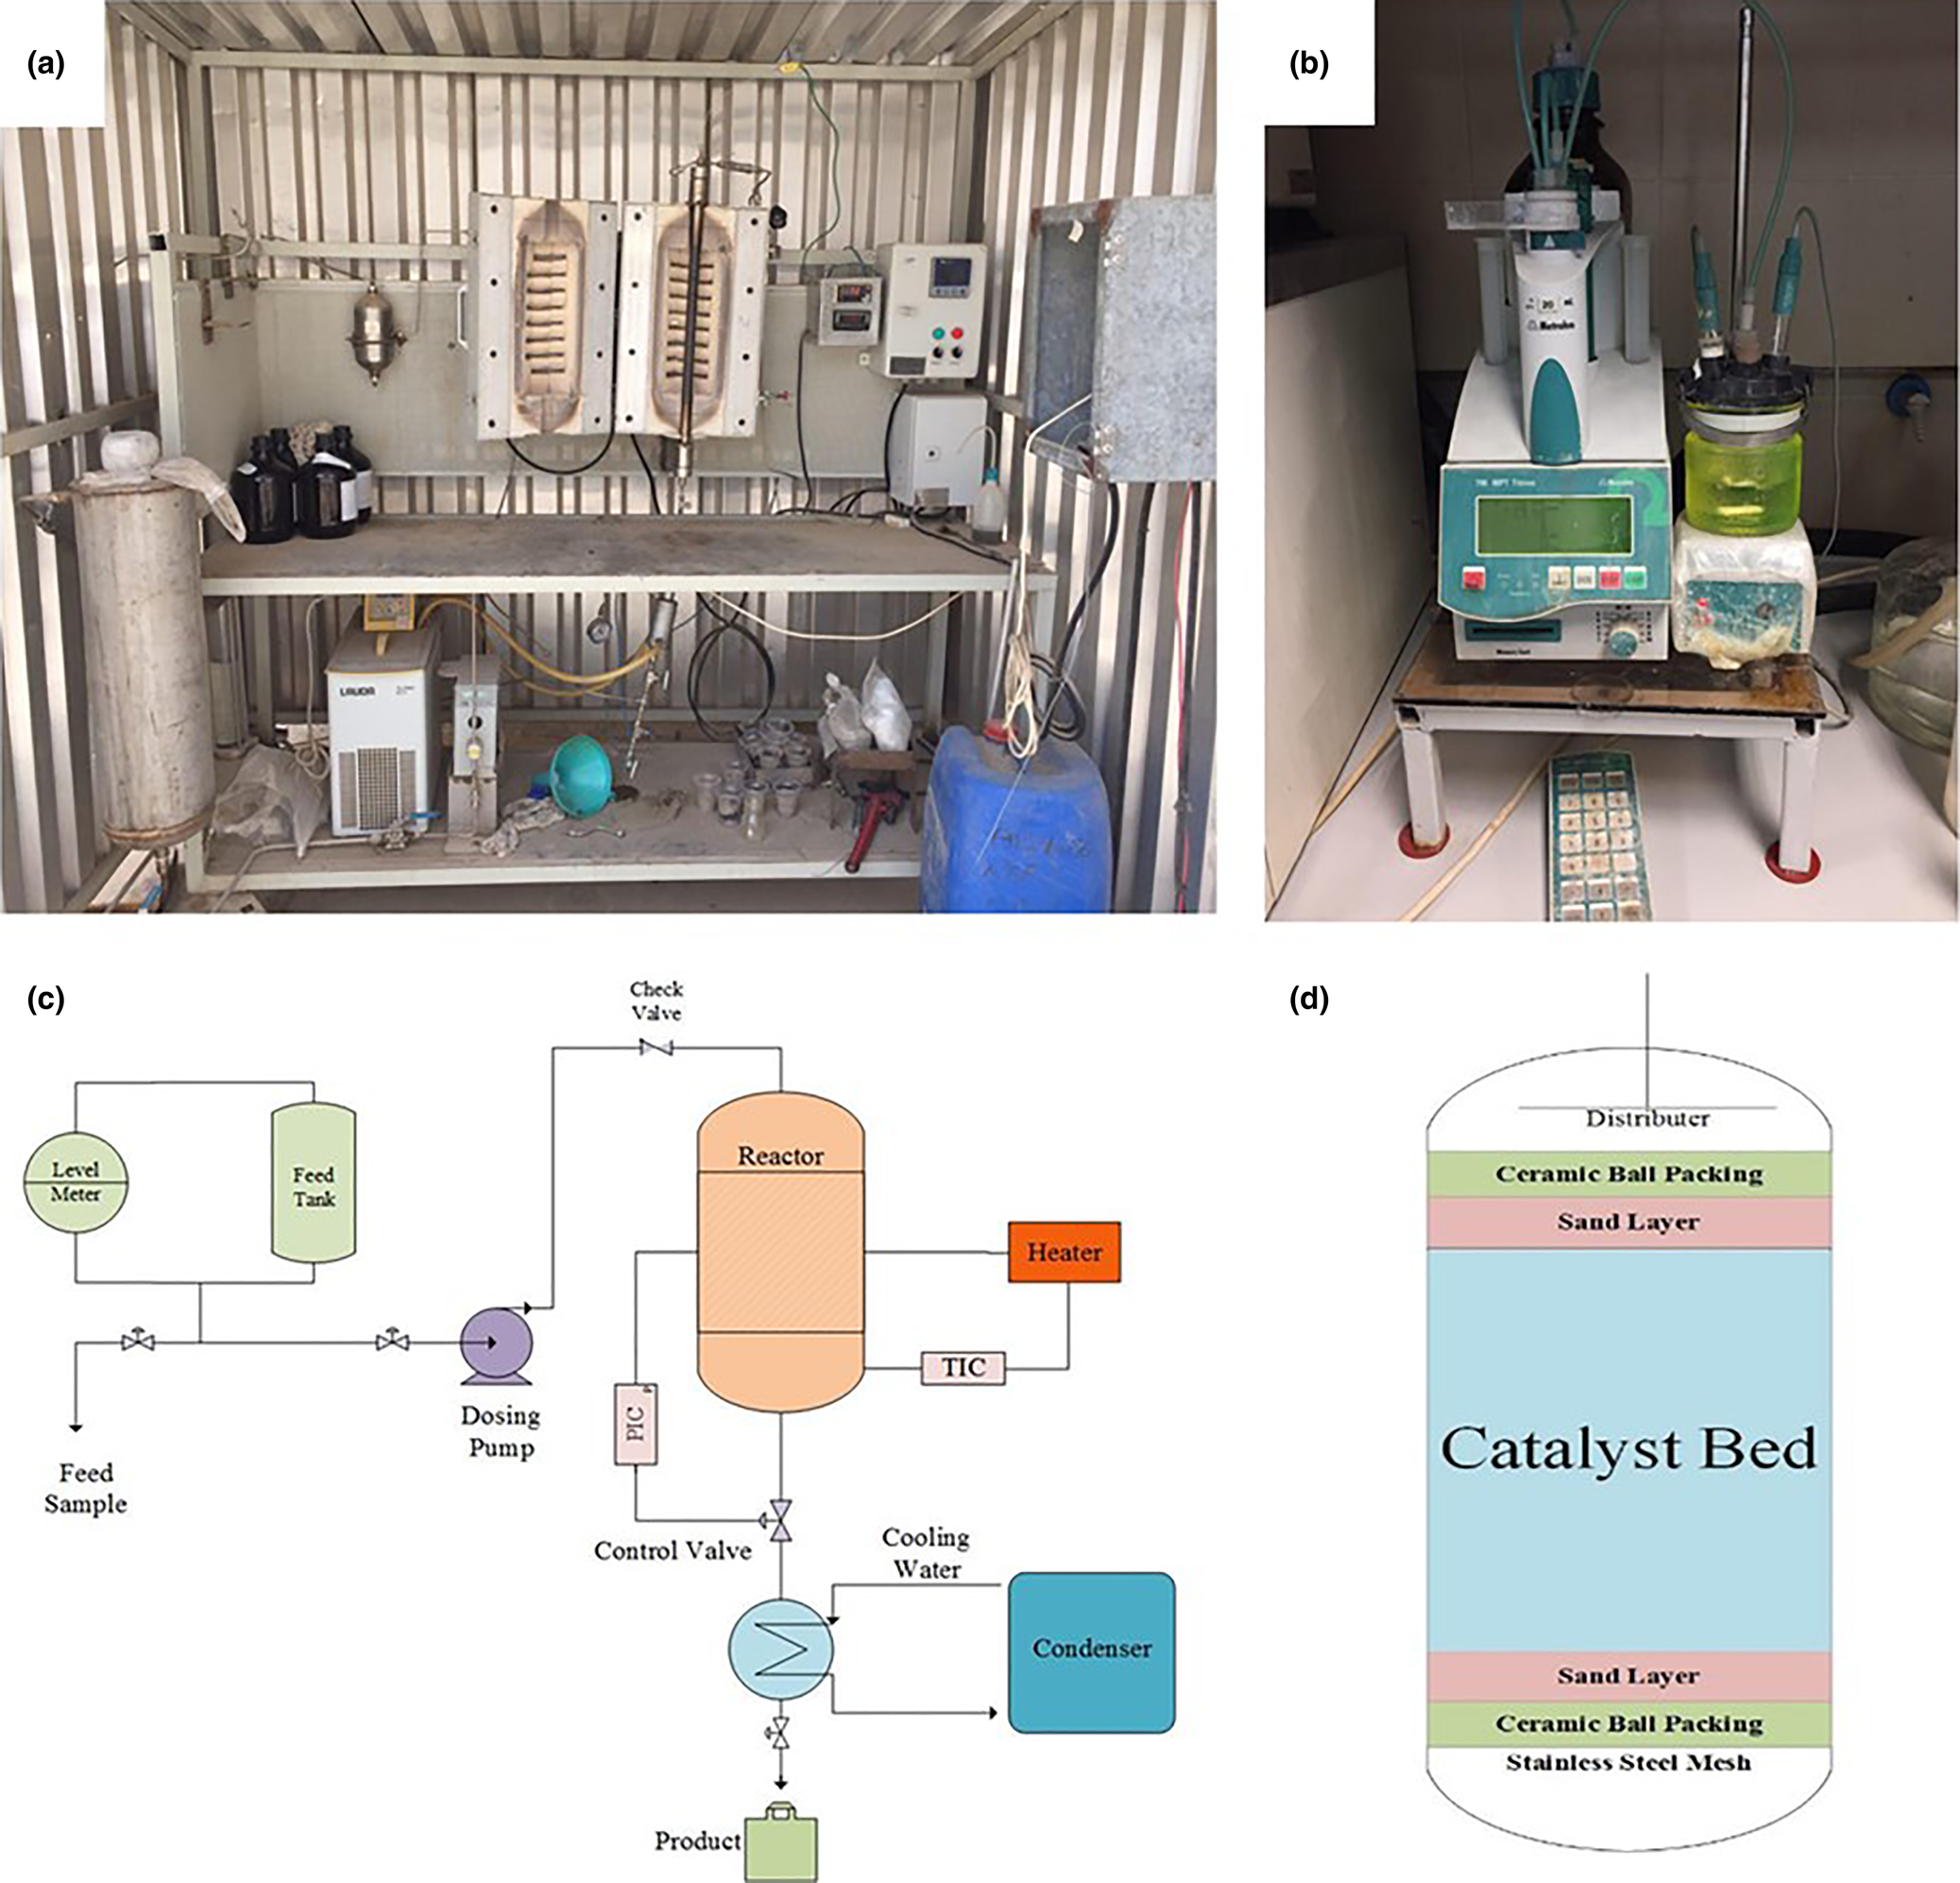
Fig. 6. (a) Photograph of the pilot plant for olefin removal by clays for testing the prepared samples. (b) Titration device for measuring the BI of the feed and product samples. (c) Overall schematic of the pilot plant. (d) Internal structure of the reactor.
Catalytic tests of the treated and natural clays were conducted in a pilot plant (Fig. 6c). A total of 7.7 g of each sample was loaded in a stainless-steel reactor equipped with a flow controller and a heating system. Samples were placed between two quartz sand layers and ceramic balls (40–60 mesh) in the reactor (Fig. 6d). The reaction was carried out at 185°C, a reaction pressure of 16 bar and a weight hourly space velocity (WHSV) of 6.56 h–1 (Rouhani & Farhadi, Reference Rouhani and Farhadi2020).
The olefin contents of the feed and product streams were measured using the bromine index (BI) in accordance with ASTM D 2710-92. The BI is defined as the number of milligrams of bromine consumed by 100 g of a hydrocarbon sample (Pu et al., Reference Pu, Liu, Jiang and Shi2012).
The conversion of olefins was calculated according to the following equation:

where Bri and Bro are the olefin contents of the feed and products, respectively (o = 1, 2, 3, …).
The feed of the clay-treating unit contains a typical BI of ~300–700, which must be reduced to <20 for industrial processes (Fig. 7) (Reddy et al., Reference Reddy, Lad, Mantri, Das, Raman and Jasra2020). In order to measure the olefin contents of the feed and product streams, the device demonstrated in Fig. 6b was used.
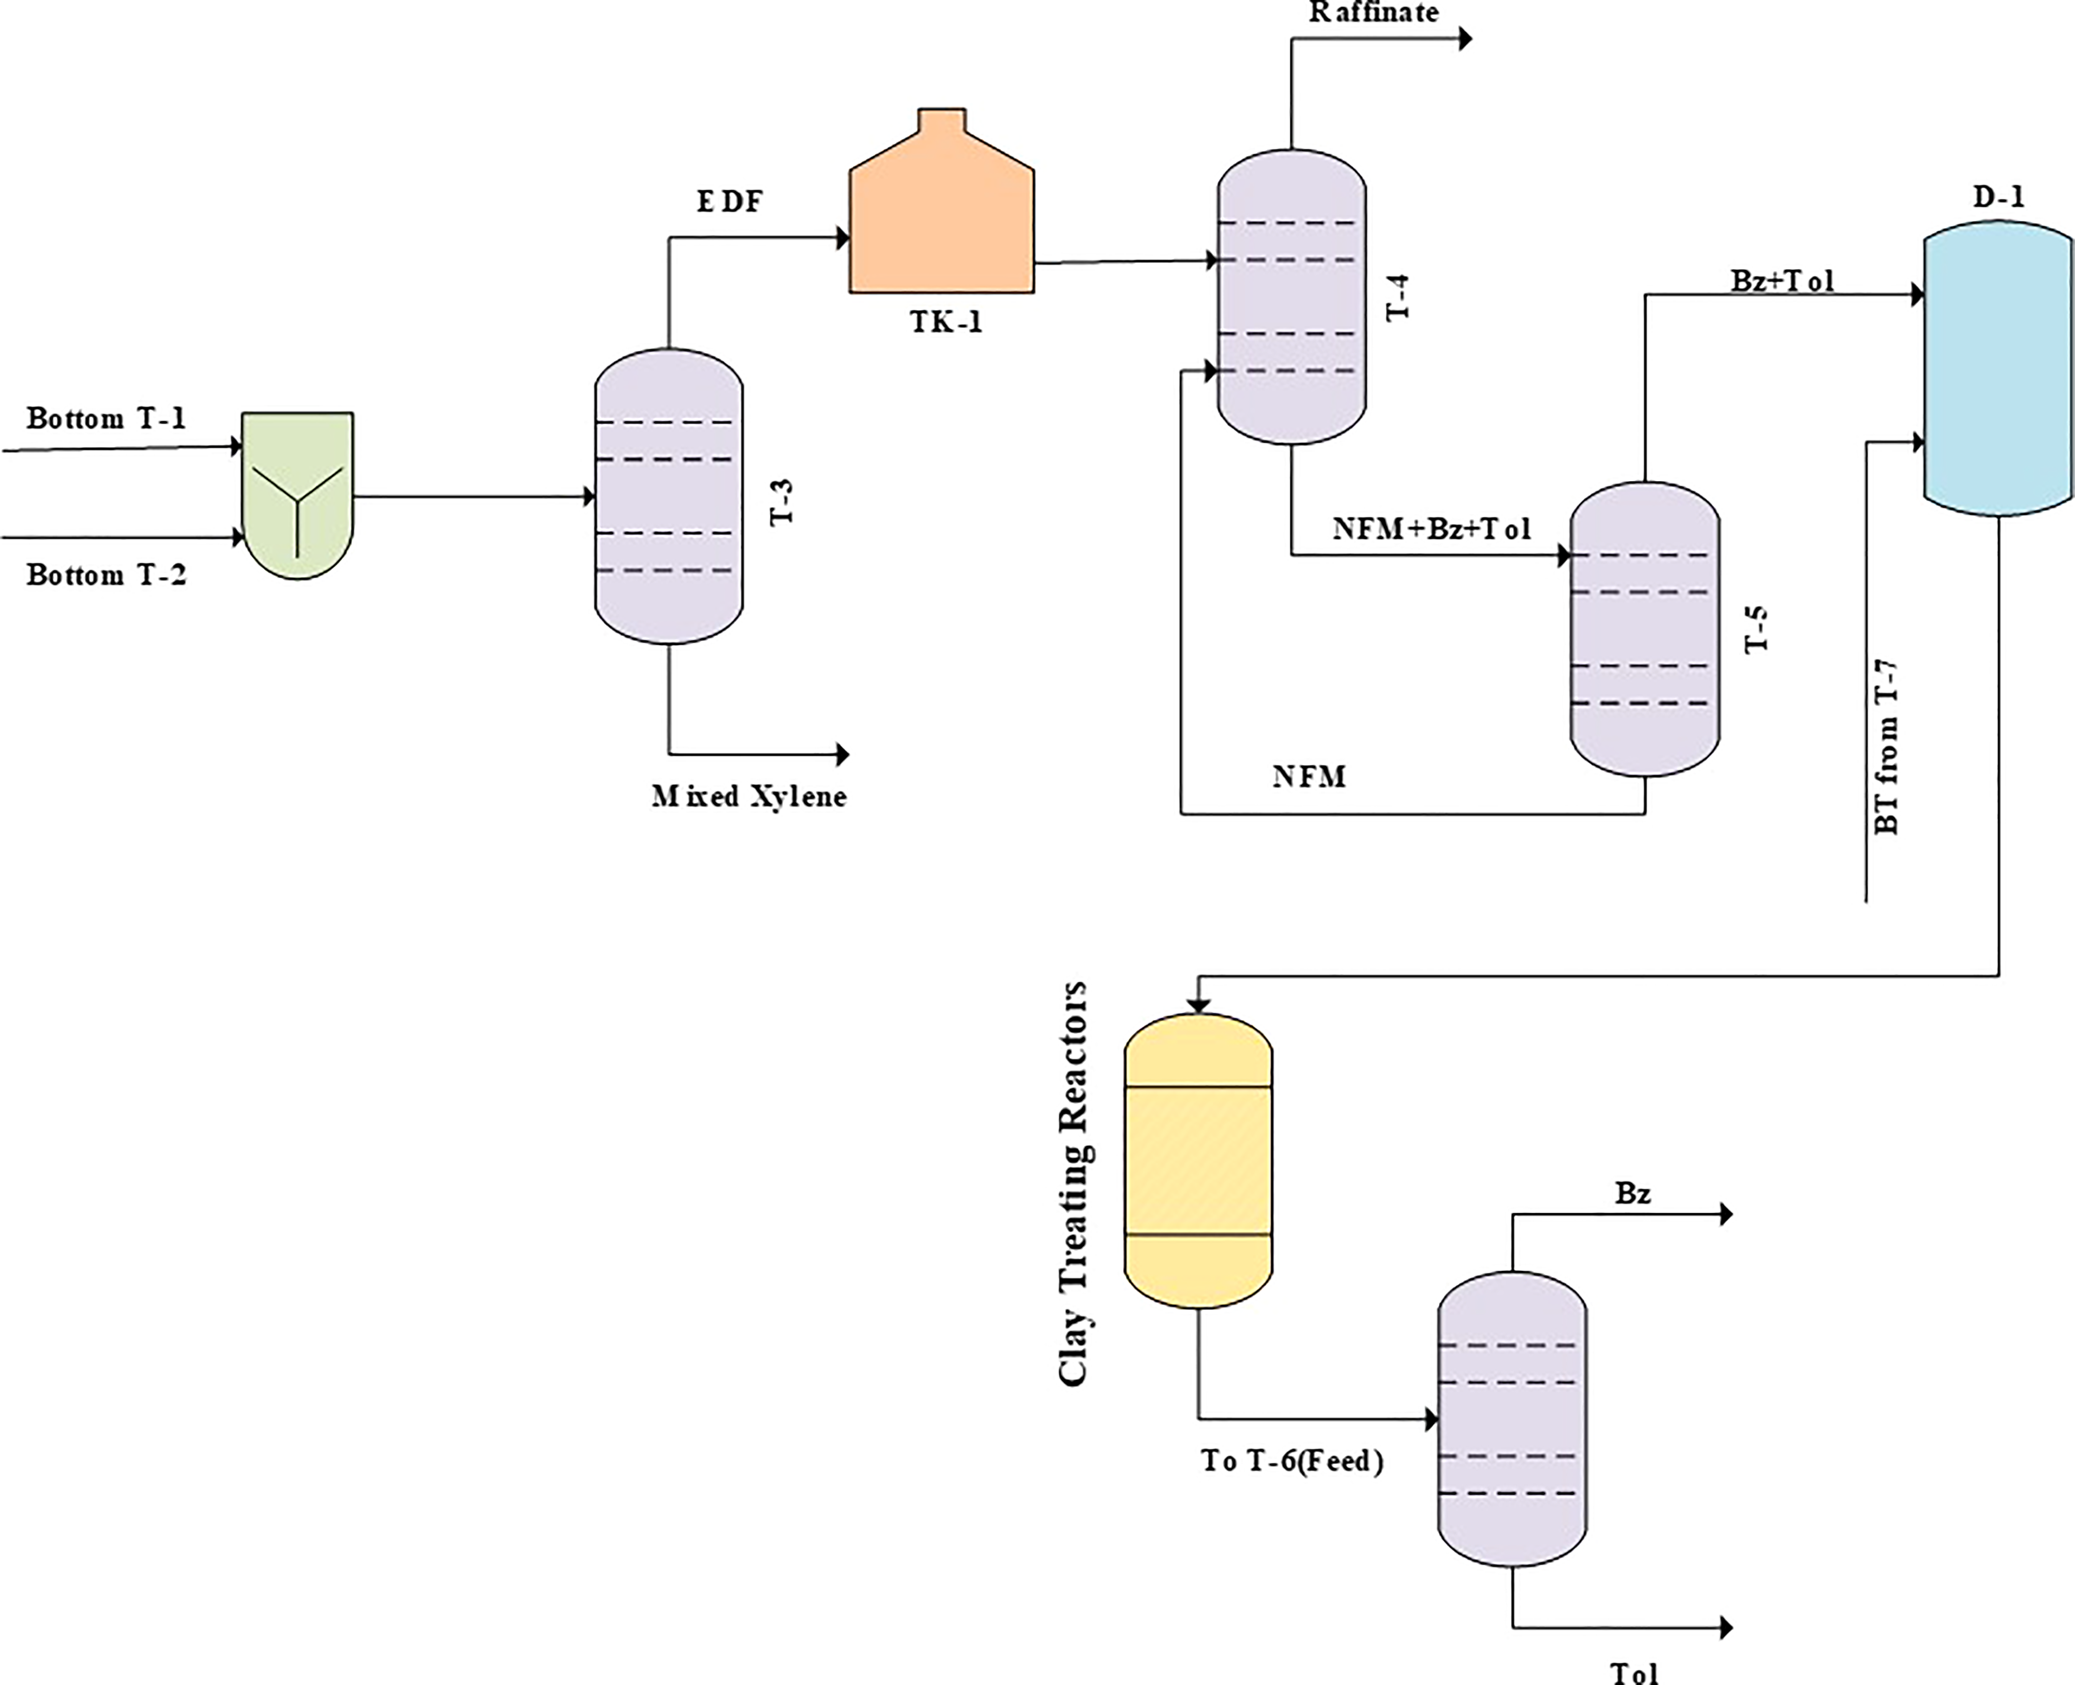
Fig. 7. Flow diagram of the clay-treatment unit in a petrochemical plant. BT = benzene and toluene mixture; Bz = benzene; EDF = extractive distillation feed; NFM = normal formylmorpholine; Tol = toluene.
Results and discussion
XRF analysis of the bentonite samples
The acid activation process replaces interlayer ions (Ca2+, Na+, K+, Mg2+) with H+ and increases the catalytic activity of the sample (Rouhani et al., Reference Rouhani, Sarrafi and Tahmooresi2016). Table 4 lists the XRF analyses (using an Advant ARL (Thermo Electron SA Company, Switzerland) sequential X-ray fluorescence spectrometer) of two acid-activated samples compared to NC. The decrease in Na2O content is shown in Table 3, indicating interlayer cations of montmorillonite (mainly sodium) were exchanged with H+. The decreases in MgO and Al2O3 after the acid treatment indicate that parts of the octahedral sheets were dissolved during activation. Many acid sites (Lewis and Brønsted) are created in montmorillonite through acid activation (Yang et al., Reference Yang, Weng, Ding, Zhao, Qin and Xia2020; Dill et al., Reference Dill, Kochepka, Lima, Leitão, Wypych and Cordeiro2021). The CaO, K2O and Fe2O3 contents of the natural samples also decreased, indicating the impact of acid treatment on accessory minerals in the bentonite. The increase in SiO2 after acid treatment indicates that tetrahedral Si4+ cations are not significantly leached by the acid treatment.
Table 4. XRF analysis of the bentonite samples.
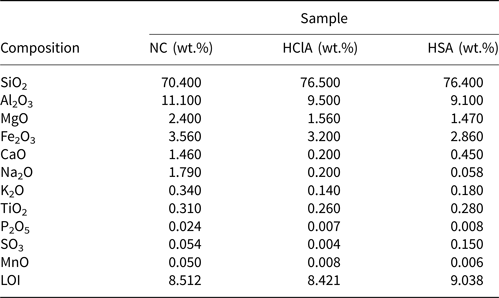
LOI = loss on ignition.
XRD analysis of the bentonite samples
The XRD traces (Equinox 3000, Inel Co., France) of the raw and acid-activated clays are shown in Fig. 8a. In addition to montmorillonite as the major mineral, minor cristobalite, hematite, calcite, illite and quartz are present in the bentonite (Fig. 8b) (Rouhani et al., Reference Rouhani, Sarrafi and Tahmooresi2016). The XRD traces of the various samples are comparable, suggesting that the acid activation did not significantly disrupt the structure of the montmorillonite. The d 001 basal spacings of the NC and activated clays with H2SO4 and HCl are 10.70, 12.16, and 12.64 Å, respectively (Boulaouche et al., Reference Boulaouche, Kherroub, Khimeche and Belbachir2019). Hence, during activation, the basal spacing increased by ~2 Å, and activation with HCl increased the basal spacing to a greater extent than activation with H2SO4 (Rouhani et al., Reference Rouhani, Sarrafi and Tahmooresi2016).
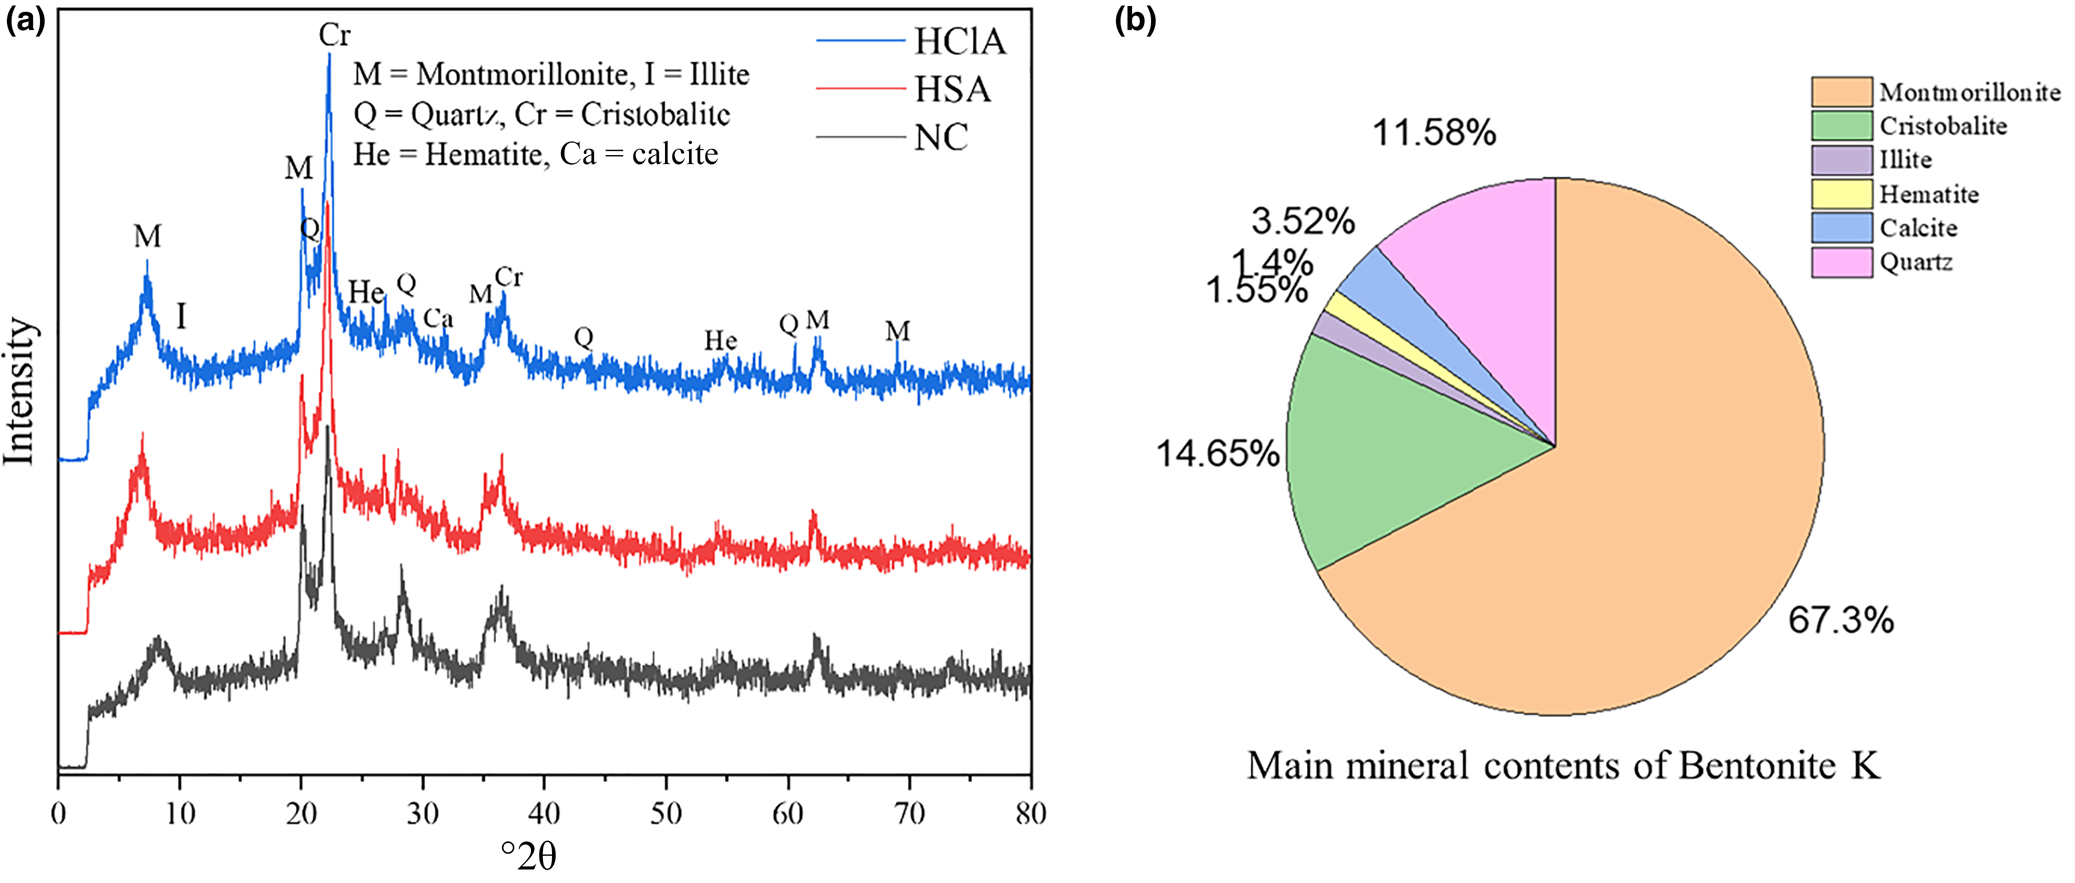
Fig. 8. (a) XRD traces of the NC and activated clays. (b) Quantitative mineralogical composition of the NC (bentonite K).
The 001 peak intensity at ~9°2θ after acid activation decreased compared to that of NC, suggesting that acid activation modified the structure of the montmorillonite. The intensities of the non-basal (prismatic) reflections at ~20°2θ (110) and at 62°2θ (060) also decreased slightly. Hence, the crystal order of the samples decreased slightly during acid activation.
BET analysis of the bentonite samples
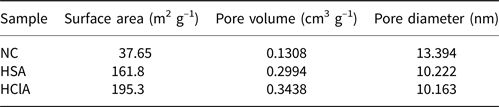
The N2 adsorption–desorption isotherms of the samples are shown in Fig. 9. All isotherms are type IV according to the International Union of Pure and Applied Chemistry (IUPAC) classification (Amari et al., Reference Amari, Gannouni, Khan, Almesfer, Elkhaleefa and Gannouni2018). Table 5 lists the BET specific surface area (BEL Japan, Inc.), total pore volume and pore diameter values of three clay samples. The BET specific surface area increased during acid activation with both acids. The total pore volume of the samples also increased during acid activation, but the pore diameter of the activated samples decreased. Generally, a reduction in mean pore diameter may cause an increase in total pore volume, and these results are in accordance with this theory (Obayomi & Auta, Reference Obayomi and Auta2019). Acid treatment with HCl increased the BET specific surface area and total pore volume to a greater extent than did acid treatment with H2SO4.
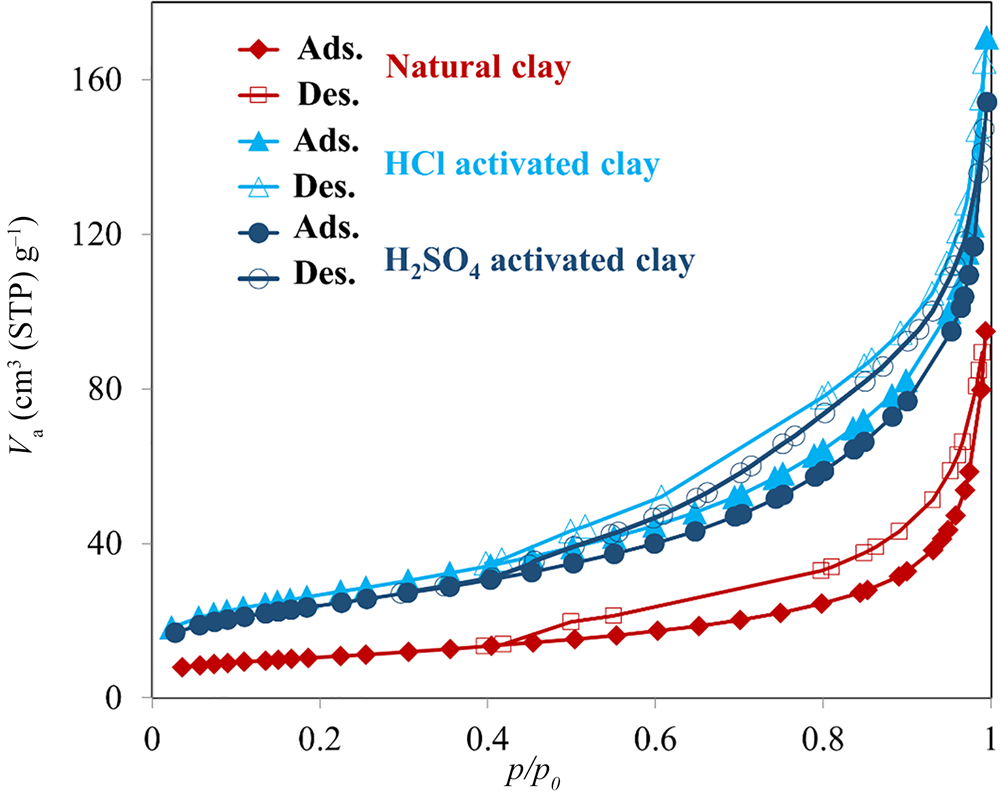
Fig. 9. N2 adsorption–desorption isotherms of the bentonite samples. For each sample, the lower lines correspond to adsorption (Ads.) and the upper lines correspond to desorption (Des.). STP = standard temperature and pressure.
Table 5. Textural properties of the bentonite samples.
Pyridine-FTIR spectra of the bentonite samples
The concentration of acidic sites was determined via quantitative FTIR spectroscopy using the KBr method with pyridine as the probe molecule. The KBr discs in the cell were heated at 653 K under vacuum for 2 h and cooled to 353 K for pyridine adsorption. The sample was then subjected to thermal desorption at 723 K to remove pyridine, followed by FTIR measurement (Tensor 27, Bruker Co., MA, USA) (Li et al., Reference Li, Luan, Zeng and Shi2011; Luan et al., Reference Luan, Li and Shi2011). The FTIR spectra for the pyridine adsorption of samples are shown in Fig. 10, and the calculated concentrations of acid sites are given in Table 6.
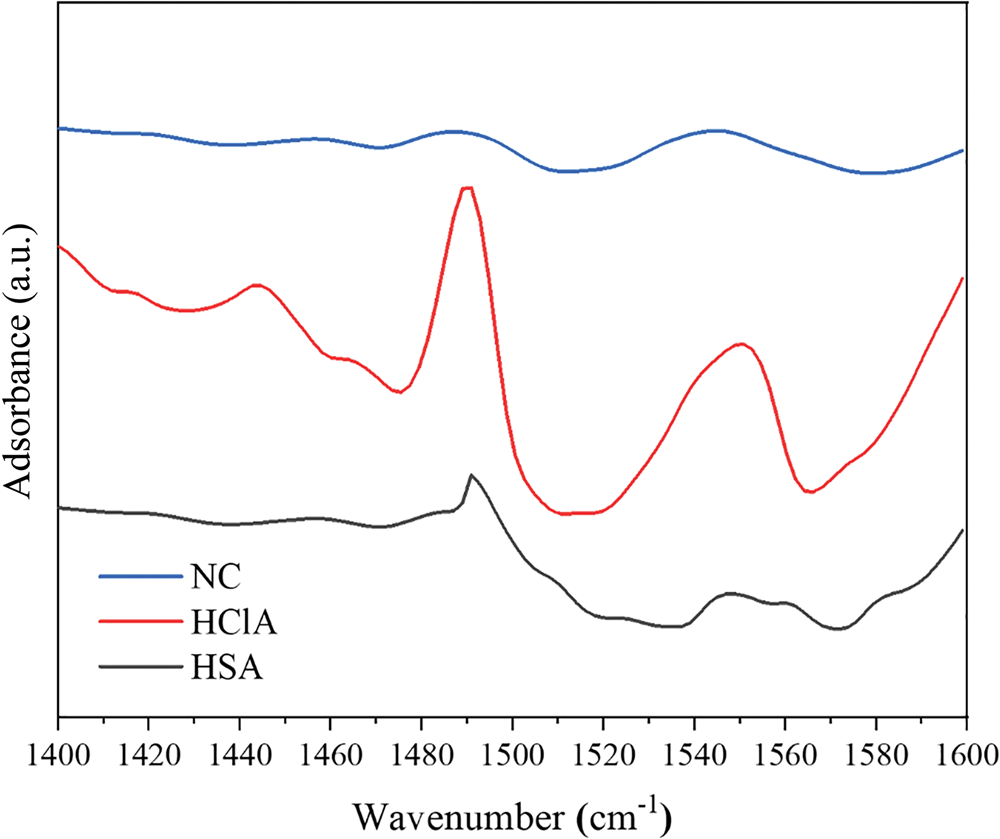
Fig. 10. FTIR spectra of pyridine adsorbed on the various bentonite samples at 723 K.
Table 6. Acidic properties of the bentonite samples.
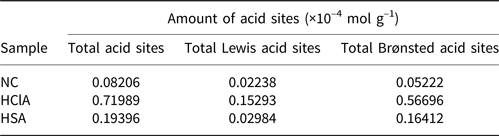
The FTIR spectra displayed several characteristic bands in the 1400–1600 cm–1 range, which are attributed to the interaction of pyridine with Lewis and Brønsted acid sites on the sample surface. The band at ~1450 cm–1 is due to pyridine adsorbed on the Lewis acid sites, while the band at 1490 cm–1 is due to contributions of both the Lewis and Brønsted acid sites. Finally, the band at ~1540 cm–1 is due to pyridine adsorbed on Brønsted acid sites (Li et al., Reference Li, Luan, Zeng and Shi2011; Luan et al., Reference Luan, Li and Shi2011). The concentrations of Brønsted and Lewis acid sites were calculated from the integrated absorbance intensities of these bands (Fig. 10).
The FTIR bands of the HCl-activated clay are more intense, indicating stronger acidic properties of this sample compared to its counterparts (Fig. 10). The acid treatment had a strong influence on the acidic properties of the samples (Table 6) and increased the number of Lewis acid sites. In addition, activation with HCl created more Lewis acid sites than did activation with H2SO4. The alkylation of aromatics with olefins over a catalyst generally obeys the carbonium ion mechanism (Fig. 11). Hence, the Lewis acid sites acted as the catalysts of the alkylation reaction in this mechanism and the olefin molecule was protonated by the Lewis acid sites. The olefin molecule was turned into a carbonium ion through electrophilic attack on the aromatic π-electrons, a mono- or poly-alkylbenzenium ion. The desorption process and the loss of the proton yielded the alkylated aromatic and restored the Lewis acid sites (Pu et al., Reference Pu, Liu, Jiang and Shi2012).
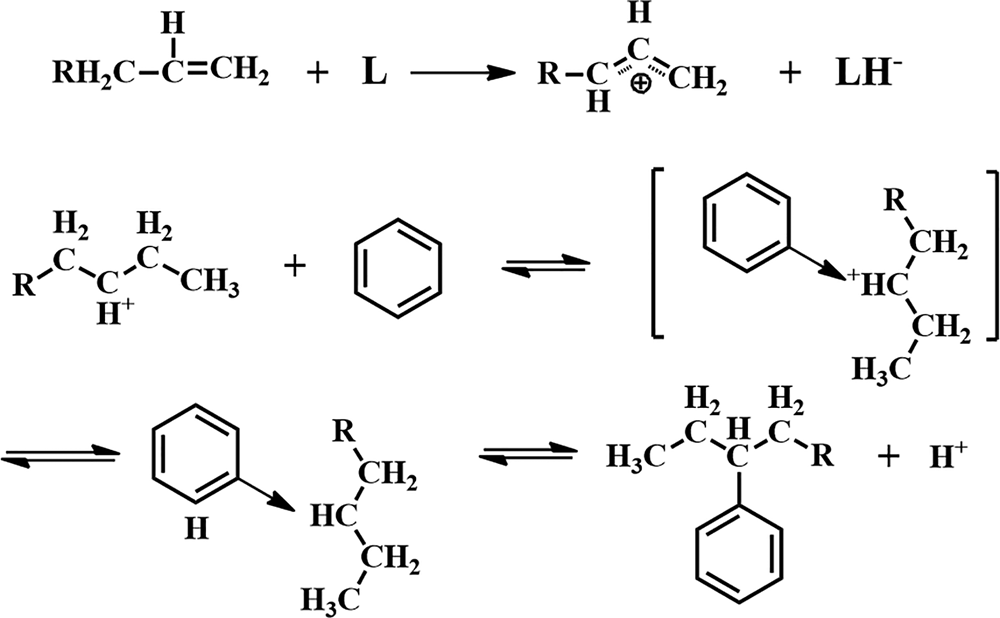
Fig. 11. Mechanism of reaction between olefins and aromatics.
SEM and TEM images of the bentonite samples
SEM images (AIS 2100 SEM, SERON Technologies, Korea) of the samples (NC, H2SO4-activated and HCl-activated) are shown in Fig. 12. The NC consists of thick irregular platelets partly forming chunks or flakes. The acid-treated samples consist of smaller ragged or serrated particles, highlighting the effect of acid erosion. Leaching of interlayer cations during acid treatment and their replacement by H+ ions potentially affected the edges of the platelets, which became wider and more open (Selvitepe et al., Reference Selvitepe, Balbay and Saka2019). However, in the TEM images, the lamellar structure of the NC was retained after acid treatment (Fig. 13). Hence, the thick platelets and multilayers of the clay were converted to thin and single-layer crystallites.
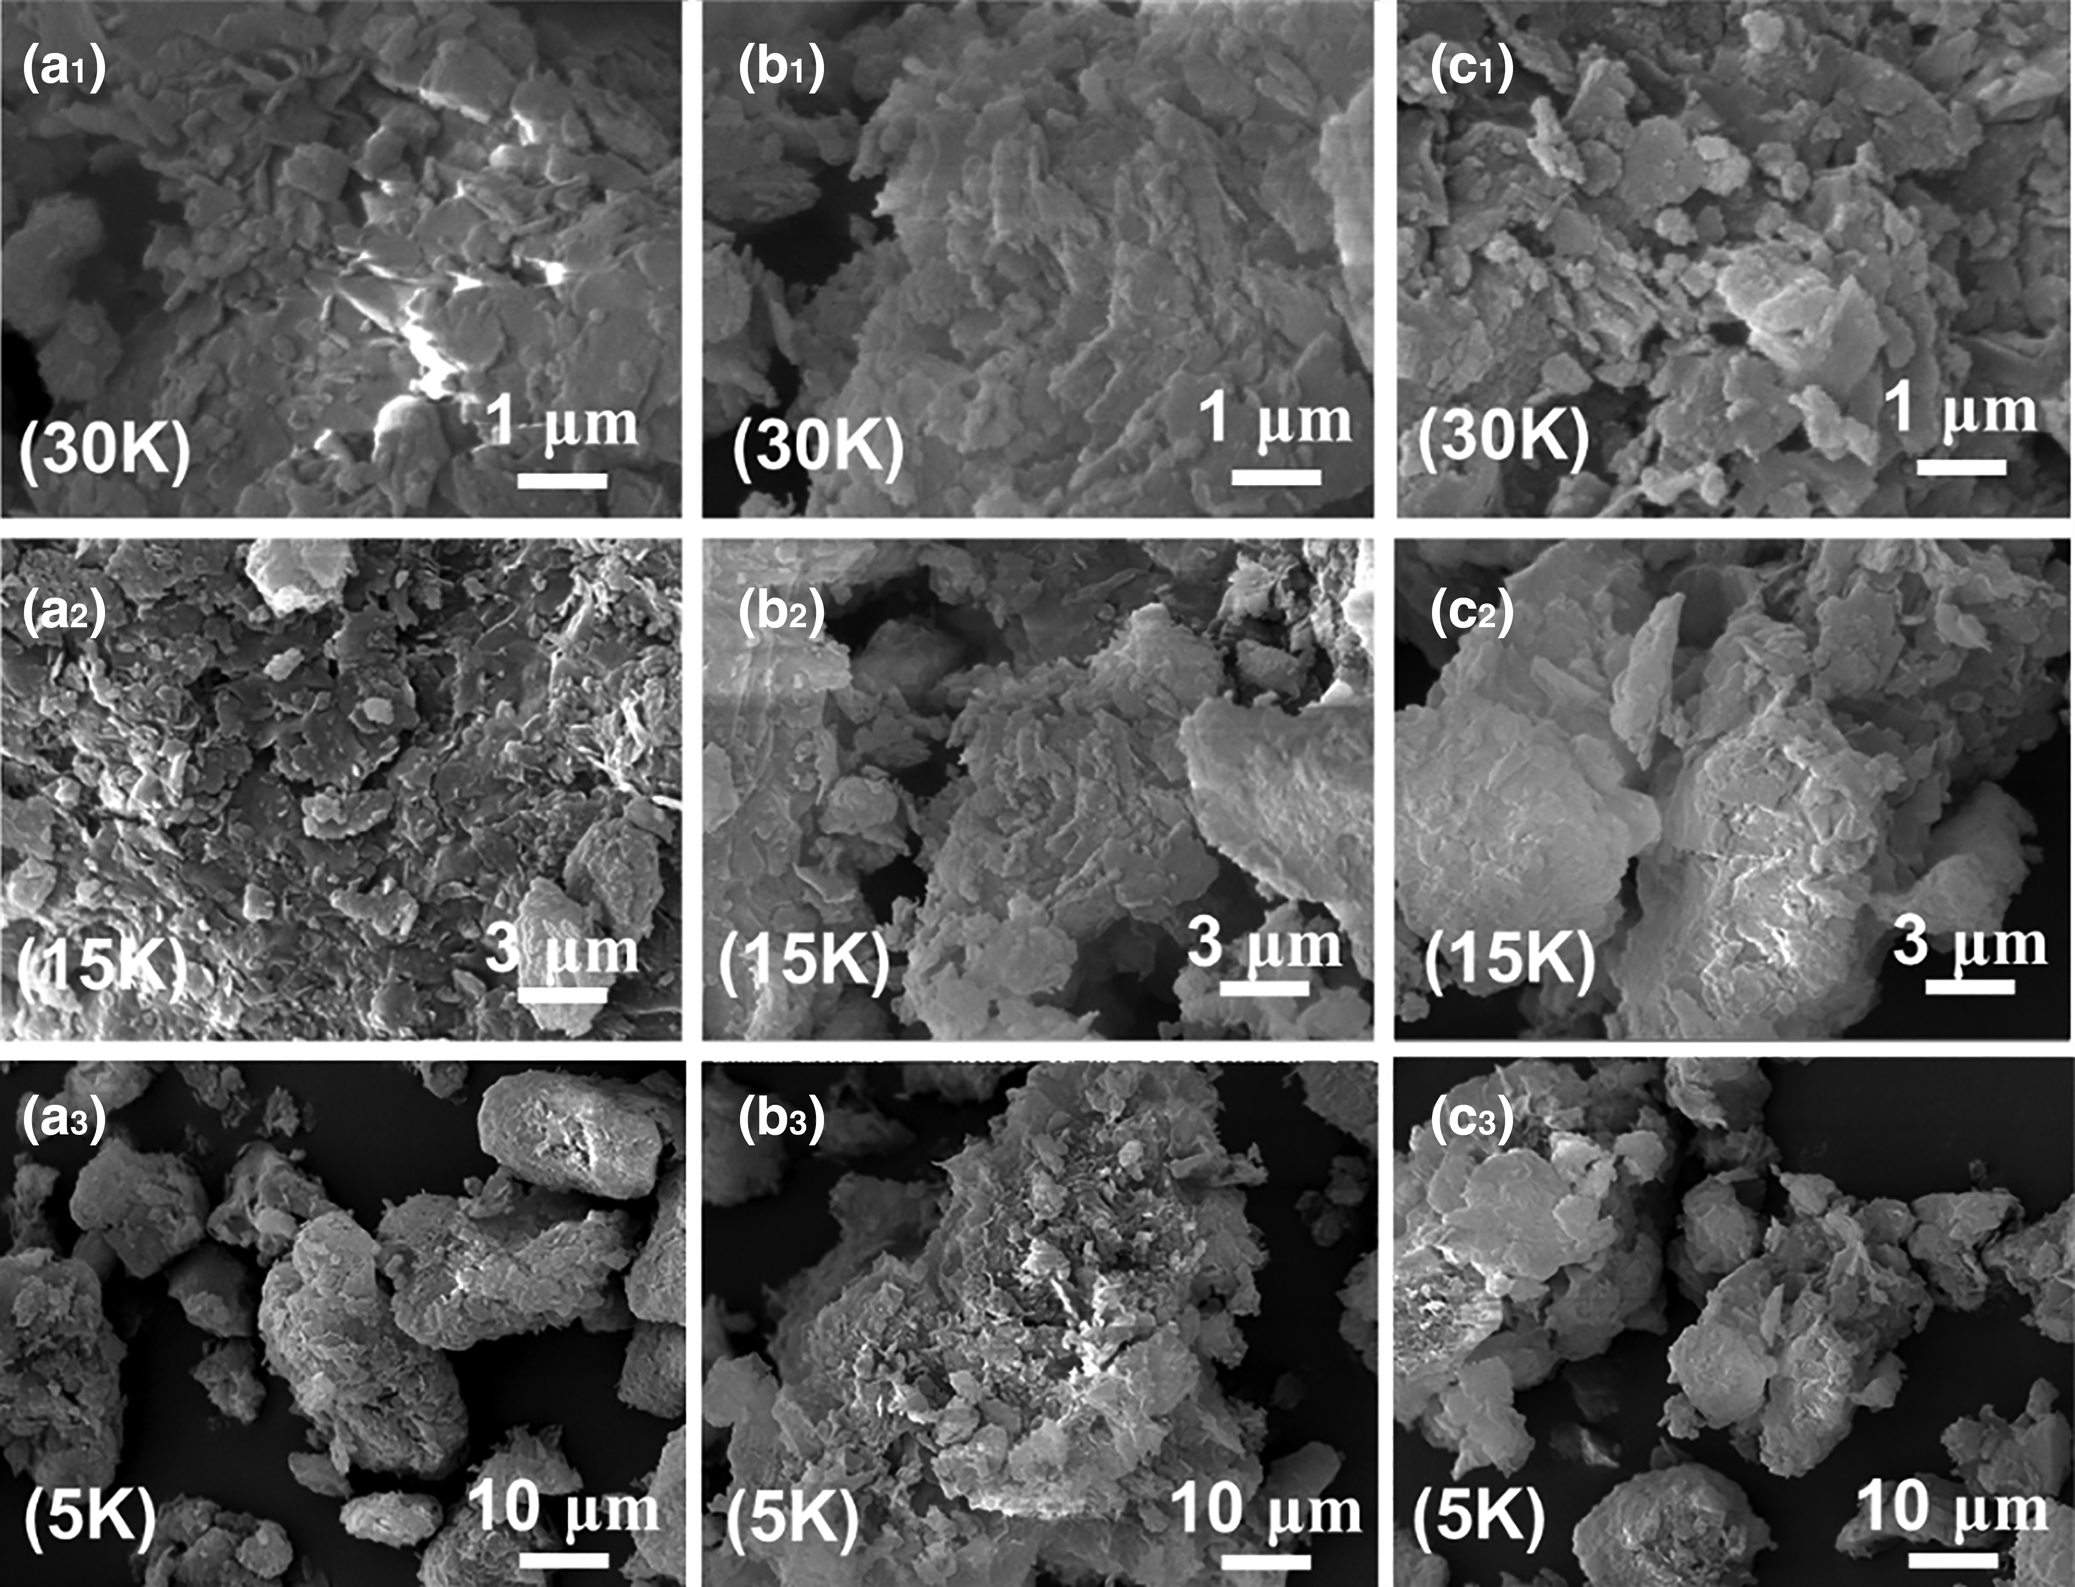
Fig. 12. SEM images of (a1–a3) NC (30,000× magnification), (b1–b3) H2SO4-activated clay (15,000× magnification) and (c1–c3) HCl-activated clay (5000× magnification).
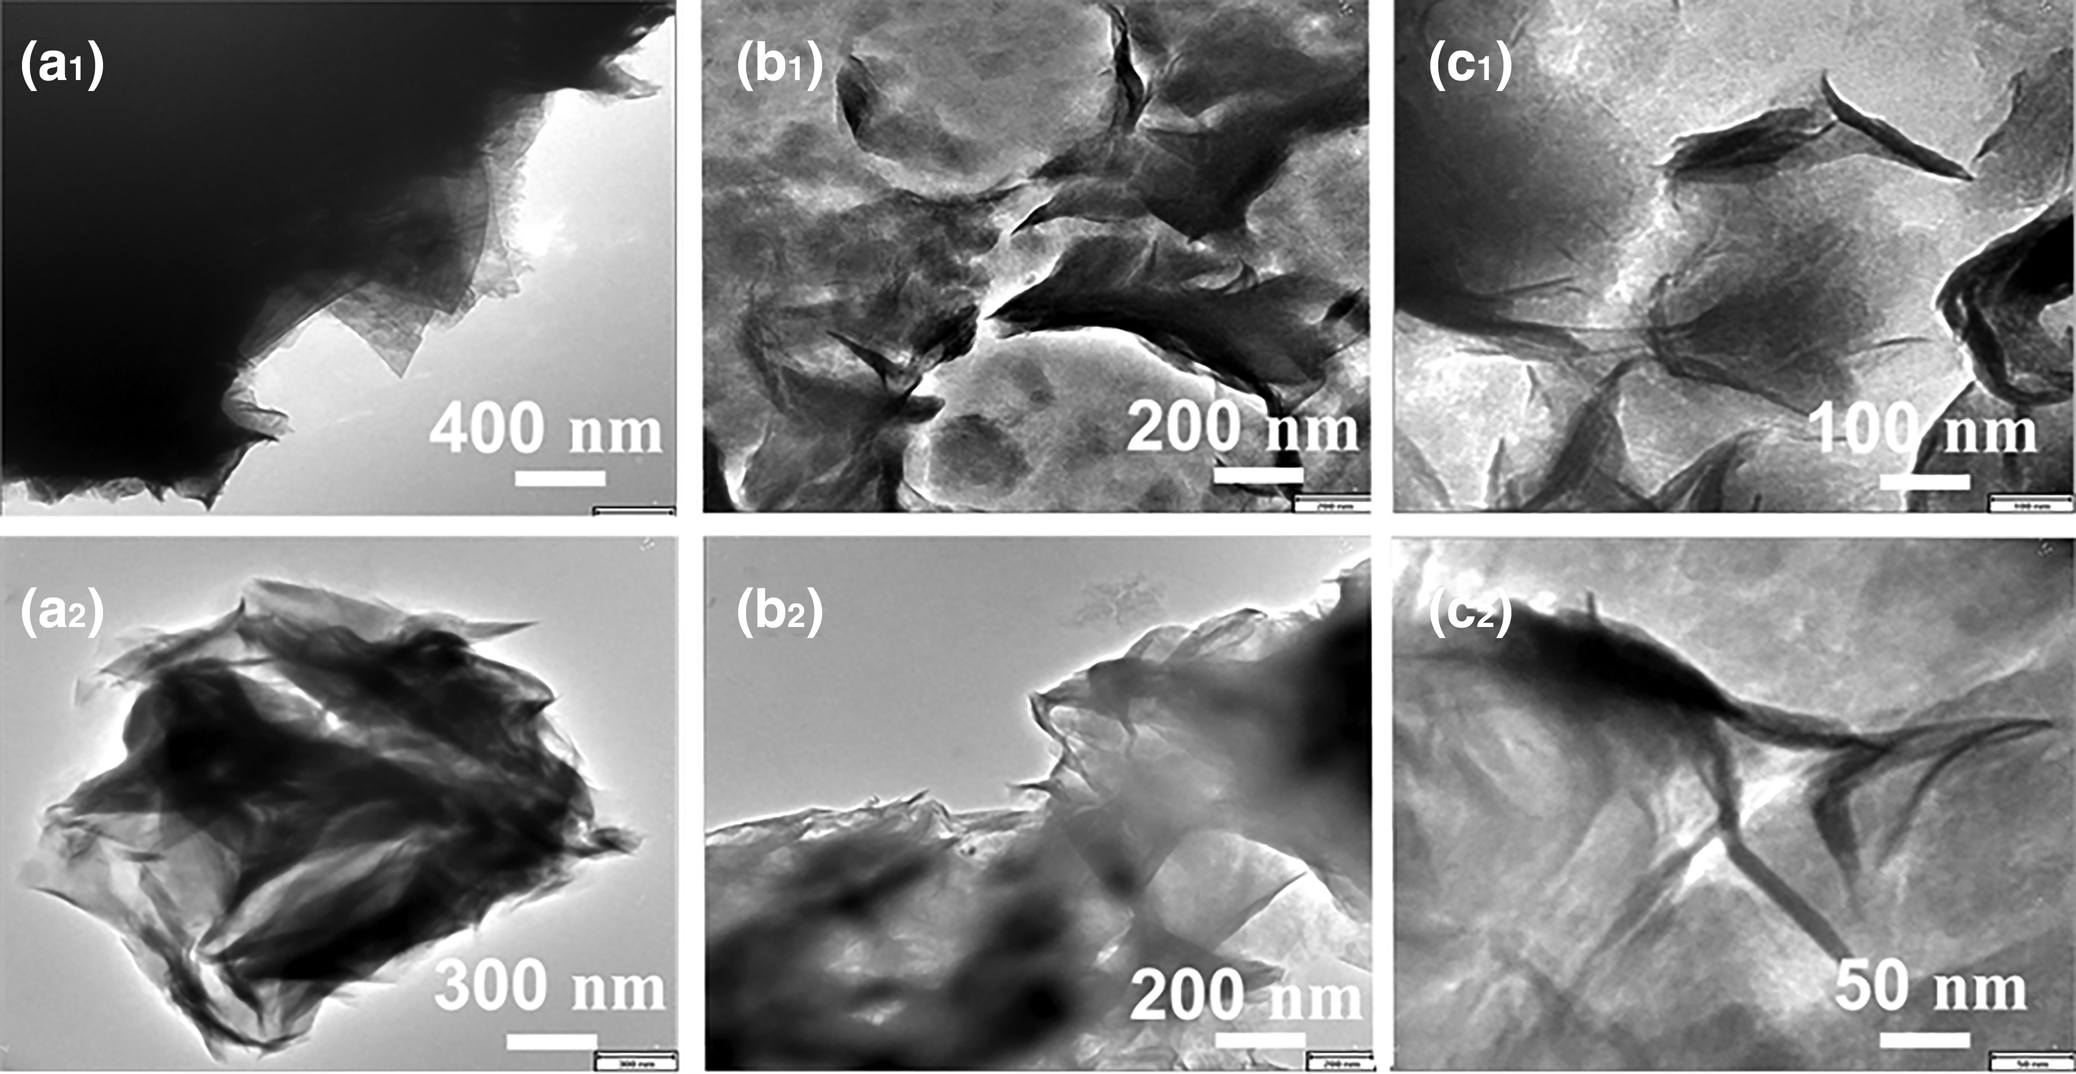
Fig. 13. TEM images of (a1 & a2) NC, (b1 & b2) H2SO4-activated clay and (c1 & c2) HCl-activated clay.
Effect of acid treatment on catalytic activity
The olefin separation performances of the NC and acid-treated samples are compared in Fig. 14, whereby the conversion (%) of olefins was determined according to Equation 1. Acid treatment had a significant impact on the catalytic activity of the bentonite, such that the number of Lewis acid sites of the clay increased, leading to a several-fold decrease in the operating time compared to that of NC. The NC did not reduce the BI value to <20, while the acid-activated samples were effective in this respect. In addition, HClA demonstrated a better conversion rate of olefins than did HSA. Hence, acid treatment with HCl created a greater number of acid sites than did H2SO4, which agrees strongly with the characterization results.
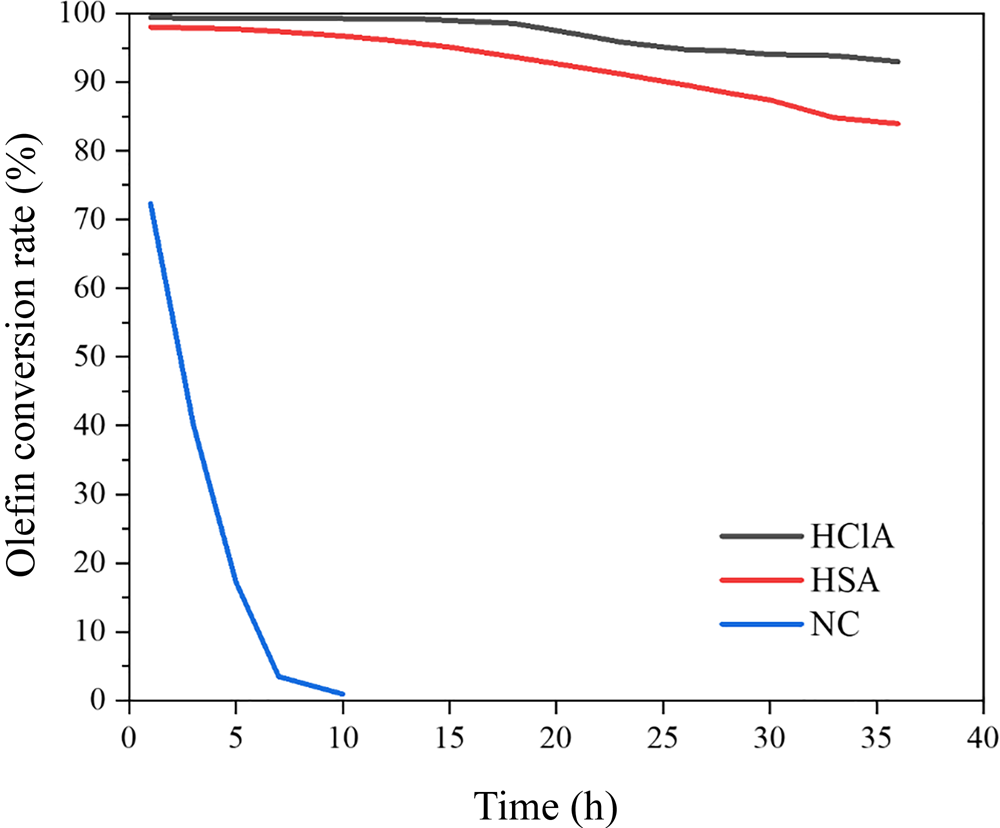
Fig. 14. Effect of the acid-treatment procedure on the conversion of olefins.
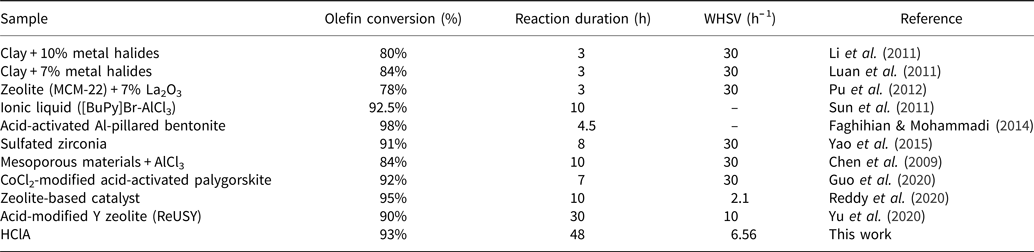
The conversion rate of olefins decreased with time, probably due to deactivation of acid sites, especially Lewis acid sites. Previous work has shown that N-formylmorpholine, morpholine and water, which exist in the feed stream of the reactor, act as poisons for the clay and deactivate the Lewis acid sites (Rouhani & Farhadi, Reference Rouhani and Farhadi2020). Therefore, the conversion of olefins is reduced with time. The original bentonite had a small number of acid sites (Table 6); therefore, it converted olefins only by 73% and was deactivated after ~10 h (Fig. 14). A comparison between the clays prepared in this study and materials from similar studies is given in Table 7. The HClA from this study obtained an olefin conversion rate of ~93% after 48 h under a WHSV of 6.56 h–1, which is much greater than that reported in the literature with expensive materials and extensive preparation methods (Li et al., Reference Li, Luan, Zeng and Shi2011; Luan et al., Reference Luan, Li and Shi2011; Pu et al., Reference Pu, Liu, Jiang and Shi2012). Therefore, HClA may be used at a commercial scale due to the simplicity of its activation and its facile preparation. As HClA can maintain olefin conversion for a longer period of time than HSA, deactivation of clay would be delayed and, consequently, the annual amount of disposed deactivated clay would be reduced. Hence, this material is environmentally friendly and cost-effective for industrial use.
Table 7. Comprehensive comparison of the olefin removal rates of the prepared special clays with results from the literature.
Summary and conclusions
The removal of olefins from a hydrocarbon mixture was successfully accomplished due to the catalytic and adsorption ability of an acid-activated bentonite. The performance of activated clays (HClA and HAS) was compared with a natural clay by means of several analytical methods, namely BI conversion (%), XRD, XRF, BET specific surface area, pyridine-FTIR, SEM and TEM. The acid treatment produced acid sites in the montmorillonite interlayer via replacement of Na, Ca and K by H+. The HClA sample was more effective for the removal of olefins from aromatics than its counterparts. This sample showed more extensive replacement of interlayer cations by H+ and a more pronounced increase in the montmorillonite 001 basal spacing than did the HSA sample. Acid treatment with HCl increased the BET specific surface area and total pore volume to a greater extent than did acid treatment with H2SO4. The HCl-activated clay had sharper absorbance intensities in the FTIR spectra after sorption of pyridine due to its greater number of acid sites compared to the other samples. The edges of the flakes in the NC were eroded by acid treatment, producing wider pores and thinner sheets. Overall, these characterization results are complementary with those of the catalytic performance test. Treatment of clays with HCl is more efficient than treatment with H2SO4 for removing olefinic components from a mixed stream of hydrocarbons. This study demonstrated the effect of activation with various acids on bentonites and introduced a cost-effective, environmentally friendly and simple method in comparison with previous studies.
Supplementary material
To view supplementary material for this article, please visit https://doi.org/10.1180/clm.2021.32.