


Halloysite is a 1:1 dioctahedral clay mineral and a polytype of kaolinite (Guggenheim et al., Reference Guggenheim, Adams, Bain, Bergaya, Brigatti and Drits2006; Drits et al., Reference Drits, Sakharov and Hillier2018). One of the main characteristics that differentiates halloysite from kaolinite is its tubular morphology (Velde & Meunier, Reference Velde and Meunier2008). This feature improves significantly its technological properties, resulting in a greater surface area and the presence of a lumen. The tubular morphology can be classified as polygonal or cylindrical, the latter having improved technological characteristics, but both types have been used in industry (Hillier et al., Reference Hillier, Brydson, Delbos, Fraser, Gray and Pendlowski2016).
Because of its tubular morphology and natural origin, halloysite (or halloysite nanotubes (HNTs)) is more cost-effective and environmentally friendly than artificial nanotubes (e.g. of carbon). Since 2005, studies of the applications of halloysite have increased exponentially with an emphasis on the pharmaceutical sector, in which the mineral has been used and studied as an active agent carrier (Churchman et al., Reference Churchman, Pasbakhsh and Hillier2016). The mineral also gained attention recently due to the presence of heavy rare earth elements (HREEs) in its lumen, giving rise to regolith-hosted HREE deposits (Li et al., Reference Li, Zhou and Williams-Jones2019; Li & Zhou, Reference Li and Zhou2020).
The mineral is composed of a tetrahedral sheet of Si4+O4, where Si can be replaced by Al3+ in minor proportions, an octahedral sheet of oxygen-surrounded Al3+ that can be replaced by Fe3+ or Fe2+ and an interlayer region with water molecules (Joussein et al., Reference Joussein, Petit, Churchman, Theng, Righi and Delvaux2005). Theoretically, Ti4+ could also replace Al3+ in the octahedral sheet, but Weaver (Reference Weaver1976) showed that this cation is associated with nanocrystals of rutile. The hydration state of the interlayer allows us to classify halloysite as halloysite-7Å (Al2Si2O5(OH)4), a fully dehydrated state of halloysite, or halloysite-10Å (Al2Si2O5(OH)4.2H2O), which represents a fully hydrated state of halloysite.
Halloysite deposits around the world are formed mostly by hydrothermal alteration, but also by weathering processes, and not by sedimentary processes, which generate kaolinite-type deposits (Prasad et al., Reference Prasad, Reid and Murray1991; Wilson & Keeling, Reference Wilson and Keeling2016). The main world-class halloysite deposits are at Dragon Mine (USA) (Kildale & Thomas, Reference Kildale and Thomas1957; Morris, Reference Morris1964, Reference Morris1985), Matauri Bay (New Zealand) (Brathwaite et al., Reference Brathwaite, Christie, Faure, Townsend and Terlesk2012), Guizhou, Yunnan and Hunan provinces (China) (Wilson, Reference Wilson2004) and Biga Peninsula (Turkey) (Ece et al., Reference Ece, Schroeder, Smilley and Wampler2008).
Kaolin deposits hosted by pegmatites around the world include the Bombowha deposit (Ethiopia) (Fentaw & Mengistu, Reference Fentaw and Mengistu1998), Hagendorf Pleystein Pegmatite Province (Germany) (Dill et al., Reference Dill, Dohrmann, Kaufhold and Balaban2015), Swat deposits (Pakistan) (Saddiqui & Ahmed, Reference Saddiqui and Ahmed2005) and the Spruce Pine deposit in the USA (Parker, Reference Parker1946). Halloysite occurs only in the Bombowha and Swat deposits, where it is mixed with kaolinite.
In Brazil, the occurrence of halloysite appears to be restricted to the south-eastern and southern regions of the country. In the north and northeast, no halloysite was detected in the kaolin sedimentary deposits of Capim River (Sousa et al., Reference Sousa, Varajão, Yvon and Da Costa2007) or Jari River (Montes et al., Reference Montes, Melfi, Carvalho, Vieira-Coelho and Formoso2002), nor in the Borborema Pegmatite Province (Salgado-Campos et al., Reference Salgado-Campos, Bertolino and Alves2017, Reference Salgado-Campos, Bertolino, Nascimento, Leite, Brandão, Alves and Tolentino2019). The occurrences of halloysite in southern and south-eastern Brazil include those of the states of Minas Gerais (Tolentino, Reference Tolentino2019), Espírito Santo (Wilson et al., Reference Wilson, Souza Santos and Souza Santos2006), São Paulo (Wilson et al., Reference Wilson, Santos and Santos1998), Paraná (Oliveira et al., Reference Oliveira, Furtado, Formoso, Eggleton and Dani2007), Santa Catarina (Wilson et al., Reference Wilson, Santos and Santos1998), Rio Grande do Sul (Wilson et al., Reference Wilson, Souza Santos and Souza Santos2006) and Rio de Janeiro. In the state of Rio de Janeiro, halloysite was found in the cities of Magé, Valença (Visconti & Nicot, Reference Visconti, Nicot, De Andrade and Villanova1956), Sapucaia, Petrópolis (Visconti & Nicot, Reference Visconti and Nicot1957), Itatiaia, Araruama (Souza Santos et al., Reference Souza Santos, Souza Santos and Moniz1962), Rio Bonito (Santos, Reference Santos2017; Salgado-Campos et al., Reference Salgado-Campos, Bertolino, Silva and Mendes2020) and in the city of Rio de Janeiro (Souza Santos & Pimentel, Reference Souza Santos and Pimentel1971) (Fig. 1a,b). However, the lack of detailed geological and evaluation studies concerning the occurrences of halloysite in the state has meant that the real potential of Rio de Janeiro in hosting this type of halloysite deposit remains unknown. Thus, a systematic mineral exploration study was conducted on the aforementioned occurrences and a few were found to be feasible halloysite deposits (Salgado-Campos et al., Reference Salgado-Campos, Bertolino, Silva and Mendes2020). Nevertheless, a new pegmatite body that meets the size and halloysite-grade requirements may have economic potential, and its description is the primary objective of the present report.
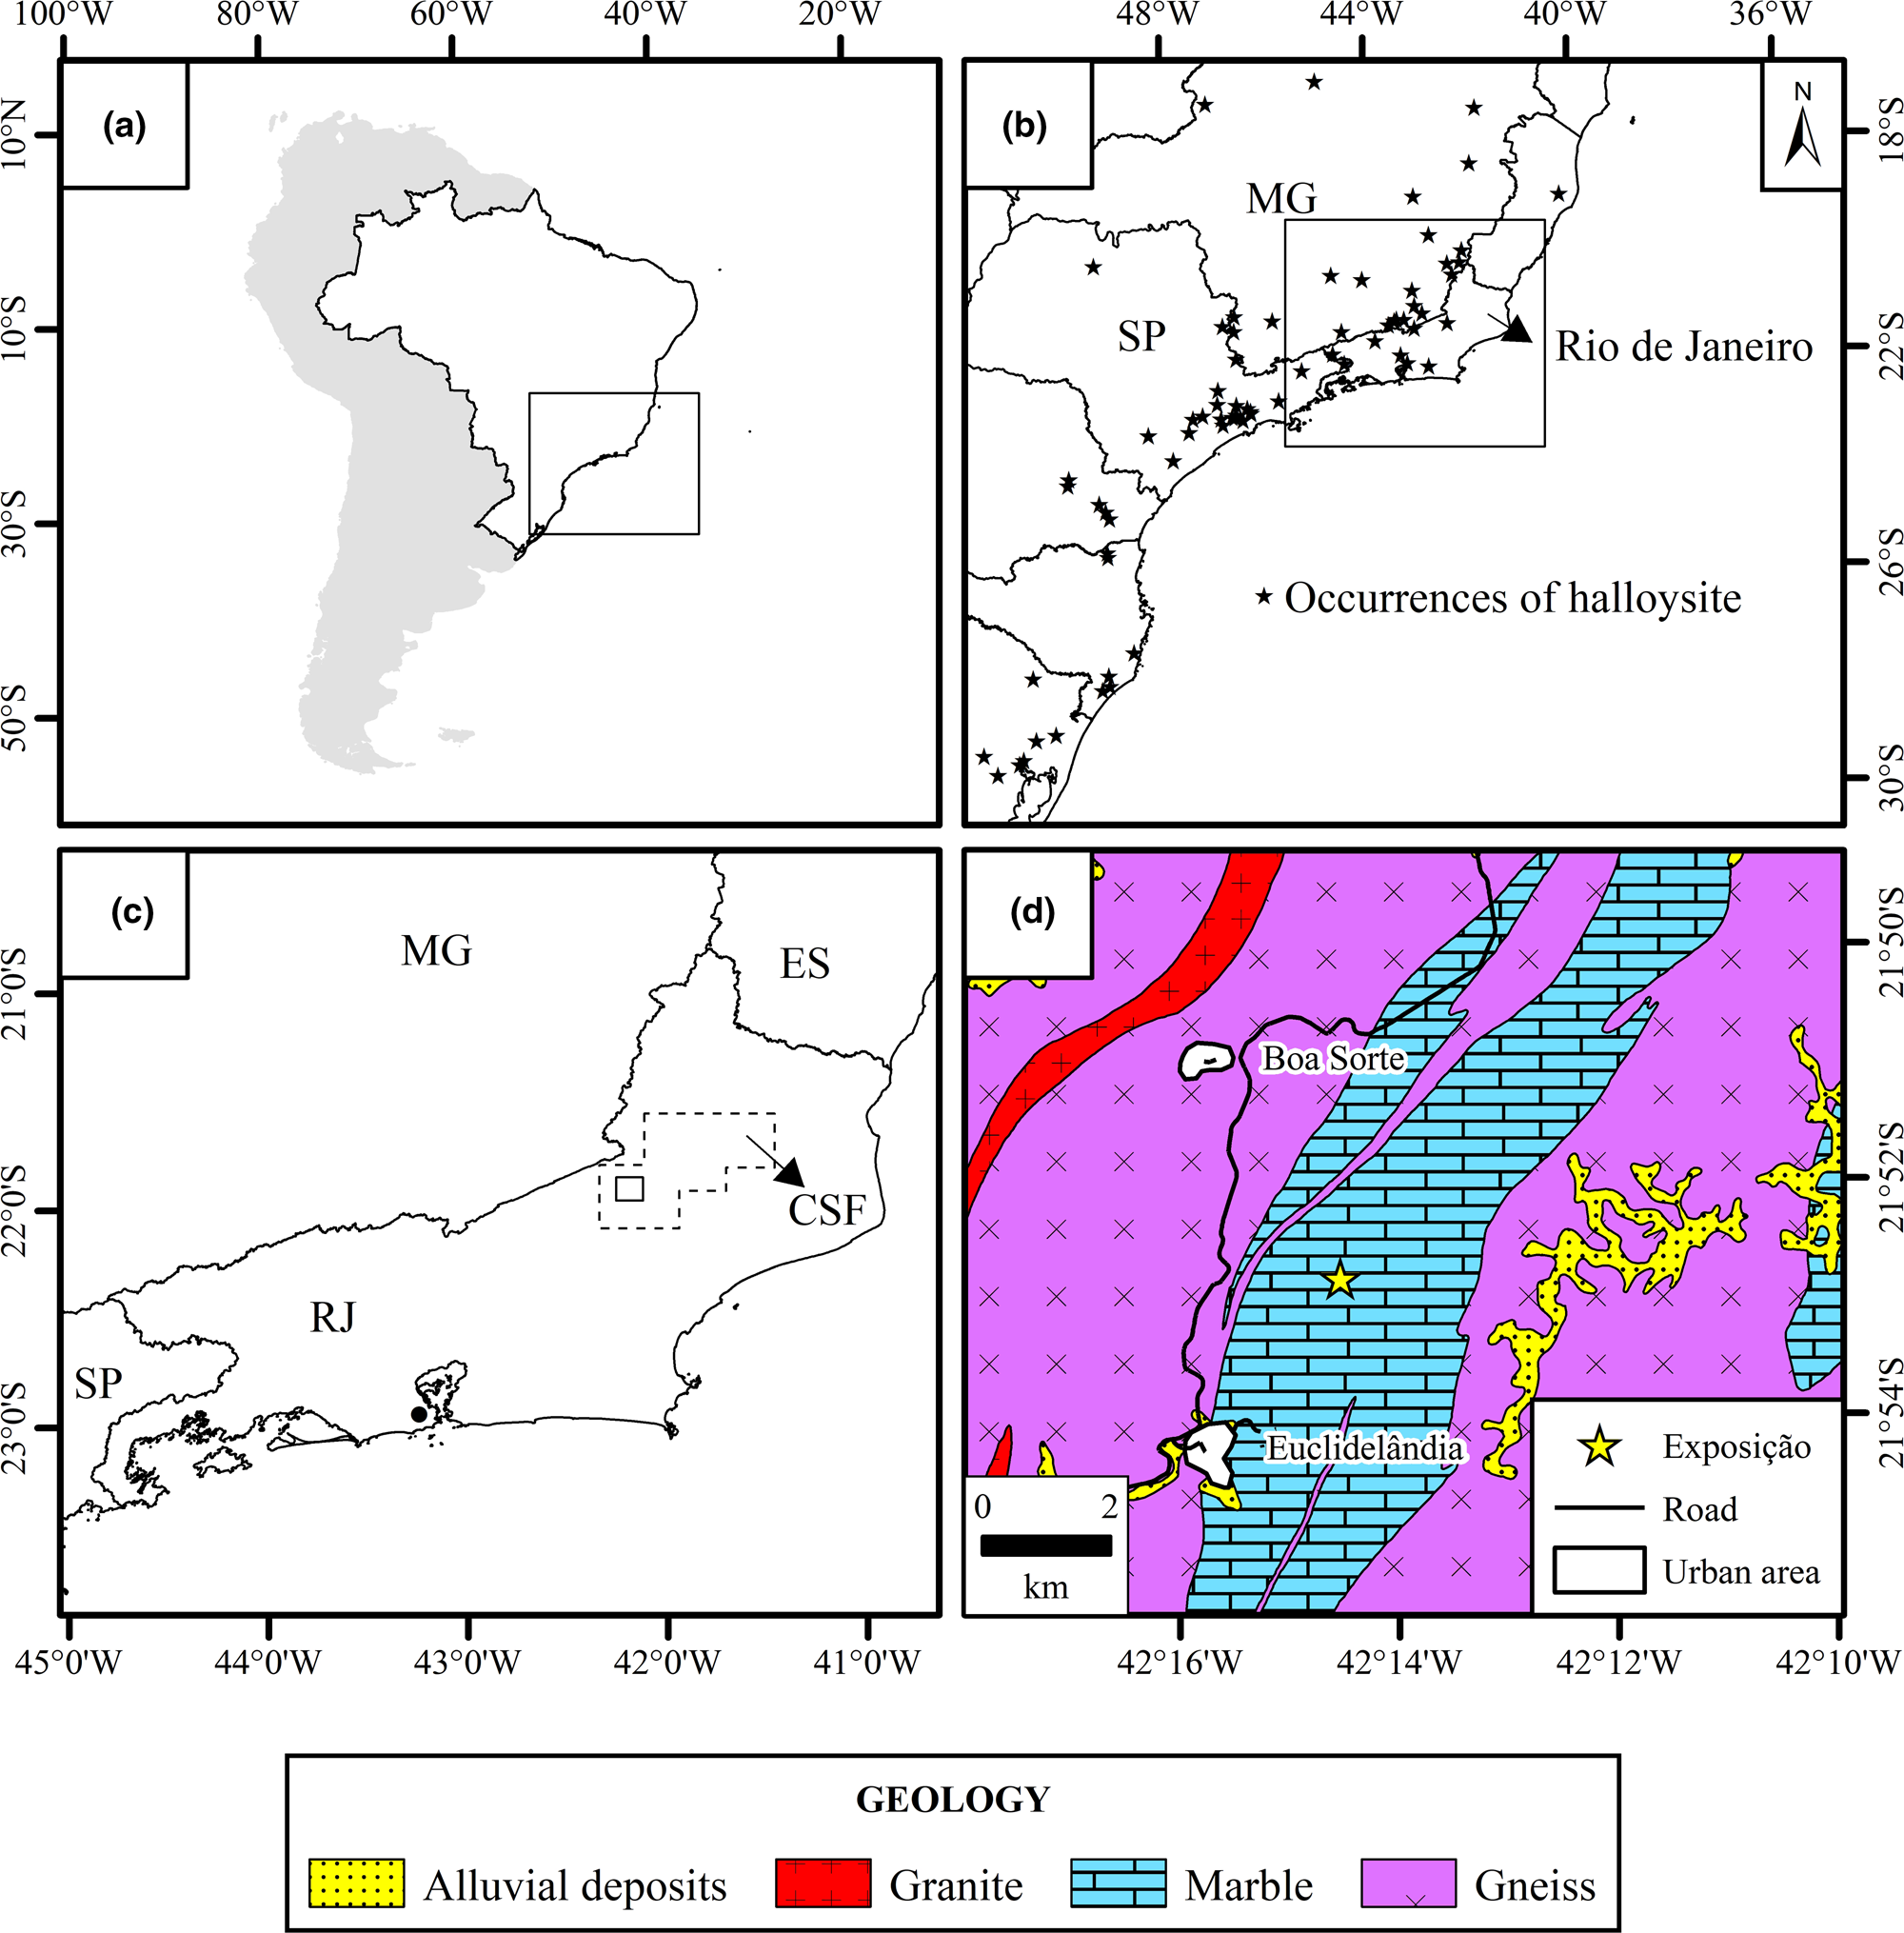
Fig. 1. Location of the Exposição pegmatite. (a) Location of the Exposição pegmatite in South America. (b) Compilation of deposits and halloysite occurrences in the south and south-east regions of Brazil (based on Paiva et al., Reference Paiva1956; Visconti & Nicot, Reference Visconti, Nicot, De Andrade and Villanova1956, Reference Visconti and Nicot1957; Souza Santos et al., Reference Souza Santos, Souza Santos and Moniz1962, Reference Souza Santos, Souza Santos and Brindley1964, Reference Santos P., Toledo and Souza Santos2009; Angeleri et al., Reference Angeleri, Souza Santos and Souza Santos1963; Pimentel, Reference Pimentel1966; Souza Santos & Pimentel, Reference Souza Santos and Pimentel1971; Azevedo & Souza Santos, Reference Azevedo and Souza Santos1975; Campos & Souza Santos, Reference Campos and Souza Santos1986; Wilson et al., Reference Wilson, Santos and Santos1998, Reference Wilson, Souza Santos and Souza Santos2006; Toledo et al., Reference Toledo, Souza Santos and Souza Santos2002; Oliveira et al., Reference Oliveira, Petit, Grauby, Formoso and Trescases1997, Reference Oliveira, Furtado, Formoso, Eggleton and Dani2007; Santos, Reference Santos2017; Tolentino, Reference Tolentino2019). (c) Location of the Cantagalo-São Fidélis (CSF) area, represented by a polygon, in the Rio de Janeiro Pegmatite Province (modified from Menezes, Reference Menezes, Schobbenhaus, Queiroz and Coelho1997). (d) Geological map (modified from Heilbron et al., Reference Heilbron, Eirado and Almeida2016) of the region showing the location of the Exposição pegmatite (21°52′56′'S; 42°14′36′'W). ES = Espírito Santo; MG = Minas Gerais; RJ = Rio de Janeiro; SP = São Paulo.
Geological context
The pegmatite studied here, referred to as Exposição, is in the Rio de Janeiro Pegmatite Province (Menezes, Reference Menezes1982, Reference Menezes, Schobbenhaus, Queiroz and Coelho1997), Cantagalo-São Fidélis area. Four additional areas in the Pegmatite Province were included: Niterói-Rio Bonito, Paraíba do Sul, Casemiro de Abreu-Glicério and Barra Mansa-Barra do Piraí (Fig. 1c,d). The Cantagalo-São Fidélis area covers ~3300 km2, where 33 pegmatites were catalogued by Menezes (Reference Menezes1982), although this did not include the one described here. The Exposição pegmatite is exposed in an outcrop that is ~60 m long, 10 m high and with an undetermined width. The pegmatite was classified as a mixed pegmatite following Silva & Dantas (Reference Silva and Dantas1997) because of the presence of dispersed cm-sized mica zones, its graphic texture and the widespread garnet crystals.
Materials and methods
Seven channel samples with lengths between 2.0 and 4.2 m were collected from the newly discovered Exposição pegmatite (Fig. 2). A standard halloysite sample from Sigma-Aldrich (685445-100G/Chemical Abstracts Service (CAS) Number 1332-58-7) was analysed for comparative purposes.

Fig. 2. Channel sampling sites located along the face of the pegmatite. (a) Overview of the outcrop of Exposição pegmatite. (b) Overview of the right part of the outcrop with the location of horizontal channels, where the samples A, B and C were collected. (c) The right part of the outcrop, where sample A was collected in a 4 m-long channel. (d) Sampling location of sample B in a channel 4.2 m long. (e) The left part of the outcrop, where sample D was collected in a horizontal channel 2 m long. (f) Detail of the left part of the outcrop. (g) Sampling location of sample F on the left part of the outcrop. (h & i) Close views of the segments where samples G and F were collected in horizontal 2.0 and 2.5 m channels, respectively. (j) Details of the kaolin occurrence in the pegmatite.
The samples were dried at 60°C for 24 h before jaw crushing at 2 mm followed by homogenization and quartering in aliquots of 1 kg. Smaller aliquots were processed cyclically for bulk samples in a vibratory agate ring mill for 30 s at 700 rpm to obtain fractions of <106 μm, which were then processed in a McCrone agate mill for 10 min using water to obtain <10 μm bulk fractions for quantitative mineral and chemical analyses. Aliquots of 1 kg were wet-sieved at 20 μm before the separation of the clay fractions (<2 μm) using Stokes’ law (Moore & Reynolds, Reference Moore and Reynolds1989). The use of an ultrasonic bath and the addition of sodium hexametaphosphate (3 mg g–1) to clay–water suspensions ensured adequate dispersion.
The mineralogy of the bulk and clay fractions was quantified using the Rietveld method and the fundamental parameters approach (Cheary & Coelho, Reference Cheary and Coelho1992). Diffraction patterns were obtained with Bruker-AXS D4 Endeavor equipment, using filtered Co-Kα (λ = 1.79021 Å) radiation operated at 40 kV and 40 mA with a step size of 0.01°2θ and a cumulative acquisition time of 184 s step–1 with a LynxEye position-sensitive detector in the range from 4 to 105°2θ. The quantitative mineral analysis was performed using the Bruker-AXS TOPAS v5 software, sourcing structures from the International Centre for Diffraction Data (ICDD) database (2019) and the Crystallography Open Database (COD). The mineral structures used were montmorillonite (COD 900277; Viani et al., Reference Viani, Gualtieri and Artioli2002), muscovite (ICDD 04-015-8226; Brigatti et al., Reference Brigatti, Guidotti, Malferrari and Sassi2008), kaolinite (ICDD 00-014-0164 BISH; Goodyear & Duffin, Reference Goodyear and Duffin1961), quartz (ICDD 00-046-1045; Kern & Eysel, Reference Kern and Eysel1993), microcline (ICDD 00-019-0926; Technisch Physische Dienst, 1966), albite (ICDD 00-019-1184; Technisch Physische Dienst, 1967), calcite (modified; Santos et al., Reference Santos, Neumann and Ávilla2017), dolomite (modified; Santos et al., Reference Santos, Neumann and Ávilla2017) and alunite (COD 9012350; Schukow et al., Reference Schukow, Breitinger, Zeiske, Kubanek, Mohr and Schwab1999). The abbreviations for the names of rock-forming minerals were based on Whitney & Evans (Reference Whitney and Evans2010) and Warr (Reference Warr2020). Detailed information regarding the refinement parameters may be found in the Supplementary Materials.
Oriented samples on glass slides were produced following Moore & Reynolds (Reference Moore and Reynolds1989) to characterize the clay mineral assemblages. The slides were measured in the air-dried state, following ethylene glycol solvation for 16 h and after heating at 550°C for 2 h. Diffraction patterns were obtained using a Bruker-AXS D8 Advance ECO diffractometer with a LynxEye XE energy-discriminant position-sensitive detector and unfiltered Cu-Kα radiation (λ = 1.5406 Å) operated at 40 kV and 25 mA with a step size of 0.01°2θ and a cumulative acquisition time of 92 s step–1. A dynamic beam optimization (DBO) device was used.
Random mounted samples were produced by backloading and analysed in the Bruker-AXS D8 Advance ECO equipment with a step size of 0.02°2θ and a cumulative acquisition time of 92 s step–1 between 4 and 70°2θ, which was used to determine the 060 reflections. The type of tubular halloysite morphology was assessed using the cylindrical–polygonal (CP) index proposed by Hillier et al. (Reference Hillier, Brydson, Delbos, Fraser, Gray and Pendlowski2016), analysing the region between 2.2 and 2.7 Å.
Chemical analyses were carried out by X-ray fluorescence spectrometry using a PanAnalytical Axios Max spectrometer. Samples were prepared in a VANEOX press with a 30 mm-diameter mould and a pressure of 20 tons for 30 s using boric acid (0.5 g g–1) as a binder. Rare earth elements (REEs) Y, Th and U were analysed using inductively coupled plasma mass spectrometry (ICP-MS) following the lithium metaborate fusion method (IMS95R) at the SGS Geosol Laboratories LTDA in Brazil.
A Pearson correlation matrix was constructed using the mineralogical, chemical and technological data (Table S3). The obtained values were classified following Table 1.
Table 1. Ranges of values used in this work to classify the Pearson correlation coefficients.

Scanning electron microscopy was performed on a Quanta 250 field emission gun scanning electron microscope at the Military Institute of Engineering at an accelerating voltage of 25 kV. The samples were silver sputtered before analysis.
Fourier-transform infrared (FTIR) spectra were obtained using a Nicolet 6700 spectrometer at the Institute of Chemistry of the Federal University of Rio de Janeiro. The equipment has a diffuse reflectance accessory and spectra were obtained in the range from 4000 to 400 cm–1 through co-addition of 64 scans with a resolution of 4 cm–1. Pellets were prepared with 1% of the sample and 99% of KBr.
Particle-size analysis was carried out on the clay fractions using a Malvern Mastersizer 2000 instrument. Suspensions with 30 mL of distilled water (with 3 mg g–1 sodium hexametaphosphate) and 0.5 g of clay-sized samples were prepared by ultrasonication. Nitrogen physisorption analyses were performed using a Micromeritics TriStar II PLUS instrument at –196°C (77K). The samples were pre-treated in a Micromeritics VacPrep 061 instrument at 120°C under vacuum (10–6 mmHg) for 24 h. The isotherms were obtained with 50 points performed during adsorption and desorption. Specific surface areas were calculated using the Brunauer–Emmett–Teller (BET) method (Brunauer et al., Reference Brunauer, Emmett and Teller1938) and porosity graphs were obtained following the Barrett–Joyner–Halenda (BJH) method (Barrett et al., 1951). Cation-exchange capacity (CEC) values were obtained using the methylene blue method described by ASTM C837-09 (2009).
Results
Bulk mineralogy
Quantitative mineral analysis (X-ray diffraction/Rietveld method)
Dioctahedral mica was determined by diagnostic reflections at 10 Å (001) and 5 Å (002), and its abundance ranged from 9.4% (sample F) to 21.4% (sample E). Diagnostic reflections of kaolin minerals were close to 7.00 Å (001) and 3.56 Å (002), amounting to between 6.3% (sample E) and 35.4% (sample A). Quartz was identified by reflections at 4.25 and 3.34 Å varying from 29.5% (sample E) to 50.1% (sample F). K-feldspar was identified by reflections at 6.48 and 3.24 Å, ranging from 6.4% (sample B) to 40.2% (sample E), and plagioclase was identified by reflections at 3.18 Å varying from 1.4% (samples F and G) to 14.8% (sample C) (Fig. 3, Table 2).
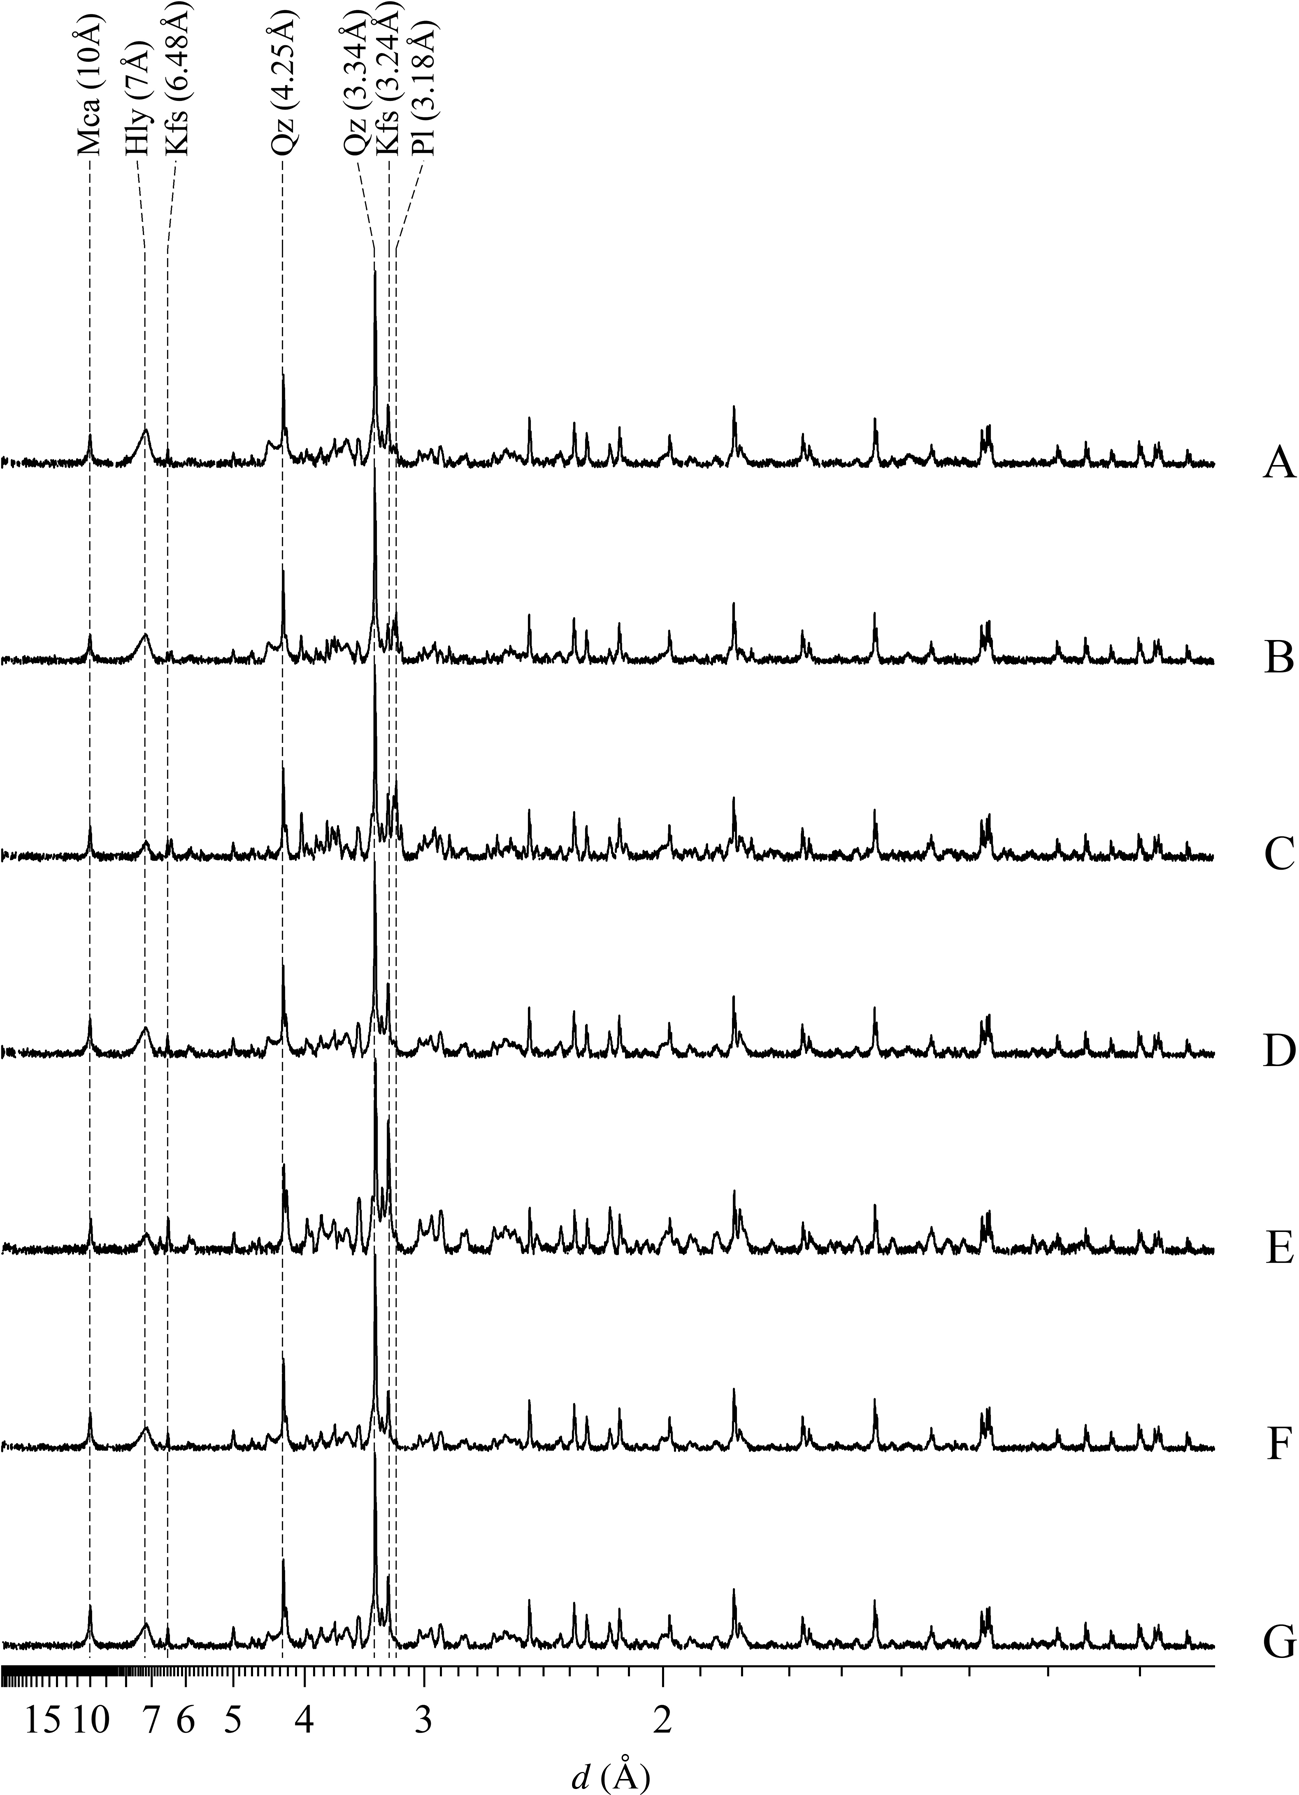
Fig. 3. XRD traces (background subtracted) of the bulk samples used in the quantitative mineral analyses by Rietveld refinement. The y-axis is on the square root scale and the diffraction traces were normalized by maximum reflection. The unprocessed data can be found in the Supplementary Materials. Hly = halloysite-7Å; Kfs = K-feldspar; Mi = mica; Pl = plagioclase; Qz = quartz.
Table 2. Quantitative mineral and chemical analyses of the bulk samples. See refinement reports and Table S1 in the Supplementary Materials for more details.

Major elements by X-ray fluorescence
Chemical compositions calculated from quantitative mineral analyses were compared to chemical assays by X-ray fluorescence to evaluate the quality of the mineral quantification using the Rietveld method. Taking all samples together, the Pearson correlation index was 0.996, while R 2 reached 0.993 (Fig. 4). However, it is appropriate to acknowledge uncertainties concerning the SiO2 and Al2O3 contents.

Fig. 4. Correlation diagrams showing the chemical compositions calculated from quantitative mineral analyses using the Rietveld method against chemical assays by X-ray fluorescence (XRF). Assumed mineral compositions may be found in Tables S1 and S2. (a) Square root-scale graph of the bulk samples. (b) Square root-scale graph of the clay fractions. (c) Linear-scale graph of the bulk samples. (d) Linear-scale graph of the clay fractions.
Major element values of the bulk samples are listed in Table 2. The Pearson correlation matrix (Table S3) shows that halloysite-7Å presented a strong positive correlation with MgO (0.83) and loss on ignition (LOI; 0.73) and a strong negative correlation with SiO2 (–0.71). K-feldspar abundance has a very strong correlation with K2O (0.99) and a strong negative correlation with MgO (–0.74), whereas plagioclase content showed very strong positive correlations with CaO (1.00), Na2O (0.99) and MnO (0.90) and a strong positive correlation with Fe2O3 (0.81).
Rare earth elements
The REE contents of the bulk samples are listed in Table 3, in which the ΣHREE contents are higher than the ΣLREE contents in samples B, C, F and G and the Sigma standard. The REE abundance (ΣREE) showed a very strong positive correlation with plagioclase (0.93), while only Eu presented a strong positive correlation with the total feldspar content (0.82) (Table S3). In addition, it is well known that the main REE carriers are phosphate minerals, which were not determined in the bulk mineralogy of the samples because these minerals are generally accessories. Concerning the major elements, ΣREE showed very strong positive correlations with Na2O (0.94) and CaO (0.91) and a strong positive correlation with Fe2O3 (0.85).
Table 3. REEs, U and Th analysis (ppm) of the bulk fractions of the Exposição pegmatite.

Clay mineralogy
Clay mineral assemblages
Halloysite-7Å was identified by reflections at 7.26 Å, which did not change after treatment with ethylene glycol and collapsed after heating at 550°C (Fig. 5a,b,c). Illite was determined by reflections at 10 Å, which changed neither after ethylene glycol solvation nor after heating at 550°C. Smectite was only identified in the Sigma standard sample by a reflection at 17 Å after ethylene glycol treatment (Brindley & Brown, Reference Brindley and Brown1980).
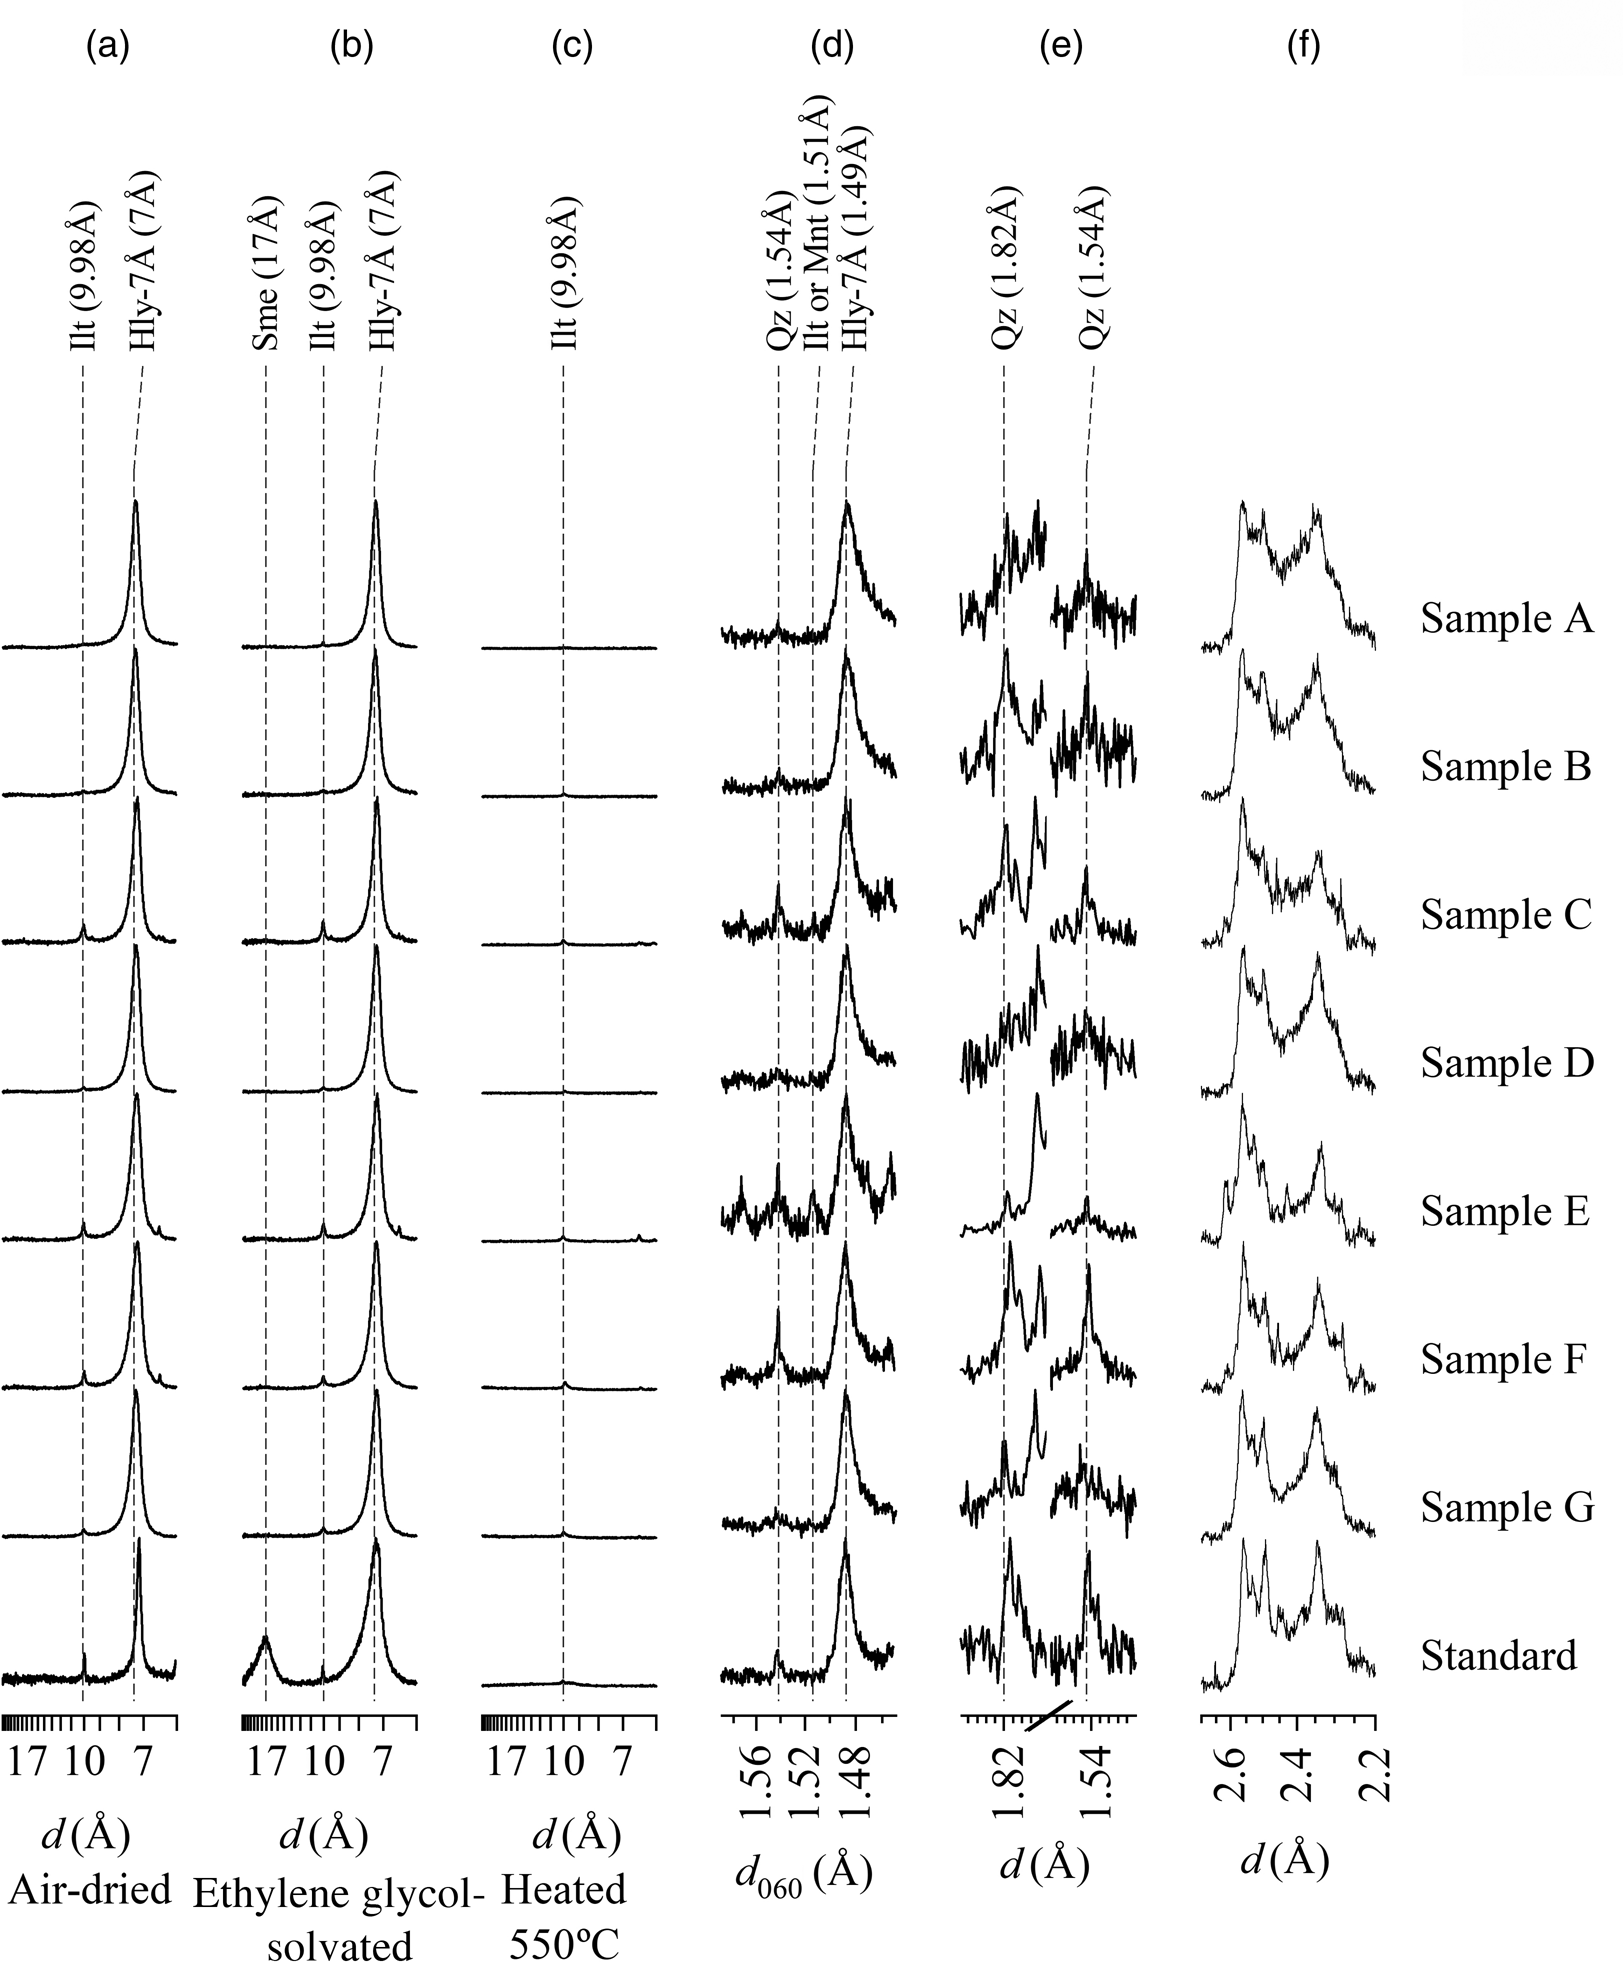
Fig. 5. XRD traces (background subtracted) of the oriented clay fractions mounted on glass slides. The unprocessed data can be found in the Supplementary Materials. (a) Air-dried oriented samples normalized by maximum intensity. (b) Ethylene glycol-solvated oriented samples with diffraction traces normalized by maximum intensity. (c) Oriented sample heated at 550°C normalized by maximum intensity of the air-dried oriented samples. (d) Randomly mounted samples in the region from 1.59 to 1.45 Å to evaluate the d 060 reflections with diffraction patterns normalized by maximum intensity. (e) Randomly mounted samples to evaluate whether the d 060 reflections at 1.54 Å are associated with quartz or another trioctahedral clay mineral, following Moore & Reynolds (Reference Moore and Reynolds1989), with diffraction traces normalized by maximum intensity. (f) Randomly mounted samples to assess the tubular character of halloysite (Hillier et al., Reference Hillier, Brydson, Delbos, Fraser, Gray and Pendlowski2016), with diffraction traces normalized by maximum intensity. Ilt = illite; Hly-7Å = halloysite-7Å; Mnt = montmorillonite; Qz = quartz; Sme = smectite.
The halloysite-7Å phase has a reflection at 1.49 Å, representing the 060 reflections, whereas illite and smectite have reflections at 1.50 Å, suggesting that montmorillonite is the smectite species (Fig. 5d). The 1.54 Å reflection is attributed to quartz, which has a similar intensity to that of the 1.82 Å quartz reflection (Fig. 5e) (Moore & Reynolds, Reference Moore and Reynolds1989).
The region between 2.2 and 2.7 Å could be used to classify the type of tubular halloysite (Hillier et al., Reference Hillier, Brydson, Delbos, Fraser, Gray and Pendlowski2016) (Fig. 5f). The CP values ranged from 0.16 to 0.35, indicating mixed polygonal/cylindrical halloysite crystals (Table 4) (Hillier et al., Reference Hillier, Brydson, Delbos, Fraser, Gray and Pendlowski2016). The formamide method was not effective because of the dehydrated state of halloysite-7Å (Churchman et al., Reference Churchman, Whitto, Claridge and Theng1984).
Table 4. Quantitative mineral and chemical analyses (wt.%) of the clay fractions. See refinement reports and Table S2 in the Supplementary Materials for more details.

Quantitative mineral analysis (X-ray diffraction/Rietveld method)
Concerning the quantitative mineral analysis of the <2 μm fractions, values from 58.0% (sample E) to 89.8% (sample A) were obtained for halloysite-7Å, from 5.4% (samples A and B) to 8.7% (F) for illite, from 0.7% (sample A) to 6.5% (sample F) for quartz and from 4.0% (sample B) to 30.1% (sample E) for K-feldspar (Fig. 6, Table 4). Plagioclase was only identified in sample C at 12.9%. For the Sigma standard, 1.0% montmorillonite, 4.1% illite, 83.8% halloysite-7Å, 5.9% gibbsite, 1.8% quartz, 0.9% calcite, 1.5% dolomite and 0.9% alunite were quantified.

Fig. 6. XRD traces (background subtracted) of the clay fractions used in the quantitative mineral analyses by the Rietveld method. The square root scale is used for the y-axis and the diffraction traces are normalized by maximum intensity. The unprocessed data can be found in the Supplementary Materials. Hly-7Å = halloysite-7Å; Ilt = illite; Kfs = K-feldspar; Mnt = montmorillonite; Pl = plagioclase; Qz = quartz.
Major elements by X-ray fluorescence
The Pearson correlation index was 0.998, whereas the R 2 index was 0.995 when the calculations included all of the samples (Fig. 4), despite some uncertainties concerning the accuracy of SiO2 and Al2O3 measurements. The chemical analyses (major elements) of the clay fractions are listed in Table 4. Using the Pearson correlation matrix (Table S3), illite showed a very strong positive correlation with SiO2 (0.95) and a strong negative correlation with Al2O3 (–0.89). In contrast, the halloysite-7Å abundance displays a very strong positive correlation with Al2O3 (0.99), a strong positive correlation with LOI values (0.96), very strong negative correlations with K2O (–0.93) and SiO2 (–0.96) and a strong negative correlation with P2O5 (–0.75). K-feldspar has very strong positive correlations with K2O (0.98) and SiO2 (0.92), a very strong negative correlation with LOI (–0.95) and a strong negative correlation with Al2O3 (–0.81), whereas plagioclase showed very strong positive correlations with Na2O (0.97), Fe2O3 (0.94) and CaO (0.93), a strong positive correlation with P2O5 (0.88) and a strong negative correlation with MgO (–0.71).
Scanning electron microscopy
Mixed polygonal/cylindrical tubular halloysite crystals with estimated sizes close to 3 μm long and 0.3 μm in diameter were identified in all of the samples from the Exposição pegmatite as well as in the Sigma standard sample (Fig. 7). Platy crystals of kaolinite were observed in samples C and E with estimated sizes close to 4.5 μm long and 3.0 μm wide (Fig. 7b).

Fig. 7. SEM images of the clay fractions from the Exposição pegmatite. (a) Tubular halloysite cluster in sample A. (b) Tubular halloysite associated with platy kaolinite in sample C. (c) Tubular halloysite in sample D. (d) 6 μm-long tubular halloysite in sample F. (e & f) Tubular halloysite in the standard sample (S).
FTIR spectroscopy
Halloysite was determined by bands at 3695 and 3620 cm–1, which are associated with Al–OH–Al groups (Fig. 8). The lower intensity of the 3695 cm–1 band in relation to the 3620 cm–1 band indicates hydrogen bonds between OH and H2O in the interlayer space of halloysite (Joussein et al., Reference Joussein, Petit, Churchman, Theng, Righi and Delvaux2005; Madejová et al., Reference Madejová, Gates, Petit, Gates, Kloprogge, Madejová and Bergaya2017). A 3600 cm–1 band related to structural Fe3+ in the octahedral sites was not identified, indicating that there is little of this metallic cation in the structure of the halloysite.

Fig. 8. Representative FTIR spectra of sample A from the Exposição pegmatite and the standard sample (S). The unprocessed data for all samples can be found in the Supplementary Materials.
Elongated bands at 1116–1007 cm–1 were identified and are associated with Si–O groups, while the bands at 912 cm–1 mark OH-group deformations. Long bands at 533 cm–1 were assigned to Si–O–Al linkages, while bands at 793 and 430 cm–1 are interpreted as Fe–OH–Fe and Si–O–Si bands, respectively (Erkoyun & Kadir, Reference Erkoyun and Kadіr2011).
Particle-size distribution
Particle-size distribution analyses were performed in order to assess the efficiency of the classification by suspension (<2 μm) following Stokes' law, and to compare them with the Sigma standard sample. The results from the particle-size analysis are shown in Fig. 9. The graphs of the samples from Exposição pegmatite are unimodal with peak centre values ranging from 0.955 to 1.096 μm, minimum values ranging from 0.240 to 0.316 μm and maximum values ranging from 3.311 to 4.365 μm (Table 5). Concerning the Sigma standard sample (S), the graph showed a much broader unimodal distribution, with a peak centre at 1.660 μm and minimum and maximum particle-size values of 0.209 and 11.482 μm, respectively.

Fig. 9. Particle-size distribution of the clay fractions from Exposição pegmatite and the standard sample (S). (a) Particle-size distribution (vol.%). (b) Accumulated particle-size distribution (vol.%).
Table 5. Values obtained from the particle-size distribution of the clay fractions from Exposição pegmatite and the standard sample.

Max. = maximum particle size; Min. = minimum particle size.
The volume of <2 μm particles in the samples from Exposição pegmatite ranged from 84.29 to 86.66 vol.%, while in the Sigma standard sample the volume of <2 μm particles was 66.35 vol.%.
Nitrogen physisorption and CEC
The isotherms were classified as type IV according to Sing (Reference Sing1982), which is typical of mesoporous solids, with hysteresis type H1, indicating a cylindrical porous morphology that was associated with the lumen region of halloysite (Fig. 10). The porosity diagram displays a bimodal distribution with peaks at 3.1 nm, which is associated with internal and/or surface porosity, and close to 14.1 nm, which is related to the lumen region of halloysite; for the Sigma standard sample these values were 3.1 and 11.4 nm, respectively.

Fig. 10. Representative results of the nitrogen physisorption. (a) Isotherms of samples A and the standard sample (S). (b) Porosity distribution following BJH method of sample A and the standard sample (S). STP = standard temperature and pressure.
The surface areas of the clay fractions from Exposição pegmatite were between 20 (sample C) and 33 (sample A) m2 g–1 (Table 6); the Sigma standard sample showed a surface area value of 27 m2 g–1. The porous volume ranged from 0.083 (sample E) to 0.143 (sample A) cm3 g–1. Values between 0.005 and 0.009 cm3 g–1 are related to internal and/or surface porosity, while values between 0.028 and 0.050 cm3 g–1 are associated with the lumen porosity of the halloysite. The values found for the Sigma standard samples were 0.009 and 0.039 cm3 g–1. The CEC ranged from 4.00 (sample C) to 7.75 (sample B) cmol(+) kg–1, while the Sigma standard sample CEC was 11.75 cmol(+) kg–1.
Table 6. Technological properties obtained from the nitrogen physisorption and CEC of the clay fractions.

P m = average porosity; SA BET = surface area; V p = pore volume.
Discussion
The Exposição halloysite-rich pegmatite deposit was compared, based on its mineralogical, chemical and technologically relevant properties, with the Sigma standard sample supplied by Sigma-Aldrich. These results are discussed in the context of the well-known halloysite deposits of the Campo Alegre deposit (Brazil) (Oliveira et al., Reference Oliveira, Furtado, Formoso, Eggleton and Dani2007), the Dragon Mine deposit (USA), the Matauri Bay deposit (New Zealand) (Hillier et al., Reference Hillier, Brydson, Delbos, Fraser, Gray and Pendlowski2016; Wilson & Keeling, Reference Wilson and Keeling2016) and the regolith-hosted REE deposits in Zudong (China) (Li & Zhou, Reference Li and Zhou2020) (Table 7).
Table 7. Comparison of the mineralogical, chemical and technological properties of the Exposição halloysite deposit, the Sigma-Aldrich sample, the Campo Alegre deposit in Santa Catarina (Brazil), the Dragon Mine deposit (USA), the Matauri Bay deposit (New Zealand) and the Zudong deposit (China). The values are expressed from the minimum to the maximum with the average in parentheses.

SA BET = surface area; V p = pore volume.
The amount of halloysite in the bulk and the clay fractions was considered for mineral-resource estimations. After suitable processing, the halloysite may be concentrated (to ~80%) to improve its quality. However, it is not possible to separate halloysite from other clay mineral phases, although separation from quartz, feldspar and other rock-forming minerals can be achieved. It is therefore very important to consider the abundance of halloysite in the clay mineral assemblage after excluding the non-clay minerals.
The average halloysite content in bulk samples from the Exposição deposit (25.00%) is less than that of the Campo Alegre deposit (54.03%), while the halloysite content in the clay fraction (78.5%) is close to that observed in the Sigma-Aldrich standard (83.8%), but still less than those observed in the Dragon Mine (95.9%) and Matauri Bay (90.3%) deposits. The halloysite comprises 91.8% of the clay mineral assemblage from the Exposição deposit, which is close to the grade of the Sigma-Aldrich standard (94.2%), greater than those of the Campo Alegre (60.3%) (Oliveira et al., Reference Oliveira, Furtado, Formoso, Eggleton and Dani2007) and Zudong (23.5%) deposits (Li & Zhou, Reference Li and Zhou2020), and very close to those of the Dragon Mine (96.4%) and Matauri Bay (99.1%) deposits (Hillier et al., Reference Hillier, Brydson, Delbos, Fraser, Gray and Pendlowski2016; Wilson & Keeling, Reference Wilson and Keeling2016).
The clay fractions from the Exposição pegmatite showed improved technological properties (high halloysite contents, suitable particle size, micromorphological features) compared to those observed in Zudong, and these were similar to those reposed in the Sigma-Aldrich sample and from the Matauri Bay deposit. However, these properties are inferior compared to the deposit at Dragon Mine. This can probably be ascribed to the halloysite morphology, as the Dragon Mine deposit contains a high proportion of cylindrical halloysite (Hillier et al., Reference Hillier, Brydson, Delbos, Fraser, Gray and Pendlowski2016) compared to the mixed polygonal/cylindrical morphologies of the Exposição deposit. A notable feature of the Exposição halloysite deposit is that it is not as enriched in HREEs as the Zudong deposits. These deposits originated from the weathering of A-type granites enriched in HREEs by hydrothermal remobilization (Li et al., Reference Li, Zhou and Williams-Jones2019). The Exposição pegmatite did not produce regolith-hosted HREE deposits like the Zudong deposits probably due to its HREE-poor host-rock composition.
Conclusions
Mixed polygonal/cylindrical tubular halloysite-7Å with estimated sizes close to 3.0 μm in length and 0.3 μm in diameter was identified in the Exposição pegmatite with abundances ranging from 6.3% to 35.4%. The average chemical composition of the clay fractions was 45.46 wt.% SiO2, 36.10 wt.% Al2O3, 14.62 wt.% LOI and 1.04 wt.% Fe2O3. The clay fractions from the Exposição halloysite deposit presented technological properties (large halloysite contents, suitable particle size, micromorphological features) that were similar to those of world-class halloysite deposits, such as Dragon Mine (USA) and Matauri Bay (New Zealand). However, no REE mineralization, as in the Zudong deposits (China), were reported.
The average halloysite grade in the clay fractions of the Exposição pegmatite (78.5%) is as high as other world-class halloysite deposits, such as Dragon Mine (USA) (95.9%) or Matauri Bay (New Zealand) (90.3%), and it was greater than that of other halloysite deposits such as Campo Alegre (Brazil) and Zudong (China). The grade of the processed Exposição deposit is also close to the 83.8% purity of the halloysite standard supplied by Sigma-Aldrich.
Supplementary material
To view supplementary material for this article, please visit https://doi.org/10.1180/clm.2021.8
Acknowledgements
The authors are grateful to the Center for Mineral Technology (CETEM/MCTI), the Federal University of Rio de Janeiro (UFRJ/MEC), the National Council of for Scientific and Technological Development (CNPq/MCTI) for the scholarship (grant number: 131195/2019-0), the Federal Rural University of Rio de Janeiro (UFRRJ/MEC), the Military Institute of Engineering (IME) and the Rio de Janeiro State Research Support Foundation (FAPERJ/SCT-RJ).
Financial support
Reiner Neumann acknowledges a CNPq research grant (300936/2016-8).


