Talc is a magnesium sheet silicate that is valued for its low price, lamellar structure, softness, biocompatibility, thermal stability and chemical inertness, making it a material of choice for many industrial applications (Dumas, Reference Dumas2013). Talc is largely used as a filler in paper industry (Chauhan & Bhardwaj, Reference Chauhan and Bhardwaj2017) and ceramics (Chandra et al., Reference Chandra, Agnihotri and Bhasin2004), as a thickener or viscosity enhancer in paints and coatings (Tothill et al., Reference Tothill, Best and Seal1993), as a stabilizer in polymers (Kocic et al., Reference Kocic, Kretschmer, Bastian and Heidemeyer2012), as an additive in agri-food (Mallet et al., Reference Mallet, Delord, Juin and Lessire2005) and cosmetics (Zazenski et al., Reference Zazenski, Ashton, Briggs, Chudkowski, Kelse, MacEachern, McCarthy, Nordhauser, Roddy, Teetsel, Wells and Gettings1995; López-Galindo et al., Reference López-Galindo, Viseras and Cerezo2007; Carretero & Pozo, Reference Carretero and Pozo2010) and as a pleurodesis agent in medicine (Viallat & Boutin, Reference Viallat and Boutin1998; Maskell et al., Reference Maskell, Lee, Gleeson, Hedley, Pengelly and Davies2004).
In 1948, prospecting campaigns led to the discovery of steatite, a rock mainly composed of talc, near the city of Tchibanga in southwest Gabon (Lissoulour & Barras, Reference Lissoulour and Barras1948). Thereafter, large volumes of talc were discovered in the same region all around the Nyanga syncline (Bellivier, Reference Bellivier1977; Boutin, Reference Boutin1985; Boutin et al., Reference Boutin, Récoché, Perrin, Spencer and Bouchot2001; Martini & Makanga, Reference Martini and Makanga2001). The possible commercial value of the deposit needs to be determined. To this end, the following questions need to be answered: (1) What kinds of minerals are associated with the talc crystals and in what proportions (in order to determine whether mining of the talc deposit is commercially viable)? (2) What is the chemical composition of the talc mineral itself (in order to determine whether or not chemical substitutions in the crystal lattice are present)? The answers to these questions are indeed essential to determining the potential industrial application domains of the present ore (Dumas et al., Reference Dumas, Martin, Ngo Ke, Nguyen Van, Nguyen Viet, Nguyen Tat, Kieu Quy, Micoud and de Parseval2015). For example, a talc containing some Al, Fe or Ca due to the presence of hydrophilic minerals (chlorite and carbonates) will be used preferably in polar media, whereas a purer talc is more hydrophobic and can be used in non-polar media as polyolefins or in cordierite-based ceramics.
This research aimed to characterize the mineralogy and crystal-chemistry of the talc ore of the Minzanzala area in the southwest part of the Nyanga syncline, Gabon. Its characterization will permit the investigation of its potential applications.
Geological setting
The talc ore deposit of Minzanzala is located in southwest Gabon, near the city of Tchibanga (latitude 02°90′487″S, longitude 10°99′161″E). It is part of the large Nyanga syncline, which corresponds to the northern extremity of a Precambrian sedimentary basin extending from Angola to Gabon. The talc mineralization is included in the upper part of a calc-schist formation and is covered by a lateritic layer that is >600 km long and from one to several kilometres wide (Fig. 1).
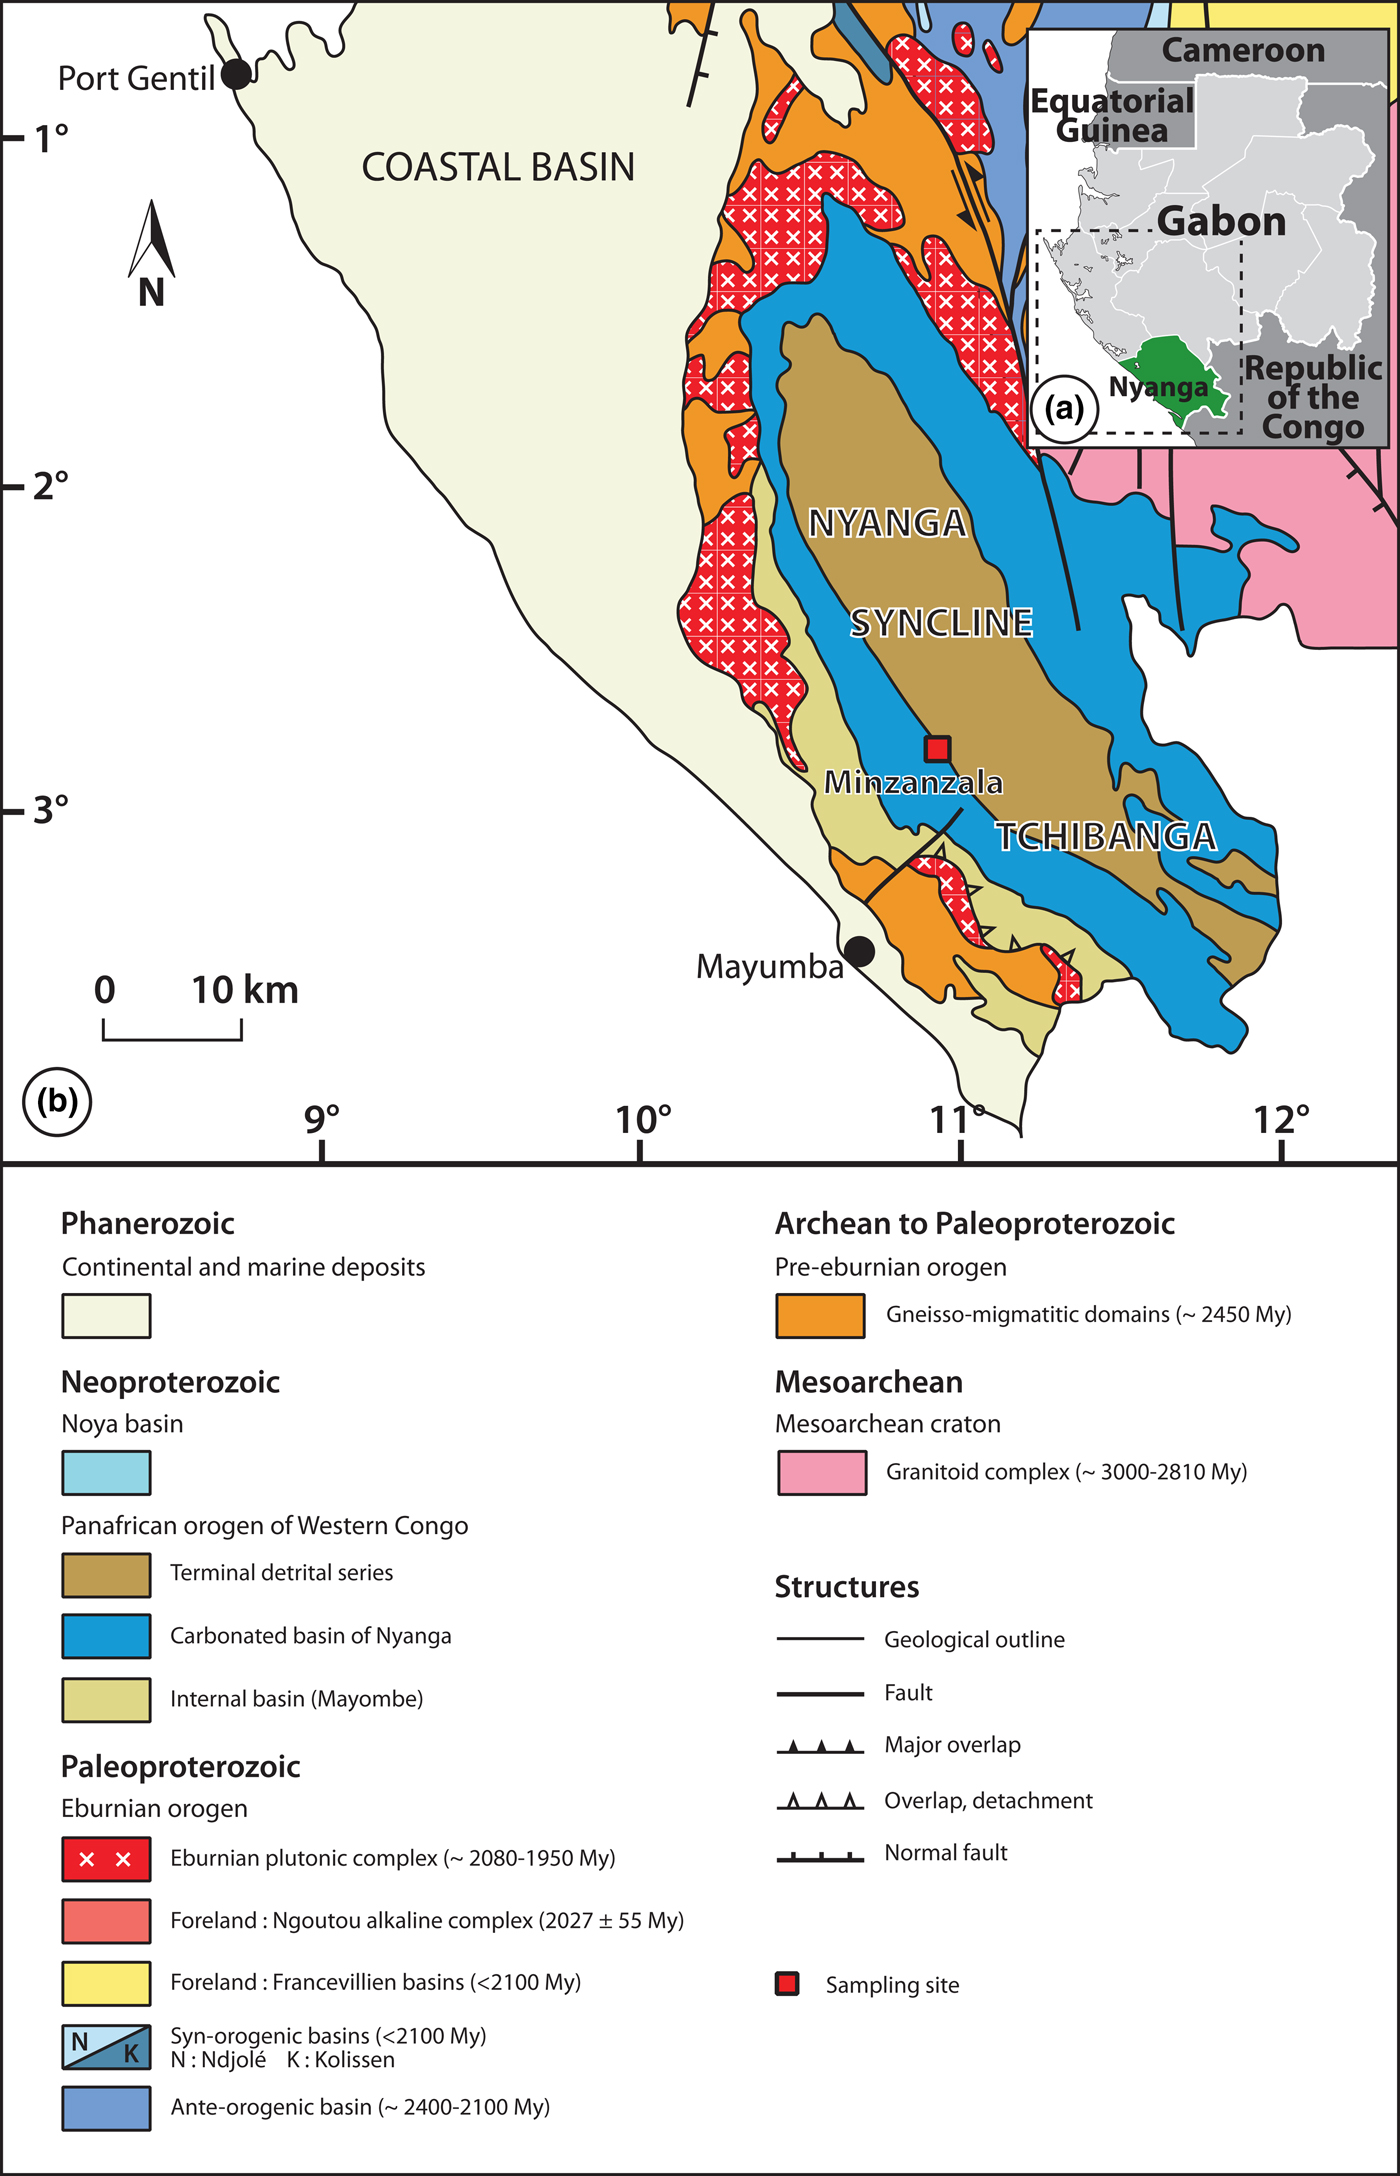
Fig. 1. (a) Location of the study area. (b) Geological map showing the Minzanzala talc deposit.
Sampling
Two different talc samples were recovered from the slopes of Minzanzala in a massive outcrop made of fine sands and clays (Fig. 2). The outcrop was stripped with a hand shovel to obtain an unaltered surface. This surface had white to yellowish colouration, and two blocks were extracted from the core of the unaltered zones to collect the samples. They are referred to as BTT6 (yellowish) and BTT7 (whitish). The samples were then crushed, ground and sieved to three powder fractions (<50, <250 and <500 μm).
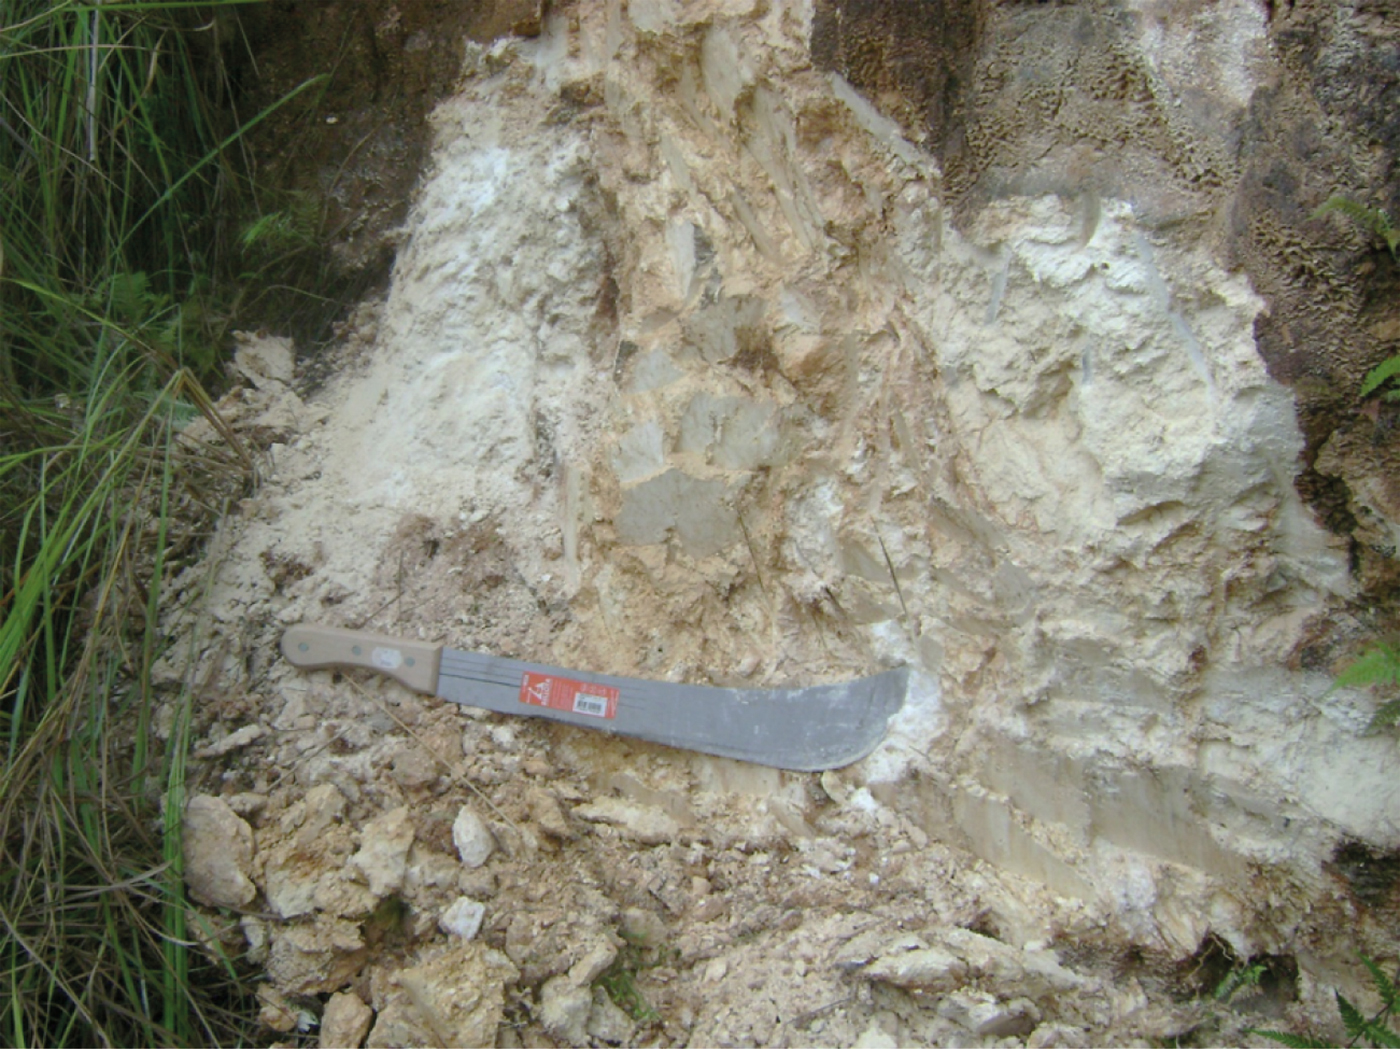
Fig. 2. View of the talc outcrop.
Another natural talc, known as Luzenac talc, from the French quarry of Trimouns in the Pyrenees, was used for comparison (donated by Imerys). This talc was received as a finely ground white powder and was selected for its high crystal order and low Fe content (0.68 wt.% Fe2O3; Martin et al., Reference Martin, Ferrage, Petit, de Parseval, Delmotte, Ferret, Arseguel and Salvi2006).
Methods
X-ray diffraction (XRD) analysis was performed on random talc powders at the LIEC laboratory (Laboratoire Interdisciplinaire des Environnements Continentaux) of Nancy (France) with a Jobin-Yvon Sigma 2080 diffractometer using Co-Kα1 radiation (λ = 1.789 Å). The fraction finer than 250 μm was selected for the analysis. The XRD traces were recorded over the 0–60°2θ range, with a step size of 0.034608°2θ and a count time per step of 0.32 s. Indexation of the XRD peaks was performed with the ‘Powder Diffraction File’ available from the International Center for Diffraction Data (ICDD) website. The XRD measurements were also performed on a finer size fraction to avoid a preferential orientation of the talc particles, which might mask mineral impurities in the samples. The initial powders (<500 μm) were ground to 40 μm for BTT6 and 20 μm for BTT7 for 90 min at 25 Hz, using a MM200 mixer mill. The particle size was controlled by laser diffraction using a Beckman Coulter LS100Q device and the LS32 software. Four measurements were registered and averaged for each sample. The XRD traces of the finely ground samples were recorded at the GET laboratory (Géosciences Environnement Toulouse, France) with a Bruker D2 Phaser diffractometer using Cu-Kα1+2 radiation over the 0–80°2θ range, with a step size of 0.02°2θ and a count time per step of 0.5 s.
Modal-composition calculations were performed in order to determine the abundance of each phase in both samples. These calculations are based on the mineralogy obtained by XRD and on the whole-rock chemical analysis. On this basis, the modal compositions of the samples may be calculated by using the multilinear method described by Njopwouo (Reference Njopwouo1984) and Yvon et al. (Reference Yvon, Baudracco, Cases, Weiss and Decarreau1990) by means of the following formula:
 $${T}\lpar {a} \rpar = \sum \nolimits_1^{n} {Mi} \times { Pi}\lpar {a} \rpar $$
where T(a) represents the content (%) of the chemical element ‘a’ in the rock; Mi represents the content (%) of the mineral ‘i’ in the rock and Pi(a) represents the proportion of the element ‘a’ in the mineral ‘i’. Only theoretical mineral compositions were used for the calculations, as the chemical compositions of each phase were not available. MgO was assigned to talc (major phase), the remaining SiO2 was assigned to quartz (second major phase) and the small amounts of Al2O3 and FeO were allocated to Al–Fe-bearing phases (kaolinite, chlorite, Al–Fe oxyhydroxides). The MgO and SiO2 contents of talc and quartz were adjusted accordingly. Kaolinite, chlorite and Al–Fe oxyhydroxides were included in the same ‘Al–Fe-bearing phases’ group because of the limitations of XRD in terms of separating these phases.
Whole-rock chemical analysis was performed at the CRPG laboratory (Centre de Recherches Pétrographiques et Géochimiques) of Nancy (France) to quantify the major and trace elements in the finer fraction of the samples (<250 μm). The preparation involved alkali fusion followed by HNO3 acid etching to dissolve the glass obtained. The major elements were quantified using an inductively coupled plasma atomic emission spectrometer coupled with a Jobin-Yvon 70-P quantometer and trace elements were determined by an inductively coupled plasma mass spectrometer coupled with a Perkin Elmer Elan 500 instrument.
Quantitative chemical analyses were performed on the talc particles (<500 μm fraction) using a CAMECA SXFive electron microprobe at the Centre de MicroCaractérisation Raimond Castaing of Toulouse (France) with a 15 kV acceleration voltage, a 10 nA sample current and a defocused beam with a diameter of 2 μm. Talc powders were compressed into pellets with a hand-operated press and their structural formula was calculated based on 22 oxygen atoms. Natural and synthetic minerals were used as standards for calibration (Si: wollastonite; Mg: periclase; Fe: hematite; Al: corundum; Cl: tugtupite; Na: albite; Ca: wollastonite; F: topaz). The Si occupancy was systematically higher than the ideal 8, possibly because of the layer structure of talc coupled with the enrichment in Si during the analysis due to the migration of other elements (Müller et al., Reference Müller, Breiter, Seltmann and Pécskay2005). This explanation was favoured because the analyses were only focused on large talc platelets, excluding the presence of quartz admixtures.
Near-infrared (NIR) spectroscopy was performed on talc powders using a Thermo Nicolet Fourier-transform infrared spectrometer (ICT laboratory, Institut de Chimie de Toulouse, France) equipped with a smart NIR integrating sphere (IngaAs detector). Diffuse reflection spectra were recorded between 4000 and 10,000 cm–1 at a resolution of 4 cm–1 representing the average of 32 scans. The <500 μm fraction was ground in an agate mortar and the powders were placed without further treatment.
29Si and 1H solid-state nuclear magnetic resonance (NMR) spectra were recorded on a Bruker Avance III 400 NMR spectrometer at the LCC laboratory (Laboratoire de Chimie de Coordination, Toulouse, France). All of the samples were spun at 8 kHz at the magic angle using ZrO2 rotors. For 29Si magic angle spinning (MAS) NMR experiments, a 4 mm probe was used operating at 79.39 MHz. The spectra were recorded under high-power proton decoupling conditions using a small flip angle of 30° and a long recycle delay of 60 s. For the 1H MAS-NMR experiments, a 4 mm probe was employed, operating at 399.60 MHz. The spectra were obtained using a small flip angle of 30° and a recycle delay of 5 s. All of the chemical shifts were referenced externally to tetramethylsilane.
Scanning electron microscopy (SEM) was performed in the SCMEM department (Service Commun de Microscopies Electroniques et de Microanalyses, Nancy, France) using an Hitachi FEG S-4800 apparatus equipped with an energy-dispersive spectrometer (Si-Li Thermo-Noran equipment) and a backscattered electron detector. The SEM images were recorded on carbon-coated <50 μm fractions using a 15 kV acceleration voltage. Double-faced graphite tape was used as an adhesive.
Colorimetric measurement analyses were recorded on the <500 μm fraction with a Minolta 3700d spectrocolorimeter (Imerys, Toulouse, France). A D65 light source was used with an incidence angle of 10°. The three parameters L* (luminance on a scale of 0–100), a* (on a scale of redness to greenness) and b* (on a scale of yellowness to blueness) were determined based on X, Y and Z tristimulus values (Billmeyer & Saltzman, Reference Billmeyer and Saltzman1981; Christidis & Scott, Reference Christidis and Scott1997).
Results
Morphological characterization
The SEM images of BTT6 and BTT7 are presented in Fig. 3. The talc particles present a characteristic lamellar shape with particle sizes >100 μm. The lamellar morphology allows particle stacking along the c* axis through Van der Waals interactions (Alcover & Giese, Reference Alcover and Giese1986). This weak packing cohesion leads to partial exfoliation favouring delamination under grinding (Fig. 3a).

Fig. 3. SEM images of (a) BTT6 and (b) BTT7.
Mineralogical characterization
X-ray diffraction
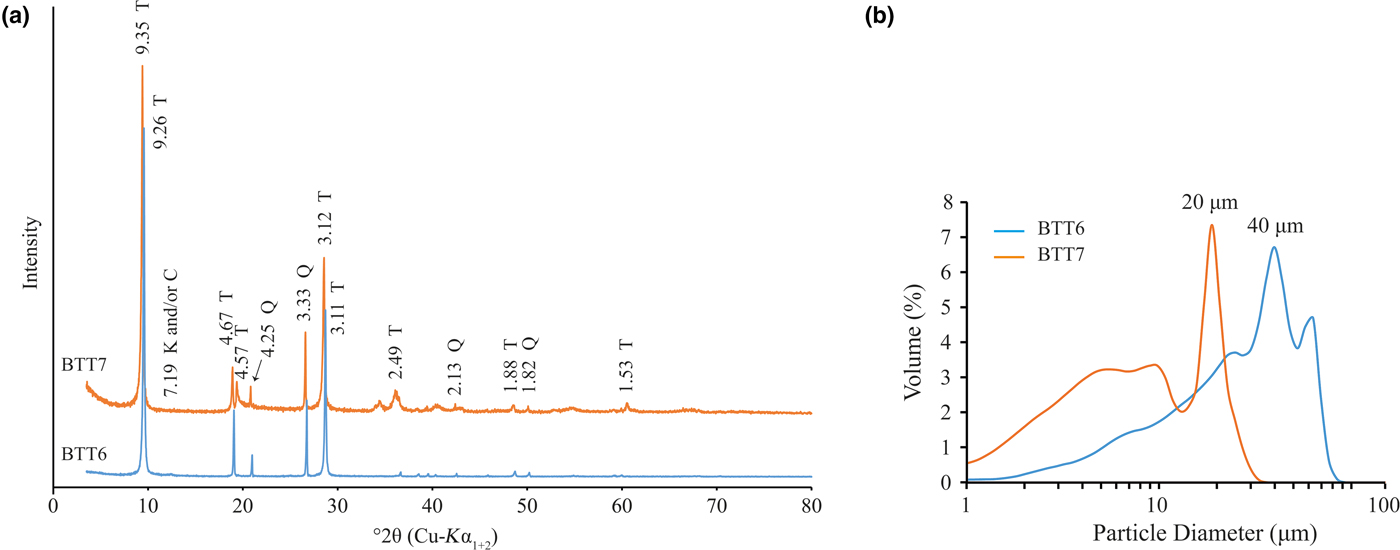
The XRD traces of the BTT samples are shown in Fig. 4a (Boulingui, Reference Boulingui2015). Talc is present in the samples, with typical d spacings at 9.32 Å (001), 4.68 Å (002) and 3.12 Å (003) (Brindley & Brown, Reference Brindley and Brown1980). Quartz is also present in both samples, being more abundant in BTT6 than in BTT7 based on the intensity of the diffraction lines. Finally, two small peaks at 13.09 and 7.18 Å reveal traces of chlorite and/or kaolinite, respectively. For chlorite, the 13.09 Å d spacing may indicate the presence of Fe and other substitutions in the lattice (Brindley & Gillery, Reference Brindley and Gillery1956), but the presence of Al–Fe oxyhydroxide interlayers is not excluded. Identification of the Al–Fe-bearing phases is ambiguous because of the very small amounts present in the samples. The BTT6 and BTT7 samples were ground to ~40 and ~20 μm, respectively, with a mixer mill to avoid orientation effects and to intensify the signals of the accessory minerals.
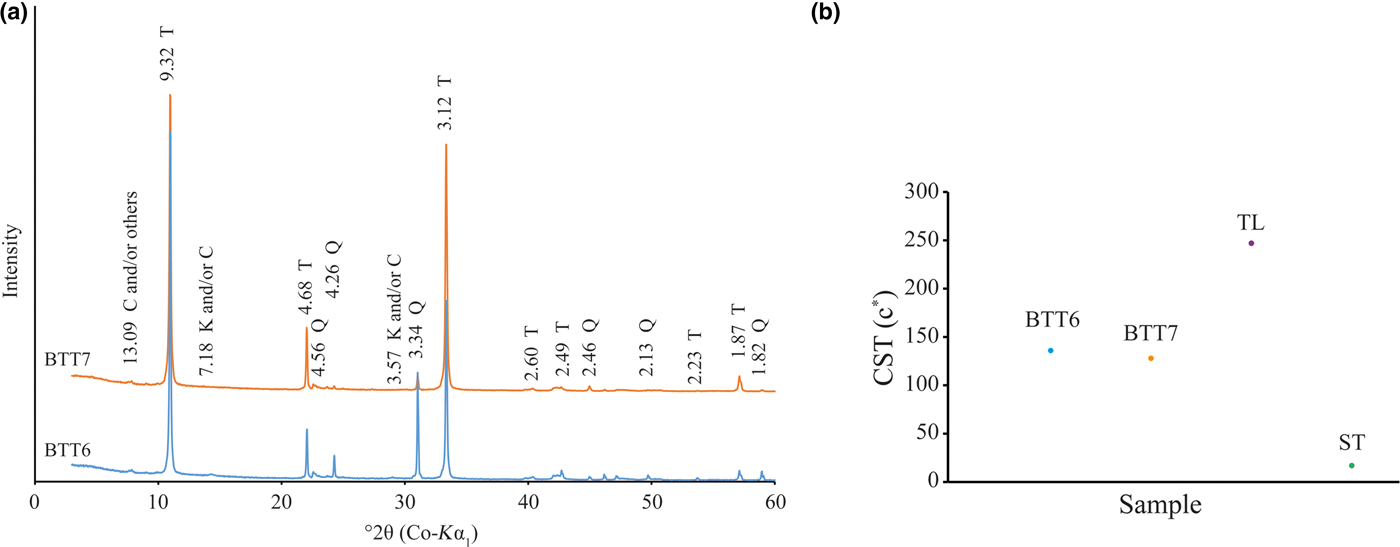
Fig. 4. (a) XRD traces of the coarse fraction (<250 μm; T = talc; Q = quartz; K = kaolinite; C = chlorite) of samples BTT6 and BTT7. (b) Crystal size thickness (CST) expressed in number of stacked layers of the BTT samples compared to the natural talc of Luzenac (TL) and a synthetic talc (ST).
The particle size distribution and XRD results are presented in Fig. 5a,b. The two samples contain comparable amounts of quartz. The bulk mineralogy remains unchanged, with the samples containing talc, quartz and traces of Al–Fe-bearing phases. The identification of the Al–Fe-bearing phases was also difficult after grinding because the main diffraction maxima of these phases did not increase. Although the peak at 13.09 Å disappeared after excessive grinding, the samples contain chlorite because the (002) reflection occurs at the same position as the (001) reflection of kaolinite (7.19 Å). It is suggested that the Al–Fe-bearing phase may be kaolinite, chlorite, Al–Fe oxyhydroxides and/or interstratified phase. The extremely small proportion of these phases makes it difficult to identify them conclusively.

Fig. 5. (a) XRD traces (T = talc; Q = quartz; K = kaolinite; C = chlorite) and (b) particle-size distribution recorded on the fine fractions of BTT6 and BTT7.
The analysis of the full width at half maximum (FWHM) of the talc diffraction lines enabled estimation of crystal size from the coherent scattering thickness of the talc particles along the c* axis of the two samples with the Scherrer equation (Scherrer, Reference Scherrer1918). BTT6 and BTT7 are composed of 136 and 128 stacked layers, respectively, crystallized perfectly along the c* direction (Fig. 4b). These values correspond to a talc of intermediate crystal order in comparison with a well-crystallized natural talc (247 stacked layers, Trimouns quarry, Luzenac, France) or a poorly crystallized synthetic talc (10 stacked layers; Dumas et al., Reference Dumas, Claverie, Slostowski, Aubert, Careme, Le Roux, Micoud, Martin and Aymonier2016).
Weight content calculations
Modal compositions enabled the establishment of the percentage of each phase in the samples (Yvon et al., Reference Yvon, Baudracco, Cases, Weiss and Decarreau1990). The method has been used extensively in the past (Njoya et al., Reference Njoya, Nkoumbou, Grosbois, Njopwouo, Njoya, Courtinnomade, Yvon and Martin2006; Nkoumbou et al., Reference Nkoumbou, Njopwouo, Villiéras, Njoya, Yonta Ngouné, Ngo Ndjock, Tchoua and Yvon2006; Boulingui et al., Reference Boulingui, Nkoumbou, Njoya, Thomas and Yvon2015). Sample BTT7 is very pure mineralogically as it contains 90.0 wt.% talc, with minor quartz (7.9 wt.%) and trace Al–Fe-bearing phases (1.3 wt.%) (Table 1). Sample BTT6 contains only 66.0 wt.% of talc with a higher proportion of quartz (29.0 wt.%) and Al–Fe-bearing phases (4.0 wt.%). This outcome should be correlated generally to the XRD results, but some variations may exist because of experimental factors, such as the mineralogy of the analysed fraction or the mineral orientation during the XRD analysis.
Table 1. Modal composition of the BTT samples (Njopwouo, Reference Njopwouo1984; Boulingui, Reference Boulingui2015).
Chemical characterization
Whole-rock chemical analysis
The whole-rock chemical results are in good agreement with the XRD data (Table 2). Indeed, BTT6 and BTT7 exhibit an excess of SiO2 related to the presence of quartz in both samples. Sample BTT6 is richer in SiO2, in accord with the greater amount of quartz in the sample. The samples also contain small amounts of Al2O3 (<1 wt.%; Table 2) and traces of Fe2O3 related to the trace presence of Al–Fe-bearing phases in the samples. The SiO2/MgO ratio of BTT7 is very close to the theoretical composition of talc (Ersoy et al., Reference Ersoy, Dikmen, Yildiz, Gören and Elitok2013). This highlights the greater mineralogical purity of this sample compared to BTT6. Finally, the values obtained for trace elements (Table 3) show high proportions of lithophile (Ce), chalcophile (Zn) and siderophile elements (Cr, V).
Table 2. Bulk chemical composition (wt.%) of the BTT samples (major elements).
<LD = below limit of detection; LOI = loss on ignition at 1050°C.
Table 3. Bulk minor and trace element compositions (ppm) of the BTT samples.
<LD = below limit of detection.
Talc crystal chemistry
Microprobe analyses of the pressed powder pellets of samples BTT6 and BTT7 (Table 4) showed that the SiO2/MgO wt.% ratios (R) were 2.22 and 2.09 in BTT6 and BTT7, respectively, with the latter being very close to R = 2.00 (i.e. the theoretical talc composition; Ersoy et al., Reference Ersoy, Dikmen, Yildiz, Gören and Elitok2013). Therefore, the microprobe analysis recorded the chemical composition of the talc particles rather than the bulk composition due to the preferential orientation of the talc particles along their ab plane, concealing at the same time the mineral impurities present in smaller quantities in the samples. Moreover, all of the measurements were focused on large talc particles to avoid the analysis of accessory minerals. On this basis, it is reasonable to assume that the remaining metal oxides recorded in the analysis (e.g. Fe2O3) originate from the talc crystal lattice rather than from impurities (Al–Fe-bearing phases). Indeed, Fe atoms may substitute for Si or Mg atoms located in the tetrahedral and octahedral sheets of sheet silicates (Martin et al., Reference Martin, Micoud, Delmotte, Marichal, Le Dred, de Parseval, Mari, Fortuné, Salvi and Béziat1999). This was particularly demonstrated by Petit et al. (Reference Petit, Martin, Wiewiora, de Parseval and Decarreau2004), who revealed the presence of Fe substitutions in the crystal lattices of 15 natural talcs. Among them, the talc of Luzenac, which corresponds to our natural talc of reference, contains 0.68 wt.% Fe2O3 in its crystal lattice. This amount is much greater than those obtained in the talcs from Gabon (0.16 wt.% for BTT6 and 0.04 wt.% for BTT7). Hence, the talcs of Minzanzala are chemically very pure despite their association with other mineral impurities in the samples.
Table 4. Electron microprobe analyses and structural formulae of the talc particles.

In addition, F is present in relatively high proportions in the two talc samples (1.41 wt.% in BTT6 and 1.44 wt.% in BTT7). This F content is in the average range of those observed for other talc samples coming from various parts of the world (Petit et al., Reference Petit, Martin, Wiewiora, de Parseval and Decarreau2004), and its presence is characteristic of natural environments in which the F atoms can substitute for the OH groups, pointing towards the hexagonal cavities of Si tetrahedra (Ross & Smith, Reference Ross and Smith1968; Abercrombie et al., Reference Abercrombie, Skippen and Marshall1987). It is suggested that this F is not derived from other mineral phases because the microprobe analysis was specifically focused on large talc platelets, as noted above.
Crystal-chemical characterization
Talc particles
The 29Si and 1H NMR spectra enabled the evaluation of the crystal-chemistry of the two talc samples and permitted the determination of the possible Fe substitutions in the crystal lattice by measuring the FWHM of the main NMR peaks. A talc with large amounts of Fe substitutions exhibits wide peaks in the 1H and 29Si MAS-NMR spectra, whereas a chemically very pure talc will exhibit narrow peaks (Martin et al., Reference Martin, Ferrage, Petit, de Parseval, Delmotte, Ferret, Arseguel and Salvi2006).
In our case, the 29Si MAS-NMR spectra of BTT6 and BTT7 are composed of a symmetrical narrow peak at ~ –98 ppm, attributed to Q3 species (Lippmaa et al., Reference Lippmaa, Mägi, Samoson, Engelhardt and Grimmer1980) (Fig. 6a), which indicates that the samples are very pure chemically. This assumption was validated by comparing their spectra with that of the Luzenac talc, which contains more Fe substitutions. The differences in the FWHM between the three samples clearly demonstrate the chemical purity of the talcs of Minzanzala (Fig. 6b), which is in full agreement with the microprobe analysis. Martin et al. (Reference Martin, Ferrage, Petit, de Parseval, Delmotte, Ferret, Arseguel and Salvi2006) demonstrated that the position of this same peak can be correlated to the amount of Fe2O3 present in the sample. Projection of the –98 ppm position in a correlation line (Fig. 7) shows that the two samples have very low Fe2O3 contents (~0.1 wt.%), which is also in agreement with the microprobe results. The 29Si MAS-NMR spectra also provided evidence of a potential small fraction of nano-sized talc particles in the samples located at –95 ppm. This resonance has been attributed to nano-sized synthetic talc particles (Dumas et al., Reference Dumas, Claverie, Slostowski, Aubert, Careme, Le Roux, Micoud, Martin and Aymonier2016) rather than quartz, kaolinite or chlorite because their 29Si chemical shifts are located elsewhere (–108 ppm for quartz; –91 ppm for kaolinite and chlorite).
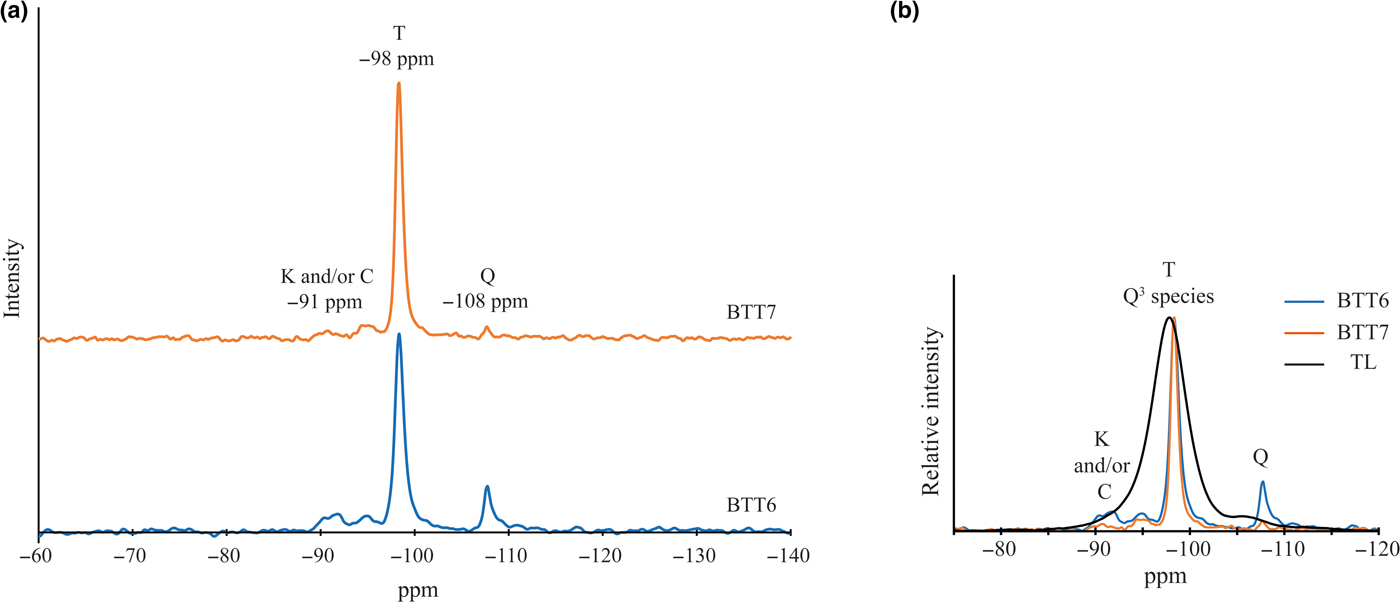
Fig. 6. (a) Solid-state 29Si MAS-NMR spectra of BTT6 and BTT7 (T = talc; Q = quartz; K = kaolinite; C = chlorite) and (b) comparison with the natural talc of Luzenac (TL).
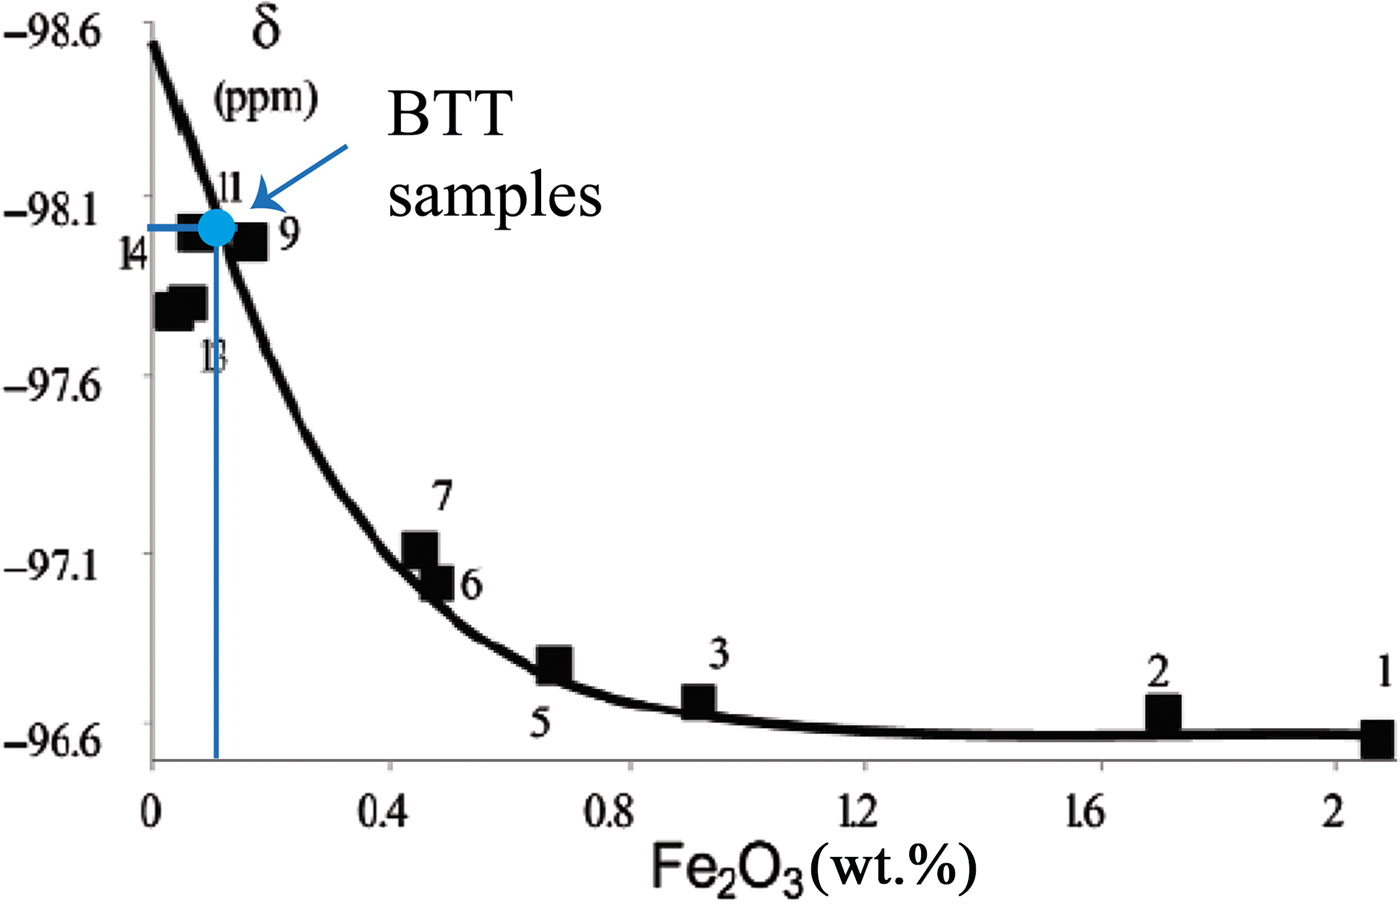
Fig. 7. Chemical shift (δ) vs. Fe2O3 diagram, allowing the estimation of the Fe2O3 content of the BTT samples (according to the correlation line of Martin et al., Reference Martin, Ferrage, Petit, de Parseval, Delmotte, Ferret, Arseguel and Salvi2006).
The chemical purity of BTT6 and BTT7 was also confirmed by the 1H MAS-NMR spectra (Fig. 8a). The samples display a major symmetrical peak at 0.8 ppm corresponding to H atoms located within the hexagonal cavities of the talc structure (Martin et al., Reference Martin, Ferrage, Petit, de Parseval, Delmotte, Ferret, Arseguel and Salvi2006). The narrowness of this peak indicates that the talcs are chemically very pure, otherwise their FWHM would be greater. The comparison of the 1H NMR spectra of BTT6 and BTT7 with the talc of Luzenac (rich in Fe substitutions) confirmed once again the chemical purity of the Gabonese talc (Fig. 8b). Finally, the presence of the smaller peak at 4.7 ppm in the 1H MAS-NMR spectra of the two samples demonstrates the presence of residual physisorbed water on the talc particle edges (Dumas et al., Reference Dumas, Martin, Le Roux, Micoud, Petit, Ferrage, Brendlé, Grauby and Greenhill-Hooper2013).
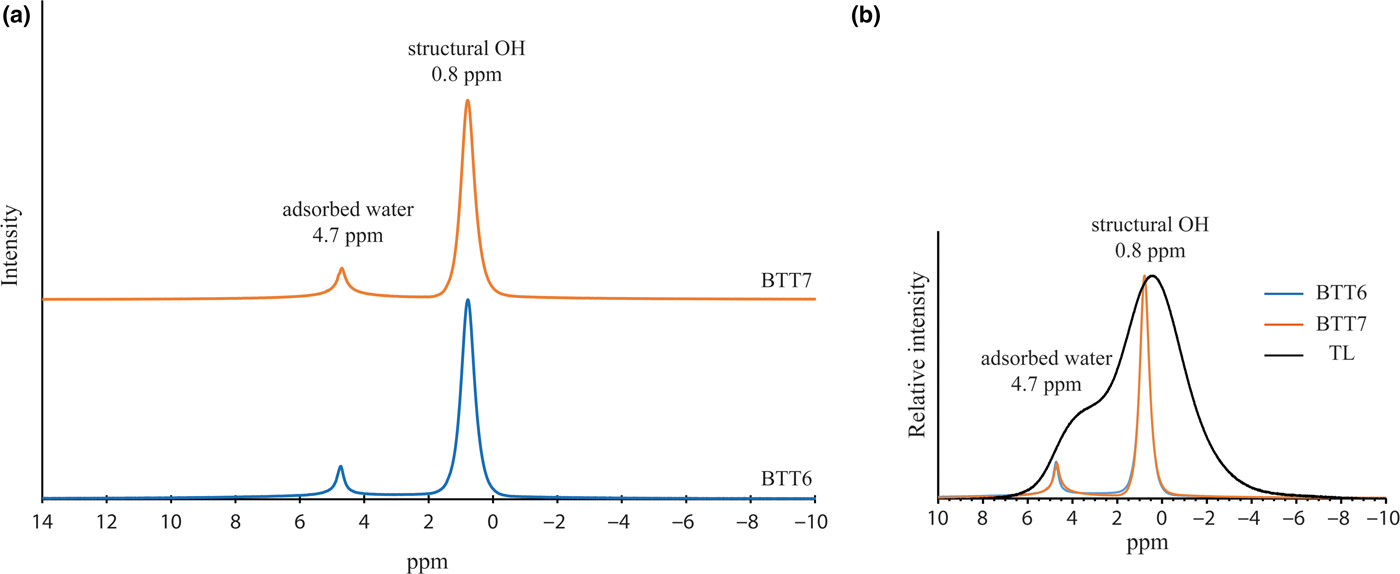
Fig. 8. (a) Solid-state 1H MAS-NMR spectra of BTT6 and BTT7 and (b) comparison with the natural talc of Luzenac (TL).
The NIR spectra of BTT6 and BTT7 are shown in Fig. 9a. Small amounts of of Fe substitutions yield bands at 7156 cm–1 (2ʋMg2FeOH), 7118 cm–1 (2ʋMgFe2OH) and 7073 cm–1 (2ʋFe3OH) (Petit et al., Reference Petit, Martin, Wiewiora, de Parseval and Decarreau2004). In the present study, these bands are absent from the NIR spectra, corroborating the very good chemical purity of the talcs (Fig. 9b), which is in agreement with the previous microprobe and MAS-NMR results. The band at 5240 cm–1 (Fig. 9a) confirms the presence of physisorbed water on the talc particle edges (Dumas et al., Reference Dumas, Martin, Le Roux, Micoud, Petit, Ferrage, Brendlé, Grauby and Greenhill-Hooper2013). In summary, the NIR spectra of the Minzanzala talcs show the typical vibration bands of a very pure talc structure, with major bands located at 7184 cm–1 for the 2ʋMg3OH vibration and at 4051, 4180, 4323 and 4367 cm–1 for the OH combination bands (Zhang et al., Reference Zhang, Hui, Lou, Redfern, Salje and Tarantino2006).
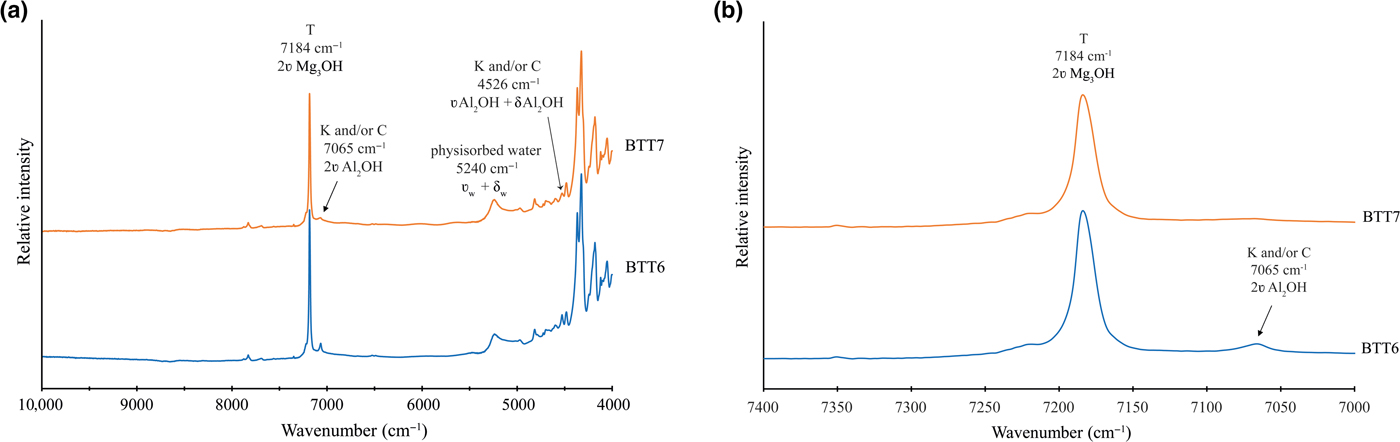
Fig. 9. (a) NIR spectra recorded on BTT6 and BTT7 samples (T = talc; K = kaolinite; C = chlorite) and (b) enhancement of the 7000–7400 cm–1 range, confirming the absence of Fe substitution in the talc crystal lattice.
Evidence for accessory minerals
The presence of accessory minerals was examined by 29Si MAS-NMR and NIR spectroscopies (Figs 6a, 9b). The peak of low intensity at –91 ppm in the 29Si MAS-NMR spectra indicates the presence of kaolinite and/or chlorite in the two samples (Massiot et al., Reference Massiot, Dion, Alcover and Bergaya1995; Zazzi et al., Reference Zazzi, Hirsch, Leonova, Kaikkonen, Grins, Annersten and Edén2006). This observation is supported by the weak band at 7065 cm–1 in the NIR spectra, attributed to the 2ʋAl2OH vibration of kaolinite (Petit et al., Reference Petit, Madejová, Decarreau and Martin1999). In addition, the band at 4525 cm–1 corresponds to the combination of the 2δAl2OH and 2ʋAl2OH vibrations of kaolinite and/or chlorite (Yang et al., Reference Yang, Ye, Han, Ren, Han and Zhang2018). The presence of chlorite might be verified by the presence of two diagnostic bands at 4280 and 4440 cm–1. In the present study, these bands are absent, suggesting that chlorite might not exist in the Minzanzala samples. Nevertheless, the presence of chlorite should not be excluded because of the existence of the peak at 13.09 Å in the XRD traces. Obviously, the Minzanzala talc samples do contain some traces of kaolinite, but the presence of chlorite is questionable and may vary from one sample to another.
The presence of quartz was indicated by a thin peak at –108 ppm on the 29Si MAS-NMR spectra of the two samples. Comparison of the peak areas in BTT6 and BTT7 confirms that BTT6 is richer in accessory minerals (quartz, Al–Fe-bearing phases) than BTT7.
Colour properties
Table 5 lists the colour properties of the two Gabonese talcs. The talcs are white (high L* values) with a low red hue (a* parameter). They nevertheless present a yellowish hue according to the higher b* parameter values. This value is more significant for BTT6, which confirms the observations made with the naked eye. The colour might be attributed to the presence of accessory chlorite or to traces of Fe oxyhydroxides.
Table 5. Colour properties of the talc samples from Gabon.
Potential applications
The remarkable chemical purity of the talc particles combined with the small percentage of accessory minerals in the deposit (especially for BTT7) suggest applications in cosmetics. The cosmetics industry requires talc deposits of very high quality, as up to 90% should be composed of talc and should be free of fibrous or asbestos-form minerals (Fiume et al., Reference Fiume, Boyer, Bergfeld, Belsito, Hill, Klaassen, Liebler, Marks, Shank, Slaga, Snyder and Andersen2015). The talc particles should also have very low Pb (<20 ppm) and As contents (<3 ppm), and they should be free of quartz. When looking at these specifications (cf. Tables 1, 3), the BTT7 sample satisfies these requirements except for the presence of quartz in the sample. Nevertheless, quartz may be removed easily by flotation (use of pine oil as a frother) or by mechanical processes (i.e. cyclonic sedimentation). Moreover, if necessary, acid leaching may be used to remove impurities such as CaO, Fe2O3 or Al2O3 (Barani & Aghazadeh, Reference Barani and Aghazadeh2018). Based on these results, the Minzanzala talc ore is a potential candidate for supplying cosmetic talc to the global market.
In addition, the Gabonese talcs might be used in the ceramic or paint industries to produce catalytic converters or matte paints (even if the quartz fraction is not removed). Moreover, they might be employed as fillers in hydrophobic polymers for enhancing the mechanical and thermal properties of the composites. In this case, the particle size should be reduced by milling to enhance the dispersion of the talc particles in the polymers (Yousfi et al., Reference Yousfi, Livi, Dumas, Le Roux, Crépin-Leblond, Greenhill-Hooper and Duchet-Rumeau2013). In contrast, the Minzanzala talcs may be less appropriate for the paper and white ceramic industries (primarily BTT6) because of their yellowish hue and mineral impurities, which would tarnish the sought-after whiteness of the products.
Conclusions
Two talc samples from the Minzanzala deposit of Gabon were characterized in order to determine their crystal-chemistry and mineralogy. The samples contain quartz and Al–Fe-bearing phase impurities (kaolinite, chlorite and/or Al–Fe oxyhydroxides) in comparable proportions. However, despite the presence of impurities, the talc particles have high chemical quality, as was determined by several analytical methods (microprobe analysis, 1H and 29Si MAS-NMR spectroscopy and NIR spectroscopy) that provided evidence of a very small Fe content in the talc lattice. Finally, colour measurements demonstrated a yellowish hue in both samples, which is probably related to the presence of chlorite and/or Al–Fe oxyhydroxides. It is suggested that the talc deposit of Minzanzala could be used in several applications, especially in cosmetics, paints, polymers and ceramics (production of catalytic converters) due to its high chemical quality. However, some applications should be avoided (papers and white ceramics) because of their yellowish hue (especially BTT6) and the presence of other mineral phases, which might affect the whiteness of the final product. Finally, special attention should be paid to the presence of significant amounts of quartz, which would increase the abrasiveness of the end product.
Author ORCIDs
M. Poirier, 0000-0001-7917-2080.
Acknowledgements
The authors thank the Ecole Normale Supérieure of Libreville (Gabon) and the Université de Lorraine (France) for their support and of this work. They also thank Christel Carême for the colorimetry measurements (Imerys, France) and Philippe de Parseval for the microprobe analysis (Centre de MicroCaractérisation Raimond Castaing, Toulouse, France).