


The RR intervals derived from an electrocardiographic trace fluctuate in an irregular and often chaotic manner.Reference Goldberger1 Historically, time series assessments have stimulated academics to examine this niche.Reference Ho2,Reference Prigogine3 The assessment of RR intervals is called Heart Rate Variability, a method for measuring the autonomic nervous system and, hence, its autonomic dysfunction. As a technique, it is simple, dependable and cheap and an important technique for arbitrating physiologically healthy and/or pathological conditions.Reference Mackey and Milton4–Reference Vanderlei, Silva and Pastre6 Other techniques such as the sympathetic Skin Response are an alternative but unresponsive.Reference Rachow, Berger and Boettger7,Reference Wiertel-Krawczuk, Hirschfeld and Huber8 Quantitative Pupillography is complicated and expensive.Reference Baum, Petroff and Classen9 Throughout medical dynamical systems, high chaotic values may designate healthy physiological status but losses could be pathological.Reference De Souza, Vanderlei and Garner10,Reference Bernardo, Vanderlei and Garner11
Heart rate variability can be computed by an algorithm described by Pincus (1991), hence, Approximate Entropy.Reference Pincus12–Reference Garner, Bernardo and Vanderlei15 The benefits of Approximate Entropy include low computer processor demand. It is reliable with small sample lengths (RR < 50). Similarly, it can accurately decipher statistics even with considerable signal noise. Nonetheless, this technique has a crucial shortcoming in that its accuracy is very reliant on the following parameter choices – tolerance, r and embedding dimension, M. Approximate Entropy is as such difficult to interpret.
In this study, we systematically applied different combinations of embedding tolerance, r, and embedding dimension, M, in normal subjects and compared them to malnourished children. The relationship between malnourishment and complexity metrics is useful in the risk assessment of dynamical diseases associated with the illness and can support the treatment of these children. The crucial purpose is to enforce embedding tolerance, r, and embedding dimension, M, groupings to acquire their optimum, hence, achieving the greatest statistical significances between the groups.
Materials and methods
Population and sample
The malnourished group entailed children not more than −2 in z-score in relative to the height for the age, according to the criteria for age and gender by the World Health Organization.16 The eutrophic group consisted of children with z scores ≥−2 and below +3, also consistent with World Health Organization standards. Excluded from this study was obese children (z-score > +3) or who presented with no less than one of the subsequent criteria: children who were taking medications that would influence autonomic activity of the heart, such as propranolol and atropine. Also omitted were children who presented with infections, metabolic diseases or cardiorespiratory system diseases, which affected their cardiac autonomic control.
The subjects and their parents/guardians were duly well-versed as to the procedures and objectives of the study. After agreeing to participate, the parents/guardians signed terms of informed consent. All procedures received approval from the ethics committee of the Institution (Process nº 275.310). Ethical Committee in Research from Sao Paulo State University (UNESP), Marilia, SP, Brazil.
Experimental protocol
Before starting experimental procedures, information was noted on age, gender, mass and height. The anthropometric measurements were undertaken following the recommendations of Lohman et al.Reference Lohman, Roche and Martorell17 Mass was measured using a digital scale (Filizzola PL 150, Filizzola Ltda., Brazil) with a precision of 0.1 kg, with the children barefoot and wearing only lightweight clothing. Height was measured via an infantometer with an accuracy of 0.1 cm. The data collection was achieved in a laboratory with temperature between 21°C and 23°C and relative humidity between 40% and 60%. Data sets were logged between 14:00 and 17:00 to minimise the circadian rhythm interference. After the initial evaluation, all procedures required for data collection were explained on an individual basis. Children were told to continue at rest and avoid talking during the data collection.
Next, the heart monitor belt was placed over the thorax, aligned with the distal third of the sternum. The Polar S810i heart rate receiver (Polar Electro, Finland) was located on the wrist.Reference Barbosa, da Silva and de Azevedo18–Reference Gamelin, Baquet and Berthoin21 The equipment had been previously validated for monitoring beat-by-beat heart rate and the use of these data for Heart Rate Variability analysis in children and adults.Reference Vanderlei, Silva and Pastre20 The children were positioned in the dorsal decubitus with a cushion and remained at rest with spontaneous breathing for 20 minutes. After data collection, the child was discharged. The Heart Rate Variability behaviour pattern was logged beat-by-beat throughout the monitoring process at a sampling rate of 1 kHz. After the digital and manual filtering for the elimination of premature ectopic beats and artefacts, 1000 uninterrupted RR intervals were required for data analysis. Only series with >95% sinus rhythm were included in this study.Reference Godoy, Takakura and Correa22
Mathematical analysis
Approximate entropy
Techniques based on entropy are routinely used in medical signal and data analysis.Reference Vanderlei, Vanderlei and de Abreu14,Reference Pimentel, Ferreira and Valenti23 Approximate EntropyReference Garner, de Souza and Vanderlei13,Reference Garner, Bernardo and Vanderlei15,Reference Pincus24,Reference Richman and Moorman25 is a process that evaluates the level of regularity and the unpredictability of changes over time series. Approximate Entropy is the logarithmic ratio of component-wise matching sequences from the signal length, N. Other parameters include r tolerance and M the embedding dimension. For instance, with studies assessing Heart Rate Variability in obese children,Reference Vanderlei, Vanderlei and de Abreu14 r is set to 0.2 and this represents 0.2 or, 20% of the standard deviation of the data sets RR intervals. A value of zero for Approximate Entropy would indicate a totally foreseeable series. Approximate Entropy increases with increasing chaotic response and irregularities. Further information regarding Approximate Entropy and it computation is found in the Kubios HRV® Manual.Reference Tarvainen, Niskanen and Lipponen26
Statistical analysis
At this point, we enforced various effect sizes to study the implications of the data. We did not evaluate normalityReference Anderson and Darling27–Reference Razali and Wah29 and so did not enforce the one-way analysis of variance,Reference Blanco-Topping30 or Kruskal–WallisReference McKight, Najab, Weiner and Craighead31 test as in previous studies. These two statistical tests are unable to discriminate adequately between the small changes in significance apparent here. Therefore, we examine the significances using their effect sizes.Reference Kazis, Anderson and Meenan32–Reference Thompson34.
Cohen’s d s Reference Cohen35 is the foremost subcategory of effect sizes.
 $$Cohen's{\mkern 1mu} \ {d_s} = {{{{\overline X}_1} - {{\overline X}_2}} \over {\sqrt {{{({n_1} - 1)SD_1^2 + ({n_2} - 1)SD_2^2} \over {{n_1} + {n_2} - 2}}} }}$$
It refers to the standardised mean difference between two groups of independent observations for the suitable sample. It is founded on sample means and provides a biased estimate of the effect size. Throughout the mathematical algorithm for Cohen’s d s , the numerator is the variation between the means of two groups of observations. The denominator is the pooled standard deviation. These differences are squared. Next, they are summed and divided by the number of observations minus one for bias, in the estimation of the variance. To conclude, the square root is imposed on the denominator.
 $$Hedges's{\mkern 1mu}\ {g_s}{\mkern 1mu} {\mkern 1mu} = {\mkern 1mu} {\mkern 1mu} Cohen's{\mkern 1mu} \ {d_s}{\mkern 1mu} {\rm{x}}{\mkern 1mu} {\mkern 1mu} \left[ {1 - {3 \over {4{\mkern 1mu} ({n_1} + {n_2}){\mkern 1mu} - 9}}} \right]$$
Hedges’s g s is unbiased.Reference Hedges and Olkin36 The change between Cohen’s d s and Hedges’s g s is very small in sample sizes >20. As regards, the Cohen’s d s and Hedges’s g s effect sizes’ designated ranges are 0.01 > very small effect; 0.20 > small effect; 0.50 > medium effect; 0.80 > large effect. These are the benchmarks from CohenReference Cohen35 and Sawilowsky.Reference Sawilowsky37
Results
A total of 70 volunteers of both genders between three and five years of age were split equally. Characteristics of the population are given in Table 1.
Table 1. Description of the characteristics of the population by group, gender, age (years), weight (kg), height (cm) and z-score (mean ± SD)

Childhood malnutrition’s effect on the autonomic dysfunction has been established by chaotic global analysis.Reference Barreto, Vanderlei and Vanderlei38 It was demonstrated to lessen the chaotic responses and irregularities of RR intervals. Then, Approximate Entropy is methodically applied to 25 parameters for tolerance, r, and embedding dimension, M (Figure 1 & Table 2). This determined that under 50% were appropriate when judged physiologically. This is since, chaos and irregularities usually decrease for pathological states.Reference De Souza, Vanderlei and Garner10,Reference Bernardo, Vanderlei and Garner11,Reference Barreto, Vanderlei and Vanderlei38 In Table 2, Approximate Entropy for controls and malnourished children has tolerances, r (0.1→0.5 in intervals of 0.1) and embedding dimensions, M (1→5 in intervals of 1). A similar survey of parameter space was achieved in the study with subjects exhibiting type I diabetes mellitusReference Garner, de Souza and Vanderlei13 and Chronic Obstructive Pulmonary Disease.Reference Garner, Bernardo and Vanderlei15
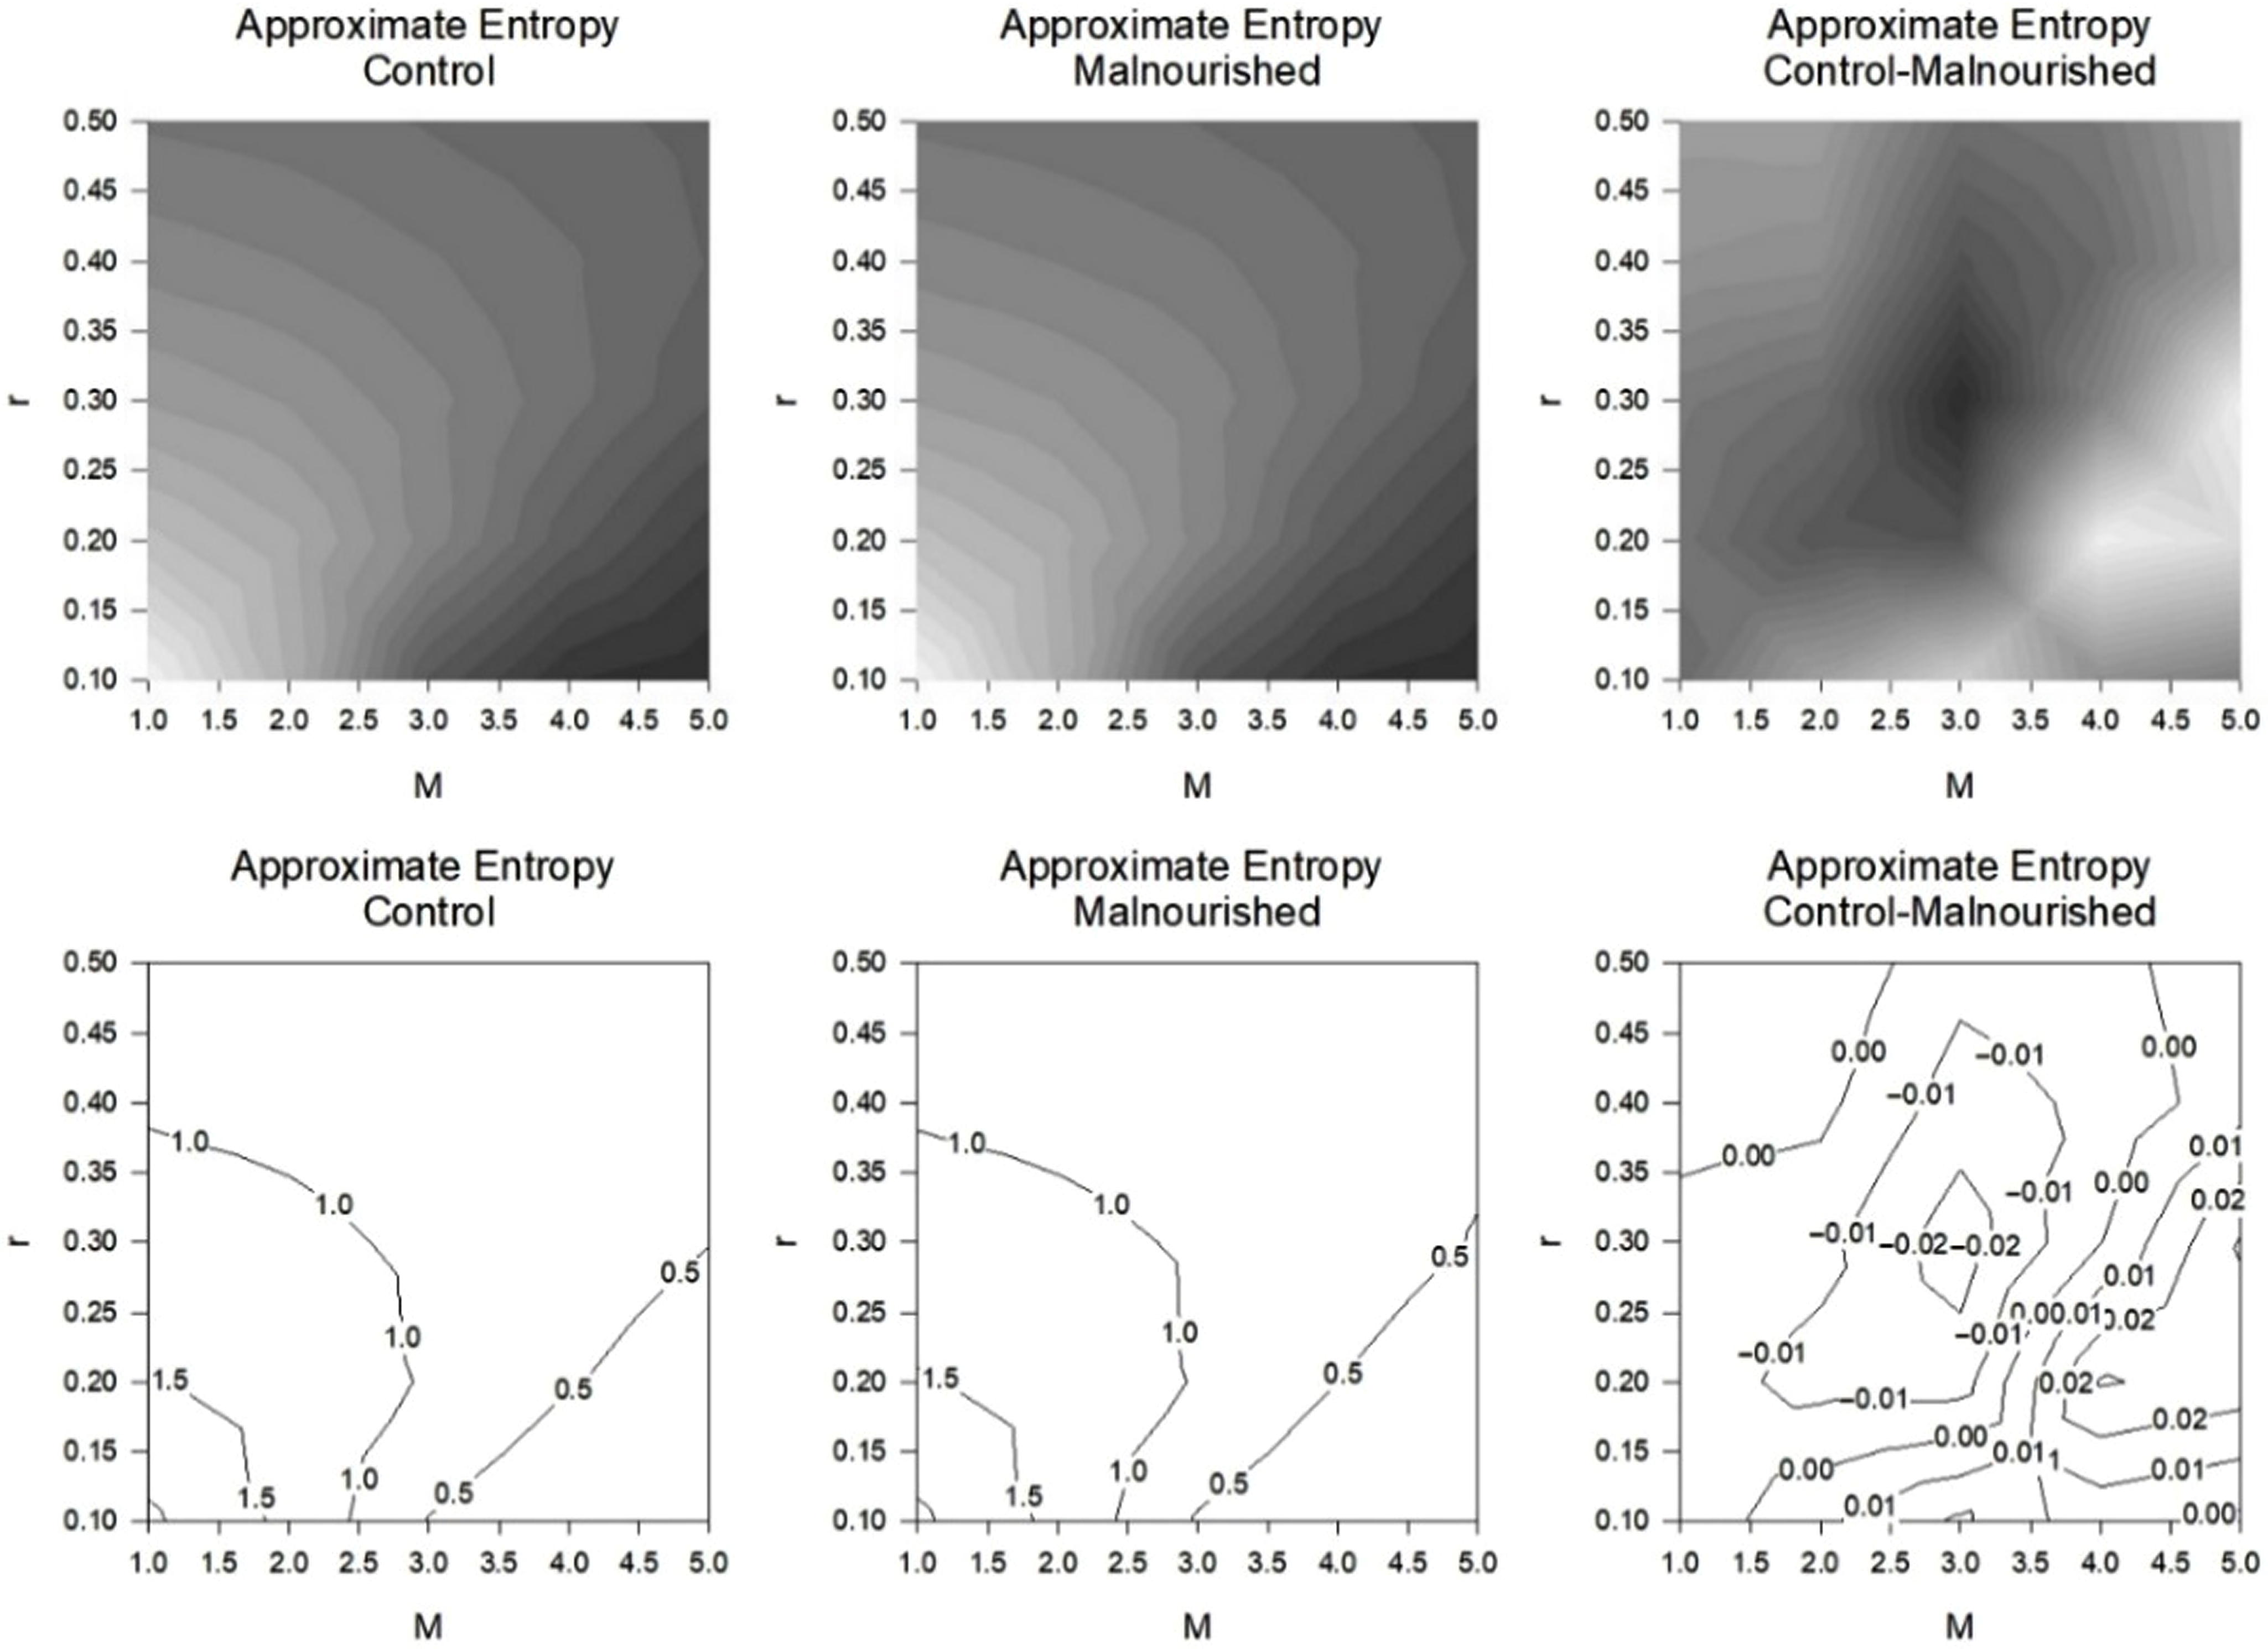
Figure 1. Contours Greyscale (Above) and Contour Lines (Below) Approximate Entropy (ApEn) for controls and subjects with Malnutrition (both n = 35). There were precisely 1000 RR intervals. Other parameters consist of tolerance, r and embedding dimension, M. There were 25 groups of values for tolerance, r (0.1→0.5 in intervals of 0.1) and embedding dimension, M (1→5 in intervals of 1) hence a grid of 5-by-5. The ApEn for the controls (left), those with Malnutrition (middle), the difference in ApEn between the controls and those with Malnutrition (right).
Table 2. Approximate Entropy (ApEn) for controls and malnourished (MAL) subjects (both n = 35). There were exactly 1000 RR intervals for each subject. Other parameters consisted of tolerance, r and embedding dimension, M. There were 25 groups of values for tolerance, r (0.1→0.5 in intervals of 0.1) and embedding dimension, M (1→5 in intervals of 1). Illustrated are the ApEn for the mean controls with standard deviation, mean malnourished and standard deviation, then their effect sizes for control versus malnourished by Cohen’s d s and Hedges’s g s

The bold values are the optimum values.
In this study on malnourished subjects, as the embedding dimension, M increases the level of tolerance, r is less critical. For, M = 1.0, two of the values for r are fitting as malnutrition has (and, should have) a lesser chaotic response than the control with negative effect sizes. This is physiologically accurate and was demonstrated by chaotic globals.Reference Barreto, Vanderlei and Vanderlei38 Here, when M = 2.0, three out of five r values were apt and still negative effect sizes. Similarly, for M = 3.0, one of the values for r is suitable and for M = 4.0, two of the five values for r are suitable. At M = 5.0, four out of the five values for r are apposite. All appropriate values have negative effect sizes for both statistical procedures, Cohen’s d s and Hedges’s g s .
Also, whilst the embedding dimension, M approaches 5.0, those values that are physiologically accurate have enlarged negative effect sizes by both measures. When studying the results in Table 2, we notice that the optimal statistical combination of M is 5.0 and r is 0.3 with ES = −0.2897 (Cohen’s d s) and −0.2865 (Hedges’s g s ).
On closer inspection, where the M values are fixed, this could be surpassed. Perusing in finer detail (Table 3), setting values of M and manipulating r. We set M = 3 and r = 0.1833→0.4167 in intervals of 0.0167, hence 15 values of Approximate Entropy. Then, M = 4 and r = 0.1833→0.4167 in intervals of 0.0167, hence a further 15 values of Approximate Entropy, and so forth, until an M value of M = 6. For combinations of M and r, we determine that M = 5 achieves the greatest significance when tolerance r = 0.3 This corresponds to ES = −0.2897 (Cohen’s d s) and −0.2865 (Hedges’s g s ), hence both with small effect sizes. This is the highest value of statistical significance reached for any of the combinations presented in either Tables 1–3.
Table 3. Effect sizes (ES) by Cohen’s d s and Hedges’s g s for the ApEn for controls versus malnourished subjects (both n = 35). Exactly 1000 RR intervals were required in the calculations for each subject. Other parameters consisted of tolerance, r and embedding dimensions, M which are fixed at 3, 4, 5 and 6. There were 15 groups of values for tolerance, r (0.1833→0.4167 in intervals of 0.0167)

The bold values are the optimum values.
Discussion
We endeavoured to evaluate different combinations of r and M in malnourished children. Malnutrition in children has been demonstrated as a condition that greatly reduces chaotic response.Reference De Souza, Vanderlei and Garner10,Reference Garner, De Souza and Vanderlei39 Results demonstrated that Approximate Entropy is able to identify the reduction in chaotic response and the best combination of M and r for this study was 5.0 and 0.3, respectively.
Approximate Entropy measurements have some advantages in that they can be applied to short time series (RR < 50). Likewise, it is reasonably accurately at responding in the presence of substantial levels of signal noise. Nevertheless, its foremost disadvantage is the optimal choice of parameters for tolerance, r and embedding dimension, M.
In this study, initially, we enforced 25 different combinations r (0.1→0.5 in intervals of 0.1) and embedding dimension M (1→5 in intervals of 1). It was anticipated that since malnutrition is a condition which lessens the chaotic response of Heart Rate Variability,Reference Barreto, Vanderlei and Vanderlei38 those combinations of r and M which increase their responses for malnutrition can be disregarded. They are physiologically inappropriate. These inapt values reached positive effect sizes for both Cohen’s d s and Hedges’s g s .
Thirteen out of twenty-five of the permutations provided a higher value for the control than for malnourished subjects. So, less than half of the computations provided a true assessment. When scrutinising the results further in Table 2, we can detect that the optimum combination of M is 5.0 and r is 0.3. We now need to examine the values more closely regarding the tolerance, r levels, whilst fixing M, embedding dimension (Table 3).
Consequently, for Table 3, we fixed the values of M and inspected the values more closely regarding its tolerance, r. Tolerance, r, was initially set at 0.1833 and increased up to 0.4167 in equal units (0.1833→0.4167 at intervals of 0.0167). Therefore, we computed 15 values for each value of embedding dimension, M. In Table 3, the embedding dimension, M, varies from 3 to 6. The results for the two effect sizes were similar. The highest level of discrimination for the suitable physiological responses by Cohen’s d s and Hedges’s g s was ES = −0.2897 and −0.2865, respectively (small effect size for M = 5.0 and r = 0.5). This is synonymous to Table 2.
Thus, Approximate Entropy has been demonstrated to be a moderately reliable marker if the embedding dimension M and tolerance r are carefully chosen such that the differences are maximised by Cohen’s d s and Hedges’s g s . There is at present no procedure or algorithm by which these values can be selected. So, Approximate Entropy can be viewed as an unpredictable marker which can only be used effectively when the M and r are selected by trial and error. Routinely, when assessing Heart Rate Variability studies, we set M = 2.0 and r = 0.2 where this represents 20% of the standard deviation of the time series.Reference Vanderlei, Vanderlei and de Abreu14 Now, in this study, that would give a positive effect size and as such, physiologically inapt. The chaotic global analysis would seem more reliable and dependable.Reference Barreto, Vanderlei and Vanderlei38 This is vital if we were enforcing Approximate Entropy when results were required online or under conditions that need to be calculated quickly as, for example, in an intensive care unit. It would be too slow and laborious to calculate all the possible values of Approximate Entropy. It would necessitate performing multiple calculations for every statistical outcome to reach the exact values to assess if an individual is pathological or healthy.
Approximate Entropy has been recognised to be an undependable mathematical marker. Yet, it has advantages such as performing well on short time series, even in the presence of substantial signal noise. Based on the results obtained, we encourage the use of the chaotic global methods as a substitute for judging severity of pathological conditions. Chaotic global analysis is easier to enforce, performs well on relatively short time series (RR > 256),Reference Garner, Vanderlei and Valenti40 even with levels of noise, discriminates between the groups better and needs less computational time.Reference De Souza, Vanderlei and Garner10,Reference Bernardo, Vanderlei and Garner11,Reference Vanderlei, Vanderlei and Garner41,Reference Vanderlei, Vanderlei and Garner42
Some points need to be addressed in our study. The present results should not be interpreted to smaller sample sizes, as we evaluated just 70 individuals. Different autonomic approaches were not used, including baroreflex sensitivity, skin conductance and neuroelectromyograph. It would provide additional physiological data for our analysis. And finally, our study reinforces the importance to emphasize the relationship between experimental HRV with clinical practice.
Conclusion
Childhood malnutrition has been established as a dynamic condition which lessens chaotic response. In this study, Approximate Entropy was able to identify the reduction in chaotic response during malnutrition. Until now, Approximate Entropy has been confirmed to be a relatively unreliable mathematical marker.
Acknowledgements
None.
Financial support
This research does not include any specific grants from public, commercial or non-profit sectors.
Conflicts of interests
The authors declare that there is no conflict of interests regarding the publication of this article. Data and MATLAB code used in the study remain confidential for commercial reasons.


