


Introduction
Since the 1990s, improved access to the forest canopy has created opportunities for well-replicated ecological studies of canopy patterns and processes (e.g., Nadkarni et al. Reference Nadkarni, Parker, Rinker and Jarzen2004). Vertical gradients in abiotic factors include sunlight intensity, temperature, humidity, and wind speed (Parker Reference Parker1995); and these in turn influence vegetation structure and quality (Ellsworth and Reich Reference Ellsworth and Reich1993; Fortin and Maufette Reference Fortin and Maufette2002; Oishi et al. Reference Oishi, Yokota, Teramoto and Sato2006). Variation among species combined with strong vertical gradients in abiotic and biotic factors may produce detectable patterns of vertical stratification (e.g., MacArthur and MacArthur Reference MacArthur and MacArthur1961; August Reference August1983; Longino and Nadkarni Reference Longino and Nadkarni1990).
Of all organisms in the canopy, arthropods are the most diverse (Erwin Reference Erwin1982). They are abundant across many different forest habitats and are used frequently in studies of vertical stratification (e.g., Rodgers and Kitching Reference Rodgers and Kitching1998; Preisser et al. Reference Preisser, Smith and Lowman1999; Basset et al. Reference Basset, Aberlenc, Barrios, Curletti, Bérenger and Vesco2001; Grimbacher and Stork Reference Grimbacher and Stork2007). Research in tropical canopies has repeatedly demonstrated distinct patterns of stratification, often with little overlap between canopy and understorey (UN) species (Longino and Nadkarni Reference Longino and Nadkarni1990; Charles and Basset Reference Charles and Basset2005). Recent research in temperate canopies also indicates stratification (Lindo and Winchester Reference Lindo and Winchester2006; Larrivée and Buddle Reference Larrivée and Buddle2009; Schroeder et al. Reference Schroeder, Buddle and Saint-Germain2009). Studies on temperate forests in eastern North America have shown decreased species richness and density in the canopy compared with the UN (Preisser et al. Reference Preisser, Smith and Lowman1999; Su and Woods Reference Su and Woods2001; Larrivée and Buddle Reference Larrivée and Buddle2009), though these patterns have not been consistent (Le Corff and Marquis Reference Le Corff and Marquis1999; Ulyshen and Hanula Reference Ulyshen and Hanula2007; Vance et al. Reference Vance, Smith, Malcolm and Bellocq2007; Schroeder et al. Reference Schroeder, Buddle and Saint-Germain2009). Larrivée and Buddle (Reference Larrivée and Buddle2009) reported that spider assemblages in a beech-maple forest differed in species composition between canopy and UN and recorded unique species from both habitats. Lindo and Winchester (Reference Lindo and Winchester2006) document changes in species assemblages of corticolous mites with increasing distance from the forest floor.
Whereas large-scale patterns of stratification (i.e., canopy versus UN) have been documented for macroarthropods (Preisser et al. Reference Preisser, Smith and Lowman1999; Su and Woods Reference Su and Woods2001; Vance et al. Reference Vance, Smith, Malcolm and Bellocq2007; Larrivée and Buddle Reference Larrivée and Buddle2009; Schroeder et al. Reference Schroeder, Buddle and Saint-Germain2009), fine-scale patterns remain poorly understood. In contrast, numerous well-replicated studies of microarthropods indicate patterns of small-scale stratification throughout the canopy (Winchester et al. Reference Winchester, Behan-Pelletier and Ring1999; Proctor et al. Reference Proctor, Montgomery, Rosen and Kitching2002; Lindo and Winchester Reference Lindo and Winchester2006; Beaulieu et al. Reference Beaulieu, Walter, Proctor and Kitching2010). In this study, we document fine-scale variation in canopy-dwelling macroarthropods. Our objective was to determine whether assemblages of foliage-dwelling arthropods exhibited heterogeneity across a vertical gradient from the UN to the upper canopy (UC) crown. We conducted our sampling in a temperate deciduous forest and selected beetles (Coleoptera) and spiders (Araneae) as focal taxa for species-level identification, as both are highly diverse and abundant in temperate forests. Stratification was defined in terms of four layers: understorey (UN), lower canopy (LC), mid canopy (MC), and UC. It was our primary objective to determine whether species richness, density, assemblage composition, and guild structure differed across these four strata. We predict differences in values of these measures to increase with increasing separation in vertical space, i.e. the largest observed differences will occur between the UN and UC.
Methods
Location and sampling protocol
Our sampling was conducted at the Morgan Arboretum, a 245-ha reserve in Ste-Anne-de-Bellevue, on the Macdonald campus of McGill University, Québec, Canada (45°26′N, 73°57′W). The Arboretum contains tracts of natural woodland and collections of exotic trees; natural stands of sugar maple (Acer saccharum Marshall) (Aceraceae) were selected for this study. We included mature trees with heights of ∼20–25 m. Trees were selected on the basis of canopy accessibility, which was accomplished using a mobile aerial lift platform, with a maximum working height of 26 m and a maximum horizontal reach of 11.7 m.
Stratification was defined in terms of four strata: UN, LC, MC, and UC, while recognising that these strata are somewhat artificial and overlapping categories. Strata were defined in relative terms rather than in absolute height because we considered this more biologically meaningful given the variance in both absolute tree height and depth of canopy foliage. Therefore, the LC was defined as the first several layers of branches encountered (∼10–12 m), the MC as the layers of branches at the midpoint of total tree foliage (∼15–17 m), and the UC as the several layers of branches at the very top of the foliage (∼20–25 m). The UN was defined as the first 2 m above the forest floor.
Foliage-dwelling arthropods were collected five times throughout the summer: in early- and late-June, in mid-July, and in early-and late-August. A total of 30 trees were selected and samples were collected in four strata of each tree to yield a total of 120 samples per collection period. A single sample consisted of six branches. To collect arthropods, a 1-m2-beating sheet was placed under each branch and the branch was shaken or struck with a stick until no additional individuals were collected. The beating sheet had a funnel in the centre to which a collecting cup containing ethyl alcohol was attached. All arthropods were stored in 70% ethyl alcohol. Spiders and beetles were extracted and identified to species using various keys (e.g., spiders: Dondale and Redner Reference Dondale and Redner1982; beetles: Downie and Arnett Reference Downie and Arnett1996; Arnett and Thomas Reference Arnett and Thomas2001; Arnett et al. Reference Arnett, Thomas, Skelley and Frank2002; Paquin and Dupérré Reference Paquin and Dupérré2003). Voucher specimens were deposited at the Lyman Entomological Museum, Ste-Anne-de-Bellevue, Québec, Canada.
Statistical analyses
We predicted that spider and beetle assemblages would respond differently to stratification, and therefore all analyses for these taxa were completed separately. Because foliage density differs among strata, it is not appropriate to use raw numbers of individuals collected from beating in analyses of density across strata. Therefore, numbers of individuals collected in each stratum were weighted by the mean mass of foliage per branch for each stratum. This mean was obtained by taking the dry mass of the foliage of 20 branches in each stratum. To determine differences in density among strata, we used ANOVA (SAS version 9.1, 2002–2004, SAS Institute Inc., Cary, North Carolina, USA) with stratum as a fixed factor and tree as a random factor. ANOVAs were completed for total number of spiders, total number of beetles, most common families, and of common species (i.e., species that represent more than 5% of the total catch for each group). We recognise that 5% is an arbitrary cut-off point, but selected this amount because it included all species present in at least one-third of all samples for a given stratum. In cases where raw data did not fit a normal distribution, we used log transformations.
To compare species richness across strata, we used individual-based rarefaction curves (Gotelli and Colwell Reference Gotelli and Colwell2001), using the software Ecosim version 8.0 (Gotelli and Entsminger Reference Gotelli and Entsminger2004), with 1000 iterations. The 95% confidence intervals were used to determine significance levels. To further support rarefaction analyses, we obtained estimates of total species richness in each stratum using the Jackknife2 incidence-based estimator (Chazdon et al. Reference Chazdon, Colwell, Denslow and Guariguata1998) and the abundance-based estimator (Chao et al. Reference Chao, Chazdon, Colwell and Shen2005). Estimators were calculated using EstimateS version 8.0 (Colwell Reference Colwell2006) with 50 randomisations of data and rare species assigned if they occurred in 10 or fewer samples. Using the same parameters, we calculated values for the Bray–Curtis index to compare similarity among communities. We also calculated Simpson's diversity measure (1/D) as a measure of evenness using EstimateS.
Nonmetric multidimensional scaling (NMDS) was used to determine whether assemblages of spiders and beetles were homogeneous among different strata. NMDS does not assume normality of data, nor does it constrain solutions to a particular axis (Clarke Reference Clarke1993; McCune and Grace Reference McCune and Grace2002) and is therefore advantageous compared with a correspondence analysis. PC-ORD version 4 was used for all analyses. Prior to ordination, abundance data were log-transformed to decrease the influence of dominant species. We specified six dimensions in the preliminary analyses and took the recommended number of dimensions (two or three) to re-run the ordination. We defined n samples as the number of individuals collected from a single stratum of a single tree, pooled over the five collection periods. To support differences found in NMDS ordination, a multi-response permutation procedure (MRPP) was used. MRPP yields both a P-value and a measure of effect size (the within-group agreement statistic).
Beetle and spider species were assigned to various guilds to assess how relative dominance of guilds differs across strata. Guild classification is determined by resource use rather than taxonomy (Root Reference Root1967) and is especially informative along gradients of resource quality and availability, like in forest canopies. Spiders were assigned to guilds based on hunting mode, and included jumpers, web-spinners, pursuers, or ambushers (following Ehmann Reference Ehmann1994). Beetle guilds followed Grimbacher and Stork (Reference Grimbacher and Stork2007) and included herbivores, predators, fungivores, saprophages/xylophages, or mixed feeding habits. We determined how the relative dominance of each guild differed across strata by using a χ 2-test to compare expected versus observed proportions of individuals of each guild. To control for Type II error, we used Bonferroni's correction.
Results
In total, 3954 spiders and 1749 beetles were collected, representing 37 and 101 species, respectively. Thirty-two of the 36 spider species collected were adults. Of this total, 22% were represented by a single individual (singletons) and 7% by two individuals (doubletons). In contrast, more than 40% of the beetle species (all adults) recorded is represented by singletons and nearly 20% more by doubletons. In addition to containing a high proportion of rare species, the beetle fauna was heavily dominated by two species, Phyllobius oblongus Linnaeus (Curculionidae) and Paratenetus fuscus LeConte (Tenebrionidae), which together comprised 66% of the total beetle catch. All other species represented 4% or less of the total number of individuals captured. One common species (20 individuals) was restricted to the UN: Sciaphilus asperatus Bonsdorff (Curculionidae), an invasive root-feeding weevil. Another common species (34 individuals) was collected only in the canopy: Litargus tetraspilotus LeConte (Mycetophagidae), a fungivore.
Six species of spiders were common (>5% in any given stratum): Eris militaris Hentz (Salticidae), Hentzia mitrata Hentz (Salticidae), Dictyna sublata Hentz (Dictynidae), Philodromus rufus vibrans Dondale (Philodromidae), Clubiona obesa Hentz (Clubionidae), and Theridion murarium Emerton (Theridiidae), and together represented >80% of all individuals collected. No species comprising of more than 0.2% of the total catch was restricted to either the canopy or UN samples.
Mean foliage dry weights for each stratum (±SE) were as follows: UN, 11.6 g ± 0.7; LC, 32.7 g ± 1.9; MC, 43.1 g ± 4.1; UC 68.9 g ± 4.1. Density of all spiders and all beetles was highest in the UN and decreased through consecutive strata (spiders: df = 3, 87, F = 5.443, P < 0.001; beetles: df = 3, 87, F = 36.536, P < 0.001; Table 1). Similar results were obtained for all common families (Table 1) and species, though differences among canopy strata were not significant for most spider families (Araneidae, Clubionidae, Dictynidae, Salticidae, and Theridiidae). Hentzia mitrata, a single common species of jumping spider, defied the pattern of decreasing density with decreasing height. This species increased significantly and consistently in abundance with height (Fig. 1), with 11, 97, 208, and 408 individuals collected from the UN, LC, MC, and UC.
Table 1 Mean density (±SE) per gram foliage of spiders and beetles, including dominant families in each of four canopy layers (UN, LC, MC, UC).

Letters indicate significant difference at P < 0.05.
UN, understorey; LC, lower canopy; MC, mid canopy; UC, upper canopy.

Fig. 1 Density of spiders compared with density of a single species, Hentzia mitrata, across four canopy layers (UN, understorey; LC, lower canopy; MC, mid canopy; UC, upper canopy). Different letters indicate significant differences between strata at P < 0.05.
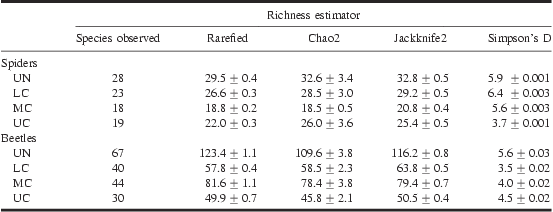
Observed species richness was highest in the UN for both taxa. Spiders and beetles differed in their rankings of species richness of canopy layers, though observed and rarefied estimates were consistent for each taxon (Table 2). Spiders showed a significant decrease in diversity from the LC to the MC and UC strata (Fig. 2A, Table 2). Chao2 and Jackknife2 estimators of total species richness also supported this ranking. Though rarefaction curves do not separate mid and UC, the estimators predict higher species richness in the UC (Table 2). Estimates of total richness do not substantially increase the number of species in each stratum. This combined with rarefaction curves, which appear to be nearing asymptote (Fig. 2A), suggest that sampling for spiders was relatively complete.
Table 2 Observed and estimated (mean ± SE) species richness and dominance for spiders and beetles across four canopy layers (UN, LC, MC, UC).
UN, understorey; LC, lower canopy; MC, mid canopy; UC, upper canopy.

Fig. 2 Rarefaction curves for species richness of spiders (A) and beetles (B) collected by strata (UN, understorey; LC, lower canopy; MC, mid canopy; UC, upper canopy). Curves were generated using an individual-based sampling algorithm, with 1000 iterations (Ecosim version 8.0). Bars represent the 95% confidence intervals.
Beetle species richness was significantly higher in the MC compared with the other canopy layers, as shown by observed and rarefied species richness and estimators of total species richness (Fig. 2B, Table 2). Estimates of total species richness predict substantially higher species richness for all strata, with 50+ additional species to be uncovered in the UN. The rarefaction curves (Fig. 2B) also indicate higher species richness for all strata relative to what was sampled during this study.
Simpson's diversity index (1/D) ranked spider assemblages as decreasing in evenness from the LC, UN, MC, and UC (Table 2). The evenness in the UC was influenced heavily by the most common species in that layer, H. mitrata, which represented more than 45% of the total catch. Common species in other strata represented less than 30% of the total for that stratum. According to Simpson's index, beetle communities increase in evenness from UN to UC.
The Bray–Curtis index does not indicate distinct canopy and UN assemblages for beetles. Instead, it suggests that the UC is the most dissimilar from the other strata (Table 3). Spider assemblages show a more predictable pattern: the similarity index decreases consistently with increasing distance, and adjacent strata are most similar. For both beetle and spider assemblages, the Bray–Curtis index suggests that the LC and MC contain the most similar assemblages, and the UN and UC the most dissimilar.
Table 3 Bray–Curtis index values across four canopy layers (UN, LC, MC, UC).

Values below double asterisks represent similarity of spider assemblages; values above represent similarity of beetle assemblages.
UN, understorey; LC, lower canopy; MC, mid canopy; UC, upper canopy.
NMDS ordination yielded a three-dimensional solution for spider communities, with a total of 82.7% variance explained and stress value of 16.2 with 400 iterations. Only Axes 1 and 2 are shown in Figure 3A, as Axis 3 yielded separation similar to Axis 2. Nearly 60% of the variance was explained by Axis 1, which widely separated the UN from all canopy layers. MRPP results suggest different assemblages in each stratum with each pair-wise comparison differing significantly (P < 0.0001; Table 4). Ordination of beetle communities produced a three-dimensional solution, with 81.2% of variance explained, and a stress value of 25.4 with 400 iterations. Again, only two axes are presented in Figure 3B. A Monte Carlo test indicated that lower stress was observed in less than 4% of runs with randomised data; however, the resulting ordination should be interpreted cautiously, as stress exceeds 20 units (McCune and Grace Reference McCune and Grace2002). There is large variance along the dominant axis (36.8% variance), although no clear separation of any strata. MRPP results suggest that all strata can be considered distinct, save the MC and LC. However, the within-group agreement statistic (a measure of effect size) is low for all comparisons (Table 4).

Fig. 3 Results of nonmetric multidimensional scaling ordinations (axes 1 and 2) for (A) spiders (3943 individuals, 33 species) and (B) beetles (1668 individuals, 41 species). Sample units for each stratum (UN, understorey; LC, lower canopy; MC, mid canopy; UC, upper canopy) are tree with collections for each date pooled.
Table 4 Effect size (agreement statistic) and significance of MRPP for spiders and beetles collected from four canopy layers (UN, LC, MC, UC).

MRPP, multi-response permutation procedure; UN, understorey; LC: lower canopy; MC, mid canopy; UC, upper canopy.
For spiders, proportions of individuals belonging to each guild differed significantly throughout all canopy layers (Table 5). The UN was dominated by web-spinners, which decreased in relative abundance through all subsequent canopy layers (Fig. 4A). Jumping spiders made up a much larger proportion of UC spiders, comprising nearly 70% of all spiders collected compared with 32% of spiders collected in the UN. For beetles, proportion of predators varied significantly throughout the strata (Table 5, Fig. 4B).
Table 5 χ 2-values for proportion of individuals belonging to four spider guilds and five beetle guilds.

Guild assignment follows Ehmann (Reference Ehmann1994) for spiders and Grimbacher and Stork (Reference Grimbacher and Stork2007) for beetles. Asterisks indicate significant difference at P < 0.05 across the four canopy strata.

Fig. 4 Proportion of individuals belonging to each guild of spider (A) and beetle (B) across four strata (UN, understorey; LC, lower canopy; MC, mid canopy; UC, upper canopy). Guild assignment follows Ehmann (Reference Ehmann1994) for spiders and Grimbacher and Stork (Reference Grimbacher and Stork2007) for beetles.
Discussion
We documented vertical heterogeneity in assemblages of foliage-dwelling beetles and spiders. Across four strata and even between adjacent strata, we measured differences in density, species richness, assemblage composition, and guild composition. We present no evidence for a distinct canopy fauna in terms of canopy-restricted species; however, we observed dissimilar composition between UN and canopy, and among canopy layers. Even at a small scale of spatial separation, different canopy layers present distinct arthropod assemblages. Our work is one of the few to illustrate this type of stratification of macroarthropods in temperate deciduous forest (but see Le Corff and Marquis Reference Le Corff and Marquis1999; Ulyshen and Hanula Reference Ulyshen and Hanula2007; Vance et al. Reference Vance, Smith, Malcolm and Bellocq2007; Larrivée and Buddle Reference Larrivée and Buddle2009; Schroeder et al. Reference Schroeder, Buddle and Saint-Germain2009).
Tropical forest canopies often demonstrate strong patterns of vertical stratification of macroarthropods. This has been documented for herbivorous insects (Basset et al. Reference Basset, Aberlenc, Barrios, Curletti, Bérenger and Vesco2001), ants (Bruhl et al. Reference Bruhl, Gunsalam and Lisenmair1998), and butterflies (DeVries et al. Reference DeVries, Murray and Lande1997). General patterns include higher density and species richness in the canopy (DeVries et al. Reference DeVries, Murray and Lande1997; Basset et al. Reference Basset, Aberlenc, Barrios, Curletti, Bérenger and Vesco2001; Charles and Basset Reference Charles and Basset2005), though opposite trends have been observed (Molleman et al. Reference Molleman, Kop, Brakefield, De Vries and Zwaan2006). Studies in temperate forests document few general patterns; some have indicated lower density in the canopy (Preisser et al. Reference Preisser, Smith and Lowman1999), while others have indicated no difference (Ulyshen and Hanula Reference Ulyshen and Hanula2007). Few studies have found evidence for macroarthropod canopy specialists in temperate forests. Deciduous canopies do not offer much refuge for overwintering arthropods, so even canopy-dwelling species would likely be forced to migrate to the forest floor to overwinter. It seems that the canopy macroarthropods of temperate deciduous forests consists only of a subset of UN species. Our results support this conclusion: of all the common species, only L. tetraspilotus was collected exclusively in the canopy. This species has also been collected from galls on red oak (Quercus rubra Linnaeus) (Fagaceae) (Klimaszewski and Majka, Reference Klimaszewski and Majka2007).
In this study, beetle species richness was more heavily influenced by singleton and doubleton species than was spider richness. Many of these species can be accurately labelled as “tourists” as they are specialist herbivores with nearby host plants. These account for about one-third of all singleton species observed. Spiders had fewer rare species, possibly because all spiders are generalist predators, rather than tourist herbivores that have wandered from a host plant.
Lower densities in the UC of both spiders and beetles may be maintained by biotic factors (e.g., predation, parasitism, prey availability), abiotic factors, or a combination of these factors. There is some evidence that predation pressure by birds is stronger in the canopy compared with the UN (Van Bael et al. Reference Van Bael, Brawn and Robinson2003) and may increase in intensity from the UN upwards (Aikens Reference Aikens2008). There is a large body of evidence indicating that avian predators effectively limit arthropod density (Holmes et al. Reference Holmes, Schutlz and Nothnagle1979; Marquis and Whelan Reference Marquis and Whelan1994; Gunnarsson Reference Gunnarsson1996; Philpott et al. Reference Philpott, Greenberg, Bichier and Perfecto2004). Prey availability has also been shown to be an important determinant of community structure (Halaj et al. Reference Halaj, Ross and Moldenke1998), and key prey items may be unavailable or less abundant in the UC. For herbivores, available leaf biomass is much higher in the canopy, so this would not play a role in limiting density. Instead, it seems likely that gradients in abiotic factors are important. The UC is a highly variable environment that subjects inhabitants to extremes of temperature, moisture, and wind (Parker Reference Parker1995). The UC is also exposed to large amounts of radiation, which decreases by more than 97% as sunlight reaches the forest floor (Canham et al. Reference Canham, Finzi, Pacala and Burbank1994). In contrast, the UN is more stable and sheltered and may represent more of a “sure bet” strategy for survival and reproduction. These same factors – favourable microclimate below and high predation pressure above – may also limit species richness and permit only a subset of species living in the UN to invade the canopy.
Species richness of spiders was high in the UN and LC and dropped significantly in the MC and UC. This suggests that only a subset of spider species present in the LC and UN are able to persist in the MC and UC. In contrast, beetle species richness did not follow a consistent pattern of decrease with increasing height; MC samples yielded higher species richness than LC or UC. Although Schroeder et al. (Reference Schroeder, Buddle and Saint-Germain2009) only sampled two strata, they documented a higher diversity of beetles in the canopy compared with the upper UN (comparable to our LC layer) – a finding consistent with ours. Fewer species of beetles than spiders appear to be limited by canopy height, which may indicate that conditions necessary for survival and persistence is different for spiders, perhaps requiring adaptations that fewer spider species possess. Most of the spider species richness is contained within the web-spinner guild, which may be more susceptible to wind. Higher wind speeds may destroy webs, which are costly to produce; they may also render the webs less effective as more web movement means greater visibility for potential prey. Additionally, since web-builder spiders are relatively sedentary, they may not escape high winds simply by moving to another stratum. Though spiders are excellent dispersers (Freeman Reference Freeman1946; Wise Reference Wise1993), most beetle species are capable of directed flight. Beetle communities may be more homogeneous through the canopy layers because most species spend their time moving between the strata.
Based on the assessment of abiotic factors potentially limiting spider diversity and diversity in the UC, we might predict exploitation of the UC by one or a few species that have adapted to harsher conditions. It appears that is the case in a single jumping spider species, H. mitrata, which was collected infrequently in the UN and increased in density through subsequent canopy layers. This species may exhibit adaptations lacking in other spider species. Members of other species that have managed to persist in the UC may show intra-population morphological or physiological variation in vertical space. For example, those individuals in the UC may exploit a lower surface area to volume ratio by having larger mass, and therefore avoid desiccation.
Acknowledgements
The authors thank C. Idziak and the staff of the Morgan Arboretum for providing support and access to field sites. The remarkable field assistance provided by J.F. Aublet, M. Larrivée, and C. Frost is gratefully acknowledged. Thanks also to the reviewers of this paper, particularly Dr. F. Beaulieu. This research was supported by a Natural Science and Engineering Research Council of Canada to K.R. Aikens, a NSERC Discovery Grant to C.M. Buddle, a Canadian Foundation for Innovation New Opportunities Grant (Project number 9548, to C.M. Buddle), and the Department of Natural Resource Sciences (McGill University).


