Introduction
Social anxiety disorder (SAD) is one of the three most frequent psychological disorders (Talati et al., Reference Talati, Pantazatos, Schneier, Weissman and Hirsch2013). SAD is signalled by persistent fear of social situations, in particular those involving strangers (American Psychiatric Association, 2013). The prevalence of SAD is between 5 and 12%, it affects women more than men, and the signs usually become evident at the onset of adolescence (Kessler et al., Reference Kessler, Chiu, Demler, Merikangas and Walters2005). Individuals with SAD frequently avoid social situations and engage in self-protective behaviours. This inhibits the resolution of fear in real contexts (Stangier et al., Reference Stangier, Heidenreich and Schermelleh-Engel2006) and perpetuates social anxiety (McManus et al., Reference McManus, Sacadura and Clark2008; Morgan and Raffle, Reference Morgan and Raffle1999).
Cognitive models have stressed the role of attentional biases in generating and/or maintaining social anxiety (Morrison and Heimberg, Reference Morrison and Heimberg2013). However, the attentional mechanisms leading to social anxiety (SA) have been approached with different hypotheses, which have increasingly relied on eye-tracking measurements for empirical testing. According to traditional approaches such as the avoidance hypothesis (Clark and Wells, Reference Clark, Wells, Heimberg, Liebowitz, Hope and Schnieder1995), subjects with high SA engage in self-focused attention in social situations. Self-focused attention is a significant maintaining factor in SA because it increases the access to negative thoughts and emotions and it inhibits the subject from observing external information that might disconfirm his fears. As SA increases, subjects tend to avoid the threatening negative stimulus. In contrast to the avoidance hypothesis, the hypervigilance hypothesis (Rapee and Heimberg, Reference Rapee and Heimberg1997) states that subjects with SA stay abnormally vigilant towards the social threat. Hypervigilance competes with the opportunity to attend to positive and neutral stimuli, which decreases the chances of reappraising the perceived threat (Fox et al., Reference Fox, Russo, Bowles and Dutton2001) and helps maintain high levels of social anxiety. Recent eye-tracking studies have found evidence of hypervigilance towards threatening stimuli in individuals with high social anxiety (Bantin et al., Reference Bantin, Stevens, Gerlach and Hermann2016; Lazarov et al., Reference Lazarov, Abend and Bar-Haim2016).
A more recent set of hypotheses claim that the concepts of ‘vigilance’ and ‘avoidance’ are potentially limited (Fox et al., Reference Fox, Zougkou, Ashwin and Cahill2015), as they do not address the possibility that attention is dynamic and goes through different stages (see, for example, Weierich et al., Reference Weierich, Treat and Hollingworth2008). In this context, two hypotheses were suggested considering the time course of attention in social anxiety. The first one, the vigilance-avoidance hypothesis (Mogg et al., Reference Mogg, Bradley, Miles and Dixon2004), posits that there is an initial automatic orientation to threatening stimuli (initial hypervigilance), which is followed by avoidance behaviour in order to minimize anxiety (Mogg et al., Reference Mogg, Bradley, De Bono and Painter1997). The second one, the maintenance hypothesis (Fox et al., Reference Fox, Russo, Bowles and Dutton2001), proposes that SAD patients are not constantly hypervigilant, as suggested by the hypervigilance hypothesis. Instead, their attention is at least normal (i.e. equivalent to that of controls) in the first contact with the stimulus, but they are unable to disengage from the perceived threat once it is attended (Amir et al., Reference Amir, Elias, Klumpp and Przeworski2003).
According to Armstrong and Olatunji (Reference Armstrong and Olantunji2012) the maintenance hypothesis may be considered the most promising one among the four. Nevertheless, recent studies continue to provide evidence in favour of hypervigilance (see above). A possible explanation for this apparent contradiction is that testing for dynamic attention biases, such as the ones proposed by the vigilance-avoidance or the maintenance hypotheses, requires measurements and methods with appropriate temporal resolution, namely the collection of eye-tracking data in different segments of the same trial. Inspecting the temporal course of attention within the trial, rather than just the amount of attention paid to a given target, is one solution for the challenge of tapping into attentional engagement vs disengagement, adding to the solutions recently put forward by Clarke et al. (Reference Clarke, MacLeod and Guastella2013). If only whole-trial measures are collected (with no specification of temporal course), dynamic attention biases may remain unknown or may even be mistaken by static biases such as hypervigilance. Current studies seem to underestimate the testing of dynamic attention biases in social anxiety, which involve atypical disengagement processes (impaired disengagement, in the case of maintenance bias). Therefore, evidence in favour of the hypervigilance hypothesis may be overemphasized, while that in favour of the maintenance hypothesis may remain underemphasized.
An additional debate within the field of social anxiety and attention concerns the emotional valence of the stimulus. Though it seems intuitive that faces showing negative emotions are threatening, empirical testing brought little confirmation that the attentional bias is triggered only by negative stimuli. Instead, the relevant issue may be whether faces are emotional (positive or negative) or neutral (Bantin et al., Reference Bantin, Stevens, Gerlach and Hermann2016). In individuals with high SA, positive information may signal the onset of a social interaction whose failure is anticipated, and thus it may be as threatening as negative information. Positive information may also announce positive evaluation, which may be as frightening as negative evaluation for socially anxious individuals (Chen et al., Reference Chen, Clarke, MacLeod and Guastella2012; Weeks et al., Reference Weeks, Heimberg and Rodebaugh2008a,Reference Weeks, Heimberg, Rodebaugh and Nortonb). Several studies showed that positive stimuli may be as effective as negative ones in eliciting avoidance (Horley et al., Reference Horley, Williams, Gonsalvez and Gordon2003), hypervigilance (McTeague et al., Reference McTeague, Shumen, Wieser, Lang and Keil2011; Roelofs et al., Reference Roelofs, Putman, Schouten, Lange, Volman and Rinck2010; Weeks and Howell, Reference Weeks and Howell2012; Wieser et al., Reference Wieser, Pauli, Alpers and Mühlberger2009a), or vigilance-avoidance (Calvo and Avero, Reference Calvo and Avero2005; Gamble and Rapee, Reference Gamble and Rapee2010; Garner et al., Reference Garner, Mogg and Bradley2006; Horley et al., Reference Horley, Williams, Gonsalvez and Gordon2003; Lange et al., Reference Lange, Heuer, Langner, Keijsers, Becker and Rinck2011; Vassilopoulos, Reference Vassilopoulos2005; Wieser et al., Reference Wieser, Pauli, Weyers, Alpers and Mühlberger2009b). To our knowledge, maintenance has only been found for negative stimuli (Amir et al., Reference Amir, Elias, Klumpp and Przeworski2003; Buckner et al., Reference Buckner, Maner and Schmidt2010; Schofield et al., Reference Schofield, Johnson, Inhoff and Coles2012).
The contradictory findings about the mechanisms and triggers of attentional biases in SA might be explained by personality traits of the participants. In order to account for the influence of personality traits, Binelli and colleagues (Reference Binelli, Muñiz, Sanches, Ortiz, Navines, Egmond and Nartín-Santos2015) and Perlman and colleagues (Reference Perlman, Morris, Vander, Green and Doyle2009) proposed a trait-congruency perspective. According to this view, some personality traits can predispose subjects to search and process information that is convergent with their particular characteristics. For example, in an emotional Stroop task, a strong trait of optimism may increase the selective attention to positive words and decrease the latency of skin conductance response for negative words. A similar result has been found for individual differences in visual tasks. More optimistic subjects are more likely than pessimistic ones to divert their eye gaze away from images of skin cancer. Rauthmann et al. (Reference Rauthmann, Seubert, Sachse and Furtner2012) used the big five model to characterize participants and saw the ones with high neuroticism (including fear/phobia, anxiety and depression) maintain the attention focus on the eyes of fearful faces, suggesting the inability to disengage from an emotionally arousing stimulus. Concerning depression, it has been suggested that depressed participants are less able to disengage attention from negative stimuli than non-depressed ones (Gotlib and Joormann, Reference Gotlib and Joormann2010; Kaspar and König, Reference Kaspar and König2012), and this may be due to difficulties with inhibitory control and to memory biases. Both limitations may affect the regulation of emotions. Similarly, Peckham et al. (Reference Peckham, McHugh and Otto2010) suggested that subjects with depressive traits have a maintenance bias towards dysphoric stimuli and tend to ignore positive ones. It has also been suggested that the repeated presentation of an emotional stimulus to depressive subjects may lead to increasingly more negative or increasingly less positive interpretations over time (Dearing and Gotlib, Reference Dearing and Gotlib2009). Overall, these studies suggest that the personality structure (e.g., depressive personality) of socially anxious individuals can modulate his/her attention biases, but little is known about this topic. Characterizing the personality traits of subjects with higher levels of SA may increase the consistency of experimental results and, thus, provide a deeper understanding of the attentional bias to emotional stimuli.
In the present study, we analyse the time course of attention to positive, negative and neutral stimuli in undergraduate participants with different levels of social anxiety (high vs low) using eye-tracking measures. Besides their temporal resolution, eye-tracking measures hold the advantage of avoiding the confound between attentional (un)engagement and non-attentional freezing, a critical research problem in the field of anxiety (Clarke et al., Reference Clarke, MacLeod and Guastella2013). Our decision to examine a non-clinical sample was grounded on a dimensional perspective, according to which social anxiety symptoms vary in a continuous manner across individuals (Abramowitz et al., Reference Abramowitz, Fabricant, Taylor, Deacon, McKay and Storch2014). Under this dimensional (continuum-like) view, the mechanisms of social anxiety found in non-clinical participants may be easily generalized to clinical samples (Russell and Shaw, Reference Russell and Shaw2009). Moreover, social interaction is a key element of undergraduate academic contexts; these students are particularly at risk of developing clinical levels of social anxiety (Purdon et al., Reference Purdon, Antony, Monteiro and Swinson2001). Examining social anxiety in these populations is a way of increasing awareness of this problem and of the potential relevance of early intervention. We used an ‘extreme groups design’ (Preacher et al., Reference Preacher, Rucker, MacCallum and Nicewander2005), and carried out both a group comparison (high social anxiety group vs low social anxiety group) and a regression approach (relating anxiety levels of all participants with their eye-tracking indexes). Our first goal is testing which of the main hypotheses or mechanisms – hypervigilance, avoidance, vigilance-avoidance and maintenance – may better explain the attentional biases in participants with SA, as well as determining the triggers (negative vs positive and neutral stimuli) of biased attention.
In order to determine whether attention biases are static (hypervigilance, avoidance) or dynamic (vigilance-avoidance, maintenance), we look both into whole-trial measures (eye-tracking measures based on the length of the entire trial, 1500 ms) and time-dependent measures (patterns of change across three time segments within the trial, 500 ms each). Significant whole-trial indices in the absence of time-dependent ones will indicate static biases (avoidance as decreased attention, hypervigilance as increased attention). The presence of significant time-dependent indices will be taken as evidence of dynamic attention biases, regardless of the results for whole-trial indices. In the case of significant time-dependent indices, increased drops in overt attention along the trial for participants with high social anxiety will support the vigilance-avoidance mechanism, while increased drops for participants with low social anxiety will indicate maintenance biases in the high social anxiety group.
Using positive, negative and neutral face types will allow us to determine the target of the attention bias. Presenting face pairs (and not single faces per trial) will allow us to identify competitor effects (e.g. increased attention for positive faces when these are paired with negative ones, but not when paired with neutral ones). Competitor effects are important to clarify the nature of the active mechanism. Following the previous example, if happy faces increase the attention of participants when paired with negative, but not with neutral faces, this means that participants may be avoiding negative faces, instead of being vigilant over positive ones.
Our second goal is to explore the influence of pathological personality traits on the attention bias. To that purpose, we will compare the data from participants with high social anxiety showing normal, dependent and depressive personality features. We want to gain preliminary insights on the extent to which personality structure modulates the attention biases found in the high social anxiety group and, thus, on whether the assessment of personality structure may improve future experimental and clinical work.
Method
Participants
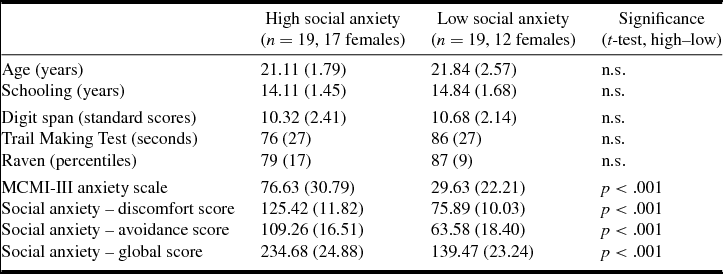
Fifty-five Portuguese undergraduates with normal or corrected-to-normal vision volunteered to take part in the experiment. From these, 38 were selected based on their social anxiety levels and assigned to one of two groups after evaluation: high social anxiety or low social anxiety (Table 1). None of the participants had a clinical record of traumatic brain injury, stroke, epilepsy or psychiatric disorder other than social anxiety symptoms. Participants were screened for cognitive impairment with the digit subtest of the Wechsler Memory Scale (Wechsler, Reference Wechsler1945), the Trail Making Test (Reitan, Reference Reitan1958) and Raven's Progressive Matrices (Raven et al., Reference Raven, Raven and Court1998). They were also screened for anxiety levels (Moderate Clinical Syndrome Scale for Anxiety, from the Millon Clinical Multiaxial Inventory, MCMI-III; Millon et al., Reference Millon, Millon, Davis and Grossman2009).
Table 1. Means (standard deviations) of demographic, cognitive and emotional variables in high vs low social anxiety groups
n.s., not significant (p > .05).
Participants’ final selection and assignment to high vs low social anxiety groups (Table 1) was based on scores provided by the Scale of Anxiety and Avoidance in Social Performance and Interaction (‘Escala de Ansiedade e de Evitamento em Situações de Desempenho e de Interação Social, EAESDIS’; Pinto-Gouveia et al., Reference Pinto-Gouveia, Cunha and Salvador2003). The instrument comprises a discomfort subscale and an avoidance subscale and both subscales scores sum to compute a global social anxiety score. Percentiles were computed for the initial (n = 55) sample. Participants scoring above percentile 60 on the global scale were assigned to the high social anxiety group (n = 19), and those below percentile 40 to the low social anxiety group (n = 19). As shown in Table 1, the groups did not differ in demographic or cognitive measures, and there were significant differences in anxiety levels and social anxiety scores.
In order to investigate the effects of personality structure on the attentional bias of participants with high levels of social anxiety, we identified subsamples of high social anxiety participants with normal (n = 5), dependent (n = 4) and depressive (n = 5) personality structures using the Moderate Personality Disorder Scales from the MCMI-III (Millon et al., Reference Millon, Millon, Davis and Grossman2009).
Materials
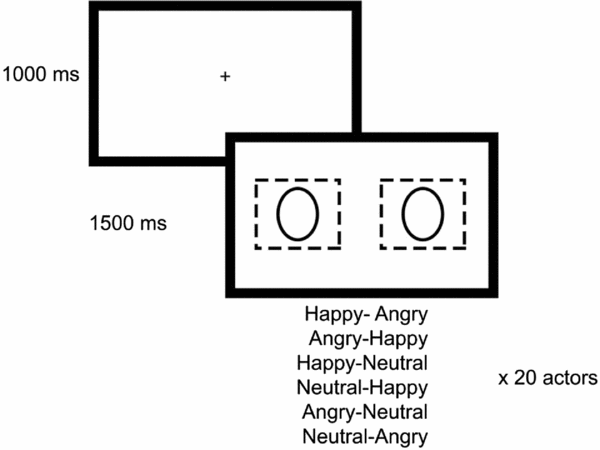
Stimuli consisted of pairs of faces. We used pictures taken from the Karolinska Directed Emotional Faces database (KDEF; Lundqvist et al., Reference Lundqvist, Flykt and Öhman1998), and validated for the Portuguese population by Fernandes and Bramão (Reference Fernandes and Bramão2013). Our stimulus set comprised three emotional expressions (happiness, anger, neutrality; see Shechner et al., Reference Shechner, Jarcho, Britton, Leibenluft, Pine and Nelson2013) posed by 20 different actors. These were the actors who elicited higher inter-rater agreement (among 280) concerning valence classification in the validation study. The pictures from each actor were arranged in six different pairs (left–right): happiness-anger and anger-happiness, happiness-neutrality and neutrality-happiness, anger-neutrality and neutrality-anger, generating a total of 6 pairs × 20 actors = 120 pairs (Fig. 1). Faces were outlined with an oval shape, and laid over a black background, left and right to the central point of the stimulus. The size and the position of the faces was chosen so as to allow participants to view each of them in the fovea when fixating them (width of 1.9 deg), and to view both of them in the parafovea when fixating a central point (picture centre placed 4.9 deg away from the central point of the monitor). The central fixation cross had a crucial role in securing attention to an initial neutral target, so that participants may afterwards manifest their engagement in emotional vs neutral stimuli, as precluded by Clarke et al. (Reference Clarke, MacLeod and Guastella2013).
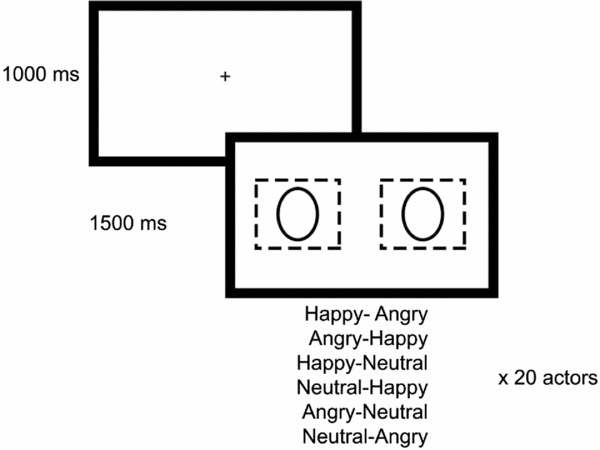
Figure 1. Stimuli presentation task
Apparatus and procedure
Eye movements were recorded with the SMI RED 500 remote system (http://www.smivision.com). Participants sat 70 cm away from the monitor. They were asked to look at the pictures while standing still and avoid blinking during the presentation of faces. The recording session started with a 9-point calibration procedure, and this initial calibration was repeated for tracking errors larger than 1 deg. Each trial started with a fixation cross (1000 ms), followed by a face pair (1500 ms; Fig. 1). The presentation order of face pairs was randomized across subjects.
Data pre-processing
Trials were divided into three time segments (0–500 ms, 500–1000 ms and 1000–1500 ms) and inspected for signal quality in each time segment. Trials with more than 150 ms of signal loss/artifacts in any time segment were rejected.
Events were extracted with a high-speed algorithm, based on the detection of saccades. Fixations shorter than 50 ms were excluded from the analysis. We placed rectangular areas of interest around each face and computed the total dwell time per emotion and time segment.
Statistical analysis
In order to identify eye-tracking signatures of social anxiety, we first analysed whole-trial measures. The latency of first fixation was defined as the time passed before entering the face-area of interest (AOI) for the first time during the trial. First-fixation duration referred to the first fixation on the face, and dwell time to the time spent in doing fixations and saccades within the face-AOI. If a given face is the first one to be visited during the trial, then it is highly likely that the first fixation occurs early (in the first 500-ms time segment). However, this is not always the case, since half the faces should be visited in second place. Therefore, first fixations may happen late within the trial. To analyse whole-trial measures, we ran a mixed ANOVA with Emotion (happiness vs anger vs neutrality) as within-subject factor and Group (high vs low social anxiety) as a between-subjects factor, focusing on the Group main effect. Considering sample size, the statistical power for detecting a significant Group effect (α = .05) was .45 for medium and .84 for large effects (G*Power 3.1.9.2; Faul et al., Reference Faul, Erdfelder, Lang and Buchner2007); the statistical power for detecting a significant medium interaction effect was .79.
We then moved to time-dependent measures and computed dwell times across the time segments of the trial (t 1 = 0–500 ms, t 2 = 500–1000 ms, t 3 = 1000–1500 ms). Following the algorithms from the analysis software, dwell time in a given segment was computed as the whole length of saccades and fixations that were initiated in that time segment. This means that, when a given event (saccade or fixation) crossed the boundary between adjacent segments (e.g. one fixation starting in segment 1 finished in segment 2), the length of that event was assigned to the first segment (e.g. segment 1 in our example). When analysing time-dependent measures, we ran mixed ANOVAs with Time segment (t 1 vs t 2) as within-subject factor and group (high vs low social anxiety) as a between-subject factor. Here, we focused on responses to each emotion (happiness, anger, neutrality) and we did one test per emotion, following the logic of planned comparisons. In cases of significant group effects on a given emotion, we inspected competitor effects. Competitor effects refer to potential differences in the response to a given face type (e.g. anger) as a function of its pair in the stimulus picture (happiness vs neutrality, see Introduction). Considering sample size, the statistical power for detecting a significant Time segment × Group interaction (α = .05) was .85 for a medium effect (G*Power 3.1.9.2).
In parallel with group comparisons, we ran a regression analysis on the total sample (n = 38) separately for each emotion, using two predictors (global Social Anxiety score and the Anxiety score from MCMI-III) and the eye-tracking measures as criterion variables. Considering the correlation between these two predictors (r = .67), we used Budescu's dominance analysis to partition R 2 and quantify the amount of explained variance attributable to each predictor after one controls for multicollinearity (Budescu, Reference Budescu1993).
We also corrected inflated risk of Type I error using the Benjamini–Hochberg (B-H) procedure to hold the false discovery rate at 5% (Benjamini and Hochberg, Reference Benjamini and Hochberg1995; Yekutieli and Benjamini, Reference Yekutieli and Benjamini1999).
The effects of personality structure on whole-trial and time-dependent measures were investigated with non-parametric tests for independent groups. Again, we tested each emotion separately. There are no well-established procedures for power calculations in non-parametric tests (Fan et al., Reference Fan, Zhang and Zhang2011), although it is known that the Kruskal–Wallis test has a greater power than the equivalent F-test, when the population distributions are not normal.
Results
Whole-trial measures
Table 2 shows the descriptive statistics for the three whole-trial measures we analysed (see Method). The latency of first fixation values indicates that participants took on average ~450 ms to enter each face. This value is the result of two very different scenarios: one in which participants began the trial by looking into the face under analysis (target face), another where they looked first into the competitor face (dwell time ~550 ms) and then went to the target face. These two scenarios were highly balanced (in ~50% of trials they went first to the target face) and participants visited each face only once in most trials (faces were revisited in only 19% of trials, with an average of 1.3 fixations in each face). Therefore, the dominant eye pattern seems to have consisted of a decision period (~200 ms) before entering one of two faces, followed by gaze on one of the two faces (~550 ms), and then by gaze on the other face (~550 ms). A decision period around 200 ms would generate a latency of 200 ms when the target face was the first one to be visited, and a latency of ~750 ms (200 + 550 ms) when it was the second one to be visited ((200 + 750)/2 ~ 450 ms).
Table 2. Mean (standard deviation) values for whole-trial measures

There were no differences between high and low social anxiety groups for the latency of first fixation (F(1,36) < 1, p = .874), first-fixation duration (F(1,36) < 1, p = .818) and dwell time (F(1,36) < 1, p = .766). The absence of a social anxiety group effect was similar for the three emotions (null interaction between Group and Emotion, F < 1).
When the social anxiety measures, as well as the anxiety level, were used to predict the eye tracking measures for each emotion, no significant regression models were found (R 2 < .2, uncorrected p > .05; B-H corrected p > .2).
Dwell time across time segments
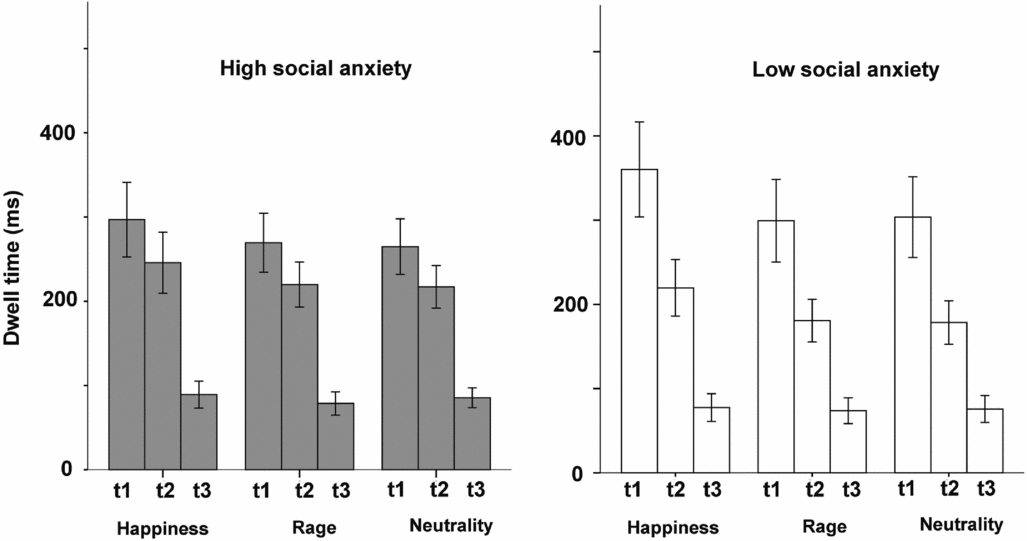
Variations in dwell time across the three trial segments are illustrated in Fig. 2, for high and low anxiety groups separately. Dwell times dropped across the three segments for both groups. Since changes started in the transition from the first to the second time segment, we focused on this comparison.
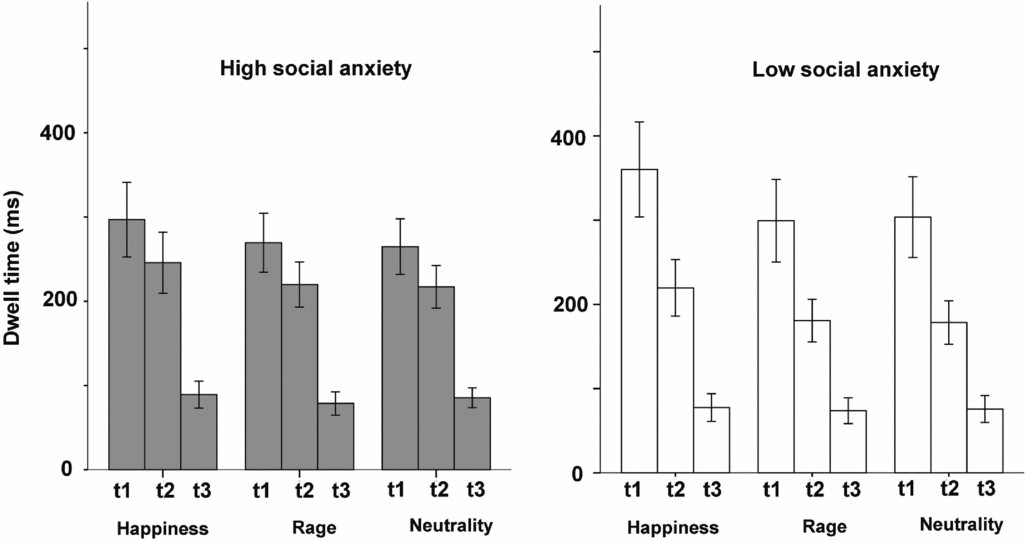
Figure 2. Dwell times across the three trials segments for high and low SA group (mean ± standard error of the mean)
The ANOVA for happiness showed a significant Time × Group interaction (F(1,36) = 4.26, p = .046, η2 p = .11), indicating increased drops in dwell time in low social anxiety compared with high social anxiety when entering the second time segment (Fig. 3). The interaction was non-significant for anger (p = .102) and marginal for neutrality (F(1,36) = 3.94, p = .055, η2 p = .11). Analyses of competitor effects (Time × Competitor × Group) for happy faces showed no significant results (p = .48), meaning that the type of face pair (anger vs neutrality) did not affect participants’ oculomotor behaviour. There were no competitor effects for neutral faces either (p = .49).

Figure 3. Drop in dwell time from segment 1 to segment 2 for high and low SA group (mean ± standard error of the mean)
In the regression analysis, the social anxiety and the anxiety measures were used to predict the drop in dwell time between time segment 1 and time segment 2 for each emotion type. The regression model for happy faces was marginally significant (R 2 = .156, p = .056), showing a negative effect of social anxiety on drops in dwell time (β = –.47, p = .036) as well as a non-significant effect of anxiety (β = +.12, p = .580). Budescu's dominance analysis indicated that social anxiety has a clearly larger contribution for drop in dwell time (C = .134) when compared with Millon's anxiety score (C = .022). Regression models for anger and neutral faces were not significant (R 2 < .1, p > .15).
Effects of personality disorder (high social anxiety group)
Non-parametric tests comparing the oculomotor behaviour of normal (n = 5), dependent (n = 4) and depressive (n = 5) high social anxiety participants (Fig. 4) showed a marginal significant difference in whole-trial dwell time for neutral faces (Kruskal–Wallis test: χ2 = 5.6, d.f. = 2, p = .062): dependent participants showed short dwell times when compared with depressive participants (mean ranks: 5.0 vs 11.0). However, this difference become non-significant after applying correction for false discovery rate (B-H corrected p = .558). Neither temporal changes (drops in dwell time) nor other whole-trial measures (latency of first fixation, first fixation duration) showed differences between personality groups. Given the small number of participants in each personality group, it is highly likely that we did not have enough power to detect differences between subgroups concerning whole-trial measures (after B-H correction) or to safeguard the absence of significant differences concerning temporal changes. Therefore, these results should be considered merely preliminary.

Figure 4. Whole trial dwell time for normal, dependent and depressive in high SA participants
Discussion
It seems well-established that automatic cognitive biases towards social information are associated with the aetiology and maintenance of social anxiety (e.g. Bögels and Mansell, Reference Bögels and Mansell2004; Morrison and Heimberg, Reference Morrison and Heimberg2013), but the mechanisms (vigilance vs avoidance, static vs dynamic) and triggers (positive, negative, neutral stimuli) of the attention bias remain unclear. Our first goal was to clarify these mechanisms and triggers.
We saw that participants with high vs low social anxiety levels did not reveal any differences in eye-tracking measures for the whole trial (latency of first fixation, first fixation duration, dwell time). These null results were not due to lack of statistical power. However, the groups differed in the time course of overt attention during the trial (dwell time across three successive time segments). Specifically, participants with high social anxiety were slower in disengaging their attention from happy faces. In line with the results of group comparisons, social anxiety predicted drops in dwell time on happy faces across time segments (indices of disengagement), but not with whole-trial measures.
Concerning the mechanisms of the attention bias in social anxiety, our results converge into supporting the maintenance hypothesis The group-comparison approach showed that the attention of individuals with high levels of social anxiety was not deviant during initial stimulus detection (in our case, in the initial segment), but it became deviant in the second time segment, when the subject was unable to disengage from the threatening stimuli. The absence of competitor effects – i.e. there was maintenance on happy faces whether the other face was angry or neutral – suggests that participants were strictly vigilant on happy faces, and maintenance was not a means to avoid negative (angry) facial expressions. Consistent with this, the regression approach showed that social anxiety, but not general anxiety levels, accounts for maintenance (smaller drops in dwell time), supporting the specificity of our results to social anxiety.
The fact that persistent engagement was triggered by happy faces is consistent with previous evidence that the attention bias in social anxiety is not limited to negative emotions, and it highlights the negative impact of positive facial expressions on subjects with high levels of social anxiety (e.g. Garner et al., Reference Garner, Clarke, Graystone and Baldwin2011). Determining whether this negative impact arises from fear of positive evaluation or from fear of the mere onset of interaction (see Introduction) is an interesting question for future research. Whatever the case, the presence of an attention bias for happy faces strengthens the idea that the processing biases of socially anxious individuals may go well beyond attention: they may be interpretation biases (Kashdan et al., Reference Kashdan, Weeks and Savostyanova2011), emerging from an inadequate theory of mind that does not afford predicting the thoughts and actions of others (Premack and Woodruff, Reference Premack and Woodruff1978).
Statistically significant maintenance (persistent engagement) was neither triggered by angry faces nor by neutral ones, although group differences for neutrality approached significance (p = .055). This is somehow surprising, but one possible explanation is that the marginal bias of apparent maintenance for neutral faces was of a different nature: it may actually have reflected vigilance-avoidance for emotional stimuli in general (positive and negative), a mechanism that would generate persistent attention to neutral stimuli in the second time segment as a way of escaping (avoiding) emotional ones. It is possible that two different mechanisms – maintenance for happy stimuli and vigilance-avoidance of emotional stimuli in general – were present in the (possibly heterogeneous) group, and that the maintenance bias was dominant. Disentangling the effects of the two mechanisms seems, thus, a future challenge, which may be partly overcome with subject-level analyses.
The exploration of personality effects showed no effects on the maintenance (dynamic) bias, and significant effects on whole-trial measures (static bias) that vanished after statistical correction (they may be false positives). We should remain extremely cautious about these results, since we may be dealing with an underpowered sample, which casts doubt on both the null findings and the false positives. These are, nevertheless, preliminary indications that may guide future research, and they deserve consideration in this sense.
Our relevant null finding was that dependent, depressive and ‘normal’ personality types show similar dynamic biases (attention maintenance), as measured by changes in dwell time across segments. Therefore, the possibility that the maintenance bias is rooted in the general mechanisms of social anxiety, rather than being permeable to personality structure, remains open.
Our possibly significant finding (to explore in the future, with increased statistical power) was that depressive participants seem to have a static hypervigilance bias, in that they tend to fixate neutral faces for longer periods. The association between depressive personalities and hypervigilance is known, but hypervigilance on neutral stimuli should not be expected. On the one hand, most cognitive models of depression predict that depressive individuals exhibit negative attentional, memory and interpretation biases (Beck, Reference Beck1967, Reference Beck1976). On the other hand, there is previous evidence that these participants show hypervigilance (or maintenance) towards negative facial expressions (see Introduction). One explanation of our findings might relate to the fact that depressive individuals tend to keep engaged in sad negative stimuli – which represent their emotional state, but not necessarily in angry negative stimuli (Duque and Vázquez, Reference Duque and Vazquez2015) – which do not represent their emotional state. This would explain why depressive individuals did not show increased dwell time on angry faces, but it is not enough to explain why they fixated neutral faces for longer periods. An important piece of information on this matter is the finding that depressive individuals often interpret ambiguous (neutral) stimuli as sad ones (Armstrong and Olatunji, Reference Armstrong and Olantunji2012). Therefore, it is possible that the depressive subsample interpreted neutral stimuli as sad stimuli, and then exerted hypervigilance on these. A different explanation may be that depressive individuals were actually avoiding emotional stimuli, while engaging on neutral ones. Wu et al. (Reference Wu, Pu, Allen and Pauli2012) as well as Kircanski et al. (Reference Kircanski, Joorman and Gotlib2015) suggested that depressive individuals develop a negative schema that may increase distress and fear when the subject is confronted with emotional stimuli, thus leading to avoidance. Clarifying the extent to which depressive participants misinterpret neutral stimuli as sad ones may be key to distinguishing between these two explanations in future studies. Asking participants to rate the valence and the intensity of viewed facial expressions will be the most obvious means to achieve that. We suggest that post-experimental ratings are used, so that eye-patterns are not contaminated by the explicit analysis of emotions.
Among other directions for future research, replicating of our results would be a priority, given the small sample size involved in our analysis. Our paradigm may be improved with an interactive central fixation cross (one that triggers trial onset as participants gaze at it), since this will better grant that attention has departed from a neutral point (Clarke et al., Reference Clarke, MacLeod and Guastella2013, see Methods). Future studies should also focus on the generalization of our findings to clinical populations, on the differential impact of sad and angry stimuli on depressive participants, and on the status of social emotions as potential triggers of attention biases in social anxiety. Another interesting research avenue concerns the cross-trial temporal stability of the maintenance bias we found in our socially anxious participants, in line with concerns recently raised on the dynamic expression of attention biases across time (Amir et al., Reference Amir, Zvielli and Bernstein2016; Zvielli et al., Reference Zvielli, Bernstein and Koster2014).
In sum, our study contributed to a better understanding of the attentional bias in social anxiety. Our findings suggested that a dynamic bias of attention (a maintenance bias) may be key to explaining the attention processes subtending social anxiety, thus highlighting the importance of measures with sufficient time resolution, such as eye-tracking measures, in experimental and clinical work. Our study was the first to find evidence of a maintenance bias for positive stimuli, thus strengthening the idea that the cognitive underpinnings of social anxiety include dysfunction at the level of interpretation. Additionally, we found preliminary evidence that the presence of depressive personality traits in socially anxious samples may increase the probability of finding a static bias, namely a hypervigilance bias on neutral stimuli. In this sense, controlling for personality structure in studies of social anxiety may be a crucial methodological step in research. The importance of understanding the relation between social anxiety and attentional bias goes beyond theoretical importance. Such an understanding is fundamental for improving therapeutic approaches to anxiety disorders (Schmidt et al., Reference Schmidt, Richey, Buckner and Timpano2009), particularly those targeting attention modification (Cisler and Koster, Reference Cisler and Koster2010).
Acknowledgements
We are grateful to all volunteer participants who kindly made this research possible.
Ethical standards: All procedures performed in this study that involved human participants were in accordance with the ethical standards of the institutional and/or national research committee and with the 1964 Helsinki declaration and its later amendments or comparable ethical standards. Informed consent was obtained from all individual participants included in the study.
Conflicts of interest: No potential conflicts of interest were reported by the authors.
Financial support: This work was supported by the Fundação para a Ciência e Tecnologia, FCT Research Center Grant UID/BIM/04773/2013 CBMR 1334.





Comments
No Comments have been published for this article.