

Introduction
Fostering a higher level of collection accessibility is a common goal for archaeologists working in museums, cultural resource management (CRM) firms and universities. One effective way to facilitate this is through the production and dissemination of 3D models. With improving technology, data availability has increased significantly in scope. Today, it is routine for museums and some archaeological projects to have photographs and basic data online and freely accessible from at least portions of their collections. More recently, improved data storage and bandwidth have made it possible to share 3D models and other larger files online in a variety of contexts, mediums (see, for example, McManamon et al. Reference McManamon, Kintigh and Brin2010; Betts et al. Reference Betts, Maschner, Schou, Schlader, Holmes, Clement and Smuin2011) and publications (e.g. Douglass et al. Reference Douglass, Lin and Chodoronek2015). Unlike traditional metric and photographic data, a broad range of analyses are enabled by 3D datasets. Research(er)-specific measurements can be taken on artefacts remotely, and complex morphometric and volumetric data can be extracted (Archer et al. Reference Archer, Gunz, Van Neikerk, Henshilwood and McPherron2015; Magnani & Schroder Reference Magnani and Schroder2015).
A number of methods have been developed for the creation of 3D models of artefacts and other archaeological specimens. Options are now available for archaeologists with almost any budget. The least expensive option, photogrammetry (also referred to as ‘structure from motion’), only requires a digital camera and free or reasonably priced software (Magnani Reference Magnani2014; Porter et al. Reference Porter, Roussel and Soressi2016). To date, the majority of 3D scanning projects within archaeology, and within lithic analysis in particular, have used laser or structured-light scanners (McPherron et al. Reference McPherron, Gernat and Hublin2009; Lin et al. Reference Lin, Douglass, Holdaway and Floyd2010; Bretzke & Conard Reference Bretzke and Conard2012; Magnani Reference Magnani2014). These scanners can range significantly in price, costing from several thousand US dollars for the most commonly employed systems, to several hundred thousand dollars for the highest-precision models. Finally, at the top end of the cost spectrum, computed tomography (CT) scanners are being employed in the analysis and publication of archaeological (Abel et al. Reference Abel, Parfitt, Ashton, Lewis, Scott and Stringer2011; Soressi et al. Reference Soressi, McPherron, Lenoir, Dogandžić, Goldberg, Jacobs, Maigrot, Martisius, Miller, Rendu, Richards, Skinner, Steele, Talamo and Texier2013; Cox Reference Cox2015) or anthropological remains (Tryon et al. Reference Tryon, Crevecoeur, Faith, Ekshtain, Nivens, Patterson, Mbua and Spoor2015). Between these two extremes are a few other frequently used options, including mid-range structured-light or laser scanners (McPherron et al. Reference McPherron, Gernat and Hublin2009; Lin et al. Reference Lin, Douglass, Holdaway and Floyd2010; Bretzke & Conard Reference Bretzke and Conard2012; Magnani Reference Magnani2014).
Due to the cost and time constraints of other digitisation techniques, photogrammetry presents one promising solution to the call for rapid 3D model generation. Its widespread application is due in large part to its affordability and the automation of the software required to process the models. Using basic equipment (i.e. a digital camera and standard computer), detailed 3D models are generated from a series of overlapping photographs. Various software packages are available for this purpose—including some free options (e.g. Autodesk 123D Catch and VisualSFM)—with most being inexpensive; Agisoft PhotoScan has become particularly common in archaeological applications (educational licences for the basic package are US$59, while the professional version is US$549). These aspects of the technology have made it a viable option for the archaeological digitisation of artefacts. The resulting models can possess a highly detailed mesh comparable to more expensive techniques.
Common errors in photogrammetric model generation have yet to be resolved. These uncertainties with the technology have limited its acceptance as a tool for analysis within the archaeological community. Of particular concern is the observation that photogrammetric models tend to be more variable in qualitative appearance than those made using other methods (Magnani Reference Magnani2014). The noted variability in photogrammetric models exists for a number of reasons. Of particular importance is the variability in photogrammetry routines compared to other digitisation techniques. The protocols for other methods (e.g. laser and structured-light scanning) are largely based on the use of mass-produced, black-boxed equipment. Although settings can be changed, the modelling process is largely subsumed under a manufacturer-programmed workflow. Photogrammetry routines, as currently practised, are comparably fluid. Model building is completed using standardised software, but both the equipment and image-capture routines are driven by the user. This lack of standardisation during data collection and processing adds flexibility as users can modify the equipment and procedures to suit their individual needs. Greater degrees of manual input in the modelling process, however, can also lead to greater variation in end products. Here we explore common issues affecting the quality of photogrammetric models by troubleshooting major sources of distortion through a case study in lithic artefact modelling. Through demonstration of different workflows, we review potential solutions.
Common issues with photogrammetric models
Archaeologists using photogrammetry have encountered a number of issues. Major problems include misalignments that create gaps in models (this is particularly problematic along the edges of lithic artefacts) and issues with model fidelity including the addition of protrusions or blurring on model meshes and textures. As noted above, it would seem that much of this is a result of the greater degree of human input in both capturing source images and the modelling process as compared to other 3D digitisation techniques.
Two separate aspects of model production have the greatest potential to cause model variation: the acquisition of source images, and manual post-processing of models. Poor-qualitysource images are likely to produce highly variable, ‘noisy’ meshes and surface textures that affect model readability at best, or distort artefact surfaces at worst. Poor photographic coverage of an object, camera instability, the use of improper camera settings, shallow depth of field and inadequate lighting are other issues that are likely to influence model quality. These problems are made particularly acute where few controls are set on camera parameters and photography routines.Complications in post-processing can affect model accuracy and visual quality, and largely stem from distortions introduced as separate models are manually merged. This is especially apparent in cases where archaeologists create separate models of each side of an artefact that is photographed while placed flat on a surface (Figure 1). This results in two separate 3D surfaces that need to be manually merged. Here, inaccuracies may enter either from human error or from difficulties encountered in assimilating two separate 3D models into one coherent object. In the case of lithic artefacts in particular, gaps along thin edges and artefact perimeters frequently result. Variability is compounded by additional human factors, including the skill and experience of the user.

Figure 1. Example of the ‘flat’ approach common in current photogrammetric practice. Photogrammetric model of a flake photographed with the object lying on its dorsal, then ventral, side. Note the gaps around the edges of the model (shown in red).
Finally, there is the issue of model scaling. In laser and structured-light scanning, model scale is based on scanner calibration. If the scanner is calibrated correctly, the size of the 3D models it produces should be accurate within reported tolerances. In photogrammetry, however, scale must be set for each model using known distances between reference markers. This is often done manually during post-processing, although some software, such as Agisoft PhotoScan Professional Edition, is able to recognise certain reference patterns. While photogrammetric models have already been shown to be reliable for use with other forms of quantitative data analysis (e.g. Katz & Friess Reference Katz and Friess2014), further efforts are needed to allay concerns about potential sources of inaccuracy.
Methodology
Two separate methods, one ‘expedient’ and one ‘refined’, were employed in order to illustrate what we see as the primary sources of error in photogrammetric modelling—human inaccuracies in post-processing, merging of separate models and a lack of control in source images. Each configuration provides different solutions to these problems, and further serves to demonstrate different levels of methodological control and accuracy in model characteristics. In addition to providing more control over source images, the ‘refined’ setup standardises the degree of photographic overlap, thus reducing the possibility of missing data. The ‘expedient’ setup completely removes the stage of manual merging to the same effect, ensuring the one resulting model has adequate overlapping photographs. Both approaches were also tested with repeated comparison to measurements taken with digital callipers to assess metric accuracy.
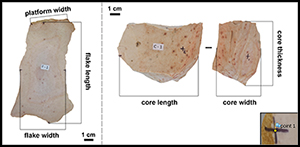
Fifteen cores and flakes made of Keokuk chert were used to make digital models with the two setups. Marks were made on the objects at known intervals to provide a baseline for measurements (Figure 2). These were later used to verify model accuracy against calliper measurements. Major attributes of interest to lithic analysis, including quantitative measurements of artefact dimension and qualitative assessments such as the identification of flake scars, cortex and other lithic landmarks, were also evaluated. All artefacts were photographed with a 12.1 megapixel Canon PowerShot SX260 HS digital camera and processed using Agisoft PhotoScan Pro. The computers used to process the different sets of models varied; both were desktop computers with 32GB of memory. Additional gear for each rig varied (see below).

Figure 2. Linear measurements taken on our experimental lithic artefacts. Inset: an example of reference marker placement in Agisoft PhotoScan.
Data collection
Expedient methodology
This approach represents a simple workaround to the issue of gaps created by the manual merging of separate sides of a model (Figure 1), and otherwise entails minimal standardisation in the acquisition of source images. Artefacts were placed on a wire stand, and images were captured around the whole object using automatic settings and no tripod (Figure 3). The need for aligning and merging sets of images is thus eliminated as all sides of an object are visible and captured within a single series of source images. Millimetre graph paper was placed in proximity to the object during modellingto later serve as a scale. Data collection for this protocol averaged approximately five minutes. Photographs were generally taken from the same distance to the object, but camera settings freely changed as the photographer moved around the object, and the number of images taken was not systematic. All images, regardless of quality, were then uploaded to PhotoScan without the use of masking, and all modelling was completed without the use of additional software. Masking allows users to specify areas on the photographs not to be included in model processing (Agisoft 2016). All stages of model building were completed using the ‘high’ settings (image alignment—construction of mesh), and finished textured models were scaled according to the millimetre graph paper scale. Photographic textures were obtained using all images and the ‘mosaic’ setting.

Figure 3. Expedient setup: objects are placed on a wire stand, and images are taken as the photographer moves around the object.
This approach mitigates the influence of post-processing on model quality (i.e. the issue of aligning and merging), but allows for considerable variability in source images. The lack of a tripod, standardisation of image location and the variability in settings can affect model quality, and thus serves to demonstrate the influence of human intervention in the image-acquisition process.
Refined methodology
Another set of models was created using photographs captured with a purpose-built photogrammetry rig (for a more thorough description of this rig and its use, see Porter et al. Reference Porter, Roussel and Soressi2016). This setup demonstrates an exacting amount of control on both post-processing and image acquisition (Figure 4). The rig included several elements that serve to streamline the photography process and enhance the quality of the photographs captured. LED lights were used to illuminate the target objects evenly. A black velvet backdrop allowed for the automatic creation of ‘image masks’ around the target objects. Using image masks can result in models with cleaner edges, and may also speed up processing time during the initial photograph alignment and the calculation of the dense point cloud.

Figure 4. Refined setup: a purpose-built rig using a turntable, controlled lighting and a camera mounted on a tripod.
For this set of models, the camera was also placed on a tripod. This allowed for photographs to be taken using manual camera settings at a low ISO (100) and with a higher f-stop (8). These settings respectively reduce image noise by decreasing sensor sensitivity to light, and increase depth of field, increasing the amount of usable information in each photograph. It is necessary to use a tripod with these settings as they require a longer speed in order to avoid underexposure (usually 1/15th to 1/13th of a second) when used in combination. Data collection for this protocol averaged approximately 11 minutes.
For each model, the target object was placed in the centre of the turntable on a scale made of laminated millimetre paper, and was securely held upright using kneadable rubber eraser (a putty-like substance). Photographs were taken of each object at systematic intervals (see Porter et al. Reference Porter, Roussel and Soressi2016). The target object was then flipped 180°, and the process was repeated in order to capture the object's other side.
Photographing flakes in an upright position results in considerably more overlap between the sets of photographs required to create a complete 3D model, avoiding the common pitfall associated with photographing objects flat on their dorsal and ventral faces. Increased overlap makes it much easier to align the two sets of images with one another, and reduces the frequency of gaps between dorsal and ventral model segments.
The sets of photographs for each side of the object were processed as separate ‘chunks’, before and after flipping the object, and were processed individually within the same PhotoScan file. Following the ‘build dense cloud’ stage of model processing, automatic point-based alignment was attempted. In some cases, this resulted in the point clouds aligning based on the scale placed under the target object rather than the target object itself. In these cases, each chunk was processed into a textured mesh. The two chunks were then aligned using reference markers manually placed on the meshes’ surfaces. The correctly aligned dense clouds were edited, cutting out obviously inaccurate data points as well as portions of the kneadable eraser used to support the object during image capture. Part of the scale on at least one side of the object was retained. Dense clouds were merged together, a mesh was built and a texture was calculated based on images from both sides of the object. The kneadable eraser was manually added to the image masks in the photographs used in this final stage in order to avoid the eraser being included in the model's texture wrap. Finally, the model was scaled to the correct size using markers placed on the area of the mesh corresponding to the millimetre scale. As with the expedient setup, all models were run using ‘high’ settings from photograph alignment to the construction of mesh, and the ‘mosaic’ setting was used for photographic textures.
Metric measurement protocol
To assess the metric accuracy of photogrammetric models, measurements of scaled models were compared to physical measurements of all artefacts. All linear measurements on our 15 experimental objects were taken three times using digital callipers. Our expedient and refined photogrammetric models were measured following scaling from the millimetre scale retained in each model using tools in Agisoft PhotoScan Professional Edition. Photogrammetric models were re-scaled between sets of measurements (e.g. after a flake length, flake width and platform width measurement were collected). Platform width was not taken on flake F-6, as it does not have a platform. Each measurement was taken in PhotoScan using reference markers placed at the intersection of marked crosshairs (Figure 2 inset). A scale bar was created between each set of reference points, but the overall model scale was not updated. The displayed ‘error’ level was taken as the distance between the two points.
Results
A selection of the models produced using our expedient and refined setups is presented in Figures 5, 6, 7 and 8—both with and without texture. Models produced for this study are also available for download online (Magnani et al. Reference Magnani, Douglass and Porter2016). Finished models from both setups did not possess any of the gaps commonly associated with manually merged models. The issue of edge gaps is of considerable importance to the metric measurement of lithic artefacts. Edges define the boundaries of standard size measurements. Where gaps exist, seams must be closed with the addition of interpolated mesh, which can affect accuracy. The resolution of this issue ensures that researchers can accurately take metric measurements, and enables the generation of watertight and faithful models useful for other forms of analysis (e.g. surface area and volume).

Figure 5. Comparison between expedient and refined models in both solid and textured mesh views for one of the experimental cores.

Figure 6. Comparison between expedient (top) and refined (bottom) models in both solid and textured mesh views for experimental flakes 1–4.

Figure 7. Comparison between expedient (top) and refined (bottom) models in both solid and textured mesh views for experimental flakes 5–8.

Figure 8. Lateral view of the photogrammetric 3D flake models produced for this study using both the expedient photography setup (above) and the refined photography setup (below).
Metric fidelity
Tables 1 and 2 compare standard measurements of experimental artefacts made on known landmarks with digital callipers (Figure 2) to those made on the same landmarks as observed on the photogrammetric models derived from both setups. Two-way ANOVAs (analysis of variance) with repeated measures were run for each of the three measurements taken on the tools’ length, width and thickness. The measurement data for this study are distributed symmetrically. The results suggest no significant difference exists between measurements by data collector (i.e. the first, second and third measurements taken for each distance) or digitisation method (i.e. calliper measurements vs digital measurements on expedient models vs digital measurements on refined models) (distance 1(flake/core length): F = 0.58 p = 0.56; distance 2 (flake/core width): F = 2.57 p = 0.09; distance 3 (platform width/core thickness): F = 2.42 p = 0.10). It is important that these results be considered in the context of the small sample sizes used in this study. Visual inspection of data distributions revealed that differences may exist in measurements of core thickness; measurements taken on digital models created by either method, however, grouped more closely together than with those taken by digital callipers. This may be a result of the difficulty of taking this measurement on physical artefacts. In evaluating the accuracy of digital measurements, it is important to remember the variability that exists with standard instruments such as callipers (Lyman & VanPool Reference Lyman and VanPool2009).
Table 1. Values of calliper and digital measurements on photogrammetric models for our experimental flakes.

Table 2. Values of calliper and digital measurements on photogrammetric models for our experimental cores.

Qualitative fidelity
Figures 5–8 present the experimental cores and flakes in both solid mesh and image-textured formats. Variance between the models created using the two approaches is a direct consequence of the degree of control in image acquisition, and demonstrates the benefits of greater methodological refinement.
Solid mesh models are displayed using ‘curvature’ view in the software package Geomagic to accentuate the visibility of the mesh surface and support comparison of the quality of the resultant models. Meshes are shown to be less faithful and more variable when created with the expedient methodology, while those made using the refined setup are more representative of the original objects. The surface ‘noise’ in the expedient models not only detracts from the ability to observe artefact detail, it also has the potential to be misinterpreted by archaeologists—a rough surface mesh could be suggestive of cortex or coarser raw material. This noise was less detectable in refined models, where artefact details are more visible.
In some cases, the inconsistent photography regimen practised during our expedient protocol resulted in holes in the point cloud data. As long as these areas are relatively small, Agisoft PhotoScan is still able to create a continuous mesh surface. Occasionally, this can make portions of an object appear smoother than in reality. That can be seen on the dorsal face of F-7, as shown in Figures 7 and 8. In contrast, the even and complete photographic coverage provided by our refined protocol prevented such errors.
Likewise, any difference in the degree of control between the two approaches can also be seen to affect the image overlays placed on models. The expedient setup, with its lack of controlled lighting, demonstrated the difficulty in creating an accurate model under variable lighting conditions, and resulted in some models having pronounced shadows. This has the potential to cause confusion when discussing raw material characteristics or the colour of an object. By contrast, the refined setup with consistent lighting created truer colours and was relatively shadowless by comparison.
Discussion and conclusion
The results presented here provide some resolution for commonly encountered photogrammetric modelling issues. Both the expedient and controlled setups demonstrated suitable solutions to the issue of gaps along lithic model edges, and are metrically accurate. Variation in the quality of the 3D mesh between the refined and expedient models, however, does show clear differences, where the refined approach produced models with much finer detail and lower levels of surface noise. Conventionally encountered issues can be mitigated by being mindful of modelling routines.
We suggest that users follow a method that is dictated by the research questions at hand. If individuals are simply interested in providing basic 3D visualisation of an artefact, or linear measurements, an approach similar to the expedient setup may suffice. An expedient setup could be especially useful if artefacts are photographed during the course of regular field study, although the refined approach is probably suitable for most field conditions assuming some pre-planning can occur. In other cases, closed models are unnecessary and the flat approach may suffice. To generate an accurate texture mapping and to increase the ability to read flake scar directionality, however, we suggest that the refined setup is more appropriate.
As models can be shared electronically, digital data repositories will facilitate greater collaboration and access, especially when physical collections are housed in remote locations. The accuracy and replicability of measurements taken on photogrammetric models, as demonstrated in this paper, coupled with a realistic photographic texture (especially in the case of the refined setup), make this clear. Acknowledging the workflow used to make models is, however, crucial to ensure that archaeologists working with digital collections produced by other researchers are aware of potential sources of model variation.
Increased levels of standardisation during data-capture and -processing routines will help to ensure that models are seamless and qualitatively accurate. Both setups explored here address these concerns to different degrees. Despite the fact that measurements taken on models made with both the expedient and refined methods are accurate when compared to calliper measurements, we suggest that, as a means of best practice, archaeologists attempt to control their light and camera setups. Following the refined protocol or its close variant would maximise the utility of 3D models for current and future researchers.
As refinements in photogrammetric practices progress, it is possible that this form of modelling will replace many of the other less-portable and more-costly alternatives to 3D digitisation. Laser scanning admittedly produces less-variable models than photogrammetry as currently practised. We suggest that this is due to the general lack of a standardised photogrammetry protocol. With minimal investment and the use of more refined routines, photogrammetry can yield models that can be measured faithfully and used for a variety of purposes, including morphometrics (e.g. Shott & Trail Reference Shott and Trail2010; Iovita & McPherron Reference Iovita and McPherron2011), cortex studies (e.g. Lin et al. Reference Lin, Douglass, Holdaway and Floyd2010; Douglass et al. in press), and determination of flake scar direction (e.g. Braun Reference Braun2006; Douglass Reference Douglass2010).
The role of photogrammetry in archaeological contexts will undoubtedly continue to expand, and has already demonstrated its value in areas as diverse as cultural heritage and the study of stone tools. Due to the affordability of equipment and software, this technology is accessible to a large and diverse audience. Little investment is needed for researchers to begin making 3D models, and users can easily adjust both the equipment and routines with minimal additional cost. The flexibility that comes with photogrammetry routines and equipment is particularly useful given the fluid nature of this technology's development (even cursory online searches can reveal updates posted on blogs and software websites demonstrating new advances). Improving computer hardware will reduce processing time and increase model quality, and improving capacity for digital storage will encourage larger-scale analyses. Although these advances are occurring regularly and will expand the utility of photogrammetry, it will always remain important for archaeologists to be aware of basic sources of photogrammetric variability. Combined, basic methodological rigour and continuing advances in photogrammetric practice will facilitate and expand the questions that we, as archaeologists, can ask about the past.
Acknowledgements
We thank Matt Edling for providing support at the University of Minnesota Evolutionary Anthropology Laboratories, and Kieran McNulty and Sam Lin for assistance with statistical analysis.


