Introduction
Several studies have used bioaugmentation strategies to improve the removal of organic contaminants from soils but this strategy has shown contradictory results and was frequently unsuccessful in soils from many different sites (Bouchez et al. Reference Bouchez, Patureau, Dabert, Wagner, Delgenes and Moletta2000a, Coppotelli et al. Reference Coppotelli, Ibarrolaza, Del Panno and Morelli2008). Our previous studies performed with Antarctic soils and using the psychrotolerant hydrocarbon-degrading bacterial consortium M10 as inoculum, showed that when the inoculum size was of the same order of magnitude as the indigenous bacterial flora, chronically hydrocarbon-contaminated soils did not respond to the presence of M10 with a significant enhancement of the hydrocarbon removal (Ruberto et al. Reference Ruberto, Dias, Lo Balbo, Vazquez, Hernandez and Mac Cormack2009). However, when results were expressed as biological degradation activity (accumulated hydrocarbon removal in each system referred to the abiotic control at the same time), it seems that M10 did not disappear from the system; it overcame, to some extent, the environmental limiting factors evidencing their degradation activity after 45 days of treatment. In another experiment, Antarctic subsoil showing a low level of PAHs contamination (1.2 ppm) was over-contaminated (1477 ppm) with phenanthrene (Ruberto et al. Reference Ruberto, Vazquez, Curtosi, Mestre, Pelletier and Mac Cormack2006). Under this condition, the bioaugmentation strategy proved to be effective for increase phenanthrene removal. In this experiment, the inoculum size was two orders of magnitude higher than that of the indigenous microflora. These previous results challenged the idea that the success of bioaugmentation, when applied on hydrocarbon-contaminated Antarctic soils, is closely dependent on the bacterial charge and the ratio between inoculated and indigenous bacteria. To test this hypothesis, we evaluated the effect that the size of a hydrocarbon-degrading bacterial inoculum has on the removal of hydrocarbons from a chronically contaminated Antarctic soil. In order to investigate the existence of synergy or interference phenomena, the effect of the presence or absence of the indigenous microflora in the target soil was also evaluated.
Methods
Soil preparation and analysis
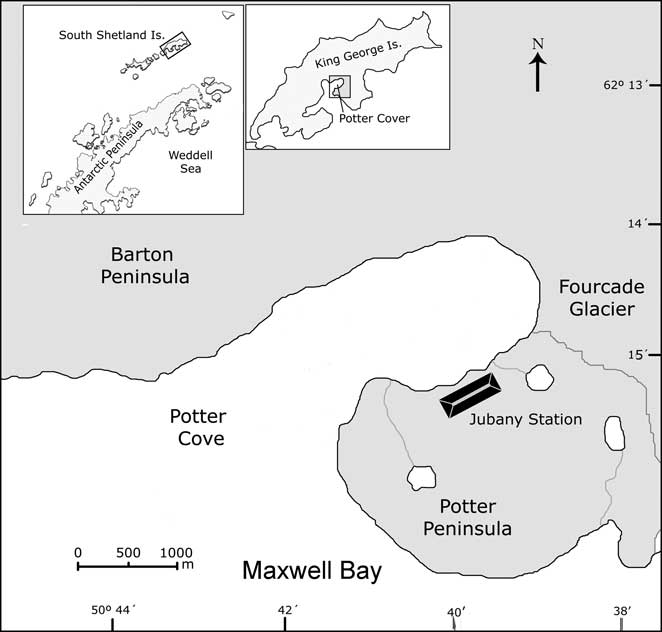
The soil used in this work was collected from the area surrounding the fuel storage tanks (Fig. 1) at Jubany Station (62°14′S, 58°40′W). This soil has been exposed to hydrocarbon contamination for some decades and therefore it contains an indigenous microflora closely adapted to this condition. During the Antarctic summer (January 2006), 10 kg of soil were removed and placed in a 50 l container. Large stones and pebbles were removed and soil was gently mixed using a metal shovel. It was then sieved (2 mm mesh) and mixed again to obtain a homogeneous material. This fraction was analysed for texture (Gee & Bauder Reference Gee and Bauder1986), pH (Seppelt Reference Seppelt1992), water content, total and soluble carbon (Richter & von Wistinghausen Reference Richter and von Wistinghausen1981), total nitrogen (Bremner & Mulvaney Reference Bremner and Mulvaney1982) and phosphorus (Bray & Kurtz Reference Bray and Kurtz1945). Water content was determined gravimetrically after desiccation at 105°C for 24 h.

Fig. 1 Geographic position of King George Island and detail of Potter Peninsula where Jubany Station is located.
Experimental design
The experiment was carried out in microcosms in 40 ml flask containing 20 g of sieved soil. In order to investigate the role of the indigenous microflora two sets of flasks were prepared. One set (lacking natural microflora) was filled with soil previously autoclaved three times at 121°C for 20 min (treatments S). The other set of flasks was filled with non-sterile soil (treatments NS). Additional sets of flasks of community controls (CC, soils without any modification) and biostimulated autochthonous microflora (BAM, soils amended with nutrient solution but no bioaugmentation) were also prepared. Details of the experimental design are summarized in Table I. Flasks were covered with non-hermetic caps to allow aeration but avoid flooding events.
Table I Details of the experimental systems used in the field study.

In order to analyse samples in triplicate without replacement at each sampling time, 21 flasks were prepared per treatment. All the flasks were placed into three metallic trays (seven flasks of each treatment per tray). The free inter-flasks space was filled with soil and the trays were partially buried in the soil. All the trays were protected from wind and wildlife damage by a wood frame and a plastic net (Fig. 2). The trays were exposed to Antarctic conditions for 60 days in summer 2006 at Jubany (17 December 2005–15 February 2006). Soil temperature was measured in triplicate every day at 15h00 and midnight using an electronic thermometer (Hanna HI8915). Synoptic data of air temperature were provided by the Jubany Station meteorological service.

Fig. 2 View of the experimental system exposed to environmental conditions at Jubany Station. Three metal trays containing 21 microcosms each were located in the field, protected by a wood frame and covered with a plastic net.
Inoculum and nutrients preparation
In bioaugmented systems the Antarctic bacterial consortium M10 was used. This consortium was obtained from chronically hydrocarbon-contaminated Antarctic soils by enrichment cultures (Ruberto et al. Reference Ruberto, Vazquez, Curtosi, Mestre, Pelletier and Mac Cormack2006). Molecular studies showed that the M10 consortium was composed of at least five different bacterial components dominated by Pseudomonadaceae (Mestre et al. Reference Mestre, Vázquez, Ruberto and Mac Cormack2007).
Inoculum was prepared by submerged culture using 250 ml Erlenmeyer flasks with 70 ml of Saline Basal Medium (SBM) and 0.7 ml of sterile gas oil (Espeche et al. Reference Espeche, Mac Cormack and Fraile1994). Each flask was inoculated with 100 μl of a M10 stock solution (cryopreserved at -80°C) and incubated for eight days in a rotatory shaker (15°C, 250 rpm) (New Brunswick). Cultures reached a cell density of c. 1 x 10⁹ CFU ml-1 and were harvested by centrifugation (5000 rpm, 40 min, 5°C). Cell pellets were pooled and resuspended in 100 ml of SBM, reaching a cell density of 1 x 10¹⁰ CFU ml-1. After that, 2 ml of this suspension was added to the flasks corresponding to NS9 and S9 treatments (42 flasks). After dilution (1/1000, cellular density of 1 x 10⁷ CFU ml-1) 2 ml of cell suspension were added to each flask corresponding to the NS6 and S6 treatment (42 flasks). The contents of all flasks were gently mixed with a sterile metallic spatula.
An inorganic nutrient stock solution (KH2PO4 44.1 g l-1; Na2HPO4 9.9 g l-1; NH4NO3 359.5 g l-1) was used as N and P source. Based on previous data, a total petroleum hydrocarbon (TPH) concentration of 10 000 ppm in soil was assumed. On this basis, the C:N:P ratio was adjusted to 100:10:1 by adding 1.3 ml of a 1/10 dilution of the saline stock solution to each flask (except for the CC system).
Bacterial counts
Soil samples (1 g) were suspended in 0.9% NaCl (10 ml) and vigorously shaken. From this suspension, serial dilutions were prepared and plated (four replicates) on casein-peptone-starch agar (CPS) for evaluation of total heterotrophic aerobic bacteria (THAB), as was suggested by Wynn-Williams (Reference Wynn-Williams1992) for Antarctic soil analysis. Hydrocarbon degrading bacteria (HDB) were enumerated by plating 0.1 ml of the serial dilutions on agarized SBM with 2% diesel fuel as the sole carbon and energy source. Both THAB and HDB plates were incubated for 30 d at 10°C and the results expressed as CFU per gram of dry weight (CFU g-1 dw).
Hydrocarbon analysis
TPH were quantified by the EPA 418.1 method. In 20 ml glass vials with a metal-covered hermetic cap, soil samples (1 g), HPLC grade CCl4 (10 ml) and a spatula tip of Na2SO4 were added. Samples were sonicated overnight (Branson 2210 ultrasonic bath), shaken (1 h), centrifuged (3500 rpm, 10 min, Damon IEC Centrifuge), transferred to a quartz cell and analysed in a Buck Model HC 404 Hydrocarbon analyser IR spectrometer. Calibration of the method was carried out using a calibration mixture composed of 15.0 ml n-hexadecane, 15.0 ml isooctane, and 10.0 ml chlorobenzene (Sigma-Aldrich) into a 50 ml glass stoppered bottle. Linearity of the method was tested and showed a correlation coefficient (r 2) of 0.9992. Recovery (from two series for three soil samples) was between 86.7 and 101.5%, with relative standard deviation exceeding 10% only at the lowest concentration level. The lower limit of detection (LOD) and quantification (LOQ) for soil samples were 0.01 and 0.03 mg g-1, respectively.
Qualitative hydrocarbon analysis was performed by gas chromatography with mass detection (GC-MS) using a Hewlett-Packard 5890 series II plus coupled to a MSD HP 5972. For this analysis a HP ULTRA II column (25 m x 0.2 ID, df (μm) = 0.33) was used with helium as carrier gas. Soil samples were extracted using hexane:acetone (1:1). Basic chromatographic conditions were as following: initial oven temperature was 60°C, initial time 3 min, ramp, 10°C min-1, final oven temperature 300°C, injector temperature 250°C, detector temperature 280°C, scan mode 2300EMV mass range 50–500 scan/sec 1.7.
Sampling and statistical analyses
Triplicates (one flask corresponding to each experimental system per tray) were processed at 0, 1, 5, 10, 15, 30, 45 and 60 d. Bacterial counts as well as TPH concentration values at each time were compared using one way ANOVA and Student-Newman-Keuls multiple comparison test (Instat software).
Results
Soil analysis
Texture analysis showed a sandy soil (sand 64.4%, silt 24.5%, clay 11.1%) with a total carbon content of 0.74%, soluble carbon 0.024%, total nitrogen 0.072% and phosphorus 10.9 ppm. TPH content was 9566.1 (± 1961.8) ppm. The pH was 6.2 and water content 7.8% ww-1. THAB counts were 2.6 x 10⁷ (± 4.8 x 10⁶) CFU g-1 dw and HDB 3.5 x 10⁶ (± 4.7 x 10⁵) CFU g-1 dw. Average soil temperature during the experiment was 9.2°C and ranged between 23.7°C and 0.9°C. Average air temperature was 2.9°C and 11.5°C and -3.5°C were the extreme values. Soil and air temperature data are shown in Fig. 3.

Fig. 3 Temperature registered daily during the microcosms experiment. a. Maximum (black circles) and minimum (grey circles) air temperature values. b. Soil temperature registered at 15h00 and midnight. Error bars indicate the SD of triplicates.
Bacterial counts
Changes in THAB and BDH counts are shown in Fig. 4. At the beginning of the experiment, significant differences in bacterial counts (THAB and HDB) were observed between systems. THAB counts (CFU g-1 dw) showed no differences (P > 0.05) among CC (2.2 x 10⁷), BAM (2.9 x 10⁷) and NS6 (2.4 x 10⁷) and HDB counts were similar among these microcosms. However, significantly higher (P < 0.001) values (compared to CC) were observed at this time in NS9 and S9, both for THAB counts (1.6 x 10⁸ and 1.9 x 10⁸ CFU g-1 dw respectively) and BDH counts (9.7 x 10⁷ and 1.0 x 10⁸ CFU g-1 dw respectively). Finally, S6 showed initial values significantly lower than CC for THAB (3.2 x 10⁵ CFU g-1 dw; P < 0.001) as well as for BDH (1.6 x 10⁵ CFU g-1 dw; P < 0.001).

Fig. 4 Bacterial counts during the microcosms experiment. a. Total heterotrophic aerobic bacteria (THAB). b. Hydrocarbon degrading bacteria (HDB). CC = community control, BAM = biostimuled autochthonous microflora, NS6 = non sterile soil inoculated with 106 CFU g-1, NS9 = non sterile soil inoculated with 109 CFU g-1, S6 = sterile soil inoculated with 106 CFU g-1, S9 = sterile soil inoculated with 109 CFU g-1.
It is important to recognize that in the bioaugmented microcosms only a fraction of the inoculated bacteria was detected immediately after initialisation. In this sense, only c. 108 CFU g-1 dw was detected in microcosms NS9 and S9 whereas S6 was below 4.0 x 10⁵ CFU g-1 dw. Similarly, THAB counts in NS6 did not show the inoculation, as the number of indigenous bacteria originally present in the soil was similar to that of the inoculum.
In NS9 and S9, THAB counts showed an increase, reaching the highest values at days 10–15. However, in the later stages of the experiment, these systems exhibited a decrease in THAB and tended to final values (close to 108 CFU g-1 dw) which converged with those observed for the rest of the experimental systems including S6, which had the lowest initial THAB counts. NS9 and S9 showed initial levels of HDB similar to those observed for THAB. However, HDB counts exhibited a different pattern compared to THAB and showed three different groups or levels through the experiment. The lower level was represented by CC (values close to 106 CFU g-1 dw) which was significantly lower (P < 0.001) compared with the other systems. A second group, composed of BAM, NS6, and S6 showed intermediate values close to 5 x 10⁷ CFU g-1 dw and were not significantly different except for S6, which was different (P < 0.001) at day 60. Although NS9 showed HDB counts similar to S9 at the first stages of the experiment, it tended to be similar to the rest of the second group from day 10. The third group was constituted by S9, with HDB counts ranging between 2 x 10⁸ and 1 x 10⁹ CFU g-1 dw. HDB counts in these system were significantly higher than those observed in BAM, S6 and NS6 (P < 0.001) as well as in NS9 (P < 0.05).
Hydrocarbon analysis
Initial and final TPH concentrations in the different systems are shown in Fig. 5. TPH concentration at day 1 was 9566.1 ± 1961.8 ppm. This initial level decreased during the experiment in all except controls, values at day 60 being significantly lower except for CC (8101.5 ± 342 ppm, P > 0.05). This value was statistically higher than those measured in S9 (5578 ± 343 ppm, P < 0.05), NS6 (4729 ± 551 ppm, P < 0.05), NS9 (4161 ± 236 ppm, P < 0.05) and BAM (4607 ± 524 ppm, P < 0.05) but it was not different from S6 (6340 ± 913 ppm, P > 0.05). However, values from NS6, NS9, S6 and S9 at day 60 were not different from those in BAM. Despite the lack of statistical differences TPH value in NS9 was 446 ppm lower than the BAM value, possibly suggesting a slower rate of loss which could have been greater if a longer treatment period had been studied.

Fig. 5 Total petroleum hydrocarbon concentrations (TPH) at day 0 and 60 measured in the different microcosm systems. Different letters indicate significant differences. T0 = concentration at day 0, CC = community control, BAM = biostimuled autochthonous microflora, NS6 = non sterile soil inoculated with 106 CFU g-1, NS9 = non sterile soil inoculated with 109 CFU g-1, S6 = sterile soil inoculated with 106 CFU g-1, S9 = sterile soil inoculated with 109 CFU g-1.
Qualitative analysis of the contaminated soil used in this experiment showed that the bulk of hydrocarbons were aliphatics from C11 to C30 and represented a typical diesel fuel pattern. Hydrocarbons with more than C30 as well as heavy PAHs were not detected by the method used.
Discussion
Soil bioremediation is a complex, and poorly understood process. Efficiency of the contaminant removal is affected by a large number of factors (Mohn & Stewart Reference Mohn and Stewart2000, Bamforth & Singleton Reference Bamforth and Singleton2005). Among the available strategies to clean up a contaminated soil, bioaugmentation appears as one of the most, if not the most, difficult to be successfully applied (Gomes et al. Reference Gomes, Kosheleva, Abraham and Smalla2005, Hosokawa et al. Reference Hosokawa, Nagai, Morikawa and Okuyama2009) and has generated controversial results.
As was previously reported for Antarctic soils (Ruberto et al. Reference Ruberto, Dias, Lo Balbo, Vazquez, Hernandez and Mac Cormack2009), inoculation with hydrocarbon degrading bacteria at a similar level to those present in a chronically contaminated soil seems to be ineffective when compared with the efficiency of the biostimulated indigenous microflora. This lack of efficiency was also reported by other authors working with different contaminated systems (Margesin & Schinner Reference Margesin and Schinner1997, Bouchez et al. Reference Bouchez, Patureau, Dabert, Juretschko, Dore, Delgenes, Moletta and Wagner2000b, El Fantroussi & Agathos Reference El Fantroussi and Agathos2005). It was proposed that the amount of inoculated microorganisms could be the factor responsible for the lack of success, and since the inoculum was competing with the indigenous microbes, it would not be able to establish properly, therefore proving ineffective for a significant removal of hydrocarbons.
In the present study the influence of the inoculum size was studied using M10, an Antarctic bacterial consortium that proved able to grow with hydrocarbons at low temperature (Ruberto et al. Reference Ruberto, Vazquez, Curtosi, Mestre, Pelletier and Mac Cormack2006). However, THAB and HDB counts showed that only a fraction (near 108 CFU g-1) of the 109 CFU g-1 initially added could be detected immediately after inoculation. This fact could be, in part, be explained by the impossibility of recovering all the inoculated microorganisms due to their strong association to the soil particles. However, if only a physical process involving attachment is responsible for the decrease in counts, bacteria attached to the soil particles should maintain their physiological characteristics and even reduce cell leaching, improving inoculum persistence. However, this was not reflected by the observed hydrocarbon degradation activity which was not statistically different in the microcosm receiving 109 CFU g-1 compared to both, one receiving 106 CFU g-1 or one that received no inoculum at all. It is also possible that the decrease had been caused by the stress induced when M10 cells were moved from a liquid culture medium to a physically and biologically complex matrix like soil. This kind of stress has been clearly shown by Van Dyke & Prosser (Reference Van Dyke and Prosser2000) who observed that less than 103 CFU g-1 of the 107 CFU g-1 of a Pseudomonas fluorescens strain introduced into soil survived after 28 d. In the same report authors observed that the use of sterile soil as a carrier improved the survival of the inoculum and that the longer P. fluorescens was incubated in the sterile matrix, the better it survived when added to the target, nonsterile soil. Authors argued that growth of P. fluorescens in the sterile soil may have favoured the strain adaptation prior to confronting the competition with indigenous microorganisms when added to the non-sterile soil. These results clearly suggest that the soil matrix per se (even when lacking other microorganisms) represents a source of stress for bacteria from laboratory cultures. On the other hand, Watanabe et al. (Reference Watanabe, Miyashita and Harayama2000) showed that cells of the phenol-degrading strain Ralstonia eutropha E2 exposed to a short starvation period before addition to an activated sludge survived better than those treated differently. Although other authors reported no effects of pre-starvation on the survival of inoculum (Van Overbeek et al. Reference Van Overbeek, Eberi, Givskov, Molin and van Elsas1995), this aspect and the previous comments on soil matrix induced stress should be investigated in the future to see if they could be responsible in part for the non-establishment of the M10 consortium.
In relation to the indigenous microorganisms, this work showed that the decrease in bacterial counts immediately after inoculation is not closely related to predation by bacteriophages and protozoa or to direct competition with other autochthonous bacteria. This conclusion is based on the fact that the same decrease in counts was observed in flasks with sterilized soil, where biological stress was absent. For this reason, falls in bacterial counts immediately after inoculation seems to be related to the stress produced by physical/chemical factors. It does not mean that biological factors do not represent a stress for an inoculum introduced into a soil. It means that, even though biological stress is absent, a bacterial inoculum added to a soil will suffer a sharp decrease in numbers produced due to abiotic factors. Decrease in bacterial counts was not evident in samples from NS6 because inoculum size was of the same order of magnitude as the indigenous microflora. Behind the above mentioned decrease in the inoculum counts, significant differences observed in the initial bacterial count values clearly showed the presence of the inoculum, its size and the effect of sterilization.
The significantly higher values of HDB observed in S9 during the entire experiment compared with the other microcosms, including NS9, showed that when inoculum sizes with two or three orders of magnitude greater than the bacterial numbers present in the soil are applied in the absence of predation or competence, inoculated HDB could maintain a high level over the entire experimental period. However, this high level of inoculated HDB did not result in a higher hydrocarbon removal when compared with the BAM system. Margesin & Schinner (Reference Margesin and Schinner1997) came to a similar conclusion working with an isolated strain (Yarrowia lipolytica) in alpine soils under controlled temperature (10°C). Coppotelli et al. (Reference Coppotelli, Ibarrolaza, Del Panno and Morelli2008) found that, in spite of the long-term establishment of Sphingomonas paucimobilis 20006FA in phenanthrene-contaminated soil, at the end of the experiment the bioaugmentation did not produce significant changes in the residual phenanthrene concentration. This lack of degradation activity by the inoculated consortium, even with a high HDB number, suggests a very low level of adaptation to the environmental conditions. Although M10 was isolated at low temperature and used hydrocarbons as the sole carbon and energy source (Ruberto et al. Reference Ruberto, Vazquez, Curtosi, Mestre, Pelletier and Mac Cormack2006), the inoculum was prepared in cultures at a constant temperature (15°C). Whereas the indigenous microflora is composed of a variety of microorganisms, adapted to survive under fluctuating temperatures. It is possible that the Antarctic soil environments, where such fluctuations in surface soil temperature are broad and frequent, require and select microorganisms able to efficiently degrade hydrocarbons at each naturally occurring thermal range. As was shown in Fig. 3, soil temperatures fluctuated strongly during the experiment, showing an amplitude of almost 21°C. These broad daily changes in temperature (which are normal during the summer in the Antarctic Peninsula region) represent a wide range of thermal niches and could be a challenge for an isothermically isolated and cultivated bacterial consortia. Although consortium M10 presents a certain bacterial diversity (Mestre et al. Reference Mestre, Vázquez, Ruberto and Mac Cormack2007), such a diversity is evidently lower than those present in the soil. For this reason, the chance of having species able to produce an efficient hydrocarbon removal at each temperature value is lower.
In conclusion, results from this work suggested that environmental conditions used when inoculation strategies are being applied should be carefully considered in order to minimize the stress suffered by inoculated bacteria, because such stress could result in a low hydrocarbon removal efficiency. If the environmental conditions causing the low biological activity cannot be identified and reduced, it should be considered that bioaugmentation of a chronically hydrocarbon-contaminated Antarctic soil represents a waste of effort and resources, and that biostimulation of the soil is as effective for hydrocarbon removal as a system in which inoculation is as high as 109 CFU g-1 dw.
Acknowledgements
We thank Jubany station crew for the logistical support during fieldwork. This project was carried out under an agreement between the Instituto Antártico Argentino and the Facultad de Farmacia y Bioquímica of the Universidad de Buenos Aires (UBA). Field and laboratory works were supported by the CBC, UBA (UBACyT U001) and the Agencia Nacional de Investigaciones Científicas y Técnicas (Picto 2005 no. 35778). We thank the reviewers whose comments improved this paper.