Introduction
The McMurdo Dry Valleys (MDV) comprise the largest ice-free region of Antarctica (4800 km2), are aptly characterized as a cold desert, and have been considered as an astrobiology analogue for Mars. They are located in southern Victoria Land between the Ross Sea/McMurdo Sound and the Polar Plateau/East Antarctic Ice Sheet (Fig. 1) and consist of a series of generally east–west trending, glacially formed valleys that have been previously categorized into three soil moisture zones, determined largely by elevation and climate influences: subxerous, xerous and ultraxerous (Campbell & Claridge Reference Campbell and Claridge1982).
The subxerous zone is the warmest and wettest, and occurs primarily near the coast. Ice-cemented soil is found within 1 m of the surface, and the soil thaws down to the ice table each summer. The ultraxerous zone occurs at high elevation (generally > 1000 m) near the polar plateau. Ground temperatures exceed 0°C only very near the surface, although loose ice-free soil that is < 0°C, termed “dry permafrost”, extends to greater depths (e.g. McKay et al. Reference McKay, Mellon and Friedmann1998). Commonly, dry permafrost transitions abruptly to ice-cemented ground at depths down to about 1 m. Dry permafrost may be unique to the MDV on Earth, but it is ubiquitous on Mars due to much lower Martian temperatures. The Phoenix (PHX) spacecraft investigated dry permafrost in Mars’ polar regions in 2008 (Smith et al. Reference Smith, Tamppari, Arvidson, Bass, Blaney, Boynton, Carswell, Catling, Clark, Duck, Dejong, Fisher, Goetz, Gunnlaugsson, Hecht, Hipkin, Hoffman, Hviid, Keller, Kounaves, Lange, Lemmon, Madsen, Malin, Markiewicz, Marshall, McKay, Mellon, Michelangeli, Ming, Morris, Renno, Pike, Staufer, Stoker, Taylor, Whiteway, Young and Zent2008), increasing the importance of understanding the unique MDV environment as a Mars analogue.
Moving from subxerous low coastal valleys to ultraxerous high inland valleys, the soils in the MDV represent a long-term natural experiment revealing the geochemical effects and biological consequences of progressively less abundant liquid water. Our primary goal was to understand how soil chemistry, mineralogy, structure, and habitability change with the influence of water between these two end member locations, and to use that information for comparison to an even colder, drier location - the Martian northern plains. In particular, we focused on four factors: 1) soluble salts, 2) minerals, 3) clay-sized particle distribution, and 4) biomass, each sensitive in distinct ways to traces of mobile water.
To address our objectives, we conducted a systematic, interdisciplinary investigation of soil pits dug in Lower Taylor Valley (subxerous; TV) and in University Valley (ultraxerous; UV; Fig. 1). We chose to conduct and present our full analyses, including biomass estimates, on two end member pits, although six total pits in TV and UV were excavated and analysed. While UV and TV do exhibit heterogeneity, our purpose was to examine the influence of varying water amount in each location and its effect on the quantity and type of soluble salts, mineralogy, clay-sized particle distribution, and biomass, for which we believe end member pits are sufficient and generally representative of the climate zone of interest, based on literature and comparison to our other pits in these valleys. In all our pits, we identified and sampled each soil horizon down to, and including, the ice-cemented layer, which constituted the bottom of our pits. Analyses included both in situ (i.e. in the field) and standard laboratory techniques. Here we describe the detailed analyses of these two end member soil profiles, identify the chemical, compositional, and physical properties that are most sensitive to trace water, and use relative abundance of microbial biomass to identify soil horizons that are more hospitable to life than others within the same pit. We then compare these results to similar analyses of the Martian dry permafrost.
Site characteristics
Taylor Valley (TV) is a low-elevation, coastal valley, 60 km long in total length (Fig. 2), receiving 1–75 mm water equivalent (weq) snow accumulation (precipitation plus windblown snow deposition) annually (Fountain et al. Reference Fountain, Nylen, Monaghan, Basagic and Bromwich2010, Table I). The summer air temperature is frequently > 0°C, and liquid water is present annually, as soil pore water and surface streams.
Table I Summary of characteristics of Taylor and University valleys.
aMarchant & Head (2007); Ts = surface temperature.
bMarinova et al. (2011); Ts = surface temperature.
cFountain et al. (2010), Table I; weq = water equivalent.
dDoran et al. (2002); Ta = air temperature.
The active layer in TV, (soil zone in which temperature annually exceeds 0°C), extends to 25–50 cm depth (Marchant & Head Reference Marchant and Head2007), and in most locations, liquid water is stable throughout the soil column for part of each year. Water infiltration from snowmelt, which is concentrated in the lees and small-scale topographic lows that trap blowing snow, is spatially heterogeneous, as are the resultant chemical and physical properties of the soil. Liquid water can drain the entire soil column, and flows laterally across the surface of the ice table during summer (Wilson Reference Wilson1979). This flushing is the primary means by which mass is removed from the TV soil column.
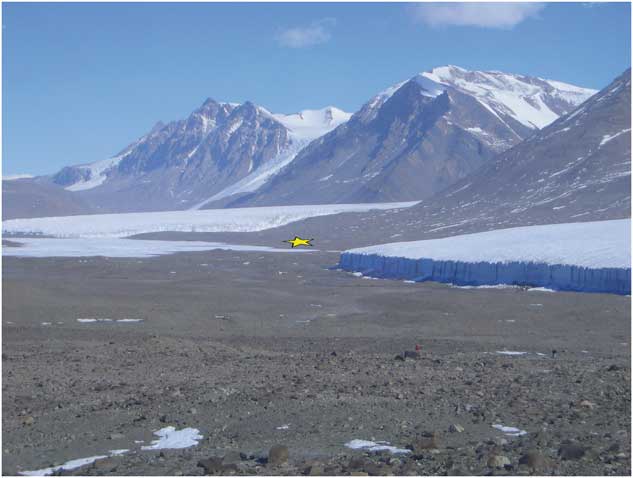
University Valley (∼ 1700 m elevation; Fig. 3) is a small lateral hanging valley (∼ 1 x 3 km) that feeds into Beacon Valley (BV), located about 75 km from the coast. There is a permanent snowfield near the valley headwall that is probably maintained by accumulation of snow blown off the polar plateau (McKay Reference McKay2009). University Valley is colder and dryer than TV with average annual air and soil temperatures of ∼ -25°C and average summer surface temperatures of only ∼ -5°C (Marinova et al. Reference Marinova, McKay, Heldmann, Davila, Andersen, Jackson, Lacele, Paulson, Pollard and Zacny2011).
There is a substantial uncertainty in the average annual snow accumulation at our UV soil pit. Annual snow accumulation has not been measured in either UV or nearby BV, but McKay (Reference McKay2009) argued that snow accumulates at the site of our soil pit, 500 m down-valley from the permanent snowfield, only once every 2–3 years. The snow accumulation gradient moving inland from the coast (Fountain et al. Reference Fountain, Nylen, Monaghan, Basagic and Bromwich2010) implies between 0 (unmeasurable) and ∼53 mm weq yr-1 accumulation, but this gradient has not been verified outside TV. Forecast modelling of annual precipitation by Powers et al. (Reference Powers, Monaghan, Cayette, Bromwich, Kuo and Manning2003) predicts that UV gets more snow than TV, perhaps up to 100 mm weq yr-1.
The key climatic difference between subxerous (lower TV) and ultraxerous (UV) regimes is the maximum air temperature. Measurements in BV (500 m lower in elevation that UV) suggest that the air temperature in UV never reaches 0°C (Doran et al. Reference Doran, Priscu, Lyons, Walsh, Fountain, McKnight, Moorhead, Virginia, Wall, Clow, Fritsen, McKay and Parsons2002), precluding large-scale melting. A significant but unknown fraction of the snow sublimates (Fountain et al. Reference Fountain, Nylen, Monaghan, Basagic and Bromwich2010). Ground temperatures in UV do however, reach 0°C (e.g. Marinova et al. Reference Marinova, McKay, Heldmann, Davila, Andersen, Jackson, Lacele, Paulson, Pollard and Zacny2011), and whatever trace snow remains in contact with bare ground can melt and seep into the subsurface. In fact, this process provides enough liquid water to sustain the cryptoendolithic communities in the Beacon sandstone walls of UV (Friedmann Reference Friedmann1982).
Meltwater production in UV is spatially restricted, by the same small-scale topographic trapping that operates in TV, and probably occurs no more than a few afternoons each year. In UV, the active layer is ≤ 10 cm deep (McKay et al. Reference McKay, Mellon and Friedmann1998). Typically, the active layer in ultraxerous valleys does not reach ground ice, the soil column is not flushed, and even the most soluble salts accumulate.
Permanently “dry” soil is expected in ultraxerous valleys, in that part of the soil column between the active layer and the ice table. At the nanometer to micron scale however, all grain surfaces are covered with thin films of adsorbed water molecules. These films form at solid surfaces due to the attraction between the polar water molecule and the grain surfaces (van der Waals forces), and are ubiquitous on any surface exposed to water vapour. Adsorbate films exhibit an equilibrium thickness that depends on temperature and the relative humidity of the pore gas (Anderson & Tice Reference Anderson and Tice1972). An entirely distinct process, known as premelting, likewise results in a mobile, unfrozen layer of water molecules covering the surface of all ice grains, particularly near their melting point (Rempel et al. Reference Rempel, Wettlaufer and Worster2004). Adsorbed and premelted water films are universal under appropriate conditions, and the environments of both TV and UV are such that unfrozen films are probably ubiquitous. The capacity of these films to facilitate geologic and biologic processes, as compared to the periodic bulk liquid water that occurs in the subxerous valleys, is a key focus of this study.
Although the ultraxerous MDV are among the coldest and most arid sites on Earth, they are considerably more clement than the PHX site on Mars (68°N). The soil surface at the PHX site reached only ∼-23°C near summer solstice, and the maximum temperature of the ground ice (∼5 cm depth) probably does not exceed -53°C (Mellon et al. Reference Mellon, Arvidson, Sizemore, Searls, Blaney, Cull, Hecht, Heet, Keller, Lemmon, Markiewicz, Ming, Morris, Pike and Zent2009, Zent et al. Reference Zent, Hecht, Cobos, Campbell, Campbell, Cardell, Foote, Wood and Mehta2009). Models have suggested the possibility that at high obliquity, surface temperatures at the PHX latitude may be similar to present-day UV. There is considerable uncertainty in these models, although regolith temperatures in the -13 to +7°C range are commonly predicted (e.g. Zent Reference Zent2008). Because there is water in the Martian system (polar caps, subsurface, and atmospheric water vapour), unfrozen water should be present as well, and, could be as abundant as that in present day UV when temperatures warm with obliquity changes.
Methods
Site and excavation description
The field sites described in this paper are shown on Figs 1–4 (yellow stars). Several pits were dug in each valley during summer 2007–08. We will discuss in detail the results of pit 2 in lower TV, near Lake Fryxell (Figs 2 & 5a, Table II), and pit 7 in UV (Figs 3 & 5b, Table II). Both pits were in polygon centres, experience lower stress and less cryoturbation than locations near the polygon edges (Sletten et al. Reference Sletten, Hallet and Fletcher2003), and are representative of the climate zone in which they were dug.

Fig. 1 McMurdo Dry Valleys. Stars indicate sites of the field locations described in this paper: Taylor Valley pit 2 at 77°36′06.1′′S, 163°08′19.6′′E; elevation 21 ± 5.5 m and University Valley pit 7 at 77°51′43.6′′S, 160°42′23.8′′E; elevation: 1683 ± 5.9 m.

Fig. 2 Taylor Valley, with the Commonwealth Glacier in the foreground, and Lake Fryxell on the left. The approximate position of the soil pit is indicated by the yellow star.

Fig. 3 University Valley, looking toward the headwall and the permanent snowfield. The approximate position of the soil pit is indicated by the yellow star.

Fig. 4 Locations of the soil pits (yellow stars) in Taylor Valley. Pit 2 at 77°36′06.1′′S, 163°08′19.6′′E, elevation 21 ± 5.5 m (top) and University Valley pit 7 at 77°51′43.6′′S, 160°42′23.8′′E, elevation: 1683 ± 5.9 m (bottom). The location of the Beacon Valley (BV) meteorology station is marked with a green circle (bottom; 77°51′43.6′′S, 160°42′23.8′′E).
Table II Location, geomorphic surface, parent material and age of surface for Taylor and University valleys.
aApproximate age range based upon proximity to dated sites by Hall & Denton Reference Hall and Denton(2000); Ross Sea Drift material.
bMaterials have not been dated; inflationary surface from infilling by colluvial processes from valley walls.
In each pit, excavation was performed down to and including the ice-cemented layer, of which an area about 0.5 m2 was exposed. Soils were characterized using standard methods (Soil Survey Laboratory Methods Manual, USDA 2004; http://soils.usda.gov/technical/lmm/, accessed 2009). Soil master horizons were designated as D, B, or C. The D horizon designation was used to represent a desert pavement (Bockheim Reference Bockheim1997). Lowercase letters were used as suffixes to designate specific kinds of master horizons and layers. For example, the ƒƒ suffix was used to represent dry permafrost. Definitions of master horizons and suffixes are found in Keys to Soil Taxonomy (Chapter 18, http://soils.usda.gov/technical/classification/tax_keys/index.html, accessed 2009).
At each location, soil horizons were sampled using sterile tools, and stored in sterile sample containers. The sterilization protocols were those used by the Johnson Space Center curation facilities (Astromaterials Research Office 2006) and total organic carbon was monitored during the cleaning process to ensure that organic materials were removed. Samples intended for biological analyses were placed in Whirl-Pak® sterile bags. The layers were sampled from the bottom up in order to avoid cross-contamination from falling material. Approximately 2 kg of material was excavated from each horizon and shipped frozen back to the United States. The ice-cemented ground was also sampled using a sterile hammer and chisel (2–5 cm of ice-cemented material was removed). The soil just above the ice table in TV was damp at the time of excavation, either due to melting of the ice table, or lateral migration of liquid water along the ice table, or both (Wilson Reference Wilson1979). All samples were stored, shipped, and maintained in a frozen state. A total of five horizons were identified and sampled in UV pit 7 and a total of 8 horizons in TV pit 2.
Some measurements were conducted in the field, primarily using Phoenix flight spare instruments, but the majority of our analyses were performed at our home institutions or at commercial labs.
In situ measurements
Soil thermal properties were taken from in situ (i.e. in the field) measurements made with the PHX Thermal and Electrical Conductivity Probe (TECP; Zent et al. Reference Zent, Hecht, Cobos, Campbell, Campbell, Cardell, Foote, Wood and Mehta2009, Reference Zent, Hecht, Cobos, Wood, Hudson, Milkovich, Deflores and Mellon2010). Wet chemistry analyses for soluble ions, except ClO4-, were also performed in the field using the PHX Wet Chemistry Laboratory (WCL; Kounaves et al. Reference Kounaves, Hecht, West, Morookian, Young, Quinn, Grunthaner, Wen, Weilert, Cable, Fisher, Gospodinova, Kapit, Stroble, Hsu, Clark, Ming and Smith2009). Use of flight spare instruments allowed us to both test the instruments in a Mars analogue environment, and simultaneously deliver on-site analyses.
Soil thermal properties, volumetric heat capacity (ρC) and thermal conductivity (K), were determined via the transient heated needle technique (de Vries Reference De Vries1952). Soil temperatures and thermophysical properties are first order controls on the propagation of energy through the soil, and as such play a key role in determining the active layer, as well as the thickness of unfrozen water films. These data were used to constrain thermal models of the soil pits in support of our sample analyses. Due to power-supply issues, extended TECP measurements were made only in BV. The ρC and K measured in BV allowed the model to reproduce independent measurements of subsurface temperature in UV (Marinova et al. Reference Marinova, McKay, Heldmann, Davila, Andersen, Jackson, Lacele, Paulson, Pollard and Zacny2011), so this proxy was acceptable. TECP measurements were collected over a 21-hour period on 2 and 3 January 2008. Raw data for each channel were converted to physical units via the functions established for the TECP unit during flight calibration (Zent et al. Reference Zent, Hecht, Cobos, Campbell, Campbell, Cardell, Foote, Wood and Mehta2009).
A series of WCL analyses for Na+, K+, Mg2+, Ca2+, Cl-, pH, and electrical conductivity (EC) were performed on samples from pits in lower TV to guide the sampling approach. Soluble ion chemistry and abundance were found to be different in each soil horizon, supporting the need to analyze each horizon. Subsequent comparison of the WCL in situ data to laboratory Ion Chromatographic (IC) analyses of the same samples (see below) found comparable results.
Mineralogy
Soil samples were fractioned into five sand-sized (2–1, 1–0.5, 0.5–0.25, 0.25–0.09, 0.09–0.053 mm), three silt-sized (53–20, 20–5, 5–2 μm) and two clay-sized (2–0.2, < 0.2 μm) fractions following the method of Jackson (Reference Jackson1985) with the exception that a high-pH dispersion agent was omitted to minimize dissolution of amorphous aluminosilicates. Mineralogy of all soil fractions was determined by X-ray diffraction (XRD) analysis on a Scintag XDS2000 X-ray Diffractometer using CuKα radiation from 2–70°2θ. Sand and silt samples were prepared as random-oriented mounts. Bulk soils (< 2 mm size fraction) and sand-sized fractions were ground by hand to < 53 μm prior to XRD analysis. The clay-sized fractions were saturated with Mg2+ and K+ and pipetted onto glass slides for preferred-orientation mounts. Mg-saturated clay-sized fractions were X-rayed at ambient temperature followed by glyceration, which causes 2:1 expandable phyllosilicates to expand to a characteristic d-spacing. K-saturated clay-sized fractions were X-rayed at ambient temperature, followed by heating to 110°C, 300°C, and 550°C (Jackson Reference Jackson1985). This procedure was performed on each soil horizon for both pits. Sub-samples of the < 125 μm fraction of untreated bulk soils were ground by hand to < 53 μm and analysed by XRD to determine mineralogy, including salts.
Quantitative estimates of the total crystalline and amorphous phases were determined by the Rietveld method (Rietveld Reference Rietveld1969) using a Panalytical X'Pert Pro MPD Diffractometer using Cu Kα radiation operated at 45 kV and 40 mA current. Representative portions of each bulk soil (< 2 mm size fraction) were ground by hand with an agate mortar and pestle in ethanol to a fine powder (< 53 μm) and a 10% by weight spike of alumina (Al2O3) was added as an internal calibration standard.
Particle sizes and specific surface area
Soils from each layer were also analysed to determine their particle-size distribution and specific surface area. The particle-size analysis was conducted using a Beckman Coulter LS 13 320 Laser Diffraction Particle Size Analyzer that measures particles from 0.4 μm to 2 mm over 116 size bins. For particle size analysis, the samples were prepared by soaking them for 24 hours in DI water on a rotating mixer and then adding sodium hexametaphosphate as a dispersing agent and mixing overnight (XRD analysis on size separates were done on samples that were segregated without using a dispersant to preserve any amorphous material present). Each sample was run four times and averaged. Specific surface area measurements were carried out on unmodified soil samples using the standard BET method, measuring nitrogen adsorption to determine the surface area of the sample in m2 g-1.
Ion chemistry
Soluble ions, except ClO-4, were determined by measurements made on aqueous extracts of soil samples, which were leached at room temperature for 1 hr at a 1:1 weight ratio of soil to water and were extracted through a 0.2 μm filter.
Analysis of the soluble anion species was performed using a Dionex ICS-2000 Reagent Free™ IC equipped with a Dionex Ionpac AS18 analytical column (250 x 4 mm inside diameter, I.D.), an AG18 guard column (50 x 4 mm I.D.), and an Anion Self-Generating Suppressor 300 (4 mm) with a suppression current of 105 mA. The eluent was 20 mM potassium hydroxide with a flow-rate of 1.0 ml min-1. Calibration curves using three standards were generated for the anionic species: F-, Cl-, Br-, NO-3, NO-2, SO24-, and PO34-. Initially, all solutions were run undiluted, however, due to the presence of high concentrations of certain anions, it was necessary in most cases to re-analyse the solutions following a 100-fold dilution with 18 MΩ cm-1 water. The ClO-4 was determined by IC as described in Kounaves et al. (Reference Kounaves, Stroble, Anderson, Moore, Catling, Douglas, Mckay, Ming, Smith, Tamppari and Zent2010a).
Cation species were analysed using a Perkin Elmer Analyst 800 Atomic Absorbance Spectrometer outfitted with cation specific Hollow Cathode lamps. Calibration curves using five standards were generated for: Na+, K+, Mg2+, and Ca2+. Initially, all solutions were diluted 1:2 with a 0.2% HNO3 solution. All standards and necessary further dilutions were made with 0.1% HNO3.
Scanning Electron Microscopy (SEM) and Transmission Electron Microscopy (TEM)
Silt-sized fractions of the soil samples were mounted on sticky tape attached to a stub and then carbon-coated for morphological analysis using a JSM 5910LV scanning electron microscope equipped with an IXRF energy dispersive X-ray spectroscopy (EDS) system. Clay-sized materials from selected soil horizons were dispersed in water and pipetted onto a carbon film on a copper grid. They were examined without coating under a JEOL 2000FX scanning transmission electron microscope operated at 200 kV at 10nA beam current.
Biology
Phospolipid Fatty Acids (PLFA) were extracted and purified at Microbial Insights, Inc. Soils were lyophilized, and lipids extracted in methanol:chloroform. The extract was filtered and the polar lipid fraction was recovered, purified by thin layer chromatography and analysed by gas chromatography (GC) with the inclusion of internal quantitation standards (White et al. Reference White, Davis, Nickels, King and Bobbie1979). Following White et al. (Reference White, Davis, Nickels, King and Bobbie1979), the PLFA in the samples were separated by GC into particular metabolic groups, and the resulting PLFA “profile” reflects the proportions (as percentage) of the groups of organisms present in the sample.
An estimate of biomass was made from PLFA data by applying a conversion factor (2 x 10⁴ cells/pmole) based on cells grown in laboratory media (White et al. Reference White, Davis, Nickels, King and Bobbie1979), where it was shown to be independent of microbial group; we assume that the microbes from the MDV behave similarly. For this reason, and because we do not know the specific extraction efficiency for our Antarctic soils (especially dry permafrost and clay mineral rich soils) the PFLA biomass determinations are considered estimates only.
As a comparison point, DNA-based biomass estimates were made using quantitative PCR. Extraction of DNA from soil and quantitation assays was also performed at Microbial Insights, Inc. A calibration curve was obtained by using serial dilutions of DNA of known concentration and the values obtained for each sample were compared with the standard curve to determine the initial DNA concentration. Cell numbers were estimated assuming an average molecular weight of 660 for a base pair in double-stranded DNA, and an average of 3.5 16S rRNA gene operons per bacterial cell (Balkwill et al. Reference Balkwill, Leach, Wilson, McNabb and White1988), although we do not know how well these assumptions apply to the organisms present at our field sites.
Support modelling
In order to assess the subsurface environment at UV, a soil thermal model was developed, using the TECP-measured thermal conductivity (K) (∼0.4 W m-1 K-1) and volumetric heat capacity (ρC) (∼1.7 x 10⁶ J m-3 K-1). The simple model assumes a planar, semi-infinite half space, and solves the surface energy balance and thermal conduction equations:
A simple shadow mask accounts for shadowing by the walls of UV. The albedo and emissivity are taken from Campbell et al. (Reference Campbell, MacCulloch and Campbell1997), and were tuned slightly to reproduce the soil temperatures reported by Marinova et al. (Reference Marinova, McKay, Heldmann, Davila, Andersen, Jackson, Lacele, Paulson, Pollard and Zacny2011, α = 0.26, ε = 1.0). The lower boundary condition is fixed at -14°C, based on measured ice temperatures. The model does not attempt to couple heat and mass transfer that would occur during drainage of snowmelt, because critical parameters such as the hydraulic conductivity, soil matric potential and infiltration rate are not known for the undisturbed soil column.
Results
Lower Taylor Valley
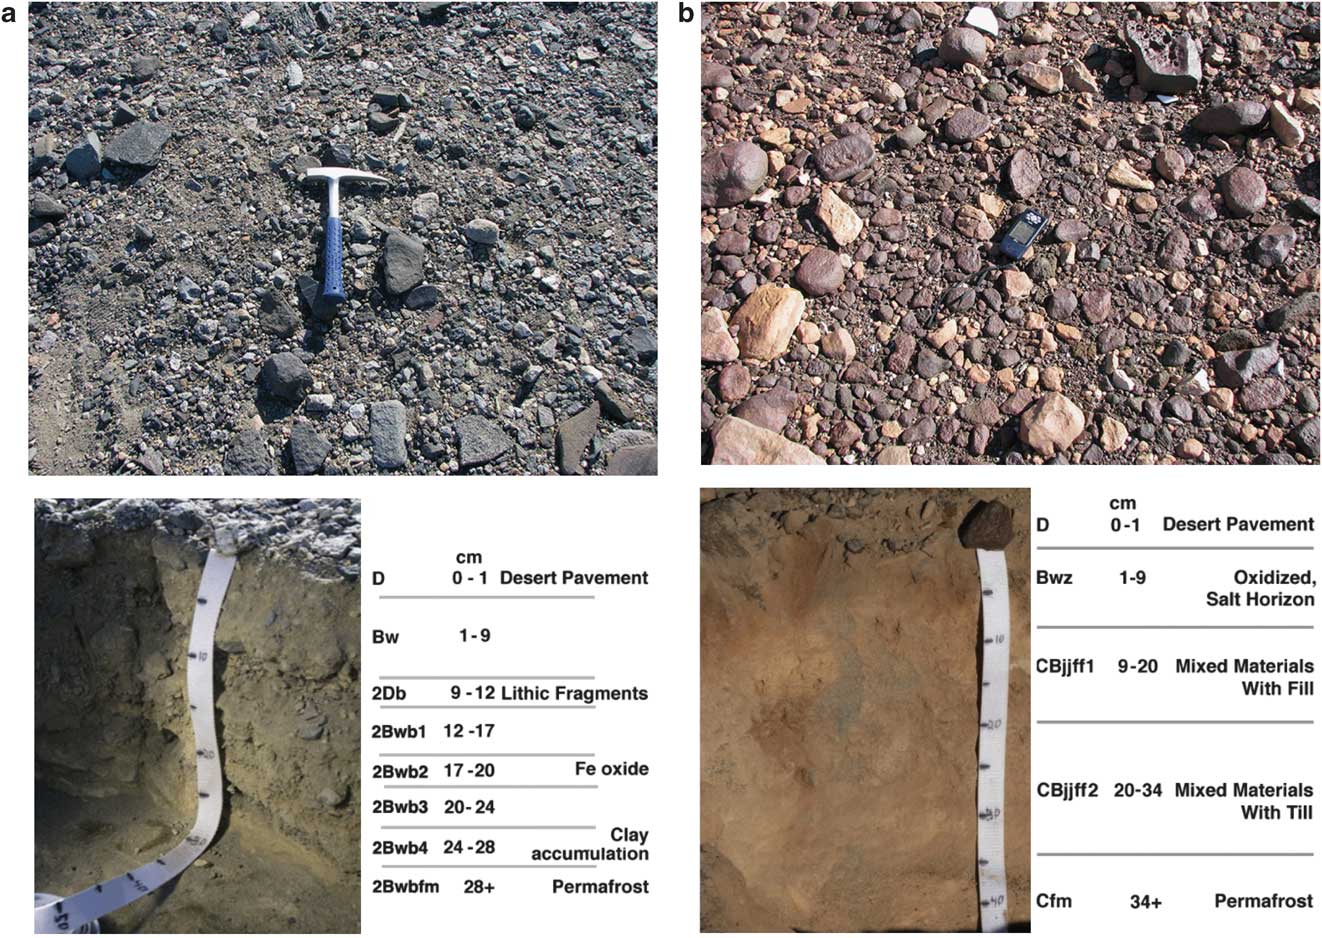
At our sampling site in lower TV (pit 2), with a depth to ground ice of 28 cm, eight soil horizons were identified and sampled: 0–1 cm D, 1–9 cm Bw, 9–12 cm 2Db, 12–17 cm 2Bwb1, 17–20 cm 2Bwb2, 20–24 cm 2Bwb3, 24–28 cm 2Bwb4, and 28+ cm 2Bwbfm (Fig. 5a, Tables III & IV).

Fig. 5 a. Taylor Valley surface prior to digging pit 2 (top), Taylor Valley pit 2 after excavation (bottom). b. University Valley surface prior to digging pit 7 (top), University Valley pit 7 after excavation (bottom).
Table III Secondary weathering phases in ADV soils. Semi-quantitative estimates of amorphous materials from Rietveld analysis of XRD patterns. Crystalline salts were identified by XRD but quantities are at trace levels.
Soil particle sizes generally decreased with depth in the soil column in pit 2 (and in the other pits examined in lower TV), but the size frequency distribution in the 20–24 cm horizon was distinctly different from all other horizons. The sand-sized fraction decreased with depth throughout the profile, except for the 20–24 cm layer, in which the relative abundance of sand increased at the expense of the silt- and clay-sized fraction. The silt fraction increased with depth, except at the 20–24 cm layer, in which it declined. The clay-sized fraction increased with depth going from 4% (by volume) at the surface to 45% of the < 2 mm material in the ice-cemented soil (Fig. 6a), and showed a substantial increase in the bottom two layers (> 24 cm). The USDA textural class of the < 2 mm fraction moved from sand at the surface to clay at depth with sandy loam and sandy clay loam soils at intermediate depths. The specific surface area of the soils also increased with depth, with a surface value of 1.8 m2 g-1 that increased to 93 m2 g-1 in the ice-cemented soil.

Fig. 6 a. Taylor Valley. (Top) Soluble ion concentrations from the aqueous extracts (extracted 1:1). Horizontal grey/white bars indicate the soil horizons. Dark grey indicates the ice table. (Bottom) Clay-sized fraction (percent*100), and perchlorate concentration (ppb) in aqueous extract. Perchlorate was only detected in horizons 2Bbw and 2Bbfm, the ice table. b. University Valley. (Top) Soluble ion concentrations from the aqueous extracts (extracted 1:1). Horizontal grey/white bars indicate the soil horizons. Dark grey indicates the ice table. No analysis of the D horizon was done. (Bottom) Clay-sized fraction (percent*100), and perchlorate concentration (ppb*10) in aqueous extract.
The mineralogy of the sand- and silt-sized fractions was dominated by feldspars, mica, quartz, pyroxene, and amphibole, and there were trace amounts of kaolinite and vermiculite. Pyrite framboids (microscopic aggregates of pyrite grains in spheroidal clusters resembling a raspberry) were identified throughout the profile by SEM, and became more prominent in the 17–20 cm layer and below. Fe-oxide staining was also seen at the 17–20 cm depth on surfaces of pebbles and rocks. XRD and TEM analyses indicated that the clay-sized fraction was dominated by X-ray amorphous or short-order, 2:1 phyllosilicates (Table III), along with mica, feldspar, amphibole, kaolinite, and vermiculite. The X-ray amorphous or short-order, 2:1 phyllosilicates were also seen in our other TV pits. TEM indicated that mica is weathering first to vermiculite and then to short order 2:1 phyllosilicates in the 0–1 cm horizon. The vermiculite was seen to be forming topotaxially (i.e. in mutual orientation) on the mica and the 2:1 short order phyllosilicates are associated with the vermiculite near the edges of the altered mica particles. TEM/EDS analyses indicate the loss of K in the vermiculitic layers and the formation of short-order 2:1 phyllosilicates, suggesting the weathering of K out of the mica interlayers accompanied by a reduction in layer charge.
The crystalline salts identified by XRD analysis of TV soils were gypsum in the 1–9, 9–12 and 12–17 cm horizons and nitratine in the 12–17 and 24–28 cm horizons. In the lowest horizon ∼5 wt% aragonite was detected by XRD and Ca-rich particles were confirmed by SEM/EDS analyses. This is consistent with the more alkaline pH in this horizon (see Table IV). XRD did not detect any sulphate-bearing species in the lowest horizon or any chloride phases in any horizon.
Table IV Soluble ions, pH, electrical conductivity. Concentrations of all ions, except ![]() , are for 1 g soil leached with 1 ml water. For
, are for 1 g soil leached with 1 ml water. For ![]() 1 g soil was leached with 5 ml water.
1 g soil was leached with 5 ml water.

nd = not detected at the IC method LOD of 0.05 μM in the solution.
aKounaves et al. 2010a.
Soluble ions in the TV soil column were dominated by Na+ and Cl- (Fig. 6a), particularly in the 1–9 cm and 12–17 cm horizons. The 1–9 cm horizon is by far the most saline - ![]() and all cation species were most abundant in this layer, with Cl- showing a large secondary peak in this layer as well. The maximum Cl- and
and all cation species were most abundant in this layer, with Cl- showing a large secondary peak in this layer as well. The maximum Cl- and ![]() concentrations were measured in the 12–17 cm horizon. Perchlorate (
concentrations were measured in the 12–17 cm horizon. Perchlorate (![]() ) was detected in this horizon and at the ice table interface, but was not detected elsewhere in the soil column (Table IV). Very small enrichments of Cl-, K+, Ca2+ and Mg2+ ions were found at the ice interface.
) was detected in this horizon and at the ice table interface, but was not detected elsewhere in the soil column (Table IV). Very small enrichments of Cl-, K+, Ca2+ and Mg2+ ions were found at the ice interface.
In the TV soils, the PLFA profile showed a peak in the 1–9 cm horizon (Fig. 7a), nearly an order of magnitude decrease in the lowest two soil layers (20–24 cm and 24–28 cm), and a sharp return to higher values at the ice table interface (28+ cm). The DNA trend shows two maxima, one at 9–12 cm and the other at 20–24 cm, and a sharp decrease in the 24–28 cm layer with only a modest return in the ice table interface layer.

Fig. 7 a. Biomass trends as determined via PLFA and DNA for TV pit 2. b. Biomass trends as determined via PLFA and DNA for UV pit 7.
University Valley
In UV, the depth to ground ice was 34 cm. The soil horizons analysed were: 0–1 cm D, 1–9 cm Bwz, 9–20 cm CBjjff1, 20–34 cm CBjjff2, and 34+ cm Cfm (Fig. 5b, Tables III & IV). The 1–9 cm horizon showed evidence of oxidation in the form of a strong red hue caused by iron oxides. Sand- and silt-sized fractions were dominated by quartz with lesser amounts of feldspar, pyroxene, and mica. Silt fractions also contained trace amounts of laumontite, pyrophyllolite, chlorite, and kaolinite.
The sand-sized fraction of the < 2 mm material was between 50–75% throughout the UV profile. There was less sand in the 10–19 cm horizon. The silt-sized fraction showed an increase in percentage with depth in the column. However, not including the surface pavement, the clay-sized fraction was 2–3 times higher in the top two layers (1–19 cm; Fig. 6b) compared to the lowest two layers. The soils have a USDA (< 2 mm fraction) class of either a sandy loam or a sandy clay loam. The specific surface area of UV soils showed little variation, with values ranging from a minimum of 3.8 m2 g-1 in the soil layer immediately above the ice layer and a maximum of 4.2 m2 g-1 in the layer of maximum clay concentration.
XRD results of clay-sized fractions were dominated by mica, with lesser amounts of amorphous materials (Table III), quartz, pyrophyllite, kaolinite, chlorite, and hematite. Gypsum and nitratine were identified by XRD in all horizons of the UV soil.
Soluble ions in UV peaked in the near subsurface (1–9 cm horizon), consistent with previous observations of similar high-elevation locations. Soluble anions were dominated by ![]() , which peaked in the 1–9 cm horizon and was probably paired with Na+ that also showed a strong concentration in this layer. Maximum
, which peaked in the 1–9 cm horizon and was probably paired with Na+ that also showed a strong concentration in this layer. Maximum ![]() and Cl- occurred in the 9–20 cm horizon, as did Mg2+ and K+. Ca2+ was equally abundant in the uppermost two horizons, but all soluble ions decreased precipitously in the 20–34 cm horizon. Although no indurated saltpans were found in the soil profile, we did observe some salt encrustations on the bottoms of rocks in the upper soil horizons. All horizons contained soluble
and Cl- occurred in the 9–20 cm horizon, as did Mg2+ and K+. Ca2+ was equally abundant in the uppermost two horizons, but all soluble ions decreased precipitously in the 20–34 cm horizon. Although no indurated saltpans were found in the soil profile, we did observe some salt encrustations on the bottoms of rocks in the upper soil horizons. All horizons contained soluble ![]() (Table IV), which also peaked in the 1–9 cm horizon.
(Table IV), which also peaked in the 1–9 cm horizon.
Ca2+ and ![]() showed secondary accumulations at the ice table interface (34+ cm), and SEM found two remarkably pristine-looking gypsum crystals in this horizon. We discuss possible explanations for apparently autochthonous gypsum at depths where liquid water is not expected in the Discussion. XRD did not detect any carbonates, consistent with the less alkaline pH observed in UV.
showed secondary accumulations at the ice table interface (34+ cm), and SEM found two remarkably pristine-looking gypsum crystals in this horizon. We discuss possible explanations for apparently autochthonous gypsum at depths where liquid water is not expected in the Discussion. XRD did not detect any carbonates, consistent with the less alkaline pH observed in UV.
The highest biomass measurements in UV were obtained from the ‘surface’ (0–1 cm) soil layer. The PLFA data show that below that layer there were two secondary peaks: the 1–9 cm layer and the ice table interface (34+ cm). These two horizons were ∼5x higher than the intervening horizons. Comparison of estimates based on total DNA with those based on PLFA (Fig. 7b) showed that the DNA method consistently gave higher values for all horizons in UV, but that both had higher values at the surface and near the ice table (20–34+ cm for DNA and 34+ for PLFA), with lower values in the intermediate layers. In the lowest horizons, the biomass rose 2–200+ times higher (based on PLFA or DNA, respectively) than that measured in the middle of the soil profile.
Discussion
Mineralogy, alteration, and particle properties
In TV, our mineralogical results are consistent with a warmer, wetter, and more habitable environment for microbes than UV. The presence of abundant X-ray amorphous phases and/or short-order 2:1 phyllosilicates suggests weathering in a moist environment. Additionally, the increase with depth of mineral specific surface area is due to higher clay-sized particle abundance and an increase in the abundance of X-ray amorphous phases.
The trend of greater clay-sized content with depth (Fig. 6a) may indicate either translocation of clays down the profile by water or layering of fines from glaciolacustrine sedimentation. The sharp increase in abundance of clay-sized particles below the 20–24 cm horizon may also reflect transport of clay-sized particles via water flow along the ice table.
There is evidence that the oxidation state of the TV soils is highly variable, presumably on an annual timescale. We observed ferric iron staining on pebble and rock surfaces in the 17–20 cm horizon, which is clear evidence of oxidation processes. We also observed pyrite framboids in all layers, but they became more prevalent in the 17–20 cm horizon and below. These can form both biotically and abiotically, but in either case their formation requires anoxic conditions, suggesting periodic saturation. Although pyrite framboids can form abiotically (e.g. in hydrothermal vents or volcanogenic deposits), our interpretation is that these are probably biogenic in origin because, at low temperature, pyrite framboids are most stable when associated with organic material (Sawlowicz Reference Sawlowicz2000). Further, the commonly occurring growth patterns of sulphate reducing bacteria (SRB), present in TV (Figs 8 & 9), as micro-colonies enclosed in extracellular polymeric substances leads to the distinctive framboidal appearance (MacLean et al. Reference MacLean, Tyliszczak, Gilbert, Zhou, Pray, Onstott and Southam2008).

Fig. 8 Graphical depiction of PLFA-based microbial community composition for each layer in TV pit 2 and UV pit 7. The data indicate a greater number of different microbial groups present in the TV soil pit than in the UV pit. The yellow, orange, and grey markers represent microbial groups that are exclusively or predominantly anaerobic in metabolic capability. The yellow marker present in the soil surface sample from UV represents the aerobic group Actinomycetes rather than the anaerobic sulphate reducing bacteria (SRB). In contrast, in the TV soils, yellow represents SRB, consistent with the pyrite framboids present within the soils (also absent in UV) that are indicative of active SRB metabolism and thereby of anoxic conditions.
In UV, there is less evidence of aqueous alteration of minerals. The UV sand- and silt-sized phases, with the possible exception of kaolinite, represent local parent rock fragments or phases that formed by hydrothermal alteration during the intrusion of the Ferrar Dolerite into the Beacon Sandstone. The clay-sized fraction abundance peaks at the 1–9 cm depth in UV (Fig. 6b) and then drops, as opposed to increasing in depth as in the TV profile, indicating that bulk liquid water does not routinely percolate deeper than this layer. Unlike TV soils, mica in UV soil has not undergone weathering to short-order 2:1 phyllosilicates suggesting minimal liquid water interaction (also seen in our other UV pit). Instead, the basaltic glass from the physical weathering of the Ferrar Dolerite is the probable candidate for the amorphous phase detected by XRD. However, the presence of hematite and the salts throughout the UV profile and the concentration of salts near the surface indicate that liquid water has played a role in the formation of these secondary phases.
Chemistry
Soluble ion species in the McMurdo Dry Valleys are principally comprised of Ca2+, Mg2+, Na+, ![]() ,
, ![]() , and Cl-, and the IC analyses that we performed were consistent with that. In TV (all four pits), soluble anions are dominated by Cl-, which correlates with Na+, and probably represents a marine aerosol source (Fig. 6a). Sulphate is a factor of four less abundant in the aqueous extraction, in all TV pits, which probably reflects the low solubility of sulphates in general. Marine aerosols are the probable source of
, and Cl-, and the IC analyses that we performed were consistent with that. In TV (all four pits), soluble anions are dominated by Cl-, which correlates with Na+, and probably represents a marine aerosol source (Fig. 6a). Sulphate is a factor of four less abundant in the aqueous extraction, in all TV pits, which probably reflects the low solubility of sulphates in general. Marine aerosols are the probable source of ![]() ; strongly deliquescent species such as Na2SO4 and NaHSO4 commonly act as condensation nucleii for aerosols and precipitate as an isotopically-identifiable source of salts (Bao & Marchant Reference Bao and Marchant2006). Nitrates are the least abundant of the three principal anions in the TV soil (< 10% of the total Cl-; true for all TV pits). Antarctic nitrate is primarily atmospheric in origin, the result of NOx oxidation and precipitation on the Antarctic ice cap as HNO3 (Michalski et al. Reference Michalski, Bockheim, Kendall and Thiemens2005). Nitrates are delivered from the polar plateau to the MDV by katabatic winds. Most nitrates are highly soluble, and are rapidly flushed through the soil column in TV by free-flowing liquid water.
; strongly deliquescent species such as Na2SO4 and NaHSO4 commonly act as condensation nucleii for aerosols and precipitate as an isotopically-identifiable source of salts (Bao & Marchant Reference Bao and Marchant2006). Nitrates are the least abundant of the three principal anions in the TV soil (< 10% of the total Cl-; true for all TV pits). Antarctic nitrate is primarily atmospheric in origin, the result of NOx oxidation and precipitation on the Antarctic ice cap as HNO3 (Michalski et al. Reference Michalski, Bockheim, Kendall and Thiemens2005). Nitrates are delivered from the polar plateau to the MDV by katabatic winds. Most nitrates are highly soluble, and are rapidly flushed through the soil column in TV by free-flowing liquid water.
The salt-enriched 12–17 cm horizon in the TV soils is characteristic of an enrichment observed throughout much of the subxerous zone in lower Taylor and Wright valleys, and was seen in all four TV pits examined. It is probably due to water infiltration (Bockheim Reference Bockheim1997). The small Cl- increase (seen in all four TV pits) and the biomass peak at the ice table probably reflect the occurrence of liquid water, due either to melting or lateral flow.
In UV, ![]() is the most abundant soluble anion at the top of the soil column.
is the most abundant soluble anion at the top of the soil column. ![]() is most abundant below 20 cm, and Cl- is least abundant (∼30% of the total
is most abundant below 20 cm, and Cl- is least abundant (∼30% of the total ![]() ; Fig. 6b). The dominance of
; Fig. 6b). The dominance of ![]() and
and ![]() is typical of ultraxerous soils (Bockheim Reference Bockheim1997), and our other UV pit was consistent with this. This reflects, in part, the diminishing importance of local marine aerosols with distance from the coast, and a proportionately greater contribution from stratospheric aerosols, as well as the absence of drainage throughout the soil column.
is typical of ultraxerous soils (Bockheim Reference Bockheim1997), and our other UV pit was consistent with this. This reflects, in part, the diminishing importance of local marine aerosols with distance from the coast, and a proportionately greater contribution from stratospheric aerosols, as well as the absence of drainage throughout the soil column.
In general, the concentration of Mg2+, ![]() , and
, and ![]() are higher in the UV soils (by factors of 2–20) than in TV (Fig. 6a & b), whereas K+, Na+, and Cl- are lower. Claridge & Campbell (Reference Claridge and Campbell1977) found that soils derived from dolerite had higher concentrations of Ca2+, Mg2+, and Na+ than other soils, with Ca2+ and Mg2+ attributed to the weathering of ferromagnesian minerals in the Ferrar Dolerite, a process we would expect in UV. Na+ is more abundant than Mg2+ or Ca2+ in the UV soil (true for both UV pits), and all three are much higher than K+.
are higher in the UV soils (by factors of 2–20) than in TV (Fig. 6a & b), whereas K+, Na+, and Cl- are lower. Claridge & Campbell (Reference Claridge and Campbell1977) found that soils derived from dolerite had higher concentrations of Ca2+, Mg2+, and Na+ than other soils, with Ca2+ and Mg2+ attributed to the weathering of ferromagnesian minerals in the Ferrar Dolerite, a process we would expect in UV. Na+ is more abundant than Mg2+ or Ca2+ in the UV soil (true for both UV pits), and all three are much higher than K+.
The correlation of Ca2+ with ![]() throughout the UV soil (in both UV pits) suggests precipitation of gypsum (Ksp = 2.4 x 10⁵). Indeed XRD confirmed its presence throughout the pit profile and, surprizingly, two pristine gypsum crystals were seen with SEM near the ice table, suggesting the presence of liquid water in that horizon at some time. Further discussion and modelling of water in the UV soil column is presented below.
throughout the UV soil (in both UV pits) suggests precipitation of gypsum (Ksp = 2.4 x 10⁵). Indeed XRD confirmed its presence throughout the pit profile and, surprizingly, two pristine gypsum crystals were seen with SEM near the ice table, suggesting the presence of liquid water in that horizon at some time. Further discussion and modelling of water in the UV soil column is presented below.
One of the interesting and unexpected results of the chemical analyses of the UV soils was the high level of perchlorate (![]() ) measured in at least some horizons in both valleys. The search for natural
) measured in at least some horizons in both valleys. The search for natural ![]() in the MDV was motivated by the unexpected discovery of
in the MDV was motivated by the unexpected discovery of ![]() on Mars by PHX (Hecht et al. Reference Hecht, Kounaves, Quinn, West, Young, Ming, Catling, Clark, Boynton, Hoffman, Deflores, Gospodinova, Kapit and Smith2009, Kounaves et al. Reference Kounaves, Hecht, Kapit, Gospodinova, Deflores, Quinn, Boynton, Clark, Catling, Hredzak, Ming, Moore, Shusterman, Stroble, West and Young2010b), and our findings are comparable to those at the PHX site.
on Mars by PHX (Hecht et al. Reference Hecht, Kounaves, Quinn, West, Young, Ming, Catling, Clark, Boynton, Hoffman, Deflores, Gospodinova, Kapit and Smith2009, Kounaves et al. Reference Kounaves, Hecht, Kapit, Gospodinova, Deflores, Quinn, Boynton, Clark, Catling, Hredzak, Ming, Moore, Shusterman, Stroble, West and Young2010b), and our findings are comparable to those at the PHX site. ![]() was distributed throughout the UV soil column (Fig. 6b; true for both UV pits). However, in TV, it was discontinuously distributed; it was only detected in the 12–17 cm horizon and at the ice table interface layer (28+ cm). Similarly, it was discontinuously distributed in all the TV pits. Since perchlorate is highly soluble, and is retained in UV's ultraxerous soils, its presence throughout the profile is an indication of the relative lack of liquid water influence.
was distributed throughout the UV soil column (Fig. 6b; true for both UV pits). However, in TV, it was discontinuously distributed; it was only detected in the 12–17 cm horizon and at the ice table interface layer (28+ cm). Similarly, it was discontinuously distributed in all the TV pits. Since perchlorate is highly soluble, and is retained in UV's ultraxerous soils, its presence throughout the profile is an indication of the relative lack of liquid water influence.
Across all UV samples (in both pits) there is a correlation between ![]() and
and ![]() abundances (r 2 = 0.85), supporting the hypothesis that
abundances (r 2 = 0.85), supporting the hypothesis that ![]() is globally formed in the atmosphere, but survives in the soil only in hyperarid environments. The discovery of this natural
is globally formed in the atmosphere, but survives in the soil only in hyperarid environments. The discovery of this natural ![]() in the MDV and its potential presence over the entire ice cap has significant implications for its origin and interaction with aqueous environments and microbial communities (Kounaves et al. Reference Kounaves, Stroble, Anderson, Moore, Catling, Douglas, Mckay, Ming, Smith, Tamppari and Zent2010a).
in the MDV and its potential presence over the entire ice cap has significant implications for its origin and interaction with aqueous environments and microbial communities (Kounaves et al. Reference Kounaves, Stroble, Anderson, Moore, Catling, Douglas, Mckay, Ming, Smith, Tamppari and Zent2010a).
Biology
Our biological data were meant to provide 1) an indication of whether microbial biomass was or was not present and its relative (not absolute) abundance among layers in each pit, and 2) a broad indication of the major types of metabolic and structural groups present as measurable by the PLFA method. This was not meant to be a characterization of microbial community composition or diversity but, rather, since the same methods were used for each and every soil sample, to offer an inter-comparative way of delineating heterogeneity. Such information can guide future work in which the microbial communities and diversity could be characterized using DNA and RNA based phylogenetic approaches. These results, while not definitive, establish the presence of microorganisms in all sampled horizons down to and including the ice table in both UV and TV - a fact that has not previously been reported for ultraxerous zones.
Our PLFA analysis showed that microbes are more numerous and also represent a greater number of metabolic and structural groups in the subxerous, lower TV soils than the ultraxerous UV soils (Fig. 8): TV had both aerobic and anaerobic microbial groups. In contrast, anaerobic microbial groups were undetectable in the dry, oxidized soils of UV. In TV, the greater amount of liquid water allows drainage and pooling leading to saturated zones in the soil, which subsequently become anoxic, resulting in a heterogeneous environment that supports a greater number of microbial groups. In the subxerous MDV soils, recent studies demonstrated that the microbial content approached that of temperate desert soils, ∼108 cells g-1, (Cowan et al. Reference Cowan, Russell, Mamais and Sheppard2002) and phylogenetic analyses (Aislabie et al. Reference Aislabie, Jordan and Barker2008) showed that these communities are remarkably diverse, a fact that relates to the stability and abundance of liquid water.
The microbial population in TV is, in fact, on a broad level more similar to the Arctic population, a known wet and cold environment, than to population in UV. Figure 9 shows a comparison of the ice-table layer PFLA results for TV, UV, and an Arctic permafrost location. The Arctic samples were collected in midsummer from the bottom of the active layer (the very top of the ice-cemented ground) at a site with patterned ground (79.40451° N, 90.78466° W, 116 m elevation) on a flank about one hundred metres above Expedition Fjord, down slope from the McGill High Arctic Research Station (for a description of the area around the Station see Pollard et al. Reference Pollard, Omelon, Andersen and McKay1999, Heldmann et al. Reference Heldmann, McKay, Pollard, Andersen and Toon2005). They were analysed by the same company and in the same way as our MDV samples, and are consistent with the findings of other researchers (e.g. Steven et al. Reference Steven, Léveillé, Pollard and Whyte2006). Both the Arctic and TV samples, which come from a “wet” permafrost environment where periodic water saturation and therefore anoxic conditions occur near the ice table, had both aerobic and anaerobic microbial groups. In contrast, anaerobic microbial groups were undetectable in the dry, oxidized soils of UV.

Fig. 9 PLFA-based groupings of microorganisms at the ice table interface from two wet permafrost environments (Arctic and Taylor Valley) and a dry permafrost environment (University Valley), expressed in percent of total. PLFA-based biomass measurements for these samples were: 4.53 x 10⁷ (Arctic), 2.97 x 10⁷ (TV), 1.16 x 10⁵ (UV). Note that biomass at the ice table in UV was two orders of magnitude lower than at the wet permafrost sites.
We hypothesize that the biomass differences between TV and UV are strongly influenced by the amount of available water for microbes to use. However, other factors may also play a role, such as differences in soil geochemistry and mineralogy, especially the availability of necessary ions and soluble metal species that may be more readily accessible and exploitable by microorganisms in the wetter environment of the TV soils.
The generally higher biomass estimates given by the DNA-based method as compared to PLFA estimates (Fig. 7) may be due to several reasons. Previous studies have shown that, even in Antarctica, where molecules may be expected to resist degradation longer than in warmer regions, PLFA do not persist very long in a measurable form after the death of the organisms which formed them (Cowan et al. Reference Cowan, Russell, Mamais and Sheppard2002). Therefore, our PLFA results may represent live biomass only while the DNA estimate includes both live and dead biomass. Secondly, the PLFA may show lower extraction efficiency or the models used to relate PLFA amount to microbial cell numbers are not appropriate for the soils we studied. However, the key findings are that biomass is present in every layer sampled in both valleys, and numbers are higher near the surface and near the ice-cemented ground than in the intervening layers in UV.
University Valley soil history and habitability
While there is a body of knowledge about the high-elevation Dry Valleys and their dry permafrost environment, our UV findings show some differences from other reports of ultraxerous soils, indicating that the soil history and habitability of this valley may be unique. First, none of the commonly seen salt accumulations were found. Second, and even more peculiar, evidence was seen of autochthonous gypsum in soil horizons that are far too cold and dry to permit subaqueous precipitation (Fig. 10; also seen in the other UV pit). Third, our horizon-by-horizon sampling showed the greatest microbial population in the surface layer with secondary peaks in microbial population in the 1–9 cm layer and in the two bottom layers, including the ice table; biomass depth profiles in the ultraxerous soils have not been previously reported, only soil surface biomass estimates exist.

Fig. 10 SEM image showing a pristine, apparently autochthonous gypsum crystal from the +34 cm horizon in UV.
In an attempt to explain the autochthonous gypsum, we consider the possibility that it indicates occasional penetration of liquid water all the way to the ice table. The maximum depth reached by liquid water on infiltrating a frozen soil depends upon its temperature and the rate of infiltration. Meltwater entering the soil profile will drain under gravity, filling pores and dissolving salts until either, a) gravity is equalled by matric suction, or b) the water freezes. We use our sub-surface thermal model to investigate the sub-surface temperatures and water activity during midsummer in UV. Figure 11 shows soil temperatures in UV recorded for the month of January 2010 two years after our samples were collected (Marinova et al. Reference Marinova, McKay, Heldmann, Davila, Andersen, Jackson, Lacele, Paulson, Pollard and Zacny2011). These were used to ground-truth our model. The soil pit in which these data were recorded is at 77°51′35.04′′S, 160°43′1.14′′E; elevation: 1684 m. The depth to ground ice was 36 cm (cf. 34 cm at pit 7). The distance between our pit (pit 7) and the pit used by Marinova et al. (Reference Marinova, McKay, Heldmann, Davila, Andersen, Jackson, Lacele, Paulson, Pollard and Zacny2011) is 358.8 m, and the bearing is 222°31′. At no time during January 2010 did the 0°C isotherm reach as deep as 10 cm. The temperature at the ice table was ∼ -14°C throughout the month.
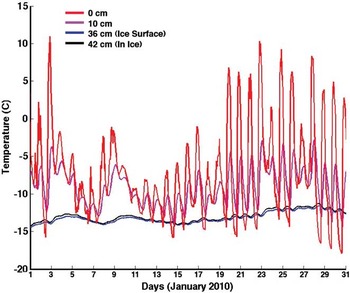
Fig. 11 Soil temperatures from University Valley, January 2010. Data are from Marinova et al. (Reference Marinova, McKay, Heldmann, Davila, Andersen, Jackson, Lacele, Paulson, Pollard and Zacny2011). The 0°C isotherm does not reach beyond ∼10 cm. At the ice table (36 cm), temperatures do not exceed -12°C.
The sub-surface thermal model predicts the sub-surface temperature field for a full day, near the warmest part of the year (3 January), and reproduces the main features observed in the data, specifically that the surface temperature exceeds 0°C during the warmest part of the day and the maximum penetration of the 0°C isotherm is < 10 cm (Fig. 12a). In addition, the temperature of the ice table, at 34 cm, is fixed by the measurements shown in Fig. 11.
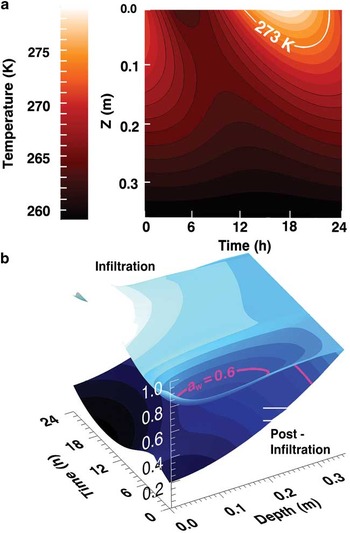
Fig. 12 a. Modelled subsurface temperatures at the University Valley pit for midsummer (∼3 January). b. Modelled water activity, aw (z-axis), for two conditions. The upper surface represents snowmelt and infiltration, while the lower surface, calculated for the same thermal history, applies to dry, post-infiltration conditions. Both activity profiles are anchored at ∼aw = 0.87 by the ice table at 34 cm. The contour for aw = 0.6 is marked (pink).
This modelling suggests, in spite of the uncertainty in total snow accumulation at UV and compounded by the uncertainty in the ratio of sublimated vs melted snow, that substantial snowmelt and infiltration events that allow water to reach the ice table are rare. If liquid water is to percolate to the ice table through the frozen overburden, latent heat of freezing must release enough heat to raise the soil temperature to 0°C. Integrating the temperature profile between 8 and 34 cm, and using the measured volumetric heat capacity of the soil (1.7 x 10⁶ J m-3 K-1), the required heat is equivalent to freezing a 5 cm column of liquid water, assuming the water enters the soil column at 0°C. This seems an unlikely daily infiltration rate in the current climate. The instability of liquid water at depth is consistent with the maximum abundance of salts that occur within the 1–9 cm horizon and also with the observation that visible oxidation was confined to the uppermost 10 cm of the profile.
If it is problematic to get liquid water at the depth of the gypsum in the current environment that may not always have been the case. UV soils are derived from the sandstone and dolerite found in the valley walls, consistent with Linkletter et al. (Reference Linkletter, Bockheim and Ugolini1973) and we interpret the valley floor to be the result of an inflationary process since the friable Beacon Sandstone weathers relatively rapidly. Therefore, this horizon may have formed early in the history of these soils and been subsequently buried and preserved by addition of sandstone and dolerite. The scarcity of rocks and pebbles in the soil column, the absence of an indurated saltpan, and the preponderance of sand-sized quartz, argue that inflation has played a significant role in establishing the soil column. For an inflationary surface, older material is progressively buried, and the autochthonous CaSO4·2H2O may have been precipitated at a time when it was within the active layer, and liquid water a common occurrence.
In an attempt to explain the UV microbial population peaks in the uppermost subsurface and near the ice table, we hypothesize that these peaks may be the result of adaptation to two water reservoirs: occasional surface snow with rare meltwater, and the essentially invariant ground ice, which maintains high relative humidity at the bottom of the soil column.
Assuming the microbial biomass peaks represent more clement environments, the thermal model can again be used to estimate bounding values of the water activity (defined as the partial pressure of water, relative to the saturation vapour pressure over liquid water, even at temperatures < 0°C). The activity of water, aw, is considered a key environmental parameter for microbial survival and a bulk value of aw = 0.6 represents the lowest limit for which growth has been seen (aw = 0.61; Grant Reference Grant2004).
In summer, one may imagine that some snow cover might melt. However, snow cover is limited in UV (McKay Reference McKay2009), and for much of the summer, relatively dry conditions would be expected. We capture these two conditions in Fig. 12b. The upper surface indicates a condition where surface snow is melting and infiltrating whereas the lower surface represents drier summertime conditions. For the case in which surface snow melts (upper surface), where T > 0°C, it is assumed liquid water is present and aw = 1 (surface down to ∼ 8 cm for a portion of the day). The lower boundary condition is essentially invariant, and set by the temperature of the ice table at -14°C, which fixes aw ≈ 0.87. We assume that sufficient water is present throughout the soil to saturate the pore spaces. Thus, when snow is melting, aw is greater than the biological bulk threshold value of 0.6 for the entire soil column for most of the day. These conditions however, are unlikely to be long-lived and they evolve to much harsher conditions once the snowmelt has ended.
Drier summertime conditions are represented in the lower surface of Fig. 12b. The relative humidity of the atmosphere as measured by the TECP is used as the upper boundary, and the same sub-surface ice layer sets the lower boundary; the aw equals 0.6 from the surface to about 28 cm depth or 6 cm above the ice layer. Between 28 cm and the ice table, aw > 0.6, and summer temperatures are -14 to -10°C. Thus, near the ground ice table there exists a unique and viable habitat, and microbial growth is possible continuously throughout much of the summer. We interpret the increase in biomass near the ice table to be a consequence of this clement environment. However, it should be noted that microorganisms deposited at the surface could be progressively buried and reach the ice table after some 5000 to 50 000 years (Mahaney et al. Reference Mahaney, Dohm, Baker, Newsom, Malloch, Hancock, Campbell, Sheppard and Milner2001). In the cold dry environment of the UV soils, they could remain viable but dormant for this entire time.
Intermediate soils (13 cm < z < 28 cm predicted in the model) experience neither infiltration of melt, nor the consistently high relative humidity of the lowest layer, and our data show substantially smaller biomass in the 9–20 cm horizon. The detection of PLFA and DNA molecules throughout the soil column may mean that there are microenvironments in the “dry” permafrost in which sufficient unfrozen water is occasionally present to allow metabolic processes, or that the remains of dead cells from the surface can be transported down through the soil column.
University Valley and the Phoenix landing site
Qualitatively, both UV and the PHX landing site in the Martian Arctic can be characterized as dry permafrost overlying ice-cemented ground, and this was one of the initial motivations to test Phoenix hardware in UV.
In the Martian Arctic today, water is primarily in vapour and ice form, with perhaps discontinuous and immobile unfrozen water, due to the very cold temperatures. In fact, these low temperatures restrict the activity of water to an annual range of aw ∼ 0.6–0.1. However, at UV, calculations based on vapour pressure over ice show that soil pores at the ice table range annually between aw ∼0.9–0.74. Obliquity changes may increase the Martian Arctic temperatures to become similar to those in UV today, but whether the aw increases with this temperature increase is extremely uncertain, due to our poor understanding of global and boundary layer dynamics at high obliquity, as well as the details and kinetics of Martian global water redistribution. It is however, at least plausible that the PHX site could support metabolic activity of microbes during periods of high obliquity. One limitation on the habitability of the PHX site might be the requirement that, due to the obliquity-change cycle, microbial communities might need to survive dormancy periods on the order of 106 years (Zent Reference Zent2008). Diurnal temperature changes across most of Mars are extreme in the current epoch, but temperature variations are less extreme at high latitudes, even less beneath a few centimetres of highly insulating regolith, and less again at high obliquity. Consequently, diurnal temperature variations are not thought to be a limiting factor for habitability.
If, in a given orbital cycle period, Mars had sufficient aw to support microbial activity, we consider the very different soil chemistry at UV and PHX, and metabolic pathways that might be available. In UV, the soil is continually inoculated with organic compounds and cells from the Beacon Sandstone cryptoendoliths (Nienow & Friedmann Reference Nienow and Friedmann1993). It is therefore probable that the microbial population at UV primarily metabolizes through heterotrophic oxidation of those organics. The presence of organics on the Martian surface, however, is far less clear. Unaltered carbon delivered to the Martian surface via meteoritic infall is estimated to be 2.4 x 10⁵ kg yr-1 (Flynn Reference Flynn1996), but organics have not been confirmed by robotic exploration. Further, recent results by Navarro-Gonzalez et al. (Reference Navarro-González, Vargas, De La Rosa, Raga and McKay2010) indicate that organics may have been contained in the Viking samples, but would not have been detected if some perchlorate were present in those samples as well. Thus, since there is still no concrete evidence for organic compounds in the Martian regolith, a putative Martian biota might require an inorganic carbon source (e.g. atmospheric CO2) as well as a plausible metabolic pathway. We suggest that in the absence of pre-formed organic carbon in the Martian soil the perchlorate discovered by PHX could provide an electron acceptor. The PHX soils have < 1% perchlorate (Hecht et al. Reference Hecht, Kounaves, Quinn, West, Young, Ming, Catling, Clark, Boynton, Hoffman, Deflores, Gospodinova, Kapit and Smith2009) and there is no toxicity to microbes even at much higher concentrations. Experiments with a microbial culture obtained from a contaminated deep vadose zone showed that the organisms were able to reduce perchlorate and had no detrimental effects at levels up to 2% perchlorate (Gal et al. Reference Gal, Ronen, Weisbrod, Dahan and Nativ2008). Therefore, the levels of perchlorate found at the PHX site do not necessarily preclude habitability.
Terrestrial perchlorate-reducing bacteria can reduce perchlorate with a number of different electron donors: hydrogen, a variety of organic species, Fe2+, and H2S (Coates & Achenbach Reference Coates and Achenbach2004). Autotrophic (i.e. those which use inorganic carbon sources) perchlorate-reducing bacteria have been found to be widespread in natural, uncontaminated environments (Miller & Logan Reference Miller and Logan2000) so that autolithotrophic metabolism using H2, CO2, and perchlorate is plausible. Mars is a basaltic planet, so one might hypothesize that soluble Fe2+ from unweathered primary minerals would be available in soil solution for microbial metabolism. Although Kounaves et al. (Reference Kounaves, Hecht, Kapit, Gospodinova, Deflores, Quinn, Boynton, Clark, Catling, Hredzak, Ming, Moore, Shusterman, Stroble, West and Young2010b) reported Fe2+ ≤ 10-4 M (the detection limits) in the PHX WCL data, this amount was measured in bulk soil and is higher than that exploitable by microorganisms in soils on Earth. Micro-zones such as those at the ice/soil particle interface might have exploitable ferrous iron unmeasurable by the WCL. In summary, it is plausible that the appropriate aw can exist in certain epochs, and that there exists metabolic pathways for microbes, even in the absence of organics.
Conclusions
We present the results of a comprehensive, horizon-by-horizon analysis of the soil column from 1 of 4 subxerous lower TV pits and 1 of 2 ultraxerous UV pits which investigated the effects of ever-decreasing unfrozen water in cold deserts. These results serve as comparison points for the investigation of dry permafrost on Mars.
Where the air and soil column warm to > 0°C annually, liquid water is abundant. Soluble salts were less abundant, and the vertical distribution of clay-sized fractions suggested translocation via liquid water. Mineral assemblages of pyrite and Fe-oxide were evidence of recent (probably seasonal) variations in the redox state of the soil. Soil biomass in subxerous soils was nearly equivalent to those found in temperate soils and similar to arctic permafrost ice table results. The number of metabolic and structural groups was also higher, which argues that a variety of soil microenvironments were occupied, and that the extreme low temperatures in the MDV, per se, are no significant barrier to habitability.
In UV, slightly cooler soil and air temperatures severely limit the occurrence of water in the soil. As a result, soluble salts, clay-sized particles, and biomass are all concentrated near the surface, where the limited annual liquid water occurs. Salts are more abundant than in subxerous soils, soluble salts particularly so. Soil biomass is far less abundant and there are fewer metabolic and structural groups than in TV, but nowhere did we find a sterile soil horizon, or one lacking clay-sized particles and soluble ions. Further, the lack of altered mica particles indicates minimal aqueous alteration, unlike the mica in the lower TV soils. Under such challenging conditions, microbial populations may be measurably enhanced in microenvironments that are marginally less stressful in terms of aw, such as near the ice table.
Although the PHX landing site is currently too cold to support aw values necessary for metabolism, orbital variations may periodically bring the soil to within the T-aw domain of terrestrial psychrophiles. With the presence of organics uncertain, but possible, autotrophic perchlorate reducers could be the possible source of primary production. Survival of long, but indeterminate dormancy periods between high obliquities would be essential.
Acknowledgements
The authors would like to thank two anonymous reviewers for very thorough reviews of this paper that helped substantially improve it. Part of this work was conducted at the Jet Propulsion Laboratory/Caltech under a grant funded through the International Polar Year research opportunity with NASA. We thank the NSF Office of Polar Programs and the men and women of the US Antarctic Program for outstanding support of field operations.