


1. INTRODUCTION
The complexity of soil behavior has led to the development of a large number of intricate soil constitutive models. Until recently, these models were based on classical elastoplastic theories and used constructs like yield surfaces, bounding surfaces, and critical state cones to describe observed soil behavior (Roscoe & Burland, 1968; Dafalias, 1980; Whittle & Kavvadas, 1994; Prevost & Popescu, 1996). However, new methods of formulating soil constitutive models are emerging.
The pioneering work of Ghaboussi and colleagues (Ghaboussi et al., 1991; Ghaboussi and Sidarta, 1997) demonstrates that artificial neural networks (ANNs) can be used to characterize material constitutive behavior. Given enough data, a trained ANN effectively becomes a virtual soil. A large amount of stress–strain data is needed to capture the behavior of a soil within an ANN-based material model under general loading conditions.
ANN material models are being used within self-learning simulation (SelfSim) to extract soil behavior (Sidarta & Ghaboussi, 1998; Shin & Pande, 2000, 2002; Hashash et al., 2003a, 2004) from boundary measurements of load and displacements for excavation problems and laboratory tests. Shin and Pande (2002) describe methods to generalize data sets for NN training. In this paper we discuss methods to reduce the size of training sets while maintaining the same learned behavior within the NN model.
The SelfSim inverse analysis approach provides a rich set of stress–strain soil behavior that can be used to train a more general ANN material constitutive model. Within the SelfSim procedure a large amount of data is generated and used in the training of the ANN model. This training is very time consuming; it takes the ANN model a significant amount of time to fully learn the soil behavior. The length of ANN training makes it cumbersome to apply this method to large-scale engineering problems. However, in any ANN training data set, there is a large amount of redundant data, or data whose stress–strain paths are very similar. By removing stress–strain paths that are similar from the ANN training data set, the ANN training time can be greatly reduced without compromising the accuracy of the ANN model.
2. ANN MATERIAL MODEL ARCHITECTURE AND TRAINING PROCEDURE
Figure 1 shows the ANN architecture used in this paper that uses the nested ANN (NANN) concept introduced by Ghaboussi and Sidarta (1998). The architecture consists of input and output layers separated by two “hidden” layers. The input layer consists of the current strain state, the previous strain state, and the previous stress state; the output layer is the current stress state. The selected ANN architecture is composed of base and history modules, whereby each module is a multilayer, feedforward NN. Higher level history modules, which represent prior states of stress and strain, have only one-way connections to lower modules. This one-way connection is a unique characteristic of the NANN, and is imposed to eliminate the influence of more recent states of stress and strain on prior states.

A nested adaptive NN soil model. Arrows represent layer connections.
ANN-based models are distinctly different from conventional material constitutive models in that the model does not include an explicit definition of material stiffness, yield surface, hardening rules, and so forth. ANN material models provide users with unprecedented flexibility for learning complex material behavior. This paper uses the backpropagation algorithm (Reed & Marks, 1999) in the training of the ANN. During ANN training, the connections between the layers are adjusted until global error reaches a minimum. A large set of stress–strain material data is required to properly train an ANN material model.
3. SOIL BEHAVIOR USED FOR MODEL TRAINING
Conventional laboratory tests do not generally provide sufficient data sets for training of ANN material models. Hashash et al. (2003a) introduce the use of the autoprogressive algorithm for extracting material constitutive behavior using boundary measurements of deformations around deep excavations. SelfSim is a novel inverse analysis framework that uses the autoprogressive algorithm in conjunction with NN material models to extract soil behavior from field observations. This framework allows the numerical model to continuously learn from field observations. The framework, as applied to deep excavations, is summarized here and presented in more detail in Hashash et al. (2006), Marulanda (2005), and Hashash et al. (2003a).
In a typical braced excavation problem, Figure 2 wall deformations and surface settlements are measured at selected excavation stages (Hashash et al., 2003b). In a given excavation stage, the soil has been excavated to a known depth and a number of struts have been placed to support the excavation wall. In step 2a of SelfSim learning the soil is removed and bracing is installed to correspond to a given excavation stage, that is, force boundary conditions are applied. The algorithm stipulates that stresses, computed based on equilibrium considerations, are representative of actual stress fields. In step 2b the measured field deformations are imposed on the model. The algorithm stipulates that strains, computed using compatibility considerations, are representative of actual strain fields. Both analyses use the same NANN-based soil model. The computed stress–strain pairs are used to retrain the NANN material model.

The SelfSim inverse analysis framework. [A color version of this figure can be viewed online at www.journals.cambridge.org]
Several SelfSim learning cycles are performed for each construction stage. SelfSim learning cycles are performed sequentially for all available construction stages. This results in a single SelfSim learning pass. Several learning passes are usually needed to develop an ANN constitutive model that will adequately capture measured deformations in a finite element (FE) analysis. The resulting ANN constitutive model can be used in the analysis of later excavation stages or other types of excavations in similar ground conditions as shown in step 3 of Figure 2.
The SelfSim algorithm is computationally demanding because the ANN model is repeatedly retrained to fully learn the soil behavior using large stress–strain data sets. An ANN model has to be retrained up to several hundred times during SelfSim learning. By reducing the training data sets and subsequently the training time of ANN models, the SelfSim algorithm can be run more efficiently, and is made more practical for use in large-scale engineering problems.
A hypothetical deep excavation is simulated using the FE method and used to provide a diverse stress–strain data set for training an ANN material model and exploring methods to reduce the size of the data set while maintaining the performance of the trained material model. The idealized deep excavation in Figure 3 is constructed after Hashash and Whittle (2002), who use the MIT-E3 model to simulate normally consolidated Boston blue clay. The plane–strain analysis is performed assuming undrained conditions and shows that the soil within the excavation and behind the support wall undergoes complex loading paths. The soil undergoes maximum strains of about 1%, yet most of the soil experiences strains less than 0.4%. Stress–strain data is extracted at the Gaussian integration points in the FE mesh and used to train an ANN model, and includes 3960 data sets per step and 34,885 data sets for all 10 excavation stages (some data sets are removed with each excavation stage).

The geometry used in ANN model training.
4. EVALUATION OF LEARNED SOIL BEHAVIOR
After ANN model training is complete, the model must be exercised to determine how well it has learned its target soil behavior. The ANN model is used in the same FE analysis from which the training data set is extracted. The performance of the trained ANN is evaluated by comparing boundary deformations with the target response, comparing stress–strain response throughout the model, and data visualization. These methods for evaluating the performance of the learned soil behavior are first demonstrated using an ANN model trained using the full stress–strain data set. The methods are then used in evaluating ANN models trained with reduced data sets.
4.1. Evaluation of boundary deformations
FE model boundary deformations give a good overall representation of the performance of the ANN model. To evaluate the ANN model, wall movements and surface settlements in the ANN model and target soil FE analyses are compared. The agreement between these analyses is quantified using MLa values (Marulanda, 2005). The differences between the learned and base soil model responses are calculated for each point (down the wall or along the surface) in each excavation stage. Then, the mean and standard deviation are computed for these differences to estimate the limits of agreement defined by Bland and Altman (1986). The limits of agreement are defined by the mean of the differences (d) ±2 standard deviations (2s):

Here, La+ and La− are the upper and lower limits of the absolute value of the differences between target and computed response. A total of 95% of differences lie between these limits (Bland & Altman, 1986). The magnitude of the interval from La+ to La− is referred to here as the MLa:
A small value for the MLa is desired, because it represents better agreement between the learned and target soil responses. Figure 4a and b show wall movements and surface settlements for the learned and target soil behavior, respectively. For the trained ANN model, the MLa value for surface settlements is 0.11 mm, and for wall movements the value is 0.08 mm. For comparison, the target soil maximum values for surface settlement and wall movement are 53 and 105 mm, respectively. Therefore, the surface settlements and wall movements of the trained ANN model correspond very well to those of the target soil behavior.

Responses of the ANN model trained with a full data set: (a) wall movements, (b) surface settlements, (c) normal stress visualization, and (d) shear stress visualization. [A color version of this figure can be viewed online at www.journals.cambridge.org]
4.2. Three-dimensional (3-D) data visualization
Evaluation of boundary deformations indicates that the ANN model likely learned the target soil behavior. However, this method of comparison does not actually compare the stress–strain behavior of each Gaussian point in the FE mesh. A quick, qualitative method for comparing Gaussian point behavior is to plot the stress–strain state of each Gaussian point in a 3-D space.
The visualizations in this paper are generated with the VizCoRe workbench. VizCoRe (visualization of constitutive relations, www.uiuc.edu/∼vizcore) is an integrated environment to characterize, develop, and learn material constitutive relations. VizCoRe is further described in Hashash et al. (2002, 2003c). Although the actual plotted data is three dimensional, it is presented here as 2-D slices to facilitate presentation on a 2-D sheet.
Figure 5 plots the target soil response (here characterized by the MIT-E3 soil model) and the learned soil response in stress space. Because stress is the output of the ANN model, it is more appropriate to evaluate the accuracy of the model by visualizing its data in stress space. The data is normalized by the corresponding initial effective vertical stresses.

A comparison of the target soil stress response (represented by the MIT-E3 soil model) and the trained ANN model stress response. A full data set was used in training the ANN model. [A color version of this figure can be viewed online at www.journals.cambridge.org]
Overall, the target soil response and the learned soil response are very similar, and occupy roughly the same area in stress space. However, there are some notable differences when comparing the two responses. For example, in the learned soil response, significantly many more points experience larger decrease in stress. These same points also experience decrease in shear stresses that are not present in the target soil behavior. All of these data points come from areas far behind the excavation wall. These areas experience very small strain magnitudes the ANN did not learn well. Nevertheless, the overall response of the excavation is well represented.
4.3. Evaluation of soil behavior
Data visualization qualitatively compares target and learned soil responses. The concordance correlation coefficient (CCC) proposed by Lin (1989) is used to quantify the amount of correlation between the target soil response and the learned soil response. The CCC is a widely used measure to evaluate the agreement between two data sets by measuring the data distribution along the 45° line through the origin. That is, if one data set is plotted on the x axis, and another on the y axis, the 45° line through the origin would be a line of perfect agreement between the data sets. Unlike other measures of correlation, like the correlation coefficient (R2), the CCC measures both precision and accuracy. Precision evaluates how far the stresses or strains deviate from the best-fit linear function. Accuracy evaluates how far the best-fit line deviates from the 45° line (Lin, 1992). The CCC is scaled between −1 and 1, where 1 reflects perfect agreement, −1 reflects perfect reverse agreement, and zero reflects no agreement. The CCC is estimated using the mean (Yj), variance (Sj2), and covariance (S122) of the stresses and strains as follows:
where


and

For evaluation of global stress–strain behavior, Y1 and S1 correspond to the mean and the variance of learned soil stresses or strains, Y2 and S2 correspond to the mean and the variance of target soil stresses or strains, and S12 is the covariance between learned soil responses and target soil responses (Marulanda, 2005). In calculating CCC values, stress–strain response from the geostatic stage of the FE analysis is ignored, as it does not pertain to actual constitutive behavior and would only bias the calculated CCC values.
Table 1 gives the CCC values for the learned soil behavior for the seven nonzero components of stress and strain. All CCC values are very high, and indeed, CCC values mostly show very little variation. However, the variation that does occur is significant, and corresponds to very large differences in FE analysis results.
CCC values of stress–strain components for ANN model trained with MIT-E3 data

Figure 4 shows complete response of the ANN model trained with braced excavation data. Both the wall movements and surface settlements match their targets very closely, as implied by the above MLa values.
Although the behavior of the trained soil model is very good, the training time with the full data set on a 1.7-GHz desktop computer can take up to 44.1 h. Such a long training time makes the ANN training procedure cumbersome to use, especially when coupled with the SelfSim procedure.
4.4. Methods for improving soil model training performance
The amount of data used in the training procedure must be reduced to minimize the training time for an ANN model. However, this must be done without adversely affecting trained model performance. A large amount of the training data can be removed by taking advantage of self-similarity within the training data set.
This concept is best understood through data-set visualizations like Figure 5a. This figure shows the stress states from the braced excavation. The paths are very tightly spaced, and many paths contain similar information about soil behavior. By removing stress–strain data paths that are similar, the number of repetitive data can be reduced. Left behind is a data set that contains the minimum amount of information necessary for learning the relevant soil behavior. Because there is less data in the training data set, ANN model training takes less time. Because the training data still contains stress–strain paths that represent the relevant soil behavior, ANN model performance is not compromised. The concept of reducing large data sets while maintaining the essential information content of the data sets is used in a range of applications including electronic data and image compression, graphical data display (Hill & Lewicki, 2006), and data mining (Chen et al., 2004). Similar concepts are needed for reducing training stress–strain data sets for the ANN material model. Three methods for reducing an ANN training data set are introduced in the following paragraphs: the Gaussian point method, the lattice method, and the loading path method.
4.5. Gaussian point method
The simplest method for reducing a data set uses the geometry of the FE mesh to choose the points to retain. The deep excavation model of Hashash and Whittle (2002) uses standard eight-node isoparametric elements; each element contains nine Gaussian integration points, where values of stress and strain are calculated. In the Gaussian point method, the training data set is reduced by retaining data from only certain Gaussian integration points in each FE. Figure 6 shows the order in which the Gaussian integration points are removed from the elements; the scheme attempts to maintain symmetry of the retained points during data removal.
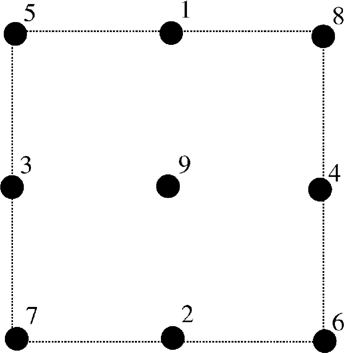
The order in which Gaussian integration points are removed in the Gaussian point data reduction method.
4.6. Lattice method
Although the Gaussian point method is very simple, it is also linked to the geometry of the FE model. With the lattice method, focus is shifted away from model geometry and toward the distribution of data in stress–strain space.
In the lattice method, an imaginary point lattice is superimposed on the Gaussian point stress data and used to ensure an even data spacing. The steps in this method are the following:
1. Normalize stress data from last stage of the FE analysis by the initial vertical effective stress. The last stage of the FE analysis generally corresponds to the widest distribution of data in stress–strain space.
2. Choose a lattice spacing corresponding to the minimum desired distance between stress points.
3. Choose a stress point and calculate the distance between it and all other stress points. Distance is calculated as

where σij,A is the ijth component of stress for the chosen Gaussian point, and σij,B is the ijth component of stress for the Gaussian point being compared.
4. Remove all points closer than the chosen lattice spacing.
5. Repeat steps 3 and 4 for all remaining stress points.
4.7. Loading path method
The lattice method only considers the spatial distribution of the final stage of the FE analysis; it does not account for the stress–strain history of each point. In the loading path method, stress–strain paths that are similar, that is, they experienced similar loading histories, are removed to reduce the size of the data set. To determine how alike these stress–strain paths are, the concordance correlation coefficient is again employed. In this instance, Y1 and S1 from Eq. (3) correspond to the mean and the variance of one stress–strain path, Y2 and S2 correspond to the mean and the variance of the stress–strain path being compared, and S12 is the covariance between the two stress–strain paths. The steps in this method are the following:
1. Choose a threshold CCC value; that is, a maximum level of similarity between loading paths over all loading stages.
2. Extract the stress–strain loading paths at a given Gaussian (material/integration) point from all elements in an FE analysis.
3. Compare these stress–strain paths to the paths extracted from every other Gaussian point in the FE mesh and compute CCC values for each stress–strain component at all loading stage using Eq. (3).
4. Compute the average CCC value for all stress–strain components for a given point. The average CCC value indicates how similar each point's loading history is to the Gaussian point selected in step 2.
5. Remove all stress–strain loading paths corresponding to Gaussian points with CCC values above the chosen threshold from the NN training data set.
Choose a new Gaussian point, not excluded based on step 5, and repeat steps 3 through 5 until all possible points are checked.
4.8. Results
For each data reduction method, the ANN training data set is reduced to several different sizes. For each size of data removed, a new ANN model is trained with the reduced data. As with the original trained ANN model, each ANN model trained with reduced data (termed a reduced ANN model) is used in the original FE analysis of Hashash and Whittle (2002). The accuracy of the resulting ANN is evaluated qualitatively and visually by plotting the computed ANN response and quantitatively by applying MLa and CCC measures described in earlier sections. CCC and MLa values are calculated for each case, and plotted against the percentage of data removed. For CCC results, only the values of nonzero strain components and their corresponding stress components are plotted.
4.9. Reduction using the Gaussian point method
Figure 7 plots CCC and MLa values for the reduced ANN models. The CCC values decrease slightly as more data is removed, indicating that the Gaussian point method removes data evenly from the training data set. The MLa values also generally increase as data is removed.

The Gaussian point method CCC and MLa values versus the percentage of data removed.
Even with eight of the nine Gaussian points removed (89% data removal), the ANN response is still very good, indicating that a large portion of the ANN training data set is not necessary for training an accurate ANN model.
4.10. Reduction using the lattice method
Figure 8 plots CCC and MLa values for the reduced ANN models. CCC values start out relatively high, but drop to a local minimum around 40% data removal. The values then begin increasing and peak around 75% data removal. A similar trend is seen in MLa values, where they increase and peak in the 20–45% data removal range.

The lattice method CCC and MLa values versus the percentage of data removed.
The lattice method gives good results over a large range of data removal. However, there is a zone from 20 to 45% data removal where the CCC values drop dramatically and computed wall movements and surface settlements become very poor. This indicates that information necessary for learning the soil behavior is being removed. The authors are uncertain if this is a general characteristic of the lattice method or specific to the deep excavation simulation considered in this paper.
4.11. Reduction using the loading path method
Figure 9 plots CCC and MLa values for the reduced ANN models. CCC values start out relatively high, and values slowly and evenly decrease as more data is removed. This shows that both small- and large-strain points are being removed at the same rate, leading to a balanced data set. The MLa values remain relatively low throughout the data removal process, increasing slightly as data is removed. Overall, the CCC and MLa responses for the loading path method are excellent.

The path method CCC and MLa values versus the percentage of data removed.
Figure 10 shows several different responses for the 94% data removal case. Figure 10a shows wall movements, which match very closely with base wall movements. Figure 10b shows surface settlements, which are also very good. Figures 10c and 10d visualize the stress response. The response is very similar to the ANN model trained with the full data set; more points experience increases in vertical and horizontal stress than the target soil behavior. Still, the visualized responses are very similar to the target soil behavior.

Responses of the path method case of 94% data removal: (a) wall movements, (b) surface settlements, (c) normal stress visualization, and (d) shear stress visualization. [A color version of this figure can be viewed online at www.journals.cambridge.org]
4.12. Improvements in model training time
Figure 11 shows the variation in ANN model training time with amount of data removed. Data from all three data reduction methods is presented. In all cases, the time necessary to reduce the data set is negligible when compared to ANN model training time. The data in Figure 11 follow a linear trend; the slope of the best-fit line is proportional to percent of data removed. By the time 90+ percent of the data has been removed, training time has been reduced by a factor of 20. More importantly, as shown earlier, this drastic reduction in training time does not appreciably affect the response of the ANN material model in FE analysis.

The reduction in ANN model training time with the percentage of data removed.
5. APPLICATION TO TRIAXIAL TEST BEHAVIOR
The loading path method of data reduction is applied to a simulated isotropically consolidated undrained triaxial compression test (CIUTxC). A cylindrical FE model is constructed with a height and width of 8 and 4 cm, respectively. To ensure multiple stress–strain paths, both the loading base and loading cap are simulated as fully frictional. Figure 12 shows the simulated 3-D specimen and FE mesh. The soil specimen is simulated using the modified cam-clay constitutive model (Roscoe & Burland, 1968) with normally consolidated Boston blue clay properties. Figure 13 visualizes the response of the test in σ11′–σ22′ space (colored by σ12′), with each component normalized by the initial vertical effective stress. The data consists of 2816 data sets per step and a total of 42,240 points (15 steps).

The CIUTxC test (a) set-up with loading conditions and (b) top view of the test FE mesh and cross section.

Visualization of Gaussian point stress values from the CIUTxC test in σ11′–σ22′ space. [A color version of this figure can be viewed online at www.journals.cambridge.org]
5.1. Soil behavior without data reduction
Stress–strain paths are extracted from the CIUTxC FE mesh and used to train an ANN model. ANN model training time was 2.6 h on a 1.7-GHz desktop computer; the model was considered fully trained after 5000 iterations. Figure 14a and b compare the boundary deformations for the target soil behavior and learned soil behavior. Each figure plots lateral displacements versus specimen height in the cross-sections identified in Figure 12b. In each plot, the learned behavior matches the target behavior very closely. As shown in Figure 14c, the MLa values for Section X–X and Section Y–Y are 0.10 and 0.046 mm, respectively.

Responses of the ANN model trained with full triaxial test data: (a) displacements in section X–X (Fig. 12b), (b) displacements in section Y–Y (Fig. 12b), (c) a table of CCC and MLa values, and (d) visualization of stress behavior. [A color version of this figure can be viewed online at www.journals.cambridge.org]
Figure 14d presents a visualization of the learned stress response. Compared to Figure 13, the two responses are virtually identical. This similarity is reflected in the CCC values presented in Figure 14c. The average strain CCC value is 0.988, while the average stress CCC value is 0.978.
5.2. Data reduction with the loading path method
The data set used to train the CIUTxC ANN model is reduced using the loading path method to 6% of its original size. This reduced data set is then used to train an ANN model; training takes 0.2 h on a 1.7-GHz desktop computer; the model was considered fully trained after 5000 iterations. Figure 15a and b again plots boundary deformations for the target and learned soil behavior, and again, the values match very closely. As specified in Figure 15c, the MLa values for Section X–X and Section Y–Y are 0.12 and 0.067 mm, respectively.

Responses of the ANN model trained with triaxial test data reduced by 94% with the path method: (a) displacements in section X–X (Fig. 12b), (b) displacements in section Y–Y (Fig. 12b), (c) a table of CCC and MLa values, and (d) visualization of stress behavior. [A color version of this figure can be viewed online at www.journals.cambridge.org]
Figure 15d visualizes the learned stress response. Compared to Figure 13, the two responses are virtually identical. This similarity is reflected in the CCC values presented in Figure 15c. The average strain CCC value is 0.979, while the average stress CCC value is 0.976.
6. DISCUSSION AND CONCLUSIONS
This paper presents methods for optimizing the process in which ANN soil models learn soil behavior. These methods selectively reduce the size of the ANN model training data set. Reducing the data set size drastically reduces ANN model training time without adversely affecting the learned soil behavior.
The Gaussian point method for data reduction is very simple to implement, yet it is linked to the geometry of the FE model used to generate the training data set. The lattice method is more complicated to implement and does not evenly remove the training data. Because this method focuses only on the last stage of the FE model, it causes some biasing of the data. The loading path method is less complicated to implement than the lattice method, but more complicated than the Gaussian point method. However, unlike the Gaussian point method, it does not rely on the FE geometry. Also, it considers all stages of the FE analysis, unlike the lattice method. All three data reduction methods give good results, but the loading path method is the most robust of the three, and is therefore recommended for use in reducing ANN model training data sets.
The loading path method is not limited to FE models of a braced excavation. It is applied to a model of an isotropically consolidated undrained triaxial compression test, with very good results. This indicates that the loading path method is applicable to a wide range of ANN model training data sets.
By using the data reduction methods presented in this paper, ANN soil models can learn soil behavior more quickly and more efficiently, allowing them to be more easily used in engineering research, and eventually in engineering practice.
ACKNOWLEDGMENTS
This material is based on work supported in part by the National Science Foundation under PECASE Award Grant CMS 99-84125, and Grant CMS 02-19123 under Program Director Dr. R. Fragasz and a National Center for Supercomputing Application NCSA 2000 Faculty Fellowship. Any opinions, findings, and conclusions or recommendations expressed in this material are those of the authors and do not necessarily reflect the views of the National Science Foundation. The authors also acknowledge David Groholski, Camilo Marulanda, and Qingwei Fu for their assistance with the FE analyses and continued critiquing of the ideas in this paper.


