


Introduction
In the age of web 2.0, plenty of e-commerce platforms have gained popularity and become the main channels for consumers to share their experiences and views about products. This contributes to a sheer volume of unbiased, widely accessible user-generated content (UGC). Customers’ preferences, user experiences, and habits are very valuable information contained in UGC that both reflect customers’ attitudes and reveal the reasons behind them. Also, most platforms only allow validated purchasers to make comments, which ensures the credibility. Therefore, exploiting UGC has been a very efficient and reliable way of customer hearing. Many researchers have paid attention to this application in recent years (Zhu et al., Reference Zhu, Wang, Zhu, Tsou and Ma2011; Eirinaki et al., Reference Eirinaki, Pisal and Singh2012; Serrano-Guerrero et al., Reference Serrano-Guerrero, Olivas, Romero and Herrera-Viedma2015; Balazs and Velasquez, Reference Balazs and Velasquez2016; Hou et al., Reference Hou, Yannou, Leroy and Poirson2019; Zhang et al., Reference Zhang, Chu and Xue2019), and sentiment analysis is recognized as a powerful tool (Bagheri et al., Reference Bagheri, Saraee and de Jong2013; Wang and Wang, Reference Wang and Wang2014; Poria et al., Reference Poria, Chaturvedi, Cambria and Bisio2016b; Mirtalaie et al., Reference Mirtalaie, Hussain, Chang and Hussain2018, Reference Mirtalaie, Hussain, Chang and Hussain2019). Coarse-grained sentiment analysis detects sentiments toward a subject as a whole. Fine-grained sentiment analysis detects sentiments toward various aspects of a subject and is more suitable for product redesign as different aspects about the product need to be analyzed individually. The exploitation of UGC is a domain-specific sentiment analysis task, and domain-specific knowledges can be relied on to improve performance. In recent years, UGC-based customer hearing with sentiment analysis has been a new trend for product redesign. After sentiment analysis, the extracted customer preferences are useful in various ways, including comparing competitive products and ranking products aspects by importance for redesign (Ali et al., Reference Ali, Kwak and Kim2016; Wang et al., Reference Wang, Wang and Song2017a).
To extract customer preferences, fine-grained sentiment analysis typically involves feature identification and sentiment estimation tasks (Bo and Lee, Reference Bo and Lee2008; Ravi and Ravi, Reference Ravi and Ravi2015). Features refer to the aspects that customers concern about the product. For example, for smartphone, features include components like “battery”, functions like “call”, performances like “lifespan”, etc. Fine-grained sentiment analysis of UGC is usually conducted with machine learning-based methods or rule-based methods. The former approaches mostly use statistical language models, like conditional random fields (CRFs) (Zhang et al., Reference Zhang, Xie, Yang, Sun, Liu and Choudhary2014; Wang et al., Reference Wang, Xin, Wang, Huang and Liu2017b), neural networks (Poria et al., Reference Poria, Cambria and Gelbukh2016a), to extract semantic information from a corpus of texts. Rule-based approaches often employ semantic rules and lexicons with expert knowledges.
To utilize extracted customer preferences for product redesign, different mechanisms have been proposed, such as comparing product alternatives, ranking them by satisfaction, and finding weakness features (Guen and Juyoung, Reference Guen and Juyoung2018; Cali and Balaman, Reference Cali and Balaman2019; Wu and Zhang, Reference Wu and Zhang2019; Zhang et al., Reference Zhang, Chu and Xue2019). Besides statistical customer preferences extracted by sentiment analysis, product redesign can be supported by other information from UGC. Customers’ experiences may reveal the reasons behind their attitudes. Their using habits and conditions can help designers understand them better. To exploit such information, some studies propose representative feedbacks selection mechanisms (Jin et al., Reference Jin, Ji and Gu2016). However, a major challenge is that most studies rely on high-performance sentiment analysis for further design decision making. Due to the vagueness and complexity of language, state-of-the-art sentiment analysis is not accurate enough, which makes it less applicable in engineering practice (Chen et al., Reference Chen, Xu, He and Wang2017; Sun et al., Reference Sun, Niu, Yao and Yan2019). Recent machine learning models like deep neural networks show promising results on big datasets, but text labeling is still burdensome for efficient product redesign purpose. This paper focuses on tackling this challenge, by combining enhanced sentiment analysis with coordinated product redesign mechanisms. An integrated customer hearing and product redesign system is proposed. Major contributions to the system are listed below:
• To promote sentiment analysis accuracy with no extra labeling work, the system implements semi-supervised extraction of domain knowledges from unlabeled texts and pros/cons labeled texts.
• After constructing a fuzzy product ontology of domain knowledges, a novel ontology-based fine-grained sentiment analysis approach is employed to exploit UGC.
• Extracted customer preference statistics are used to automatically establish opportunity landscapes and house of quality (HOQ) table for redesign strategy elicitation.
• Interactive visualization of customer preference statistics and representative feedbacks selection are combined to exploit various types of information from UGC, including preferences, user experiences, using habits and conditions, etc.
The rest of the paper is organized as follows. In the section “Related work”, related works of fine-grained sentiment analysis and product design based on customer hearing are reviewed. In the section “Integrated customer hearing and product redesign system”, the proposed integrated customer hearing and product redesign system is illustrated in detail, with examples carried on through subsections to make the procedures easily understandable. In the section “System evaluation”, a case study of smartphone is conducted to evaluate the proposed system. In the section “Conclusions and future work”, conclusions of this study, business implications, and expectations for future work are given.
Related work
In this section, related literatures are reviewed. Studies of fine-grained sentiment analysis for customer hearing are reviewed in the section “Fine-grained sentiment analysis”. Studies of product design based on customer hearing are reviewed in the section “Product design based on customer hearing”.
Fine-grained sentiment analysis
Prior studies of fine-grained sentiment analysis usually employ two types of approaches: machine learning based and rule based. Machine learning-based approaches often treat the task as a multi-class classification problem and solve it with statistical language models like CRFs (Zhang et al., Reference Zhang, Xie, Yang, Sun, Liu and Choudhary2014; Wang et al., Reference Wang, Xin, Wang, Huang and Liu2017b), neural networks (Poria et al., Reference Poria, Cambria and Gelbukh2016a), and deep learning models (Chen et al., Reference Chen, Xu, He and Wang2017). Generally, the more complex and powerful statistical models are, the greater amount of training data is needed. Commonly used public datasets for fine-grained sentiment analysis, such as SemEval, are not up to date for product design decision making. They also contain very limited product categories. Therefore, many other studies use rule-based approaches for fine-grained sentiment analysis with UGC.
Rule-based approaches often conduct feature identification and sentiment estimation tasks with respective semantic rules (Jin et al., Reference Jin, Liu, Ji and Kwong2019). The sentiment estimation task usually calculates continuous scores to denote sentiment orientations, that is, positive or negative, and the magnitudes of orientations. For example, Hu and Liu (Reference Hu and Liu2004) proposed a set of rule-based techniques for stepwise feature identification, noise elimination, and sentiment estimation. Inspired by their work, many studies conduct feature identification by first identifying candidate ones, and then filtering. Lexicons like WordNet are often employed in procedures. For example, Alrababah et al. (Reference Alrababah, Gan and Tan2017) first identify explicit opinionated features using WordNet (Miller, Reference Miller1995; Thelwall et al., Reference Thelwall, Buckley, Paltoglou, Cai and Kappas2010) and sentiment strength estimator SentiStrength, then remove irrelevant ones according to frequency and semantic knowledge. Liu et al. (Reference Liu, Tang and Shan2018) first select candidate feature-sentiment pairs by dependency syntax analysis, then filter them using pointwise mutual information (PMI; Church and Hanks, Reference Church and Hanks1990) with a weighted hyperlink-induced topic search (HITS) algorithm. After feature identification, sentiment estimation can be carried out with sentiment lexicons, like SentiStrength and SentiWordNet (Baccianella et al., Reference Baccianella, Esuli and Sebastiani2010). To alleviate burden of rule selecting and finetuning for rule-based sentiment analysis, Liu et al. (Reference Liu, Gao, Liu and Zhang2015) proposed a greedy algorithm and simulated annealing, respectively, to select rules of grammar dependency relations for feature identification. Their approach outperforms the baseline CRF-based method.
Some studies try to make the use of different techniques or fuse different knowledge sources. For example, Wu et al. (Reference Wu, Huang and Yuan2017) fused four types of resources into their machine learning model: lexicons, multi-domain knowledges, unlabeled data, and labeled data in a target domain. Lexicons account for generic sentiments, such as “great” and “worse”. Multi-domain knowledges are fused for the target domain, as similar sentiment patterns are shared among similar domains. For example, “quick” and “durable” are shared between the digital camera and smartphone domains. Unlabeled texts are used to extract relational information. Their work achieves high accuracy while using limited labeled data in the target domain. As shown by the studies, fusing knowledges is a very useful technique. As an efficient way of knowledge representation and reuse, domain ontology is used by many related studies (Gruber, Reference Gruber1993; Studer et al., Reference Studer, Benjamins and Fensel1998; Penalver-Martinez et al., Reference Penalver-Martinez, Garcia-Sanchez, Valencia-Garcia, Angel Rodriguez-Garcia, Moreno, Fraga and Luis Sanchez-Cervantes2014; del Pilar Salas-Zarate et al., Reference del Pilar Salas-Zarate, Valencia-Garcia, Ruiz-Martinez and Colomo-Palacios2017). Lau et al. (Reference Lau, Song, Li, Cheung and Hao2009) designed and constructed a fuzzy product ontology to store domain knowledges for product development. Lau et al. (Reference Lau, Li and Liao2014) further proposed to construct the fuzzy product ontology with a learning algorithm. From unlabeled texts in the target domain, product features are learned by Latent Dirichlet Allocation (LDA)-based topic modeling, and taxonomic relations of features are estimated with probabilistic methods. From pros/cons labeled product reviews, non-taxonomic relations between sentiments and product features are learned. They achieve promising sentiment analysis results using the fuzzy product ontology. Ali et al. (Reference Ali, Kwak and Kim2016) used a similar fuzzy domain ontology for sentiment estimation.
A lot of studies, both rule-based and machine learning-based methods, find that reusable expert knowledges are very promising resource to enhance sentiment analysis, especially the structured high-quality expert knowledges. They are usually devised manually by experts, like in many rule-based methods, or extracted from unstructured data by statistical models, then manually revised by experts, like in the method by Wu et al. (Reference Wu, Huang and Yuan2017) and many ontology learning methods. Inspired by prior works, this paper fuses the fuzzy product ontology, lexicons, and semantic rules in procedures to enhance sentiment analysis in a low-cost way.
Product design based on customer hearing
Customer hearing with sentiment analysis can be utilized to support product design strategies in various ways. With statistical customer preferences, product alternatives can be investigated, compared, and ranked by scores. For example, Guen and Juyoung (Reference Guen and Juyoung2018) analyzed online comments to compare two cosmetic products. Some studies integrate sentiment analysis with multi-criteria decision making to rank product alternatives (Cali and Balaman, Reference Cali and Balaman2019; Wu and Zhang, Reference Wu and Zhang2019). Customers’ preferences toward product features can be used to find weakness parts. For example, Mirtalaie et al. (Reference Mirtalaie, Hussain, Chang and Hussain2018) analyzed customer reviews to determine product features’ popularity. In another paper (Mirtalaie et al., Reference Mirtalaie, Hussain, Chang and Hussain2019), they aggregate sentiment analysis results using a product ontology to help designers investigate product weaknesses thoroughly. Zhang et al. (Reference Zhang, Chu and Xue2019) also find product weaknesses with online reviews using a structured preference model. They further select to-be-improved features by considering engineering cost, redesign lead time, and technical risk. Some studies integrate sentiment analysis with analytical tools like the KANO model for product strategies (Zhang et al., Reference Zhang, Chen and Lu2018; Li and Li, Reference Li and Li2019).
In addition to customers preference statistics, some studies exploit information like using conditions and user experiences. Yang et al. (Reference Yang, Liu, Liang and Tang2019) considered user experience information as a combination of facets: usage condition, related product features, and user satisfaction. For example, for smartphone, “large screen” can be a related product feature, “in the IT business” can be usage condition, “positive feeling” can be user satisfaction. They extract elements of different facets from texts and aggregate them. Then, a directed acyclic graph (DAG)-based network is formed to explore relations among the elements, such as how product features and conditions jointly influence customer feelings. Hou et al. (Reference Hou, Yannou, Leroy and Poirson2019) also proposed a summarization model of multiple user preference aspects about product, including emotions and using conditions, to facilitate the inter-agreement of annotation for related datasets.
For product opportunity mining, Ko et al. (Reference Ko, Jeong, Choi and Yoon2018) employed topic modeling to identify product topics and construct a keygraph based on topics co-occurrences. Chance discovery theory is applied to find opportunities from the keygraph. Jeong et al. (Reference Jeong, Yoon and Lee2019) established the opportunity landscape with sentiment analysis on social media data, to identify opportunity levels and improvement directions of product topics. Opportunity landscape organizes factors, that is, product topics in a map according to their importance and satisfaction scores. Their work inspires other studies concerning the opportunity landscape, as well as this paper. Choi et al. (Reference Choi, Oh, Yoon, Lee and Coh2020) applied event detection and tracking (EDT), sentiment analysis, and establish opportunity landscapes to find time-evolving product opportunities. These studies reveal the promising application of customer hearing in product design.
Depending on the application scenario, different mechanisms should be applied. Also, although most studies rely on sentiment analysis results for further application, proper mechanisms can help reduce the effect of inaccurate results. For instance, many decision-making methods can handle fuzziness to some extent. Representative feedback selection can also compensate for some errors. Therefore, to support product redesign strategy while tackling the defect of immature sentiment analysis, the proposed system employs well-developed design decision-making tools, that is, the opportunity landscape map and the HOQ table with sentiment analysis results. The system also combines the interactive visualization of customer preference statistics and representative feedbacks selection. Statistics are visualized by designers at multilevels while representative feedbacks can be generated in this interactive process. These mechanisms are devised to supplement each other to exploit various types of information from UGC.
Integrated customer hearing and product redesign system
The overall framework of the proposed integrated customer hearing and product redesign system is shown in Figure 1. The system comprises three modules: fuzzy product ontology construction, sentiment analysis, and product redesign modules. A pool of unlabeled texts is used to extract taxonomic relations of product features and form the fuzzy product ontology hierarchy. A pool of pros/cons labeled comments is used to extract non-taxonomic relations between product features and context-specific sentiments. These extracted domain knowledges are stored in fuzzy product ontology and are useful for both sentiment analysis and product redesign modules. For the target UGC collected on the internet, after text-preprocessing, fine-grained sentiment analysis is applied which consists of feature-sentiment pair identification and sentiment orientation calculation tasks. Extracted customer preference statistics are in a uniform structure. In the product redesign module, customer requirement parameters (CRPs) are first summarized from fuzzy product ontology. Then, opportunity landscapes and HOQ table are established based on statistics and CRPs. Statistics visualization and representative feedbacks selection are conducted in an interactive and concurrent way. The three modules are illustrated in respective subsections.

Fig. 1. Overall framework of the integrated customer hearing and product redesign system.
Fuzzy product ontology construction
Fuzzy product ontology introduction
The structure of fuzzy product ontology proposed by Lau et al. (Reference Lau, Li and Liao2014) is adopted in this paper. An ontology is typically a hierarchical structure of concepts and relations, concepts as the nodes and relations as the links. Fuzzy product ontology has product features and context-sensitive sentiments as concepts. Taxonomic relations of product features form the hierarchy, putting subsumed features in the lower levels. For example, product feature “hardware” subsumes “camera”, which further subsumes “lens”. Then, “hardware” is in the highest level, while “lens” is in the lowest level among these three, as shown in Figure 2. Taxonomic relations described by fuzzy membership functions can suit the conditions where product features are not strictly taxonomic. For example, “camera” is also subsumed to “quality” to some extent and less subsumed to “security”. To reflect such relationships, the fuzzy scores of taxonomic relations connecting “camera” to “hardware” and “quality” are set higher than the fuzzy score of relation connecting “camera” to “security”.

Fig. 2. Example of the fuzzy product ontology.
Context-sensitive sentiments are connected to product features by non-taxonomic relations. Context-sensitive sentiments are those terms that carry different sentiment orientations in different contexts. For example, in the two sentences below, the term “high” carries positive orientation in the first sentence and negative orientation in the second sentence.
• This phone is extremely high quality.
• Battery consumption pretty high.
This example can be handled by two non-taxonomic relations: (“quality”, “high”) with a positive score and (“batter consumption”, “high”) with a negative score. The scores are in range [−1, 1]. An example of fuzzy product ontology is shown in Figure 2.
Fuzzy product ontology can enhance sentiment analysis in multiple ways. The terms contained can be used as domain lexicon in ontology-based sentiment analysis. The taxonomic relations are useful to analyze customer preference statistics, because product features at higher levels should be evaluated not only by customers’ judgments toward them but also by judgments toward their subsumed features. Low-level product features’ performances can contribute to different high-level features, by aggregating preference statistics of them with fuzzy scores to high level ones through the hierarchy. Context-sensitive sentiments can improve sentiment analysis accuracy, because for many domain-specific sentiment terms, contexts need to be considered to estimate correct orientations.
Taxonomic relations learning
Product features and their taxonomic relations are learned from unlabeled texts in the following steps. Generally, candidate features are first extracted, then methods by Sun et al. (Reference Sun, Niu, Yao and Yan2019) are improved to filter them to obtain final product features. Taxonomic relations are learned by the subsumption-based approach.
Step 1: Text-preprocessing
As collected texts may include repeated content, spelling mistakes, emoticons, etc., preprocessing them for candidate features extraction is necessary. Texts are made into lowercase and tokenized into sentences. Each word is checked with lexicon WordNet to remove mistake words and emoticons. Stop words that are irrelevant to the product domain are also removed. Part of speech (POS) tagging and stemming are conducted with NLTK package.Footnote 1
Step 2: Candidate features extraction
Features are the informative factors about product that people usually comment on. Therefore, they tend to be mentioned more frequently in texts in the target domain. Also, people usually express opinions or judgments about features with a descriptive part of speech. Descriptive parts and described subjects are usually near in texts. According to above patterns, candidate features should be extracted as high-frequency terms and appearing near a descriptive part of speech. As indicated by linguistics and prior works, adjectives and adverbs are mostly descriptive parts of speech about the subjects. Nouns and verbs mostly demonstrate the subjects or subjects’ behavior. In this paper, nouns and verbs that have high frequency and appear near adjectives or adverbs are extracted as candidate features.
For example, in a sentence “excellent picture and sound quality”, “picture” and “quality” are tagged as nouns, and they demonstrate the product features as subjects. The “excellent” and “sound” are tagged as adjectives, and they describe product features, respectively. In a sentence “but it did not work at all abroad”, “work” is tagged as a verb which demonstrates a behavior or function facet of the product. The “abroad” is tagged as an adverb which describes the function. From the two sentences, “picture” and “quality” are identified as candidate features. Considering common usages, the empirical practice to identify entities by POS is effective for a large corpus of texts.
Two words are nearby if their skip distance is less than W words. W is determined according to linguistics. Frequency threshold value α is applied to retain a limited number of terms, because the number of product features in the target domain is limited, despite the size of dataset. The number of terms retained by α should be set larger for larger dataset, due to more redundant terms involved. It is important to note that some feature terms may have low frequency and are not retained in this step. However, this does not impact the extraction quality, because low frequency of being discussed by customers indicates low importance to customer satisfaction. Setting a threshold is an efficient empirical practice. Also, some low-frequency feature terms have synonyms that are more frequently used and are retained instead. For example, some people use “pics”, “pic”, and “photograph” for “picture”. The extracted term “picture” can handle its synonyms in sentiment analysis, therefore low-frequency synonyms are redundant.
Step 3: Filtering by similarity measure to seed words
Candidate features can involve redundant terms that are semantically irrelevant to the product. Seed words are typical product features given by experts manually. They are precise but very limited. Candidate features that are semantically similar to seed words are retained to filter out those redundant terms. For the example in Step 2, the candidate feature “picture” can be retained by a seed word “image”. “image” can also retain terms “photo”, “graphics”, etc.
Lin-similarity of WordNet is used to measure semantic similarity. WordNet is a lexicon that organizes word senses by taxonomy. Lin-similarity is based on the structure of WordNet and information content (IC). The Lin-similarity score of two senses syn1 and syn2 is computed in Eq. (1).
 $${\rm Lin}( {\rm sy}{\rm n}_1, \;{\rm sy}{\rm n}_2) = \displaystyle{{2\ast {\rm IC}( {\rm lcs}) } \over {{\rm IC}( {\rm sy}{\rm n}_1) + {\rm IC}( {\rm sy}{\rm n}_2) }}$$
where IC( ⋅ ) is the information content of the input node in WordNet, lcs denotes the least common subsumer (most specific ancestor node) of syn1 and syn2.
Similarity measure for candidate feature f and seed words SW is given below. Similarity measure threshold β is applied to filter candidate features.
 $${\rm Sim}( f, \;{\rm SW}) = \mathop {\max }\limits_{t = 1, 2\ldots n} ( {{\rm Sim}( f, \;{\rm s}{\rm w}_t) } ) $$
 $${\rm SW} = { {\rm s}{\rm w}_1, \;{\rm s}{\rm w}_2, \;\ldots {\rm s}{\rm w}_n} $$
 $${\rm Sim}( f, \;{\rm s}{\rm w}_t) = \mathop {\max }\limits_{\scriptstyle i\in {\rm synsets}( f) \atop \scriptstyle j\in {\rm synsets}( {\rm s}{\rm w}_t)} ( {{\rm Lin}( i, \;j) } ) $$
where swt is a seed word, synsets( ⋅ ) returns the word senses of an input term. In WordNet, a word can correspond to several word senses. The max function makes a similarity measure of f and swt be the maximum possible Lin-similarity score between word senses of them, to retain any possible semantically similar words to seed words.
Step 4: Filtering by lemmas
After Step 3, retained candidate features may include groups of synonyms, as indicated by the example of “image” in Step 3. To filter out redundant ones, lemmas in WordNet are utilized. Lemmas are different words that correspond to the same word sense in WordNet. If a candidate feature's every word sense is expressed by other candidate features, then it is redundant. For the example in Step 3, among the retained candidate features “photo”, “graphics”, and “picture”, “photo” has the only word sense that refers to a representation of scene or person recorded by a camera. This sense is also expressed by “picture”, thus “photo” is redundant. Candidate feature f is determined redundant if it satisfies the condition in Eq. (5).
 $$\forall {\rm syn}\in {\rm synsets}( f) , \;{\rm lemma}\_{\rm names}( {\rm syn}) \cap {\rm SW}\ne \emptyset $$
where  ${\rm lemma}\_{\rm names}( {\cdot} )$ returns the lemmas of input word sense.
After the above filtering steps, extracted product features are the words, denoted as SF.
Step 5: Phrase learning
Phrases are usually domain-specific, such as “dual sim”, “sim card”, and “image resolution”, and are important domain knowledges. Phrase learning is carried out with preprocessed data after Step 1, because words within the phrases may have been filtered out in the above filtering steps, such as “dual” and “sim”.
Candidate sequences of words are generated randomly from preprocessed texts. Then, their probabilities are estimated and filtered to become learned phrases. A candidate sequence p = [word1, …wordd] is learned as a phrase if the condition in Eq. (6) is satisfied.
 $$m_p \ge 3 \quad {\rm and\ } \quad \displaystyle{{n_p} \over {m_p}} > a$$
where m p is the number of sentences that contain every word in p, n p is the number of sentences that contain p precisely, and a is a hyper-parameter.
As in Eq. (6), a sequence's frequency in sentences can be directly used to estimate its probability. This is because the maximum sequence length d is small, often set 2 or 3 in practice, and a short sequence can have numerous occurrences. Learned phrases are denoted as PF. Extracted product features  $F = {\rm SF}\cup {\rm PF}$. In addition, some jargons are not standard words but are domain-specific abbreviations. For example, “OS” for “operating system” and “UI” for “user interface”. These are limited and easy to enumerate. The jargons are added manually.
Step 6: Hierarchy learning
A subsumption-based approach (Anoop et al., Reference Anoop, Asharaf and Deepak2016) is employed to learn taxonomic relations of product features, to form the hierarchy of fuzzy product ontology, as the example shown in Figure 2. For two product features f 1 and f 2, their taxonomic relation is learned as in Eq. (7).
 $${\rm if\ }\left\{{\matrix{ {\displaystyle{{n_{\,f_1}} \over {n_{\,f_1, f_2}}} > \gamma , \;{\rm then}\,f_1\,{\rm subsumes}\,f_2} \cr {\displaystyle{{n_{\,f_2}} \over {n_{\,f_1, f_2}}} > \gamma , \;{\rm then}\,f_2\,{\rm subsumes}\,f_1} \cr } } \right.$$
where  $n_{f_1}$ is the number of sentences that contain f 1,
  $n_{f_2}$ is the number of sentences that contain f 2,
  $n_{f_1, f_2}$ is the number of sentences that contain both f 1 and f 2, and γ is the threshold value.
Learned taxonomic relations are denoted H, as in Eq. (8).
 $$H = { {( {\,f_i, \;f_j} ) \colon s_{( f_i, f_j) }} } = { {( {\,f_i, \;f_j} ) \colon {{n_{\,f_i}} / {n_{\,f_i, f_j}}}} } $$
where f i subsumes f j and  $s_{( f_i, f_j) }$ is the fuzzy score of this taxonomic relation.
Non-taxonomic relations learning
Non-taxonomic relations between features and sentiments are learned from pros/cons labeled comments. Those data can be collected from some commercial websites, like newegg.com, where customers are guided to make pros comments and cons comments in separate areas. An example of the pros/cons labeled comment is shown in Figure 3. Feature-sentiment relations are identified and filtered based on the extracted product feature terms in the section “Taxonomic relations learning” and mutual information. Their orientation scores are estimated with relative occurrences in pros/cons labeled comments.

Fig. 3. An example of the pros/cons labeled comment.
Step 1: Feature-sentiment relations identification
Product features are identified by the extracted product feature terms in the section “Taxonomic relations learning”. Related sentiments are identified around features within the sentences, with the following rules:
• Adjectives and adverbs are considered as sentiments.
• Related sentiments should be nearer to the features than other sentiments.
• Related sentiments tend to appear ahead of the features.
• Only one sentiment should be identified for one feature.
The above rules are illustrated by the same example in taxonomic relations learning steps. For “excellent picture and sound quality” as a pros comment, “picture” and “quality” are identified product features. The sentiment “excellent” and “sound” satisfy the first three rules. “picture” and “sound” are also near, but “sound” should only be related to “quality”. This can be ensured by the fourth rule. Therefore, two relations can be correctly identified: “excellent” related to “picture” and “sound” related to “quality”.
Based on the above rules, a preference order is applied to identify the sentiment, as shown in Figure 4. Words around the feature are checked in this preference order, and the first identified adjective or adverb is the related sentiment to the feature. Identified feature-sentiment relation is denoted as (f i, s i).

Fig. 4. Preference order to identify related sentiment to the feature.
Step 2: Feature-sentiment relations filtering
In the identified feature-sentiment relations in Step 1, sentiments may be semantically irrelevant to the features. Such relations need to be filtered, by computing their association strengths, that is, the strength that the sentiment term is associated with the feature term. Using the example in Step 1, if “very excellent picture and sound quality” is given, “picture” and “very” are identified as a relation. “very” is commonly used and not strongly associated with “picture”, thus their association strength is low. Balanced mutual information (BMI) developed by Lau et al. (Reference Lau, Song, Li, Cheung and Hao2009) is utilized for this purpose. Based on mutual information (Church and Hanks, Reference Church and Hanks1990), BMI estimates the association strength of terms by considering both the term presence and term absence situations. The association strength of feature-sentiment relation (f i, s i) is computed in Eq. (9).
 $$\eqalign{{\rm Asso}( f_i, \;s_i) & = {\rm BMI}( f_i, \;s_i) , \;\cr & = w_{\rm asso} \times [ \Pr ( f_i, \;s_i) \log _2\displaystyle{{\Pr ( f_i, \;s_i) + 1} \over {\Pr ( f_i) \Pr ( s_i) }} \cr & \quad + \Pr ( \neg f_i, \;\neg s_i) \log _2\displaystyle{{\Pr ( \neg f_i, \;\neg s_i) + 1} \over {\Pr ( \neg f_i) \Pr ( \neg s_i) }}] \cr & \quad -( 1-w_{\rm asso}) \times [ \Pr ( f_i, \;\neg s_i) \log _2\displaystyle{{\Pr ( f_i, \;\neg s_i) + 1} \over {\Pr ( f_i) \Pr ( \neg s_i) }} \cr & \quad + \Pr ( \neg f_i, \;s_i) \log _2\displaystyle{{\Pr ( \neg f_i, \;s_i) + 1} \over {\Pr ( \neg f_i) \Pr ( s_i) }}] } $$
where w asso is a weight value,  $\Pr ( f_i, \;s_i)$ is the probability of f i presence and s i presence in a text window,
  $\Pr ( \neg f_i, \;s_i)$ is the probability of s i presence and f i absence in a text window.
  $\Pr ( {\cdot} )$ is the probability of input term presence in a text window.
The weight factor w asso determines the relative importance of presence and absence situations. The text window is defined the whole sentence in this paper. Probability is estimated as the fraction of the number of sentences that satisfy the corresponding condition to the total number of sentences. The threshold value λ is applied to retain feature-sentiment relations with high association strengths.
Step 3: Orientation scores estimation
Basically, feature-sentiment relations that usually occur in pros comments have positive orientation scores and vice versa. For example, the comment “sound quality” with very positive orientation is rarely found in cons areas. Therefore, the orientation scores of feature-sentiment relations are estimated by their relative occurrences in pros or cons labeled comments. The orientation score o i is computed for feature-sentiment relation (f i, s i) in Eq. (10).
 $$o_i = \displaystyle{{P( f_i, \;s_i) -N( f_i, \;s_i) } \over {\max { {P( f_i, \;s_i) , \;N( f_i, \;s_i) } } }}$$
where P(f i, s i) is the number of pros labeled sentences where (f i, s i) appears, N(f i, s i) is the number of cons labeled sentences where (f i, s i) appears.
Orientation scores are in range [−1, 1]. Non-taxonomic relations with orientation scores are denoted as R = {(f i, s i):o i}.
Taxonomic relations of product features, and non-taxonomic relations between product features and context-sensitive sentiments are the extracted domain knowledges, represented as  $H = { {( {f_i, \;f_j} ) \colon s_{( f_i, f_j) }} }$ and R = {(f i, s i):o i}, respectively.
Sentiment analysis
A novel ontology-based fine-grained sentiment analysis approach is employed to exploit UGC in this paper. To achieve low cost and reliable customer hearing for product redesign strategy, domain knowledges in fuzzy product ontology, general lexicons, and semantic rules are fused to enhance sentiment analysis. After the construction of fuzzy product ontology, no extra labeling work or structured data are required. The results of sentiment analysis are customer preference statistics toward various product features, organized in the form of feature-sentiment pairs with calculated orientations. Each feature-sentiment pair represents a judgment to the product feature made by a customer. To differentiate the feature-sentiment pairs from feature-sentiment relations in fuzzy product ontology construction, the former is sentiment analysis results of target UGC, while the latter is non-taxonomic relations as domain knowledges utilized in sentiment analysis.
Accordingly, sentiment analysis procedure involves stepwise text-preprocessing, feature-sentiment pairs identification, and sentiment orientations calculation. Text-preprocessing steps before sentiment analysis are the same as those steps in fuzzy product ontology construction, except that frequency threshold value α is set lower, because target UGC dataset is much smaller than the unlabeled texts dataset used in taxonomic relations learning.
In feature-sentiment pairs identification task, adjectives and adverbs are taken as sentiments. To identify paired features, both explicit and implicit features are considered. Explicit features are the nouns or verbs appearing within neighborhood of sentiments. Implicit features do not appear but can be inferred from specific sentiments. For example, in a sentence “really fast”, implicit feature “speed” can be inferred from sentiment “fast”. Implicit features are inferred by default feature-sentiment relations, denoted as D = {(dfi, dsi):doi}, such as (“speed”, “fast”): +1. Default feature-sentiment relations supplement the non-taxonomic relations R = {(f i, s i):o i} in fuzzy product ontology.
In the orientations calculation task, non-taxonomic relations R, default feature-sentiment relations D, as well as sentiment lexicon SentiWordNet are fused with rules. Calculated orientations are finally reversed by negation expressions, such as “not” and “barely”, detected within neighborhoods. The flowchart of the ontology-based fine-grained sentiment analysis approach is shown in Figure 5.

Fig. 5. Flowchart of the ontology-based fine-grained sentiment analysis approach.
Feature-sentiment pairs identification
Sentiments are adverbs or adjectives, and the neighborhood of sentiment is defined by the maximum skip distance of words. Explicit features are identified within the neighborhood of sentiments, using product features terms in fuzzy product ontology. If explicit feature-sentiment pairs cannot have their orientations calculated, as explained in the section “Sentiment orientations calculation”, the explicit feature is skipped. If no explicit feature is identified within the neighborhood, implicit features can be inferred from default feature-sentiment relations. This is put in the last order because default relations are predetermined and may interfere with explicit features.
During the identification of explicit features, the following principles need to be obeyed. Firstly, phrases should be prioritized, because they are more informative than single words contained. The terms nearer to the sentiment should also be prioritized, because more relevant contents tend to be nearer by linguistics. For the same reason, explicit features should be nearer to their paired sentiments than to other sentiments. Finally, the terms that refer to more detailed concepts should be prioritized, because they are more useful for product redesign.
To explain the above principles, three examples are given below.
• The camera quality of this smartphone is good except dirty lens when i received.
• It is really fast considering the price.
• Battery drops fast.
In the first example, “good” and “dirty” are tagged as adjectives in preprocessing and are treated as sentiments. If the maximum skip distance is set 6, then “camera quality”, “camera”, “quality”, “smartphone”, and “lens” are within the neighborhood of “good”. “smartphone” and “lens” are within the neighborhood of “dirty”. “smartphone” is a more general concept than other features. “lens” is not paired with “good”, because it is nearer to sentiment “dirty”. As phrases are prioritized, the explicit feature paired with “good” is “camera quality”. Similarly, the explicit feature paired with “dirty” is “lens”.
In the second example, “really” and “fast” are tagged as adverb and adjective and are treated as sentiments. Since no explicit feature is identified, an implicit feature “speed” is inferred from a default feature-sentiment relation (“speed”, “fast”), to be paired with “fast”. There is no default relation concerning “really”, thus it is discarded.
In the third example, “fast” is tagged as an adjective and is treated as a sentiment. “drops” is first stemmed to be “drop”, and identified as the explicit feature paired with “fast”. However, this pair cannot have orientation calculated, as explained in the section “Sentiment orientations calculation”. Then, “drop” is skipped and “battery” is identified as the explicit feature paired with “fast”. Since (“battery”, “fast”) can have orientation calculated, the default relation (“speed”, “fast”) is not applied, thus does not interfere.
The above principles are implemented as follows. Within the neighborhood of sentiment S i, if a term T corresponds to a product feature term f in fuzzy product ontology, then f is identified as a candidate explicit feature. The phrase term T corresponds to f if Eq. (11) is satisfied. The word term T corresponds to f if Eq. (12) is satisfied.
 $$\exists f\in PF, \;T = f$$
 $$\exists f\in {\rm SF}, \;T\in { {{\rm lemma}\_{\rm names}( {\rm syn}) } } _{{\rm syn}\in {\rm synsets}( f) }$$
Candidate explicit features [f i,T] are sorted by putting phrases before words. For phrases and words respectively, candidates are then sorted in the ascending order of distance to S i. Then, each candidate f i,T in the sorted order is inspected by following rules, to find the paired explicit feature F i.
-
Rule 1. If f i,T is nearer to another sentiment, it is skipped.
-
Rule 2. If f i,T is at a higher level in fuzzy product ontology than another candidate, it is skipped.
The identified explicit feature-sentiment pair is denoted (F i, S i). If (F i, S i) cannot have orientation calculated, it is skipped and the next candidate is to be inspected. If no explicit feature is identified for S i, the default feature-sentiment relation D is applied to infer implicit feature and orientation for S i, as illustrated in Condition 3 in the section “Sentiment orientations calculation”.
In Rule 2, the higher-level features subsume lower-level ones, thus are considered less detailed. Correspondent f is used instead of term T to be the explicit feature, to handle the synonyms. For example, by doing this, “lense” and “lens” expressed by customers are standardized as “lens”. This is useful for analyzing customer preferences statistics later. The maximum skip distance K is important for not only identifying explicit features but also detecting negation expressions. If K is too small, the explicit feature for S i can be ignored. If K is too big, negation expressions unrelated to (F i, S i) are falsely included. Our experiments show that K should be set 5 normally. When language is more colloquial, K should be larger.
Sentiment orientations calculation
Sentimental knowledges are employed with rules to calculate sentiment orientations. For explicit feature-sentiment pairs, fuzzy product ontology is considered before SentiWordNet to calculate orientations. SentiWordNet is a general sentiment lexicon which contains positive, negative, and objective orientation strengths of word senses. This is because domain knowledges are more useful than general knowledges in the target product domain. For inferred implicit feature-sentiment pairs, default feature-sentiment relations are applied.
To illustrate the above principles, examples in the section “Sentiment orientations calculation” are used here. In the first example, identified explicit pairs (“camera quality”, “good”) and (“lens”, “dirty”) are firstly not found in fuzzy product ontology. Then, according to SentiWordNet, “good” and “dirty” are strong sentiments, and orientations of the two explicit pairs are calculated as −1, using the orientation strengths in SentiWordNet.
In the second example, the inferred implicit pair (“speed”, “fast”) has orientation calculated as +1, using the orientation score of the default relation (“speed”, “fast”): +1.
In the third example, the explicit pair (“drop”, “fast”) is not found in non-taxonomic relations in fuzzy product ontology. This may be due to that “drop” is not often mentioned together with “fast” in pros/cons labeled comments, compared with “run out”, “discharge”, etc. Then, “fast” is not a strong sentiment according to SentiWordNet. Therefore, this explicit pair cannot have its orientation calculated. After skipping the “drop”, the next explicit pair (“battery”, “fast”) is identified. This pair is found in a non-taxonomic relation (“battery”, “fast”): −1, thus its orientation is calculated as −1.
The above principles are implemented as follows. For the explicit feature-sentiment pair (F i, S i), Condition 1 and Condition 2 are applied in order to compute their orientation O i. If all explicit pairs within the neighborhood of S i fail for Condition 1 and Condition 2, Condition 3 is applied to the infer implicit feature and orientation for S i.
Condition 1. The explicit pair (F i, S i) is found in a non-taxonomic relation, that is, Eq. (13) is satisfied.
 $$\exists ( f_i, \;s_i) \colon o_i\in R, \;F_i = f_i, \;{\rm and\ }\; S_i = s_i$$
Condition 2. In the explicit pair (F i, S i), S i is a strong sentiment according to SentiWordNet, that is, Eq. (14) is satisfied.
 $$\exists {\rm syn}\in {\rm synsets}( S_i) , \;{\rm Obj}( {\rm syn}) < \max { {{\rm Pos}( {\rm syn}) , \;{\rm Neg}( {\rm syn}) } } $$
where Obj(syn) is the objective orientation strength of word sense syn in SentiWordNet, Pos(syn) is the positive orientation strength of syn, and Neg(syn) is the negative orientation strength of syn.
Condition 3. The implicit pair (F i, S i) can be inferred for S i, that is, Eq. (15) is satisfied.
 $$\exists ( {d}{\,f}_i, \;{d}{s}_i) \colon {d}{o}_i\in D, \;S_i = {d}{s}_i$$
In Condition 1, O i is set as fuzzy score o i. In Condition 2, O i is calculated in Eqs (16) and (17). In Condition 3, df i is inferred as the implicit feature F i for S i, and O i is set as default orientation score doi. If Condition 3 is still not satisfied, S i is discarded, and the next sentiment is processed with the same procedures.
 $$\eqalign{& O_i = \max \{ O_{i,{\rm syn}}|{\rm syn}\in {\rm synsets}(S_i),\;{\rm Obj}({\rm syn}) \cr & \quad < \max \{ {\rm Pos}({\rm syn}),\;{\rm Neg}({\rm syn})\} \} } $$
 $$O_{i, {\rm syn}} = \displaystyle{{{\rm Pos}( {\rm syn}) -{\rm Neg}( {\rm syn}) } \over {\max { {{\rm Pos}( {\rm syn}) , \;{\rm Neg}( {\rm syn}) } } }}$$
Finally, O i is reversed by negation expressions, as in Eq. (18).
 $$O_i = O_i\ast ( {-}1) ^n$$
where n is the number of negation expressions detected within the neighborhood of S i.
Negation expressions include typically “not”, “never”, adverbs like “barely”, “hardly”, verbs like “fail”, “lack”, etc. They are independent on POS and are useful for sentiment orientations modification in many cases. For example, in “not so bad” and “spectacularly failed”, the negations “not” and “fail” can reverse sentiment orientations correctly.
The novel ontology-based fine-grained sentiment analysis algorithm is summarized in Figure 6. The output of sentiment analysis is the feature-sentiment pairs with orientations, as customer preference statistics, denoted as E = {(F i, S i):O i}.
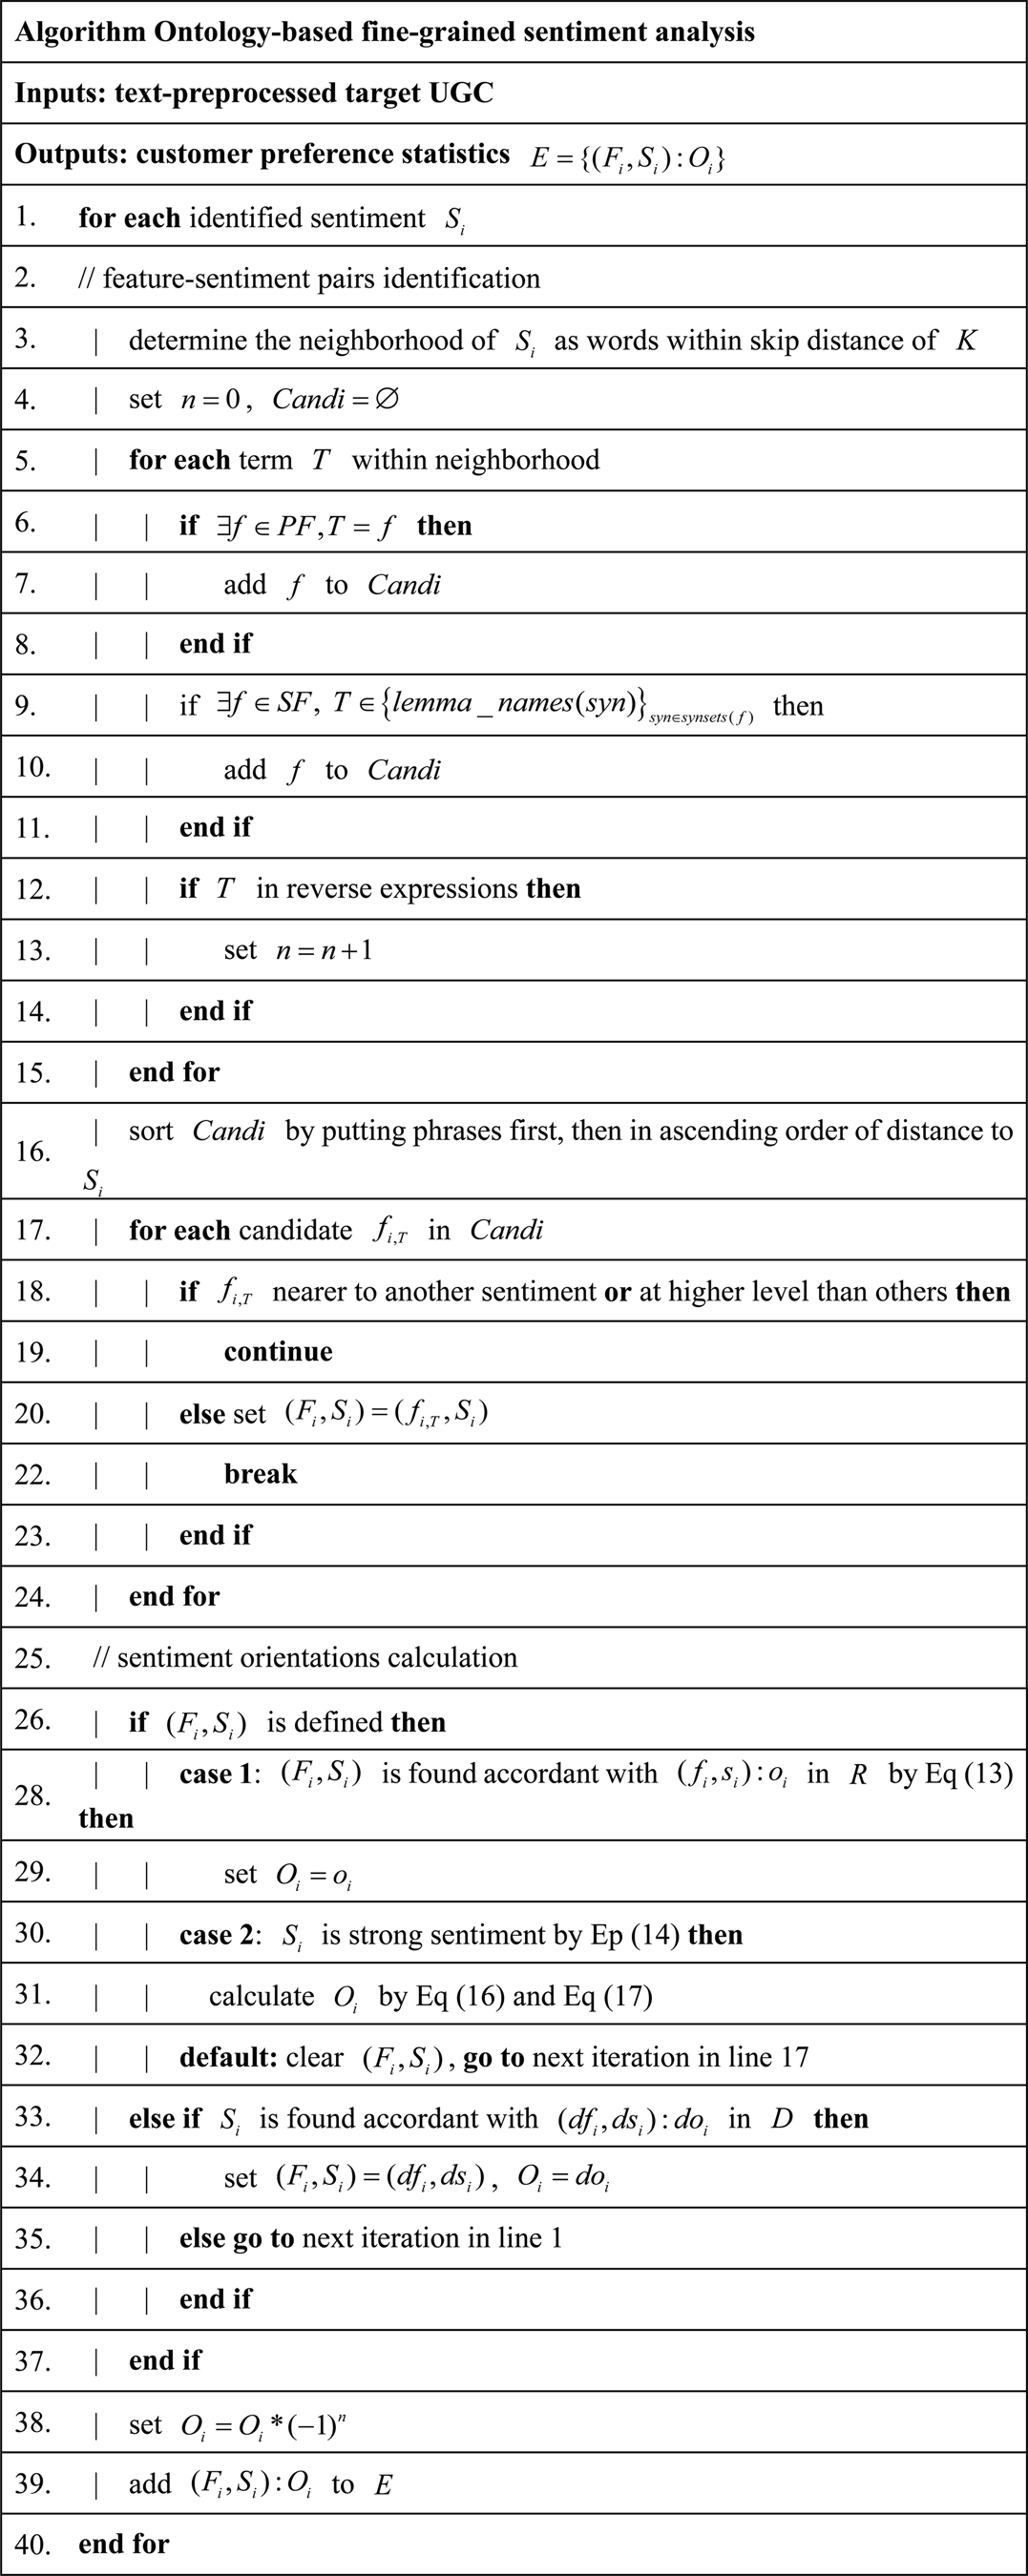
Fig. 6. Ontology-based fine-grained sentiment analysis algorithm.
Product redesign mechanisms
In the proposed integrated customer hearing and product redesign system, product redesign is supported by decision-making tools, customer hearing statistics, and representative customer feedbacks in a coordinated way. By summarizing CRPs from the taxonomic relations of fuzzy product ontology, extracted customer preference statistics are categorized and transformed into multilevels. After that, design decision-making tools, that is, opportunity landscape maps and HOQ table are automatically established by the computing satisfaction score and the importance score for each CRP. Opportunity landscapes provide insights into CRPs performances. The overall product evaluation and importance of technical design factors are resolved from the HOQ table. During preference statistics visualization, designers can select target CRP and target feature to visualize, and the target-related feedbacks as generated as representative ones. Various types of information from UGC can be analyzed by experts to facilitate the understanding of statistics.
Details of summarizing CRPs, design decision-making tools establishment, preference statistics visualization and representative feedbacks selection are explained in the respective subsections.
Summarizing CRPs
In definition, a CRP is a term that can represent a category of customer requirements, like “aesthetic”, “quality”. CRPs are utilized to categorize customer requirements about the product, to help designers understand customer requirements, and to evaluate the product systematically. In the proposed system, CRPs are also utilized to organize extracted customer preference statistics into levels to simplify the visualization and analysis of them. Visualization and analysis can be conducted at both the CRP level and the feature level. In addition, CRPs are referred to as the customer requirement factors in opportunity landscapes and HOQ table establishment.
A CRP group contains all the related product features of that category. The summarization process for related product features is setting initial ones in the CRP group, and adding all their child nodes in fuzzy product ontology into the CRP group. For the initial CRP group, denoted as G CRP, the feature f j is added as a child node of f, if Eq. (19) is satisfied.
 $$\exists f\in G_{{\rm CRP}}\;{\rm and\ }\; ( f_i, \;f_j) \colon s_{\,f_i, f_j}\in H, \;f = f_i$$
G CRP is expanded dynamically. When no features can be added, the summarization process is finished. The algorithm of summarizing CRPs is shown in Figure 7.

Fig. 7. Summarizing CRPs algorithm.
Design decision-making tools establishment
Design decision-making tools, that is, opportunity landscapes and HOQ table are established based on customer preference statistics. CRPs are the customer requirement factors used in both tools.
As explained and established in prior works (Pinegar, Reference Pinegar2006; Jeong et al., Reference Jeong, Yoon and Lee2019; Choi et al., Reference Choi, Oh, Yoon, Lee and Coh2020), opportunity landscapes map customer requirement factors into the over-served, under-served, and appropriately served regions, according to their importance and satisfaction scores. A schema of the opportunity landscape is shown in Figure 8. Importance and satisfaction are the axes. The over-served region indicates relatively low importance and high satisfaction. The under-served region indicates relatively high importance and low satisfaction. The appropriately served region indicates the balance. Typically, an opportunity landscape is established for each target product, to reflect its distribution of factors in regions.

Fig. 8. Schema of the opportunity landscape.
Region boundaries are defined by average importance and satisfaction scores of factors, that is, CRPs. For each CRP, the importance score is computed in Eqs (20)–(23), the satisfaction score is computed in Eqs (24) and (25).
 $${\rm imp}{\rm o}_{{\rm CRP}} = \displaystyle{{{\rm imp}{{\rm {o}^{\prime}}}_{{\rm CRP}}-\mathop {\min }\limits_i ( {\rm imp}{{\rm {o}^{\prime}}}_i) } \over {\mathop {\max }\limits_i ( {\rm imp}{{\rm {o}^{\prime}}}_i) -\mathop {\min }\limits_i ( {\rm imp}{{\rm {o}^{\prime}}}_i) }}$$
 $${\rm imp}{\rm {o}^{\prime}}_{{\rm CRP}} = P_{{\rm CRP}} + N_{{\rm CRP}}$$
 $$P_{{\rm CRP}} = \vert {{ {( F_i, \;S_i) \colon O_i\in E\vert {F_i\in G_{{\rm CRP}}, \;} O_i > 0} } } \vert $$
 $$N_{{\rm CRP}} = \vert {{ {( F_i, \;S_i) \colon O_i\in E\vert {F_i\in G_{{\rm CRP}}, \;} O_i < 0} } } \vert $$
 $${\rm sati}{\rm s}_{{\rm CRP}} = \displaystyle{{2\ast {\rm sati}{{\rm {s}^{\prime}}}_{{\rm CRP}}-\mathop {\min }\limits_i ( {\rm sati}{{\rm {s}^{\prime}}}_i) -\mathop {\max }\limits_i ( {\rm sati}{{\rm {s}^{\prime}}}_i) } \over {\mathop {\max }\limits_i ( {\rm sati}{{\rm s}^{\prime}}_i) -\mathop {\min }\limits_i ( {\rm sati}{{\rm {s}^{\prime}}}_i) }}$$
 $${\rm sati}{\rm {s}^{\prime}}_{{\rm CRP}} = \sum\limits_{( F_i, S_i) \colon O_i\in E, F_i\in G_{{\rm CRP}}} {O_i} $$
where E is the extracted customer preference statistics for target product.
Computed importance scores are in range [0, 1]. Satisfaction scores are in range [−1, 1]. The average importance score is denoted as  $\overline {{\rm impo}}$, and the average satisfaction score is denoted as
  $\overline {{\rm satis}}$. The boundary line between the under-served region and the appropriately served region is defined by two points: (
 $\overline {{\rm impo}}$, −1) and (1, 1) in the schema. The boundary line between the over-served region and the appropriately served region is defined by (0,
  $\overline {{\rm satis}}$) and (1, 1). In this way, the CRPs located in the under-served region are those with larger importance than the average, but get disproportionate satisfaction. The over-served and appropriately served regions have corresponding properties. Therefore, opportunity landscapes can provide insights into CRPs. Under-served CRPs are the weaknesses that should be prioritized in a redesign phase. Over-served CRPs are the highlights that exceed customers’ expectation. Stabilizing them can strengthen customers’ appreciation and brand loyalty.
HOQ table is a widely used tool for managing design quality, as the core of quality function deployment (QFD). It maps CRPs and technical parameters (TPs) with a matrix to reflect their interconnections. The typical structure of HOQ table is shown in Figure 9. In product evaluation, several target products can be analyzed together.

Fig. 9. HOQ table structure.
In the traditional way of HOQ table establishment, the CRPs, weights of CRPs, and product evaluation are defined by experts, which introduces subjectivity. In a proposed system, these parameters are resolved from customer preference statistics. Summarized CRPs in the section “Summarizing CRPs” are directly used in the table. Weights of CRPs are defined as the total number of judgments toward them made by customers, as in Eq. (26).
 $${\rm Weigh}{\rm t}_{{\rm CRP}} = \sum\limits_{{\rm product}} {{\rm imp}{{\rm {o}^{\prime}}}_{{\rm CRP, product}}} $$
where  ${\rm imp}{\rm {o}^{\prime}}_{{\rm CRP, product}}$ is the
  ${\rm imp}{\rm {o}^{\prime}}_{{\rm CRP}}$ for target product.
Product evaluation results are in terms of CRPs and are determined as  ${\rm sati}{\rm {s}^{\prime}}_{{\rm CRP, product}}$.
  ${\rm sati}{\rm {s}^{\prime}}_{{\rm CRP, product}}$ is the
  ${\rm sati}{\rm {s}^{\prime}}_{{\rm CRP}}$ for target product. In addition, roof parameters, TPs, and their specifications are defined by experts (Han et al., Reference Han, Kim, Yun, Hong and Kim2004; Chen and Chuang, Reference Chen and Chuang2008; Zhang and Liu, Reference Zhang and Liu2016; Trappey et al., Reference Trappey, Trappey, Fan and Lee2018). After that, the overall product evaluation, importance of TPs, and their relative importance can be resolved using HOQ formulas (Wasserman, Reference Wasserman1993). The automatically established HOQ table is useful for redesign strategy elicitation, by integrating different types of information about products and engineering phase.
Preference statistics visualization and representative feedbacks selection
Customer preference statistics are interactively visualized by designers at the CRP level and the feature level. During visualization, representative feedbacks are concurrently generated. The process is as follows.
For target product, customer preferences statistics at the CRP level are the number of positive judgments P CRP and the number of negative judgments N CRP about CRPs made by customers. They are calculated as shown in Eqs (22) and (23). According to the CRP level statistics and established opportunity landscape, designers can select a target CRP of their interest for further inspection. Typically, designers select a target CRP from the under-served region as one that has very low satisfaction and high importance, as a coarse-grained weakness.
For target CRP, customer preferences statistics at the feature level are the number of positive judgments and the number of negative judgments about product features within the CRP group made by customers. For product feature f, the number of positive judgments P f is calculated in Eq. (27), and the number of negative judgments N f is calculated in Eq. (28).
 $$P_f = \vert {{ {( F_i, \;S_i) \colon O_i\in E\vert {F_i = f, \;} O_i > 0} } } \vert $$
 $$N_f = \vert {{ {( F_i, \;S_i) \colon O_i\in E\vert {F_i = f, \;} O_i < 0} } } \vert $$
According to the feature level statistics, designers can select a target feature of their interest. Then, customer feedbacks that mention the target feature are generated as representative ones. Typically, designers select a target feature as one that also has low satisfaction and large importance, as a fine-grained weakness.
Representative feedbacks selection strikes a balance between information extraction quality and text processing efficiency. Feedbacks can contain information like user experiences and conditions that are hard to process. Such information can reveal the reasons behind preferences statistics. Also, inspecting feedbacks by experts can compensate for some errors caused by the sentiment analysis algorithm.
The statistics and representative feedbacks facilitate the use of the opportunity landscape. For example, the feature level statistics can help find the main contributor to a CRP's location in the opportunity landscape. According to the opportunity finding theory, the degree of being appropriately served can be measured by factors’ distances to boundaries. Therefore, weaknesses may also be those in the middle region. Comparing the statistics and feedbacks can help find those weaknesses.
System evaluation
The proposed integrated customer hearing and product redesign system is evaluated with a case study of smartphone. Fuzzy product ontology construction and sentiment analysis experiments are conducted with respective datasets and algorithms. They are introduced in the first subsection. Product redesign evaluation is based on the results of the former subsection.
Fuzzy product ontology construction and sentiment analysis evaluation
Datasets description
Datasets for fuzzy product ontology construction are from online customer comments on different platforms. Customer comments are more relevant to customer satisfaction toward the product than the contents on blogs, forums, etc. Unlabeled comments for taxonomic relations learning are collected from amazon.com. Pros/cons labeled comments for non-taxonomic relations learning are collected from newegg.com. Python package urllibFootnote 2 is utilized for data collection. Datasets statistics for fuzzy product ontology construction are given in Table 1.
Table 1. Datasets statistics for fuzzy product ontology construction

Dataset for sentiment analysis is originally constructed, since no benchmark dataset is available for fine-grained sentiment analysis about the smartphone product. Specifically, online customer comments about three smartphones are collected from amazon.com, then manually annotated by experts via cross checking. For better validation, annotations given by individual experts need to be consistent, or have their differences solved by all experts to become final annotations. The constructed dataset is made public,Footnote 3 to ensure credibility and facilitate future studies. Three smartphone products are denoted as Product A, Product B, and Product C, respectively, to avoid commercial aspects.
For each product, 400 comments posted between July 10 and December 31, 2019 are randomly collected. To improve dataset quality, collected comments are checked by the conditions below to become valid comments.
1. The comment is not a repeated one.
2. The comment contains more than 10 words after stop words removal.
A total of 1165 valid comments are finally obtained and annotated. Dataset statistics for sentiment analysis are given in Table 2. Positive or negative judgments are the oriental judgments toward features. Since the novel ontology-based fine-grained sentiment analysis is not based on the statistical model, class imbalance does not affect its performance. Benchmark methods that build on statistical models, that is, SVM and RNN models, handle class imbalance by rescaling.
Table 2. Dataset statistics for sentiment analysis

Fuzzy product ontology construction experiment
In taxonomic relations learning, the maximum skip distance W between nearby words is set 10. Frequency threshold α for filtering is 80. Similarity measure threshold β is 0.35. Hyper-parameter a for phrase learning is 0.9. In non-taxonomic relations learning, weight w asso is 0.7. Association strength threshold λ is 0.57.
With the above settlement, a total of 124 product feature terms are finally learned, like 82 words and 42 phrases. They are listed in Table 3. A total of 148 pairs of taxonomic relations are learned. The terms are mostly relevant to the smartphone product and can cover most aspects. Synonyms are avoided successfully in words. Phrases are meaningful, many of them are familiar jargons about smartphone. Some phrases are about the brand, marketing, and services, like “customer service”, “apple pay”, “google tech”, and they can be used for multi-faceted customer hearing.
Table 3. Product feature terms learned

A total of 55 pairs of non-taxonomic relations are learned. Examples of them are listed in Table 4. Many meaningful context-sensitive sentiments for related features are included. Some of them are generally commendatory or derogatory, but this does not affect sentiment analysis, which can handle this by fusing general and domain knowledges. It is important to note that non-taxonomic relations are learned from customers’ common usages of context-sensitive sentiments in pros and cons. For example, the fuzzy score of (“battery”, “fast”) is −1, this is because the common usage of “fast” in the context of “battery” is to refer to that battery discharges fast, which is negative and put in cons. Other usages such as “battery charges fast” are rare, thus are ignored by a statistical method. This may lead to errors when the rare usages occur, but the statistical method is correct in most cases and is efficient. The results reveal that the constructed fuzzy product ontology does not represent precise domain knowledges but are the efficient summary of them.
Table 4. Examples of non-taxonomic relations learned

The constructed fuzzy product ontology is not huge in size, as summary domain knowledges. In this case study, it is evaluated as effective and valuable by experts. It can be further improved and standardized to be reusable. The above experimental results validate the credibility of fuzzy product ontology, as well as the effectiveness of the semi-supervised learning algorithm. The results also show that the datasets chosen for fuzzy product ontology are suitable. Although pros/cons comments are labeled by customers who may not strictly fill comments in respective areas, the dataset quality is well enough for fuzzy product ontology construction. In practice, for different products, datasets can be settled in a similar way to this case study.
Sentiment analysis experiment
The novel ontology-based fine-grained sentiment analysis method is carried out with fuzzy product ontology constructed in previous experiments. The SVM based method (Joachims, Reference Joachims1998), the RNN based method (Al-Smadi et al., Reference Al-Smadi, Qawasmeh, Al-Ayyoub, Jararweh and Gupta2018), and the OBPRM method (Lau et al., Reference Lau, Li and Liao2014) are used for comparison. The SVM model is widely used in machine learning-based sentiment analysis. The RNN model is another statistical model, which is suitable for sequence processing tasks like language processing, and can be light weight. OBPRM is a rule-based method and also supervised by ontology. The first two methods employ individual models for each feature and use combined models to predict for all features by a sentence. The OBPRM method is supervised by the constructed fuzzy product ontology.
Experiment results of four methods in terms of accuracy (Acc), recall (R), precision (P), and F1-score (F1) are listed in Table 5. The proposed sentiment analysis method has the best performance by four measures, with accuracy and F1-score outperforming OBPRM by 6.79% and 5.64%, respectively. For 10 highest occurrence features, four methods are compared in terms of accuracy, as shown in Figure 10. The proposed sentiment analysis method has steady performances on all features. It reaches the highest accuracy for most features.
Table 5. Sentiment analysis evaluation


Fig. 10. Feature-level sentiment analysis accuracy.
Experimental results show that machine learning-based methods, that is, SVM based and RNN based, have generally worse performances than rule-based methods and are unsteady among different features. These may be due to the limited training data. In addition, labeling work is required for statistical models in practice. Compared with OBPRM, the proposed method has several major modifications that contribute to improved performance. (1) Semantic rules and WordNet are employed for features identification and filtering, instead of probabilistic generative models. The improved rules are more suitable in the specific product domain. (2) Verbs and phrases are both included in taxonomic relations learning and sentiment analysis. Verbs are frequently used by customers to describe functions or behaviors but are not included in many studies. Phrases are also frequently used and are crucial for domain-specific concepts. (3) Semantic rules in sentiment analysis are improved, such as prioritizing low-level features and phrases, filtering candidate explicit features according to linguistics, and the use of default feature-sentiment relations.
Despite the improvement, the sentiment analysis accuracy is still unsatisfactory. In particular, many errors are caused by failing to identify negation expressions. For example, in sentences “can't be better” and “can be better”, orientations calculated are the opposite to customers’ original meanings due to false negations. Also, in some situations, sentiment terms are absent, but sentiments are still expressed by specific expressions. Such sentiments are falsely neglected. For example, in sentences “dropping the phone does not break it”, “it cracked the screen”, due to the absence of sentiment terms, sentiments are neglected by the algorithm. But such phenomena described can still express customers’ judgments or sentiments toward some product features. In fact, hidden sentiments are often involved in the target domain. Mining such sentiments requires advanced domain knowledges. Some complex language usages, like sarcasm, exaggeration and comparing with other products further complicate the sentiment analysis task, as in the example “the camera of this phone is as good as my webcam on my century old laptop”. As reflected by the above examples, sentiment analysis techniques currently still face tough challenges and are unable to achieve accurate customer hearing. Therefore, sentiment analysis results need to be utilized in proper mechanisms. The extracted customer preference statistics of three smartphones are further utilized in the section “Product redesign evaluation” for product redesign. Statistics for 15 highest occurrence features are listed in Table 6.
Table 6. Customer preference statistics of three smartphones for 15 highest occurrence features

Product redesign evaluation
According to the section “Feature-sentiment pairs identification”, CRPs are summarized based on the constructed fuzzy product ontology. They are the factors by which designers understand customer requirements, and product features in the CRP group can be understood as contributors to that factor. As listed in Table 7, summarized CRPs cover most aspects about smartphone that customers can reflect on, and they are distinctive from each other.
Table 7. Summarized CRPs

Based on the customer preference statistics of three smartphones, the importance scores and satisfaction scores for CRPs are computed. After that, opportunity landscapes for three products are automatically established, as shown in Figures 11–13. Because importance scores and satisfaction scores are normalized with respect to each product, each landscape reflects CRPs individually for that product. For example, landscape for Product C has the most even distribution of CRPs. Among the under-served CRPs, “hardware” has largest importance and lowest satisfaction, thus should be prioritized in Product C redesign phase. Product A and Product B have “aesthetic” in under-served regions. “aesthetic” has highest importance and disproportionate satisfaction, thus should be treated as major weakness for these two products. Likewise, opportunity landscapes can provide valuable insights into individual products for redesign strategies.

Fig. 11. Opportunity landscape map for Product A.

Fig. 12. Opportunity landscape map for Product B.

Fig. 13. Opportunity landscape map for Product C.
An HOQ table is automatically established according to the section “Summarizing CRPs”, as displayed in Figure 14. In product evaluation, products can be directly compared in terms of CRPs, and their overall evaluations are resolved. Generally, Product C exceeds Product A and Product B. Product C has an obvious advantage in “software”, as well as in “camera” and “security”. Product B is worst among the three products, although it has the advantage in “aesthetic”. By taking into account the correlation matrix and resolved TP importance, redesign strategies can be elicited. For example, to improve Product B, “power amplifier” should be prioritized, because it has relatively large importance and influences two weaknesses of Product B, that is, “communication” and “quality”. The “application processor” and “structure design” should be highlighted for all products, because they have largest importance. Redesign strategies can be supported by the HOQ table likewise, by integrating customer hearing results and engineering factors in respective areas.

Fig. 14. HOQ table for three smartphones.
For interactive preference statistics visualization and representative feedbacks selection in the case study of smartphone, an interface is especially developed, as shown in Figures 15 and 16. Firstly, a target product is to be selected by designers. Product B is selected here as an example. Then, the customer preference statistics of Product B at the CRP level are fetched and displayed by the interface, as shown in Figure 15. “aesthetic” and “hardware” receive most judgments. “hardware” receives more negative ones than “aesthetic”. Combining the opportunity landscape for Product B in Figure 12, which locates “aesthetic” in the under-served region, and locate “hardware” near the boundary, it is known that both CRPs should be recognized as coarse-grained weaknesses of Product B.

Fig. 15. Summarization of CRPs for the selected product.

Fig. 16. Representative reviews for the selected CRP and target feature.
After that, a target CRP is to be selected by designers. “hardware” is selected here as an example. Then, customer preference statistics at the feature level, about product features within the “hardware” group are fetched and displayed by interface, as shown in Figure 16. Among the features, “processor” receives more negative judgments than positive ones. It is selected here as a target feature by designers. Representative feedbacks of Product B concerning “processor” are concurrently generated, as displayed beside feature-level statistics. By applying the above steps interactively, comprehensive analysis for multiple products can be conducted.
From representative feedbacks, information about user experiences, using conditions and habits can be revealed. For example, a customer's using habits concerning the processor include “checking email”, “surf the web”, “game and fancy apps”, etc. A customer mentions that “use two apps at the same time” is how he or she uses it. Mining such information for expert analysis is essential for making a valid redesign strategy. To illustrate with an example, a customer criticizes the processor as “not enough to handle games and fancy apps”. However, he/she praises the smartphone for being good enough to handle essential jobs. According to expert knowledges, the games and fancy apps require high-profile graphics processing unit and big internal storage. Their performances are also concerned with factors like CPU frequency and compatibility. These configurations of smartphone designed for “deep users” are different from those designed for ordinary users. Therefore, to attract deep users, Product B need to be redesigned in many other parts accordingly, such as battery mode, body size, and thermal design. The example shows that advanced expert knowledges are crucial to interpret customer feedbacks rightly, to make reasonable conclusions. Representative feedbacks selection, therefore, strikes a balance between efficiency and reliable strategy making.
Besides, preference statistics visualization and representative feedbacks supplement each other. Statistics summarize customer preferences, while representative feedbacks with details can help designers understand the reasons behind preferences. For example, “hardware” of Product C has high satisfaction by statistics. By inspecting the “hardware” group features and representative feedbacks, it is found that “headphone jack” is a big contributor to the high satisfaction. The free headphone jack is an attractive point. In terms of other features within the “hardware” group, the three smartphones have similar performances. Therefore, this needs to be improved for Product A and Product B. Similarly, “camera” of Product C has highest satisfaction among three products by statistics. By inspecting “camera” group features and representative feedbacks, it is found that many customers praise the camera for its “night sight” mode. As described by customers, it clearly captures scenery and makes photograph graceful in adaption to the dark environment. In terms of photography technology, Product A and Product B also have “portrait mode” to elevate quality, but receive unsatisfactory feedbacks. Therefore, the strategy to elevate “camera” performance for Product A and Product B is to improve computational photography technologies, rather than the “camera module” within hardware or “power manage”.
For another example, “quality” of Product B has lowest satisfaction. By inspecting the “quality” group features and representative feedbacks, it is found that “drop call” is the main reason for this. Despite this defect, many features in “quality” group, like “sound quality” and “lifespan”, receive very positive judgments. Therefore, fixing the “drop call” issue is primary for Product B redesign. As illustrated by the case study, coordinately devised product redesign mechanisms can effectively support redesign strategy, with various types of information provided, and comprehensive analysis enabled.
Conclusions and future work
In recent years, exploiting UGC with sentiment analysis technology becomes an effective and promising way of customer hearing. To promote applicable customer hearing for product redesign, an integrated customer hearing and product redesign system is proposed. The system employs an ontology-based fine-grained sentiment analysis method to extract customer preference statistics from UGC, and coordinately devised product redesign mechanisms to improve practicability.
A fuzzy product ontology is first constructed in a semi-supervised way to facilitate both sentiment analysis and product redesign modules in the system. Taxonomic relations of product features in fuzzy product ontology are learned from unlabeled texts using semantic rules. Non-taxonomic relations between product features and context-sensitive sentiments are learned from pros/cons labeled comments. A novel ontology-based fine-grained sentiment analysis method is then employed for target UGC to extract customer preferences. It requires no extra labeling work but the available resources online. The sentiment analysis procedures after text-preprocessing involve stepwise feature-sentiment pairs identification and sentiment orientations calculation. Different knowledge sources, that is, general lexicon SentiWordNet and domain knowledges like fuzzy product ontology and default feature-sentiment relations are fused in sentiment analysis. In the product redesign module, CRPs are summarized from fuzzy product ontology and used to transform customer preference statistics into multilevels. Opportunity landscapes and HOQ table are automatically established from statistics. Preference statistics are interactively visualized at levels, through which representative feedbacks are generated. According to the case study, the proposed sentiment analysis method outperforms three benchmark methods. Various types of information can be effectively exploited from UGC, and reliable redesign strategies can be elicited with properly devised mechanisms.
For business implications, the proposed system can be useful for customer hearing, basically in a product redesign area. In other related scenarios where customer hearing is utilized, such as new product development, product opportunity finding, and marketing strategy making, the system can also be useful with respective adaptation.
For limitations and future work, firstly, sentiment analysis needs to be improved to reach higher accuracy. Specifically, better detection of negation expressions, and handling of hidden sentiments need to be focused on. Domain knowledges can be expanded to handle hidden sentiments in a similar way to handling implicit features. Secondly, the efficient way of determining hyper-parameters of the algorithms need to be studied. The experiments in this study show that hyper-parameters are important, but fine-tuning them is still burdensome. Thirdly, the technical parameters, correlation matrix, and roof parameters in HOQ table can also be automatically established, via technologies like patent mining, to promote efficiency and avoid subjectivity. Finally, to further exploit the benefits of fusing different decision-making tools and product redesign mechanisms, an integrated platform can be developed. For example, with dynamic graphical interfaces, designers can directly select target CRPs from opportunity landscapes to jump to their statistics and representative feedbacks, which facilitates the analysis process.
Siyu Zhu is a graduate student in the Department of Mechanical Engineering and Power Engineering at Shanghai Jiaotong University. Her research interests include design theory and method, data mining, and machine learning algorithms.
Jin Qi is currently an associate research fellow in the Department of Mechanical Engineering and Power Engineering at the Shanghai Jiaotong University. He received his PhD degree in Mechanical Engineering from the Shanghai Jiaotong University, Shanghai, China, in 2010. His research interests include product innovation method, bio-mechanical product development, artificial intelligence, and knowledge engineering.
Jie Hu is currently a professor in the Department of Mechanical Engineering and Power Engineering at the Shanghai Jiaotong University. He received his PhD degree in Mechanical Manufacturing and Automation from the Zhejiang University, Hangzhou, China, in 2001. His research interests include knowledge based engineering, knowledge fusion, design innovation and bioinformatics.
Haiqing Huang is a PhD student in the Department of Mechanical Engineering and Power Engineering at the Shanghai Jiaotong University. His research interests include web design and image processing.


