


Introduction
Recently, with the dissemination of Computer-Aided Design tools, we have witnessed a greater involvement of end-users in the design process with various degrees of participation, in approaches such as user-centered design (Norman, Reference Norman2002; Abras et al., Reference Abras, Maloney-krichmar, Preece and Bainbridge2004), participatory design (Cross and Design Research Society, Reference Cross1972; Bodker, Reference Bodker1996; Bjögvinsson et al., Reference Bjögvinsson, Ehn and Hillgren2012), and co-design (Ramaswamy and Prahalad, Reference Ramaswamy and Prahalad2006; Sanders and Stappers, Reference Sanders and Stappers2008), in which the boundaries between the roles of end-users, designers, and system designers become blurred. Such tendencies permeate creative fields such as architecture and product design, in many contexts, leading to mass customization (Toffler, Reference Toffler1971; Pine, Reference Pine1993; Tseng and Jiao, Reference Tseng, Jiao and Salvendy2001).
Mass customization (MC) adopts computer-implemented configurators to enable end-users to edit products and services according to their needs and preferences, thereby engaging in co-design. Typically, in such a customization process, end-users directly explore the design solutions that can be automatically generated by configurators, the so-called customization design space (Heiskala and Tiihonen, Reference Heiskala and Tiihonen2007). A positive MC experience for end-users requires a design space that balances enough design variety to keep the process interesting while ensuring that they are not overwhelmed by the burden of choice. However, such balance is difficult to ensure with traditional configurators whose design space is fixed (Piller et al., Reference Piller, Schubert, Koch and Moeslein2004). We hypothesize that a more flexible management of the customization design space renders the MC design process more efficient for different stakeholders. For that purpose, we propose extending the ability to customize a design further down the customization process by adopting customizable parametric models for designing products.
In our research, we suggest an innovative Design Participation Model towards such flexibility, by modulating the interactions among participants of the design process, namely system designers (or researchers playing that role), designers, and end-users (Fig. 1). According to the proposed model, the design system first enables designers to create customizable designs in the form of parametric models and then permits end-users to manipulate these designs by controlling parametric configurations. In this way, navigating complex design spaces can be simplified by designers to afford easier exploration by end-users (Castro e Costa, Reference Castro e Costa2018). Indeed, shape grammars supporting customizable designs can be configured as to support syntax-driven parametric rules embodying stylistic criteria that can be made more accessible to customers than low-level geometry-based archetypes. Our proposed approach leverages on a two-tier system to support more natural ways of parameterizing shapes, as depicted in Figure 1. Therefore, the goal of our research is to understand whether this approach can improve the MC process.
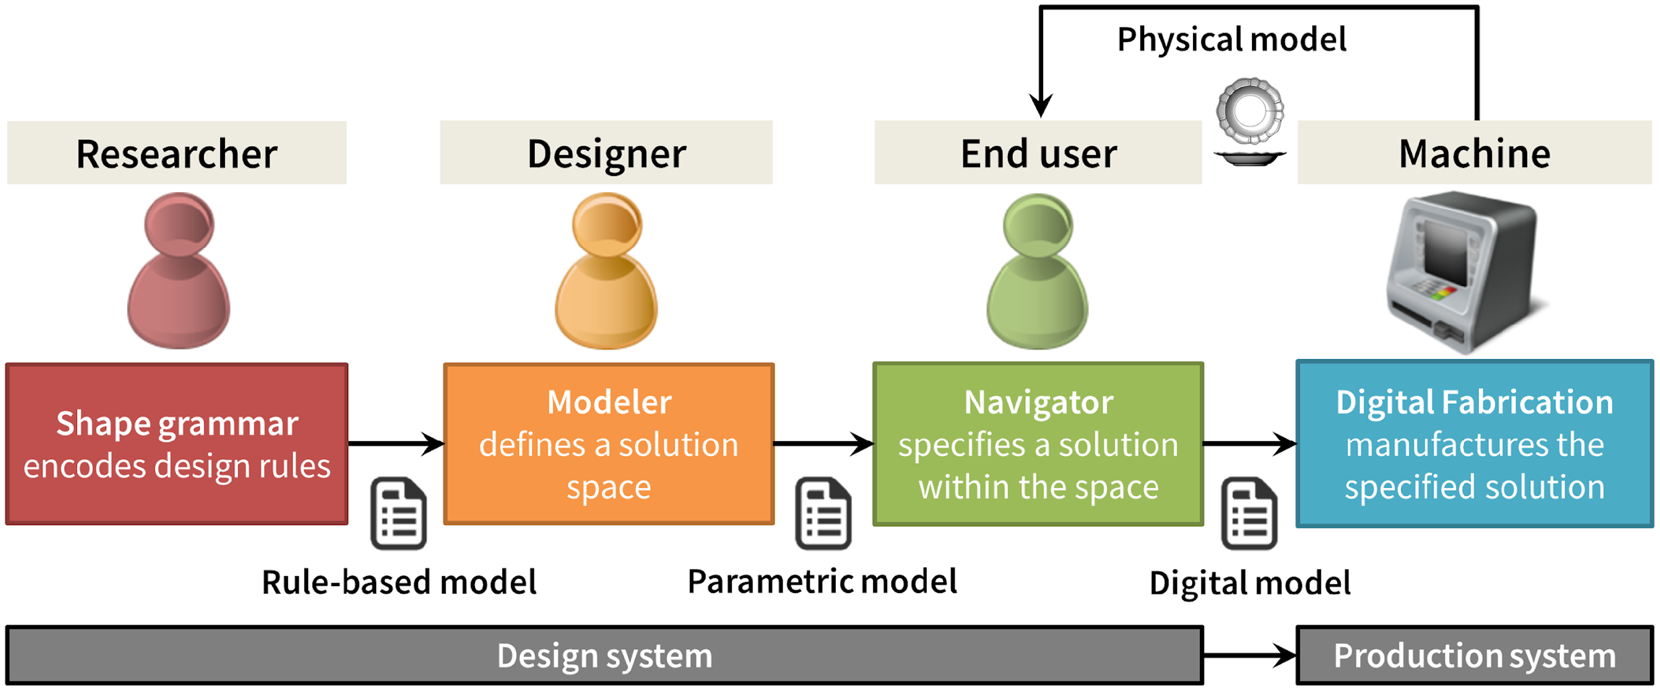
Fig. 1. Design Participation Model for the design system.
In order to test the proposed Design Participation Model, we developed a prototype of a MC system focused on ceramic tableware. Ceramic tableware makes for an interesting case study due to its reduced production costs and the sector's need to be competitive against foreign companies manufacturing low-cost products (Ken Research, 2014). The implementation of our prototype builds on an existing model for MC of architectural designs (Duarte, Reference Duarte2008), which proposed a computational framework that articulates a generative design system and a production system. The generative design system uses generic shape grammars to encode rules for designing ceramic tableware in order to generate new designs through parametric modeling, while the production system manufactures such generated designs through digital fabrication technology. The development of the design system was based on a case study of a Portuguese tableware manufacturer, Matceramica, who supported our research by providing information about their tableware designs.
The first two components of the Design Participation Model were addressed in previous publications, namely the Shape Grammar (Castro e Costa and Duarte, Reference Castro e Costa and Duarte2013, Reference Castro e Costa, Duarte and Gero2014) and the Modeler (Castro e Costa et al., Reference Castro e Costa, Jorge and Duarte2019). This paper focuses on Navigator, the final component of the generative design system used by potential buyers of a tableware collection to explore the collection design space. The section "Related work" compares Navigator to current paradigms for MC configurators that use parametric models. This contextualization helps to explain the distinction between the components of the proposed Design Participation Model in the section "Two-tier generative design system". The section "Implementing the Interpolator component" describes the Navigator component, and the section "User experience of Modeler and Interpolator" presents the process and results of user testing and evaluation, ending with a discussion of those results. The section "Conclusions" summarizes the research and presents conclusions and future work.
Related work
Several researchers in the field of MC have focused on the design of configurators and on the manipulation of design spaces.
Yavari et al. (Sinclair et al., Reference Sinclair, Campbell and Yavari2014; Yavari, Reference Yavari2017) have investigated the challenges of MC configurators that enable users to customize the shape of products for Additive Manufacturing, particularly into how to maintain a brand's design language. Based on such findings, a web-based MC configurator was implemented and tested by design professionals. Among other findings, researchers concluded that flexibility in terms of degrees of freedom should be provided to novice through expert users. Such recommendation is consistent with the proposed Design Participation Model and the respective implemented tools, which enable controlled variation of design operations and design spaces using shape grammars and parametric models.
Naik et al. (Naik et al., Reference Naik, Velamuri and Möslein2016; Naik, Reference Naik2017) have also focused on the design of MC configurators for 3D printing, in particular the potential of using modularity and controlling design spaces for harnessing the potential of such tools, as well as handing it on to non-expert users. Four mechanisms are identified as potentially simplifying design space for non-expert users, the last of which being the use of meta-toolkits, presented as enabling users to create toolkits for other users. Hailed as a way of democratizing toolkit creation, and therefore MC, the "meta-toolkit" concept is also adopted in our Design Participation Model. In fact, our Modeler component acts as a meta-toolkit in the sense that enables designers to define configurators that will later be used by non-expert end-users to create customized designs.
The concept of higher-level designing is also explored by Kyriakou et al. (Reference Kyriakou, Nickerson and Sabnis2017), who propose the use of metamodels for improving the customization experience. However, their use of the "meta-" prefix can be misleading. In fact, the experiment proposed by the authors is at the level of a parametric model, which would compare to a regular configurator or a toolkit as commonly referred to in the MC literature, since it is limited to creating a particular family of designs, in this case whistles. Nevertheless, such research provides an alternative perspective on the use of parametric models for MC, analyzing the reuse of such models within design and 3D printing communities and ultimately advocating for their advantages for customized design.
Existing parametric configurators
The proposed Design Participation Model aims to improve MC experiences beyond what contemporary configurators typically offer. In this section, we analyze some of the existing configurators and illustrate their differences, as summarized in Table 1. Even though some of these configurators are not specifically aimed at MC, they are good examples of simplified design tools that are useful for our analysis. The purpose of this analysis is to contextualize our proposal among some paradigmatic examples rather than provide an extensive documentation of existing configurators. More extensive comparative analyses of MC configurators can be found in the MC literature (Walcher and Piller, Reference Walcher and Piller2012; Naik et al., Reference Naik, Velamuri and Möslein2016; Blazek, Reference Blazek, Partl and Streichsbier2017; Zhao et al., Reference Zhao, McLoughlin, Adzhiev and Pasko2018).
Table 1. Analyzed configurators

Presently, there are many websites and mobile applications that enable users to manipulate shapes. Contrary to conventional CAD suites, these applications specifically target non-expert users. Indeed, some of them are developed specifically for MC purposes and can generate design solutions within more or less constrained design spaces. In the MC literature, these applications are often called "toolkits" (Franke and Piller, Reference Franke and Piller2002; Hermans, Reference Hermans2012), or "configurators" (Heiskala and Tiihonen, Reference Heiskala and Tiihonen2007). Hermans further classifies toolkits according to four different mechanisms for customizing products: (1) veneer, by adding a visual decorative layer; (2) modularity, by combining a set of discrete modules and options; (3) parametric, by changing specific parametric values, and (4) generative, by creating shapes through procedural modeling techniques (Hermans, Reference Hermans2012; Zhao et al., Reference Zhao, McLoughlin, Adzhiev and Pasko2018).
In the scope of our research, we are particularly interested in the subset of configurators that is supported by parametric models that enable continuous shape manipulation. We call these "parametric configurators" to distinguish them from "combinatorial configurators," in which products are customized by combining preset design elements. Nike ID and miAdidas are good examples of combinatorial customization, in which users are able to assign selected colors and materials to different elements of a sports shoe (Berger and Piller, Reference Berger and Piller2003). Regarding Hermans’ classification, we could associate the veneer and modularity mechanisms to what we consider combinatorial configurators, and his parametric and generative mechanisms to our parametric configurators. We can also distinguish between specific and generic configurators, invoking the use of these terms relative to shape grammars (Duarte, Reference Duarte2011). Specific configurators are applications that were developed for a specific type of product, such as sport shoes as described above. Among specific parametric configurators, we find Cell Cycle (Nervous Systems, Inc., 2012), which enables users to configure a piece of jewelry using a Web-based interfaceFootnote 1 (Fig. 2). This application has been developed to design a particular kind of jewel, according to a specific parametric model. Its designers later deployed similar applications for different products, but each of them only generates one type of artefact. Specific parametric configurators are supported by a single parametric model, which is hard coded into an application. An example closer to our research is the Sake Set Creator (Huang and Hudson, Reference Huang and Hudson2013) that enables users to customize a small set of ceramic vessels (Fig. 3). Sake Set Creator is hosted on the website of the online digital fabrication service Shapeways,Footnote 2 who manufactures the customized sake sets. In fact, the Sake Set Creator is one of various applications called Creator Apps, which allow users to customize products manufactured by Shapeways. Each of these apps can generate one type of object and, therefore, they are also considered specific configurators.

Fig. 2. Cell Cycle web-based interface (Nervous Systems, Inc., 2012).

Fig. 3. Sake Set Creator interface (Huang and Hudson, Reference Huang and Hudson2013).
Both Cell Cyle and Sake Set configurators feature similar control elements for manipulating the shape of the objects they customize. These elements provide more or less direct control over the object's shape. Indirect controls, such as sliders, allow manipulating the object's shape by changing values in the parametric model. On the other hand, more direct controls allow the user to manipulate shapes, for example, by dragging control points of curves that define the shapes. Comparing both configurators, we observe that the number of controls is proportional to the complexity of the controlled shapes. Besides providing handles for controlling the container's profile, Sake Set Creator features a very simple interface with only two sliders, which limits the space of design solutions. An additional indirect control lists predefined shapes, corresponding to predefined parameter values that can be used as starting points. In Cell Cycle, a similar function is performed by a drop-down menu via which the user chooses the overall dimensions of the product, from ring- to bracelet-sized. Additionally, the Cell Cycle interface features many indirect controls that include not only sliders, but also material switches among others, defining a richer design space.
Unlike specific applications, generic configurators can be used to manipulate multiple parametric models, typically corresponding to different products, and thus corresponding to a "meta-toolkit," as proposed by Naik et al. (Reference Naik, Velamuri and Möslein2016). One example is ShapeDiver,Footnote 3 a Web service for publishing parametric 3D data, although not necessarily geared to MC purposes (Fig. 4). In ShapeDiver, designers can upload parametric models developed in Grasshopper, a visual programming interface for the modeling software Rhinoceros, whose parameters are exposed as sliders that can be manipulated by end-users. A visualization window presents the shape that results from changing such parameters. Similarly, Thingiverse's app CustomizerFootnote 4 (Fig. 5) allows designers to offer customizable designs by publishing parametric models on Thingiverse. Designers must build their parametric models in OpenSCAD, an open-source solid-modeling CAD application. Contrary to Grasshopper, OpenSCAD's parametric models are written in a textual programming language. Special comments in the scripts enable Customizer to expose the model's variable parameters to users through sliders and other HTML form elements such as text fields and drop-down menus.

Fig. 4. ShapeDiver interface.

Fig. 5. Thingiverse Customizer interface.
A common aspect is that both configurators receive parametric models created in third party modeling and scripting tools, namely Grasshopper and OpenSCAD, requiring that designers must have some programming proficiency in these applications. Additionally, MatterMachineFootnote 5 offers an online implementation of a Visual Programming Interface, like Grasshopper. This tool allows users to build a configurator that can control various aspects related to the customized product, ranging from geometry to cost information. Yet, similarly to ShapeDiver and Thingiverse's Customizer, it requires the user to be able to build a parametric model through programming.
In the generic configurators mentioned above, manipulation of the object's shape is limited to indirect control elements, such as sliders or other HTML form elements, lacking direct shape manipulation capabilities found in specific configurators. Moreover, both in specific and generic configurators, the number of variable parameters and corresponding sliders is proportional to the complexity of the underlying parametric model. According to Miller (Reference Miller1956), the number of information units that can be handled simultaneously by the human brain is limited to the order of magnitude around the number seven. Therefore, we frequently witness a trade-off in MC configurators between shape complexity and interface simplicity, being difficult to find a satisfying compromise between the two.
Our approach challenges these trade-offs by proposing a simple interface that allows end-users to manipulate the relative complexity of the shapes comprised in a tableware collection, by minimizing the parameters manipulated by the user, while supporting a rich design space. More importantly, the novelty of our approach is to enable designers to easily change existing parametric models or add new ones, thereby defining the corresponding design spaces, which is possible by using the approaches analyzed above. In specific configurators, the parametric model is hard coded into the application itself and, therefore, changing the design space of such tools implies changing the application's code via programming, which is typically not within the skillset of a designer. Likewise, in the case of generic configurators, creating a new parametric model or changing an existing one can be achieved through scripting. While scripting has increasingly been added to designers’ skillsets across a variety of areas, it is still programming. By simplifying the process of changing parametric models that correspond to customizable tableware collections, namely by waiving the need for any type of programming, we provide a user-friendly and more inclusive approach to MC. Therefore, the proposed design system lies somewhere in-between generic and specific configurators: despite being constrained to customizing tableware collections, it allows manipulating multiple parametric models. Indeed, while tableware lies at the core of our case studies, our approach is not limited by stylistic parameters specific to tableware and is generalizable to other design domains, by configuring specific stylistic parameters to each design space in a seemingly orthogonal fashion.
Two-tier generative design system
According to the Design Participation Model shown in Figure 1, our Tableware Design System encompasses three components: Shape Grammar, Modeler, and Navigator. The Shape Grammar encodes rules for the design of tableware collections. The Modeler enables designers to create customizable tableware collections in the form of parametric prototypes, according to Shape Grammar rules. Finally, the Navigator enables end-users to customize those tableware collections by exploring their parametric design space. The last two components were implemented as corresponding computer applications, also named Modeler and Navigator, each having a distinct user interface, adapted to the different cognitive requirements of their target users, respectively, designers and end-users.
The Modeler application builds on the paradigm set by the Sake Set configurator described above. Modeler allows designers to modify the design of an initial tableware collection – or a previous design developed in Modeler – by changing a considerable number of aspects of the underlying parametric model, namely its topology and the values of its parameters. After having set a topology, the designer can explore the resulting parametric model, as in the parametric configurators presented in the previous section. In Modeler, the shape of tableware collection's elements can be modified in two distinct ways: its horizontal contour can be manipulated by changing values in sliders that correspond to parameters of a superellipse (top left corner in Fig. 6), and its profile can be manipulated by dragging control vertices of the corresponding Bézier curves (black dots in Fig. 6). In Modeler, changes to the shape of one element of the collection are replicated throughout the remaining elements (Castro e Costa, Reference Castro e Costa2018). Therefore, the information needed to reproduce a collection design created in Modeler is reduced to the values of the superellipse parameters and the coordinates of the control vertices of all its elements. Such set of values corresponds to the design's parametric configuration.

Fig. 6. Screenshot of the Modeler application.
In such approach, each potential change to a collection design corresponds to a design option. However, to cope with many design options towards a satisfying solution can be a difficult task for potential customers of customized tableware, who most likely have no design experience. As such, an engaging interface is needed for these end-users to comfortably manipulate the shape of their future collections. The Navigator addresses this need.
One of the main goals of designing the Navigator component was to avoid mass confusion, a phenomenon that results from the eventual excessive burden of choice in MC strategies (Zipkin, Reference Zipkin2001, p. 13). The difficulty in dealing with a wide range of options potentially deters the user of engaging in the MC experience (Piller et al., Reference Piller, Schubert, Koch and Möslein2005). In order to prevent the effect of mass confusion, the design strategy for the Navigator adopted the design space exploration paradigm (Berger and Piller, Reference Berger and Piller2003; Woodbury and Burrow, Reference Woodbury and Burrow2006; Strobbe et al., Reference Strobbe, Pauwels, Verstraeten, De Meyer and Van Campenhout2015). Rather than allowing users to directly manipulate parametric models, such as in Modeler, Navigator enables end-users to explore parametric design spaces that correspond to customizable tableware collections using simpler controls. These parametric design spaces are previously defined by the designer using Modeler by defining a parametric model and setting specific variations as restrictions to the design space. Navigator can then generate new collection designs within the restricted design space in real time according to end-users’ input.
For obtaining end-users’ input, we explored two different approaches. In the first approach, a new design is defined by interpolating among previously designed solutions, resulting in an alternative hybrid solution that shares design qualities with the interpolated collections. In this case, the end-user defines the interpolation weights of the existing solutions by positioning a black sphere relative to a particular solution. In the second approach, a new design is defined by the end-user through the manipulation of qualitative descriptions in order to iteratively apply changes to a previously designed solution. This quality-based approach is an attempt to get closer to the users’ natural language. The interpolation approach was implemented into a computer application named Interpolation Navigator or simply Interpolator (Fig. 7), whereas the quality-based approach was implemented into a computer application named Quality Navigator or simply Qualifier (Fig. 8).

Fig. 7. Screenshot of the Interpolator application.

Fig. 8. Screenshot of the Qualifier application.
In the following sections, we will present and discuss Interpolator, leaving Qualifier for a future publication due to space limitations. This article presents the design and implementation of the Navigator component, focusing on its user interface, while the Modeler component, its corresponding application and user interface have been addressed in previous publications (Castro e Costa, Reference Castro e Costa2018; Castro e Costa et al., Reference Castro e Costa, Jorge and Duarte2019).
Implementing the Interpolator component
Navigator adopts the design space exploration paradigm, and so its implementation requires formalizing the design space in first place. We defined the customization design space as the set of all possible design solutions that can be generated by a design system. The term "solution space" is often found in the MC literature (Berger and Piller, Reference Berger and Piller2003; Hermans, Reference Hermans2012), having a similar meaning: "A solution space encompasses all the possible designs a toolkit [ … ] can produce" (Hermans, Reference Hermans2012, p. 205). However, we use the term "design space," which is borrowed from Design literature (Mitchell, Reference Mitchell1990; Woodbury and Burrow, Reference Woodbury and Burrow2006; Saxena and Karsai, Reference Saxena and Karsai2010; Strobbe et al., Reference Strobbe, Pauwels, Verstraeten, De Meyer and Van Campenhout2015). The implementation of the Navigator as a configurator is supported by parametric models, which determine the geometric shape of design solutions for tableware collections. We are, thus, particularly concerned with parametric design spaces, defined as the set of all possible design solutions generated by the parametric model, and whose dimensionality is defined by the number of parameters of the corresponding parametric model (Talton et al., Reference Talton, Gibson, Hanrahan and Koltun2008, Reference Talton, Gibson, Yang, Hanrahan and Koltun2009).
Vector design space exploration
Each specific design solution is generated by providing the parametric model with a corresponding ordered set of parameter values, which is the solution's parametric configuration. Therefore, there is a biunivocal correspondence between the generated design solutions and parametric configurations. If we consider a parametric design space as a vector space, we can represent each of its design solutions as a "solution vector." Each component of a solution vector corresponds to a value of the design solution's parametric configuration.
Like the corresponding parametric design space, solution vectors are n-dimensional, in which n corresponds to the number of parameters necessary to generate (and to describe) solutions of the parametric model, with a specific design solution corresponding to a tableware collection. Moreover, a specific customizable collection corresponds to a defined parametric model, which in turn corresponds to a parametric design space with a defined dimensionality. Nevertheless, the number of parameters can vary from collection to collection, since topology can be modified using Modeler. In Figures 9–11, solution vectors are represented by points in a two-dimensional referential as a way of illustration, although these points exist in an n-dimensional space.

Fig. 9. Vectorial representation of design solutions as points.

Fig. 10. Representation of a variation vector as arrow and point.

Fig. 11. Definition of a design subspace through specification of limit solutions.
Exploring a design space implies the possibility of varying from one design solution to another, which corresponds to varying between the corresponding parametric configurations. Like design solutions, variation between solutions can be also represented by a vector, in this case a "variation vector," which can be calculated as the difference between two solution vectors. Like solution vectors, variation vectors can be represented graphically, either as an oriented arrow connecting the two points corresponding to the solution vectors, or as an equivalent point (Fig. 10). Since these vectors represent variation from one solution to another, the arrow representation seems more suitable.
Solution vectors and variation vectors belong to the same vector space, and so, vectoral operations can be performed between them, with some operations being more relevant for generating variations in the Navigator implementation. We have seen that subtracting two solution vectors results in a variation vector. Conversely, adding a variation vector to a solution vector results in a new solution vector. It also makes sense to multiply solution and variation vectors by a scalar value, as it will be necessary in interpolation operations.
Finally, we introduce the concept of design subspace as a subset of a design space. As mentioned above, Modeler enables the designer to create a customizable tableware collection, which is represented by a parametric model. For defining a customizable collection, the designer modifies the parametric model by applying several design operations, thus modifying the model's topology. It is also possible to edit the collection's profile and contour shape by specifying parameter values, namely the control vertices or values in the superellipse's parameters, in which case the designer is not modifying the parametric model's topology, but only changing values in the model's parameters, and therefore specifying a design solution.
When modifying the parametric model's topology using Modeler, the designer inherently defines its corresponding design space. However, the designer might consider this design space to be too broad for the end-user, and that only a subset of solutions in that design space are suitable for MC. For example, some proportions among control vertices might lead to unwanted designs, or the number of sides in the superellipse should be constrained between two given values. Accordingly, only a subspace of the model's design space can be made available to the end-user. This subset can be specified as a design subspace by imposing restrictions on the values of the variables defining the model.
Instead of making these constraints explicit, the designer can define a design subspace in the Modeler by specifying a set of design solutions, which we refer to as "limit solutions" (Fig. 11). Defining the design subspace takes place after the designer defines the design topology. While specifying the limit solutions, the designer cannot change the topology of the design, for example by adding or removing control vertices (CVs), as this would result in design solutions whose parametric configurations would have different dimensions and, therefore, could not be considered variations of the same parametric model. In the current implementation, we have reduced the subspace definition to three limit solutions due to the interface paradigm selected for Interpolator, explained in the next section. The constraints are implicit in the set of limit solutions, thus facilitating the act of defining the subspace of the customizable collection.
Note that the term subspace is used in a broad sense and as a restriction of the term design space used in Design and MC literature, rather than related to vector subspaces found in Algebra. In Algebra, for a subset of vectors to be considered a subspace of a vector space, it needs to verify all of three conditions: non-emptiness, closure to addition, and closure to scalar multiplication (Blyth and Robertson, Reference Blyth and Robertson2013). We can easily verify that some vectors within a parametric design subspace defined by limit solutions falls out of that space when multiplied by a large enough scalar, violating the condition of closure to scalar multiplication (vector 2*A, Fig. 11). Nevertheless, the broad use of the term is useful for illustrating the definition of customizable designs in the scope of our experiments.
Navigation through interpolation
According to the Merriam-Webster dictionary, "interpolation" is defined as the act of "estimate[ing] values of (data or a function) between two known values."Footnote 6 Interpolator is an implementation of the Navigator component that enables the end-user to generate a new collection by interpolating among pre-designed collection designs, resulting in a new hybrid solution that shares design qualities with the initial ones. The only variables exposed to the user are the interpolation values, which define to which initial design the new solution is more similar. For determining a new design through interpolation, consider two different pre-designed tableware collections, corresponding to design solutions S1 and S2. Each solution corresponds to a parametric configuration C, which contains the same number i of parameters C = [P 1, P 2, · · · , P i]. In order to interpolate solution S′ from S1 and S2, we obtain the corresponding parametric configuration, C′, by calculating a weighted average for each parameter in C1 and C2, such as:
 $${P}^{\prime}_1 = P_11{^\ast}W1 + P_12{^\ast}W2$$
in which W1 and W2 are weights that reflect the aforementioned interpolation values. Considering that design solutions can be represented by solution vectors, we can generalize the previous expression into
 $${S}^{\prime} = S1{^\ast}W1 + S2{^\ast}W2$$
The method for calculating the weights can be related to sliders, graphical user interface (GUI) elements that are typically used to elicit values from the user. Imagine users are asked to place a slider's handle closer to their favorite of two solutions S1 or S2, positioned on the endpoints of a straight line, in order to determine to which solution a hybrid solution S′ should be more similar. Therefore, we can use the inverse distances between the slider's handle and each solution to determine weights for the weighted average. As such, the closer the handle is to a solution, the higher the corresponding weight (Fig. 12).

Fig. 12. Sliders for eliciting values interpolated between two solutions.
Considering W1 as the weight corresponding to S1, whose value equals the distance of the handle to S2, and W2 as the weight corresponding to S2, whose value equals the distance of the handle to S1, we can interpolate the parametric configuration of the new solution using the following weighted average:
 $${S}^{\prime} = S1{^\ast}\left( {\displaystyle{{W1} \over {W1 + W2}}} \right) + S2{^\ast}\left( {\displaystyle{{W2} \over {W1 + W2}}} \right)$$
This approach to interpolation uses barycentric coordinates of the slider handle's position relative to two solutions (Coxeter, Reference Coxeter1989), which can be extended to three tableware solutions. In this case, the calculation of weights for each solution using the distance to the opposite solution is ambiguous, since there are three solutions in total. However, if we lay out each of the three design solutions on each vertex of a triangle, we can use areal coordinates for determining the interpolation weights. In this case, the interpolation weight of each solution (Wi) is proportional to the area of a triangle whose vertices encompass the handle's position, which is a point inside that triangle, and the vertices corresponding to the remaining two solutions (Fig. 13). Since the areas of the three triangles are proportional to the handle's barycentric coordinates, we can extend the previous expression to three solutions like this:
 $${S}^{\prime} = S1{^\ast}\left( {\displaystyle{{W1} \over {W1 + W2 + W3}}} \right) + S2{^\ast}\left( {\displaystyle{{W2} \over {W1 + W2 + W3}}} \right) + S3{^\ast}\left( {\displaystyle{{W3} \over {W1 + W2 + W3}}} \right)$$
Fig. 13. The Interpolator: areal coordinates for eliciting values interpolated among three solutions.
The barycentric interpolation was implemented in the Interpolator prototype, in which three design solutions specified by the user correspond to the vertices of an equilateral triangle. By dragging a black sphere as the interpolation controller, the end-user can determine the interpolation weights for the new design. In Interpolator, the resulting new tableware collection is displayed in a circle around the three pre-existing solutions (Fig. 13).
Barycentric coordinates have been used in interfaces for shape interpolation, namely applied to mesh deformation (Von-Tycowicz et al., Reference Von-Tycowicz, Schulz, Seidel and Hildebrandt2015; Wang et al., Reference Wang, Jacobson, Barbič and Kavan2015), whereas in our prototype it is applied to a parametric model. The weighted average approach can be generalized to a larger number n of solutions:
 $$\displaylines{{S}^{\prime} = S1{^\ast}\left( {\displaystyle{{W1} \over {W1 + W2 + W3}}} \right) + S2{^\ast}\left( {\displaystyle{{W2} \over {W1 + W2 + W3}}} \right) + \cr S3{^\ast}\left( {\displaystyle{{W3} \over {W1 + W2 + W3}}} \right) \Leftrightarrow {S}^{\prime} = \displaystyle{{S1{^\ast}W1 + S2{^\ast}W2 + S3{^\ast}W3} \over {W1 + W2 + W3}} \cr \Leftrightarrow {S}^{\prime} = \displaystyle{{\mathop \sum \nolimits_{i = 1}^n Si{^\ast}Wi} \over {\mathop \sum \nolimits_{i = 1}^n Wi}}} $$
However, determining the interpolation weights of more than three solutions using barycentric coordinates presents some problems in terms of its visual representation. In the previous example, three solutions were placed in the vertices of an equilateral triangle. Analogously, if we were to interpolate among four solutions, we could lay them out as vertices of a square (Fig. 14). However, in this case, the order in which the solutions are placed on the vertices counts. For example, if the handle is placed closer to solution S 2, the solution placed on the opposite vertex (S 3) will have less influence than the solutions placed in adjacent vertices (S 1 and S 4), not because of the user's preference, but because of the layout order. This problem does not exist when using the equilateral triangle, in which each vertex is equidistant from all other vertices. The problem is, however, aggravated as the number of solutions – and, therefore, the sides of the interpolation polygon – increases beyond three.

Fig. 14. Areal coordinates within a square shape.
The order problem can be solved by using additional spatial dimensions. For example, instead of laying out four solutions on a two-dimensional square, we can place them on the vertices of a regular tetrahedron. This platonic solid obeys the same premise as the equilateral triangle, by having each vertex at an equal distance from all other vertices. In fact, barycentric coordinates are originally meant to be used in simplexes (triangles, tetrahedrons, and so on), despite previous efforts to generalize them to polygons and polyhedra (Floater, Reference Floater2015). In the case of the three-dimensional tetrahedron, the interpolation weight for a particular vertex is proportional to a smaller tetrahedron defined by the vertex corresponding to the handle position and the vertices of the tetrahedron's face that is opposite to the initial vertex (Fig. 15). However, having users place a handle in a specific and meaningful position within a three-dimensional tetrahedron using two-dimensional displays like a PC monitor or a mobile device is not an easy task (Geng, Reference Geng2013). Such limitation can be overcome by adopting immersive technologies that provide the user with the perception of 3D space. However, for the purpose of our research, we opted by confining Interpolator to three design solutions on two-dimensional screens.

Fig. 15. Calculating interpolation weights using a tetrahedron.
User experience of Modeler and Interpolator
The implementation of the Interpolator component represents an attempt to simplify the design process using parametric models, comparatively to existing parametric configurators. In order to validate such premise, an experiment was performed to compare Interpolator and Modeler, with the latter being an extension of the parametric configurators mentioned previously. By having users comparing Modeler and Interpolator, we obtained a preliminary assessment of eventual advantages of Interpolator over Modeler and, therefore, over the existing parametric configurator paradigm it represents. Additionally, we could obtain more detailed feedback from users of both applications.
For this purpose, we conducted an experiment with students from an undergraduate course and a graduate course at the School of Visual Arts (SoVA), at the Pennsylvania State University (PSU), USA. The group of participants, considering both courses together, comprised 20 subjects. It is composed of 7 men (35%), 12 women (60%) and a person of undisclosed gender (5%), with ages between 18 and 50 years old, and academic habilitations ranging from high school (40%) to PhD (10%). The experiment was determined by PSU's Office of Research Protections (STUDY00008930) to be exempted from formal Institutional Review Board (IRB) examination.
Each participant used both applications in sequence: first Modeler and then Interpolator. The reason for such order was that subjects were asked to use the latter to interpolate among the three collections they had previously created using the former. The two applications were presented and experimented with different classes, one week apart. Prior to experimenting with each application, participants were shown how to use it and were given some time to practice with it. Then, for each application, participants were given the task of creating at least three different designs in approximately 15 min. The designs created by participants using the Modeler application were encoded in XML files, for later analysis and to be later used as the Interpolator's initial designs.
From the experiments with Modeler, we collected 78 designs, averaging 3.9 designs per user (Fig. 16). The resulting designs were analyzed towards a better understanding of which design aspects users are more interested in. After using each application, participants were asked to answer a survey about their experience. Both surveys consisted of a first set of questions for demographic characterization, followed by questions for assessing the perceived qualities of the application. Analyzing the information collected in the surveys enabled a better understanding of the perceived advantages and disadvantages of the two applications.

Fig. 16. Designs created by students.
Analysis of resulting collections
The experiment allows inferring some conclusions about what design aspects of the collections were more interesting to and valued by users. We analyzed the collections that resulted from the user's experience with Modeler, namely the difference between parametric configurations of such collections and the initial collection, by subtracting the corresponding solution vectors. The resulting variation vectors provide information about the operations performed by users regarding three different aspects of a collection's design:
• the horizontal contour, defined by the superellipse parameters,
• the profile's sectional shape, defined by the position of the handles, and
• the profile's topology, defined by the number of CVs.
A design's contour is determined by the values of six parameters that define its super-elliptical shape. Therefore, it is useful to look at all the parameters, to determine which are more used. In fact, of the 78 analyzed designs, only five (6.41%) did not reveal changes in any of the superellipse parameters. Regarding the designs in which contour was manipulated, we compared the frequencies in which each parameter was modified (Fig. 17) and observed that the most modified parameter is N1, which is associated with the contour's overall curvature. The second most modified parameter was M, which corresponds to the number of sides of the superellipse. This result is surprising, since this was expected to be the most manipulated parameter, as it is the one with the most direct visual correspondence. Another observation was that, despite being the least modified parameter, the frequency of N2 (11.99%) is half of the frequency of N1 (23.97%). This result suggests that all parameters are relatively important for the users. If one parameter had a very low-use frequency relative to other parameters (for instance, 10%), it could be dispensed, thus allowing reducing the number of parameters and therefore the complexity of the design process.

Fig. 17. Relative frequency of superellipse parameter modification.
Let us now look at the design's profile, which is defined by the position of CVs for a number of different parts that constitute the collection types. The shape of each part is defined by at least two and typically three CVs, and the position of each guide is defined by two coordinates. Considering that all collection types have a total of 10 parts, the profile shape is defined by at least 40 parameters, although not all were analyzed. In a preliminary analysis, we identified which parts were more frequently manipulated by the users. Then, we analyzed the variation vector corresponding to each design. The components of each vector were grouped into individual parts, corresponding to the coordinates of its CVs. Then, groups containing only null components, corresponding to non-modified parts, were identified. Note that users had the ability to add or remove CVs from particular parts, thus generating designs that were topologically different from the initial collection, having defining vectors with different numbers of dimensions. Although it does not make sense to subtract vectors with different dimensions, we could identify in which parts such topological differences were introduced.
In all of the 78 analyzed designs, at least one part was modified. We compared the frequencies with which each part was modified, accounting for both parametric and topological variation (Fig. 18). We can observe that the most modified part was the body, in terms of both parametric and topological variation (in 55 and 9 designs, respectively). On the other hand, the least modified part was the border (in only 26 designs). A hasty conclusion would be to attribute such low modification frequency to the fact that the border is only is visible in 5 of the 13 types of tableware included in the collection, namely the plates. However, there does not seem to be a correlation between the visibility frequency of a part in the collection's types (indicated in parenthesis besides each part in Fig. 18) and its modification frequency. For example, the base is present in every type, but it ranks midway in the modification chart. In addition, the handle is one of the least frequent parts to be featured in the collection but ranks second in the modification chart.

Fig. 18. Frequency of part modification.
Looking at the difference between parametric and topological modifications, we can observe that the former greatly outnumbers the latter, the highest percentage of topological variation (18%) being observed in the wall parts. Since one of the current limitations of the Interpolator application is that the interpolated collections are topologically similar, the relatively low frequency of topological modifications might justify suppressing such ability from the Modeler application.
Analysis of surveys
As mentioned in the section "User experience of Modeler and Interpolator," each participant was asked to answer a voluntary survey after using each of the two applications, with a response rate of 85% (17 out of 20 participants). The survey following the experience with Modeler began by asking participants a number of questions towards demographic characterization, followed by questions intended to identify their most frequently performed similar activity for creating shapes, ranging from clay modeling to computer 3D modeling. Then, participants were asked to compare Modeler with their most frequent activity using a 6-point Likert scale and according to four criteria – speed in generating solutions, diversity of generated solutions, precision and fidelity to design intent – as well as a general appreciation. The Modeler survey included the following questions:
• Speed: Using Modeler I was able to create a satisfying design FASTER than performing my frequent activity.
• Diversity: Using Modeler I was able to create MORE DIVERSE designs than performing my frequent activity.
• Precision: Using Modeler I was able to create designs with MORE PRECISION than performing my frequent activity.
• Fidelity: Using Modeler I was able to create a design CLOSER TO WHAT I INTENDED more than performing my frequent activity.
• General appreciation: In general, Modeler is a MORE SUITABLE TOOL for designing tableware collections than my frequent activity.
The general form of the Modeler survey asked users to compare it with a previously identified similar activity. However, since in one of the classes students were taught how to use 3D modeling software Rhinoceros (Rhino), their survey asked them specifically to compare Modeler to Rhino. Figure 19 represents the responses to the Modeler survey in both classes, showing negative responses in grey on the left, which tend to favor Rhino or the most frequent activity, and positive responses in blue on the right, which favor Modeler.

Fig. 19. User evaluation of the Modeler, when compared to a similar activity.
Similarly, the survey following the experience with Interpolator asked participants to compare it with Modeler, using the same criteria. Figure 20 represents the responses to the Interpolator survey in both classes, showing responses that favor Modeler in blue on the left and responses that favor Interpolator in orange on the right. Notice that, in Figure 20, the chart was reversed: positive responses are shown on the left and negative responses are shown on the right. The reason for such reversal is that questions in the Interpolator survey were formulated with Modeler in the beginning. For example, for the speed criterion, the question reads:
• Speed: Using Modeler I was able to create a satisfying design FASTER than using Interpolator.
To summarize the results of the surveys, we scored each criterion according to the participants’ responses. The score is indicated in parentheses after each criterion and results from a pondered sum of the corresponding response values with the following factors (Table 2):
Table 2. Ponderation factors for Likert scale responses

For example, the Speed criterion in the Modeler survey scores +10, according to the following calculation:
 $$\eqalign{\displaylines{\rm Speed} =\;& (-3 \times 1) + (-2 \times 2) + (-1 \times 3) + ( + 1 \times 4) \cr & + ( + 2 \times 5) + ( + 3 \times 2) \cr &\hskip-13.5pt = -3-4-3 + 4 + 10 + 6 = + 10}$$
This method allows us to assess which of the compared items is preferred by the participants by looking at the score's signal. In the Speed example shown above, a score of +10 means that Modeler is considered to be faster than the frequent activity, whereas the frequent activity ranks better in terms of Diversity with a score of −16. In fact, in the Modeler survey, only the Speed criterion favors Modeler, the remaining three criteria favoring the frequent activity. Also, we can make additional conclusions about the participants’ preference by looking at the relative differences among scores. For example, we can assess that Modeler's Precision score (−3), although negative, is small in its absolute value, suggesting that Precision is relatively similar in both conditions. On the other hand, the absolute values of the Diversity (−16) and Fidelity (−13) scores are among the highest in this study and favor the frequent activity. For each survey, we can also perform a sum of the individual scores for the four criteria and compare it with the general appreciation, thus assessing the validity of that last question. For the Modeler survey, the sum of individual scores (+10, −16, −3, −13) equals −22, which is very different from its general appreciation which has a score of +15.

Fig. 20 User evaluation of Interpolator, when compared to Modeler.
Let us now look at the results of the Interpolator survey. The individual criteria scores are (+9, −7, −10, −4) that add up to −12. While also conveying a result that diverges from the General Appreciation score (+4), the gap between the two is smaller than in the Modeler survey. When compared to Modeler, and similar to it, Interpolator scores positively in the Speed criterion (+9), while scoring negatively in all other criteria. In Interpolator, Precision is the criterion that ranks worst, followed by Diversity and Fidelity.
Discussion of experiments
The discrepancy between the sum of individual scores and the general appreciation scores might be puzzling at a first glance. In fact, despite neither having performed well in the individual criteria, both applications are generally considered better than their predecessors (in the sequence "frequent activity" > "Modeler" > "Interpolator"). This might suggest that the surveys neglected relevant criteria for evaluating the applications, such as factors related to user satisfaction, particularly in MC. One factor that has not been assessed as an individual score is the sense of novelty felt by participants, since some of them have possibly experienced an MC process for the first time. Although novelty is discouraged as a driver for an MC experience (Piller, Reference Piller2004), it may be partially responsible for the contradictory positive overall feedback in our experiment. Another unaccounted for factor that might have influenced users is the so-called I designed it myself effect, which "is mediated by feelings of accomplishment and moderated by the outcome of the process as well as the individual's perceived contribution to the self-design process" (Franke et al., Reference Franke, Schreier and Kaiser2009, p. 125). In particular, such effect is expected to be maximized within a creative community such as art and design students.
Despite the discrepancy between individual and overall scores, the survey results provide important clues about how to proceed in developing the Modeler and Interpolator tools. We can also extract more detailed clues from the comments provided by participants at the end of the surveys. In Modeler, its lower scores in Diversity (−16) and Fidelity (−13) call for improving the tool's versatility. One recurrent suggestion was the ability to switch between editing the whole collection or individual types, which might, in fact, improve its versatility. On the other hand, Interpolator is most criticized by its lack of Precision (−10). Although the final comments do not address such criticism directly, they transmit the feeling of dissatisfaction regarding some bugs, for example the fact that, in the current Interpolator prototype, users need to know in advance about topological similarity of collections in order to use them in Interpolator. We can interpret the perceived lack of Precision as resulting from such situations, which will be addressed in future iterations of Interpolator. Another improvement that might respond to Interpolator's perceived lack of Diversity (−7) is to enable interpolation among topologically different designs, which will be considered in future work.
On a more general note, and as mentioned in the introduction, the main contribution of our approach is to enable designers to manipulate the customization design space beyond the deployment of the MC system, as an improvement to existing parametric configurators analyzed in the section "Related work."
In fact, such configurators tend to be based on a fairly complex parametric design model in order to ensure a certain amount of diversity, so that the customization experience is appealing to potential customers. Also, the GUI in such configurators features a number of interaction elements that is proportional to the complexity of the subjacent design model. Although such complexity might be considered interesting for more design-oriented users, these represent only a subset of potential customers in the market.
In comparison, interaction in the Interpolator is reduced to a single interaction element, making it simpler and therefore expectedly faster than in the analyzed configurators. In fact, from the survey results, we can assess that the main perceived advantage of both Modeler and Interpolator is speed. This is particularly important for the end-user, who is less experienced in designing and consequently more likely to detract from the MC experience when confronted with a longer design process. By greatly simplifying the customization process, the Interpolator gains an advantage against analyzed configurators.
Naturally, the simplicity of the Interpolator's interaction does not come for free, depending on the previous downscaling of customization space by designers using the Modeler. However, given their expertise, designers are likely more interested in fine-tuning the spectrum of possible designs, even at the expense of more time. Therefore, the conceptual separation of a configurator into two separate applications – in our case the Modeler and the Interpolator – enable different types of users to effectively manipulate parametric design and rule-based design models.
Consequently, the overall positive reaction of the experiment's subjects and some of the quantified experimental results suggest that our tools adequately address some of the shortcomings of current MC configurators.
Conclusions
In this paper, we presented the implementation and testing of Interpolator, an application developed with the goal of simplifying the design process for non-designers in the context of MC. Such approach allows end-users to create a new design by interpolating among three pre-existing designs. Users compared Interpolator with Modeler, a more complex tool for designing tableware collections, in order to gather information regarding the use of different features and to assess strengths and weaknesses in both applications.
The conducted experiments provided valuable information about the users’ perceptions of both applications, which will drive its future iterations. However, they also exposed shortcomings in the testing process itself. For example, alternatively to ask users to explicitly compare among different tools, future experiments should have users evaluating each tool individually. Also, in order to establish more solid benchmarks, and since it enables both topological and parametric variations of designs, Modeler should be explicitly compared with specific parametric configurators, in a task in which its use is constrained to parametric variations, or compared with a particular CAD tool, in a task in which its use is broadened to topological variations.
Future developments of the applications within the scope of Mass Customization of Ceramic Tableware should take into consideration the insights provided by the experiments documented in this paper. By continuing this research, we expect to contribute to the advancement of design systems in general and MC configurators in particular.
Acknowledgements
The authors thank the students for providing the feedback needed for the evaluation of the Modeler and Interpolator applications, as well as Tom Lauerman for facilitating such experiments in his classes.
Financial support
This research was financially supported by Fundação para a Ciência e a Tecnologia (PhD grant no. SFRH/BD/88040/2012), by the Stuckeman Center for Design Computing, and by the Stuckeman School of Architecture and Landscape Architecture and the School of Visual Arts at Penn State.
Eduardo Castro e Costa is a researcher in Computational Design, whose interests lie in the intersection of Computation and creative domains like Architecture and Design, including (but not limited to) generative design systems, from parametric and procedural modelling to shape grammars, as well as mass customization, digital fabrication, user interfaces, virtual reality and 3D modelling, with a special interest in programming and scripting for developing innovative design tools. Eduardo holds a PhD in Architecture from the Pennsylvania State University, on the option of Digital Design, focusing on how to enable non-experts to design products within the scope of mass customization.
Joaquim Jorge received his PhD from Rensselaer Polytechnic Institute, coordinates the VIMMI research group at INESC-ID and is Full Professor at Técnico, Universidade de Lisboa. He is Editor-in-Chief of the Computers & Graphics Journal (Elsevier), Fellow of the Eurographics Association, Distinguished Member and Speaker of the ACM and Senior Member of IEEE, serves on the ACM Europe Council and Chairs the ACM/SIGGGRAPH Specialized Conferences Committee. He organized 35+ international scientific events, was Eurographics 2016 papers co-chair, served on 200+ program committees and (co)authored 300+ publications in international peer-refereed venues. His research interests include multimodal user interfaces, 3D Visualization and modeling.
Aaron D. Knochel is Assistant Professor of Art Education and an affiliated faculty at the Art & Design Research Incubator (ADRI) at The Pennsylvania State University. He completed his doctorate in Art Education at the Ohio State University in 2011 focused on critical media literacy, software studies and art education. He has worked in a variety of visual arts learning spaces including schools, museums, and community arts programs both domestically and internationally. Generally, he tries to live up to his @artisteducator twitter bio: artist-teacher-visual culture researcher-digital media flaneur-novice hacker and pixel stacker.
José P. Duarte holds a professional degree in Architecture from the Technical University of Lisbon, Portugal, a Master’s degree in Design Methods, and a PhD in Design and Computation from MIT, USA. Currently, he is Chair in Design Innovation and Director of the Stuckeman Center for Design Computing at Penn State University, USA. He was Dean and Professor at the Faculty of Architecture, University of Lisbon, and President of eCAADe– education and research in computer-aided architectural design in Europe. The main focus of his research is the use of new technologies as conceptual tools in architectural, urban, and product design.


